
An Approach to Building a Smart Decision-Making Process in a Manufacturing Organization in Terms of Profitability †

Abstract
1. Introduction
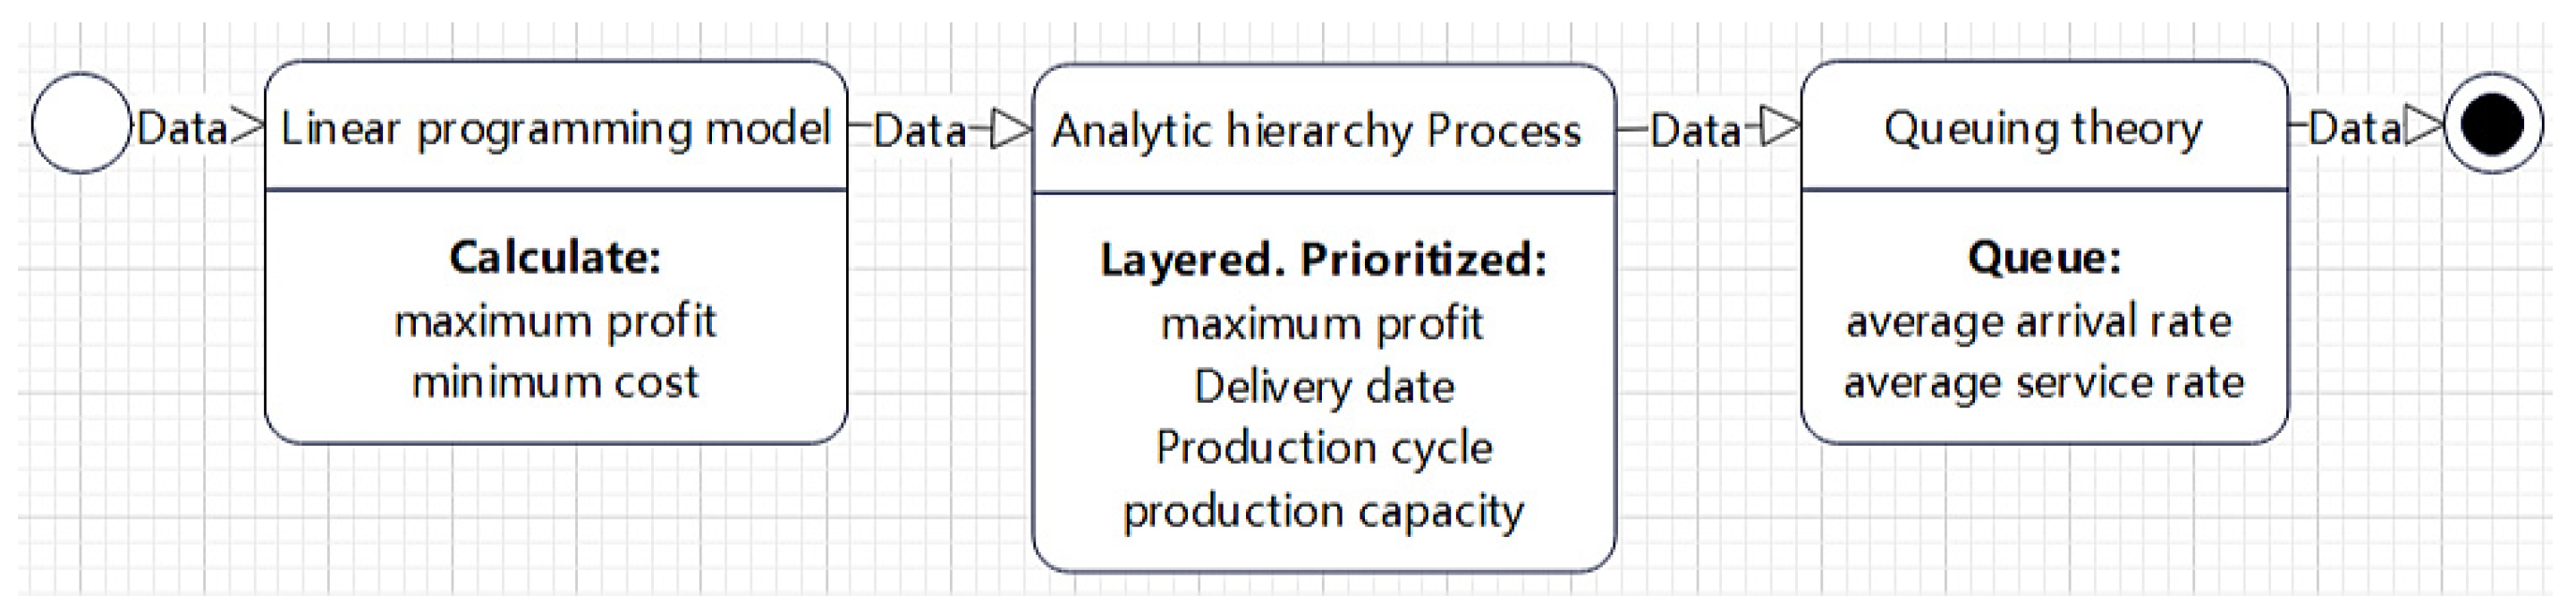
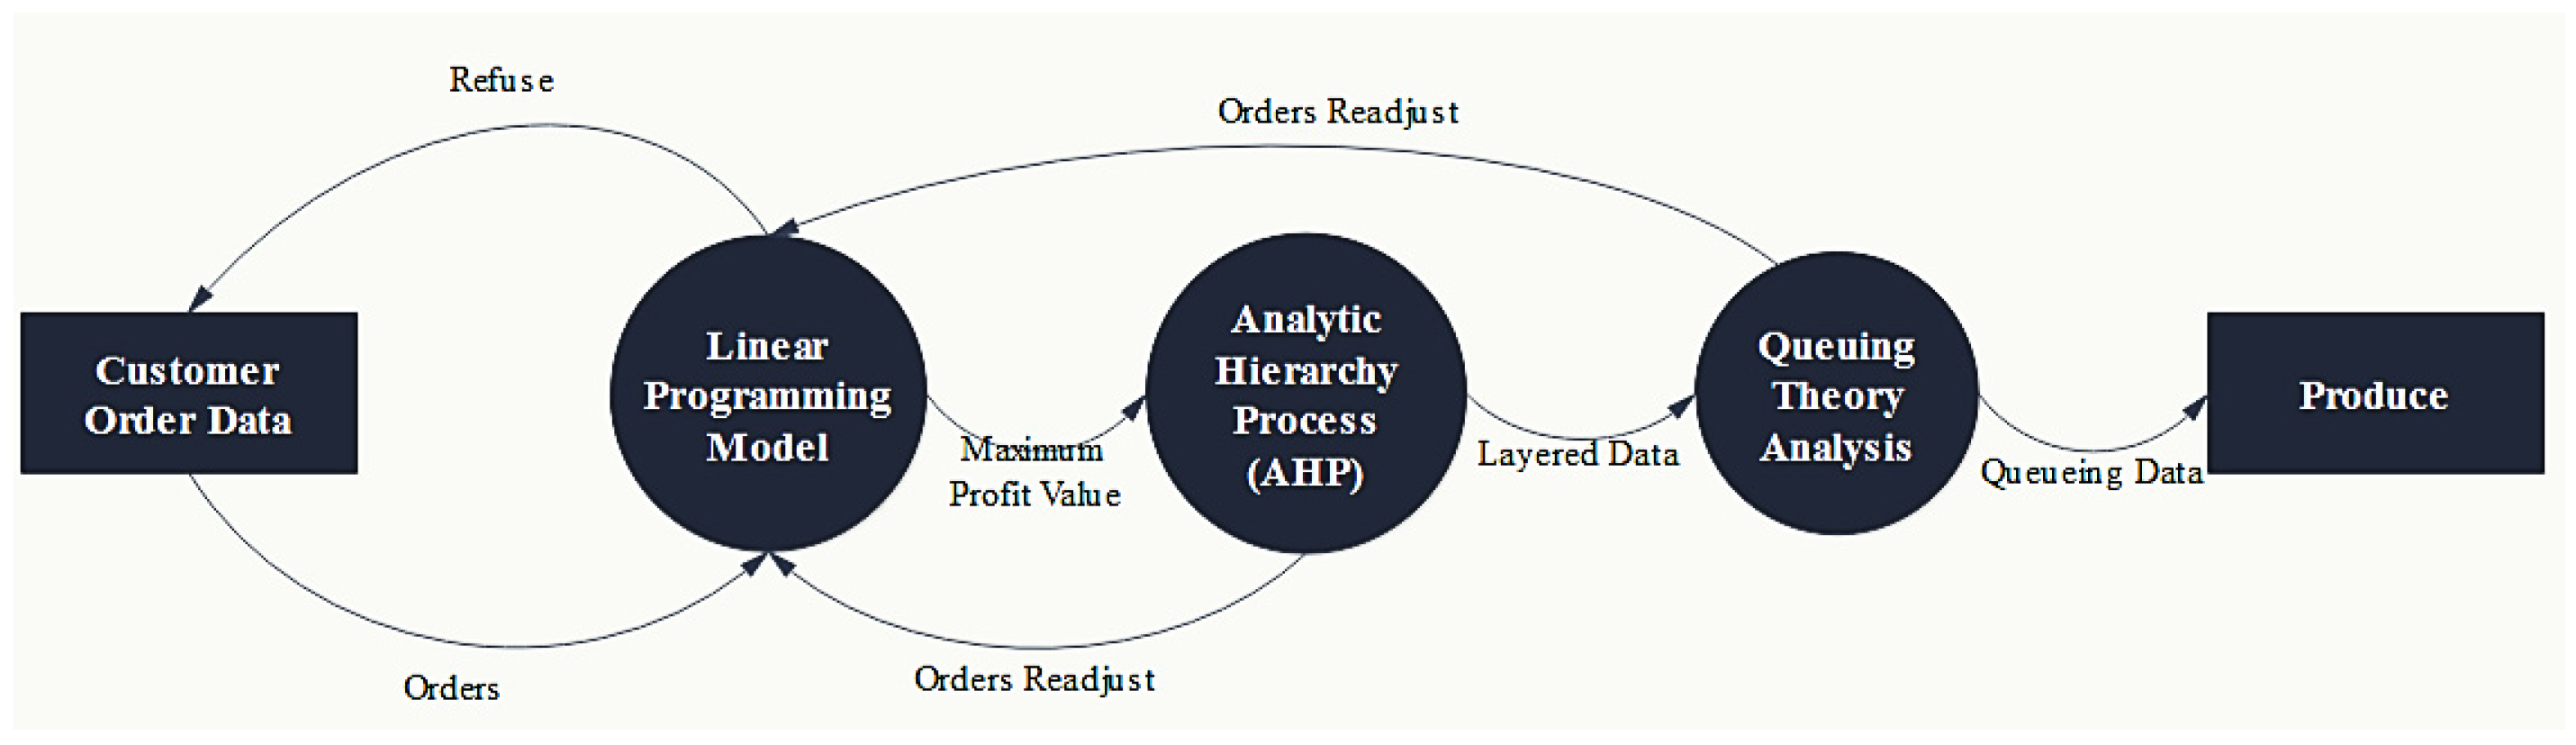
2. Concept of Proposed Approach in Terms of Profitability
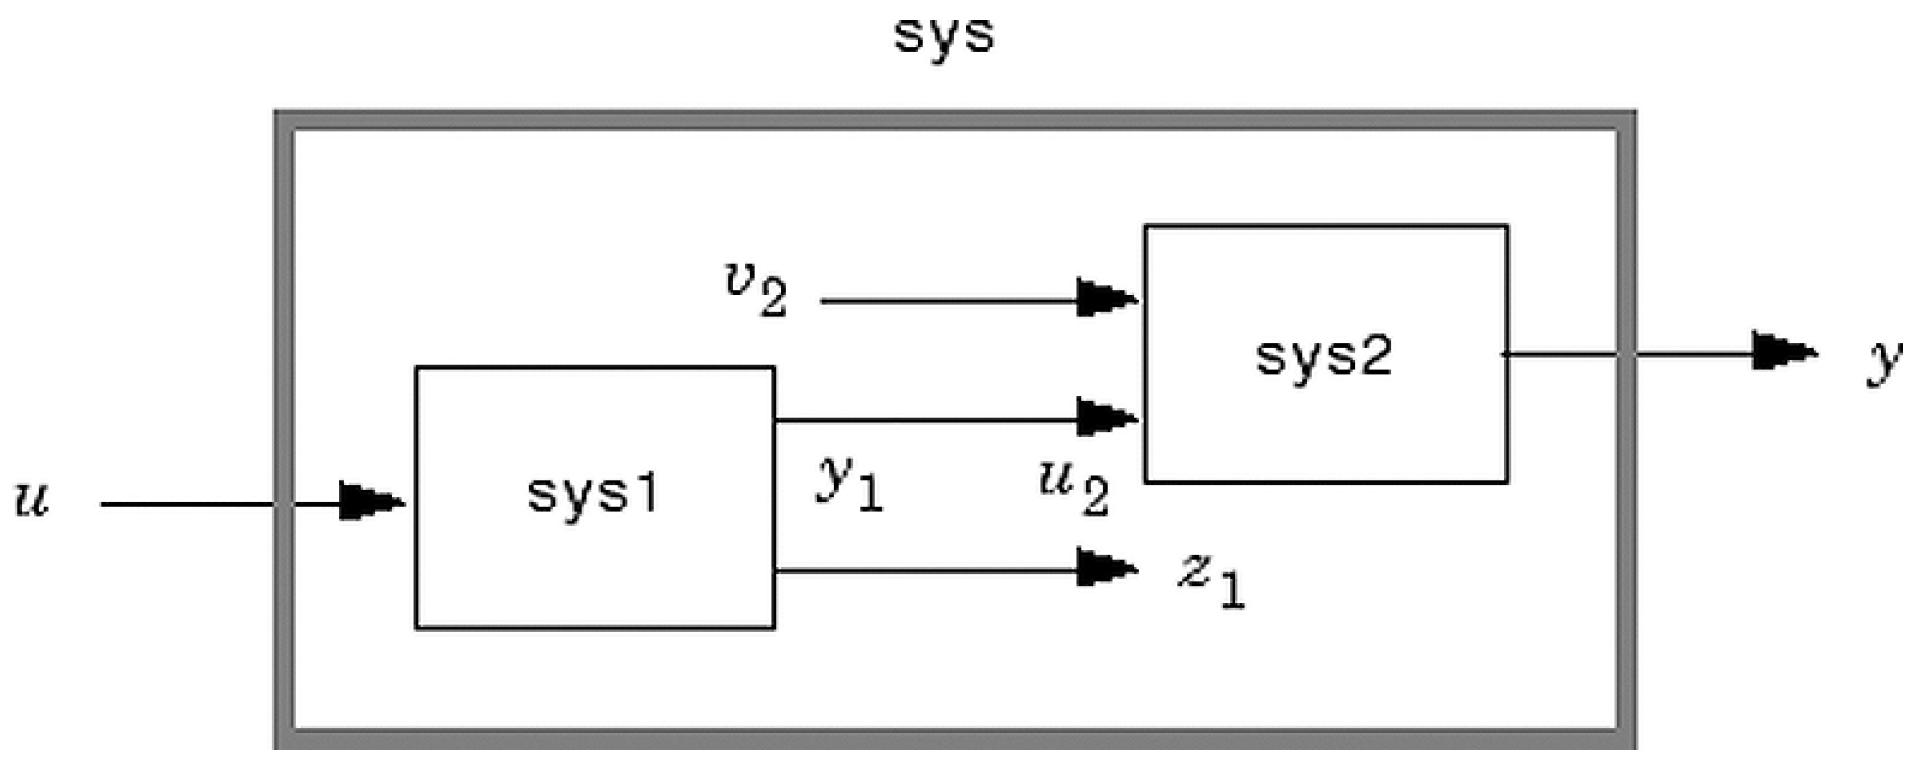
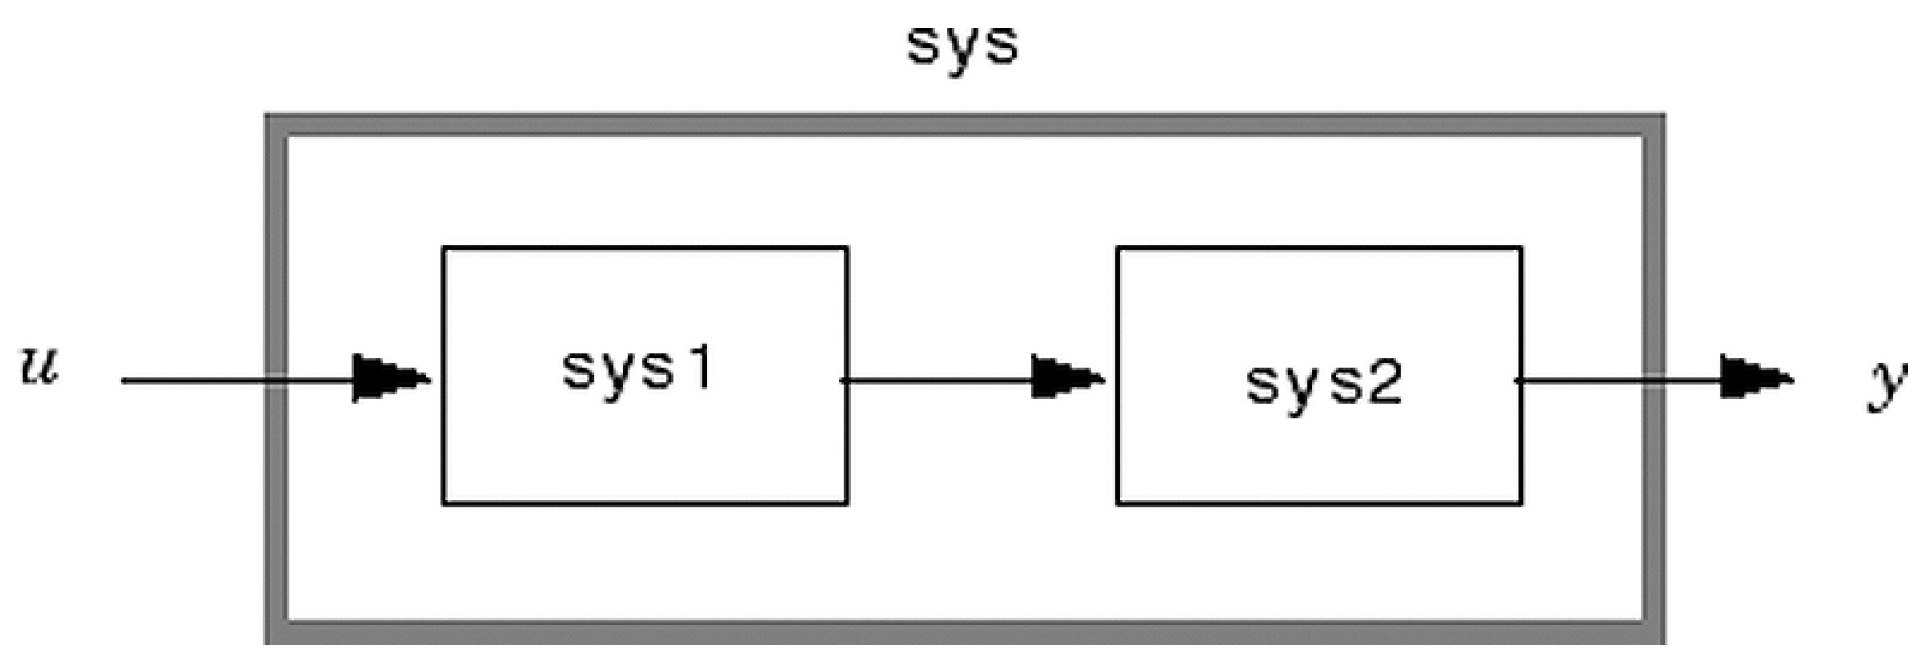
- series
- sys = series(sys1,sys2)
- sys = series(sys1,sys2,outputs1,inputs2)
2.1. Step 1—Linear Programming Model
- clc
- clear all
- c = [c1 c2 c3 c4 …… cn − 1 cn];
- a = [a11a12a13….a1n; a21a22a23 …. a2n; ……; am1 am2 am3 …. amn];
- b = [b1; b2; b3; ……; bm];
- aeq = [0];
- beq = [0];
- lb = [0;0;0];
- ub = [inf;inf;inf];
- [x,fval] = linprog(-c,a,b,aeq,beq,lb,ub);
- best = c*x%;
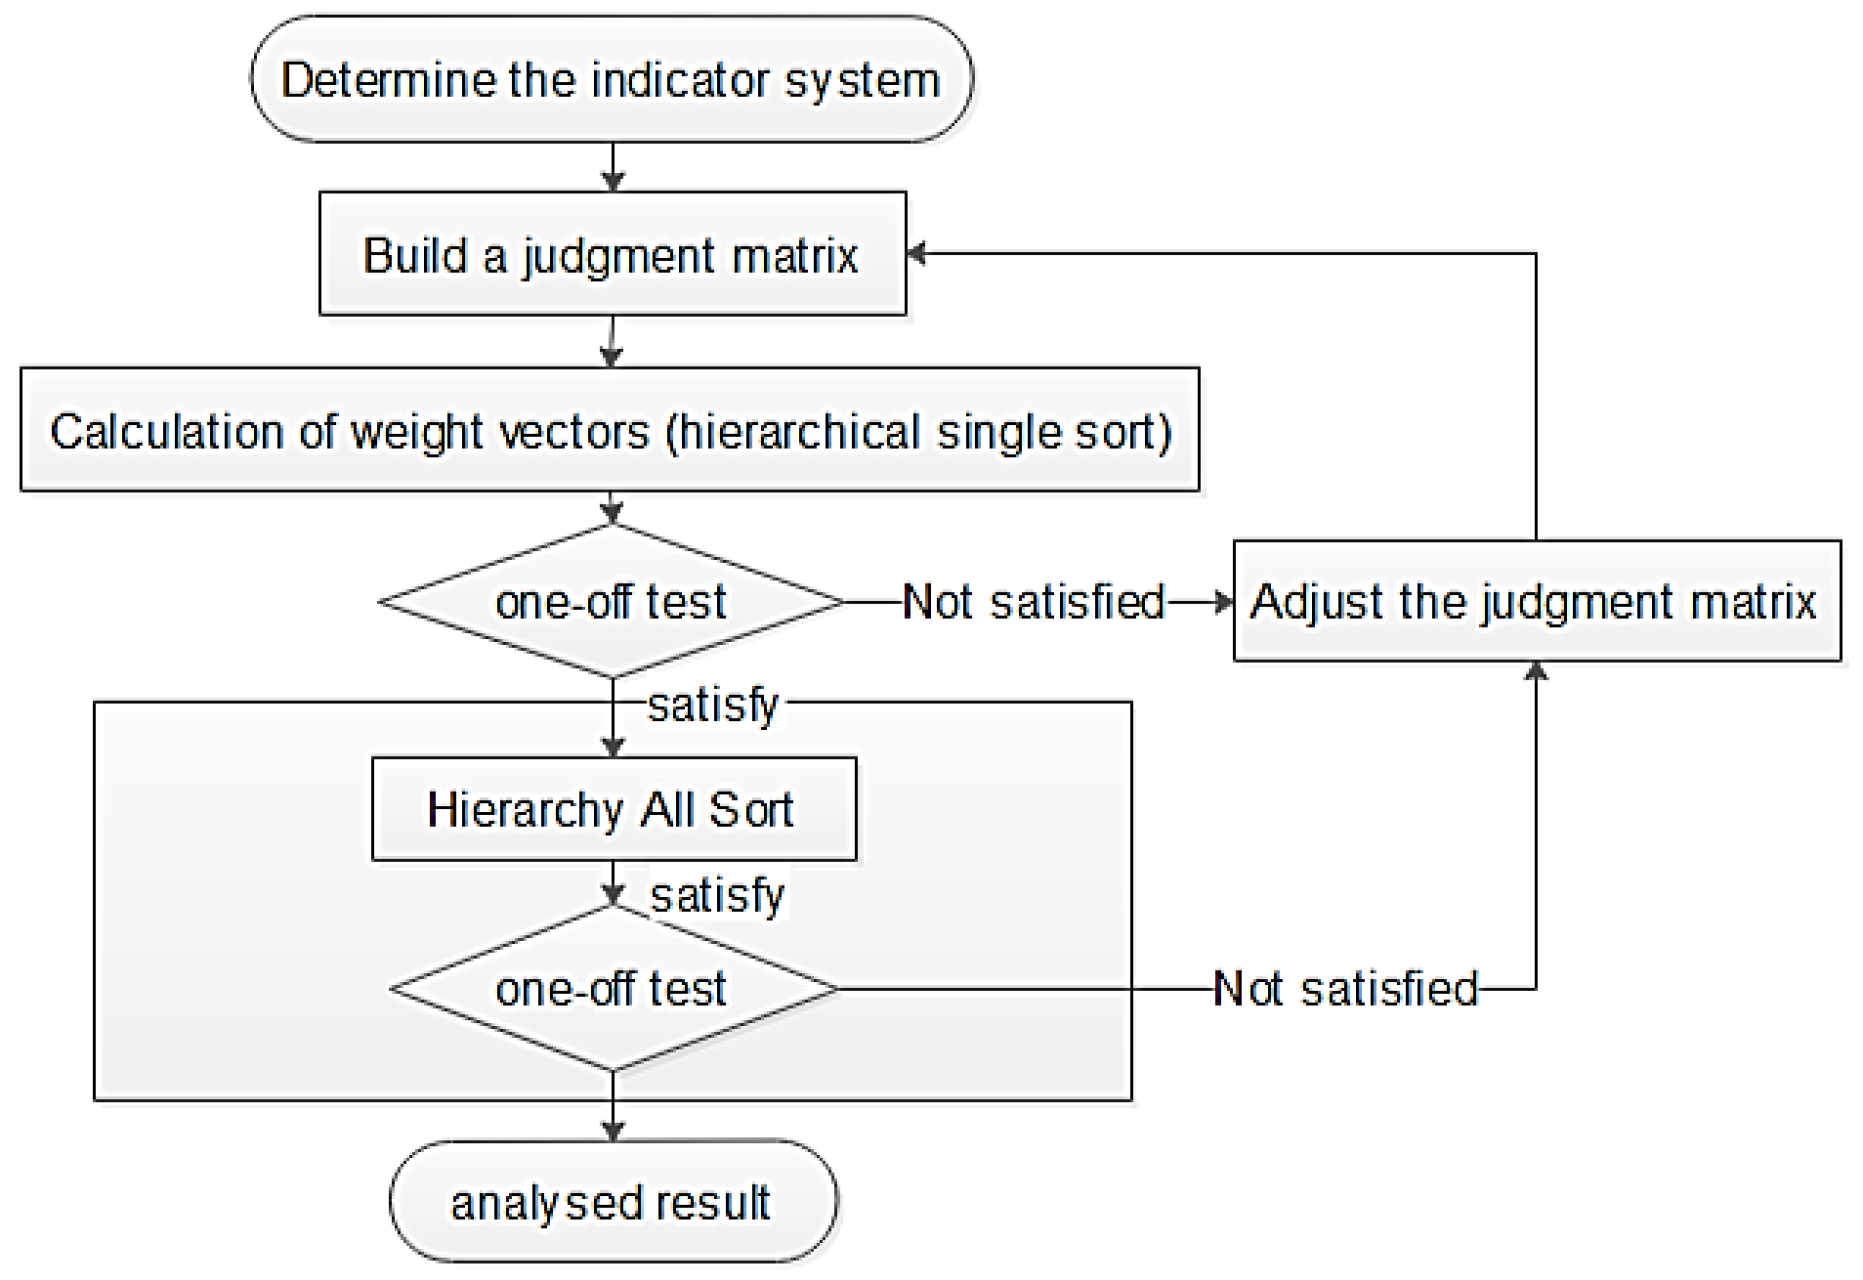
2.2. Step 2—Analytic Hierarchy Process (AHP)
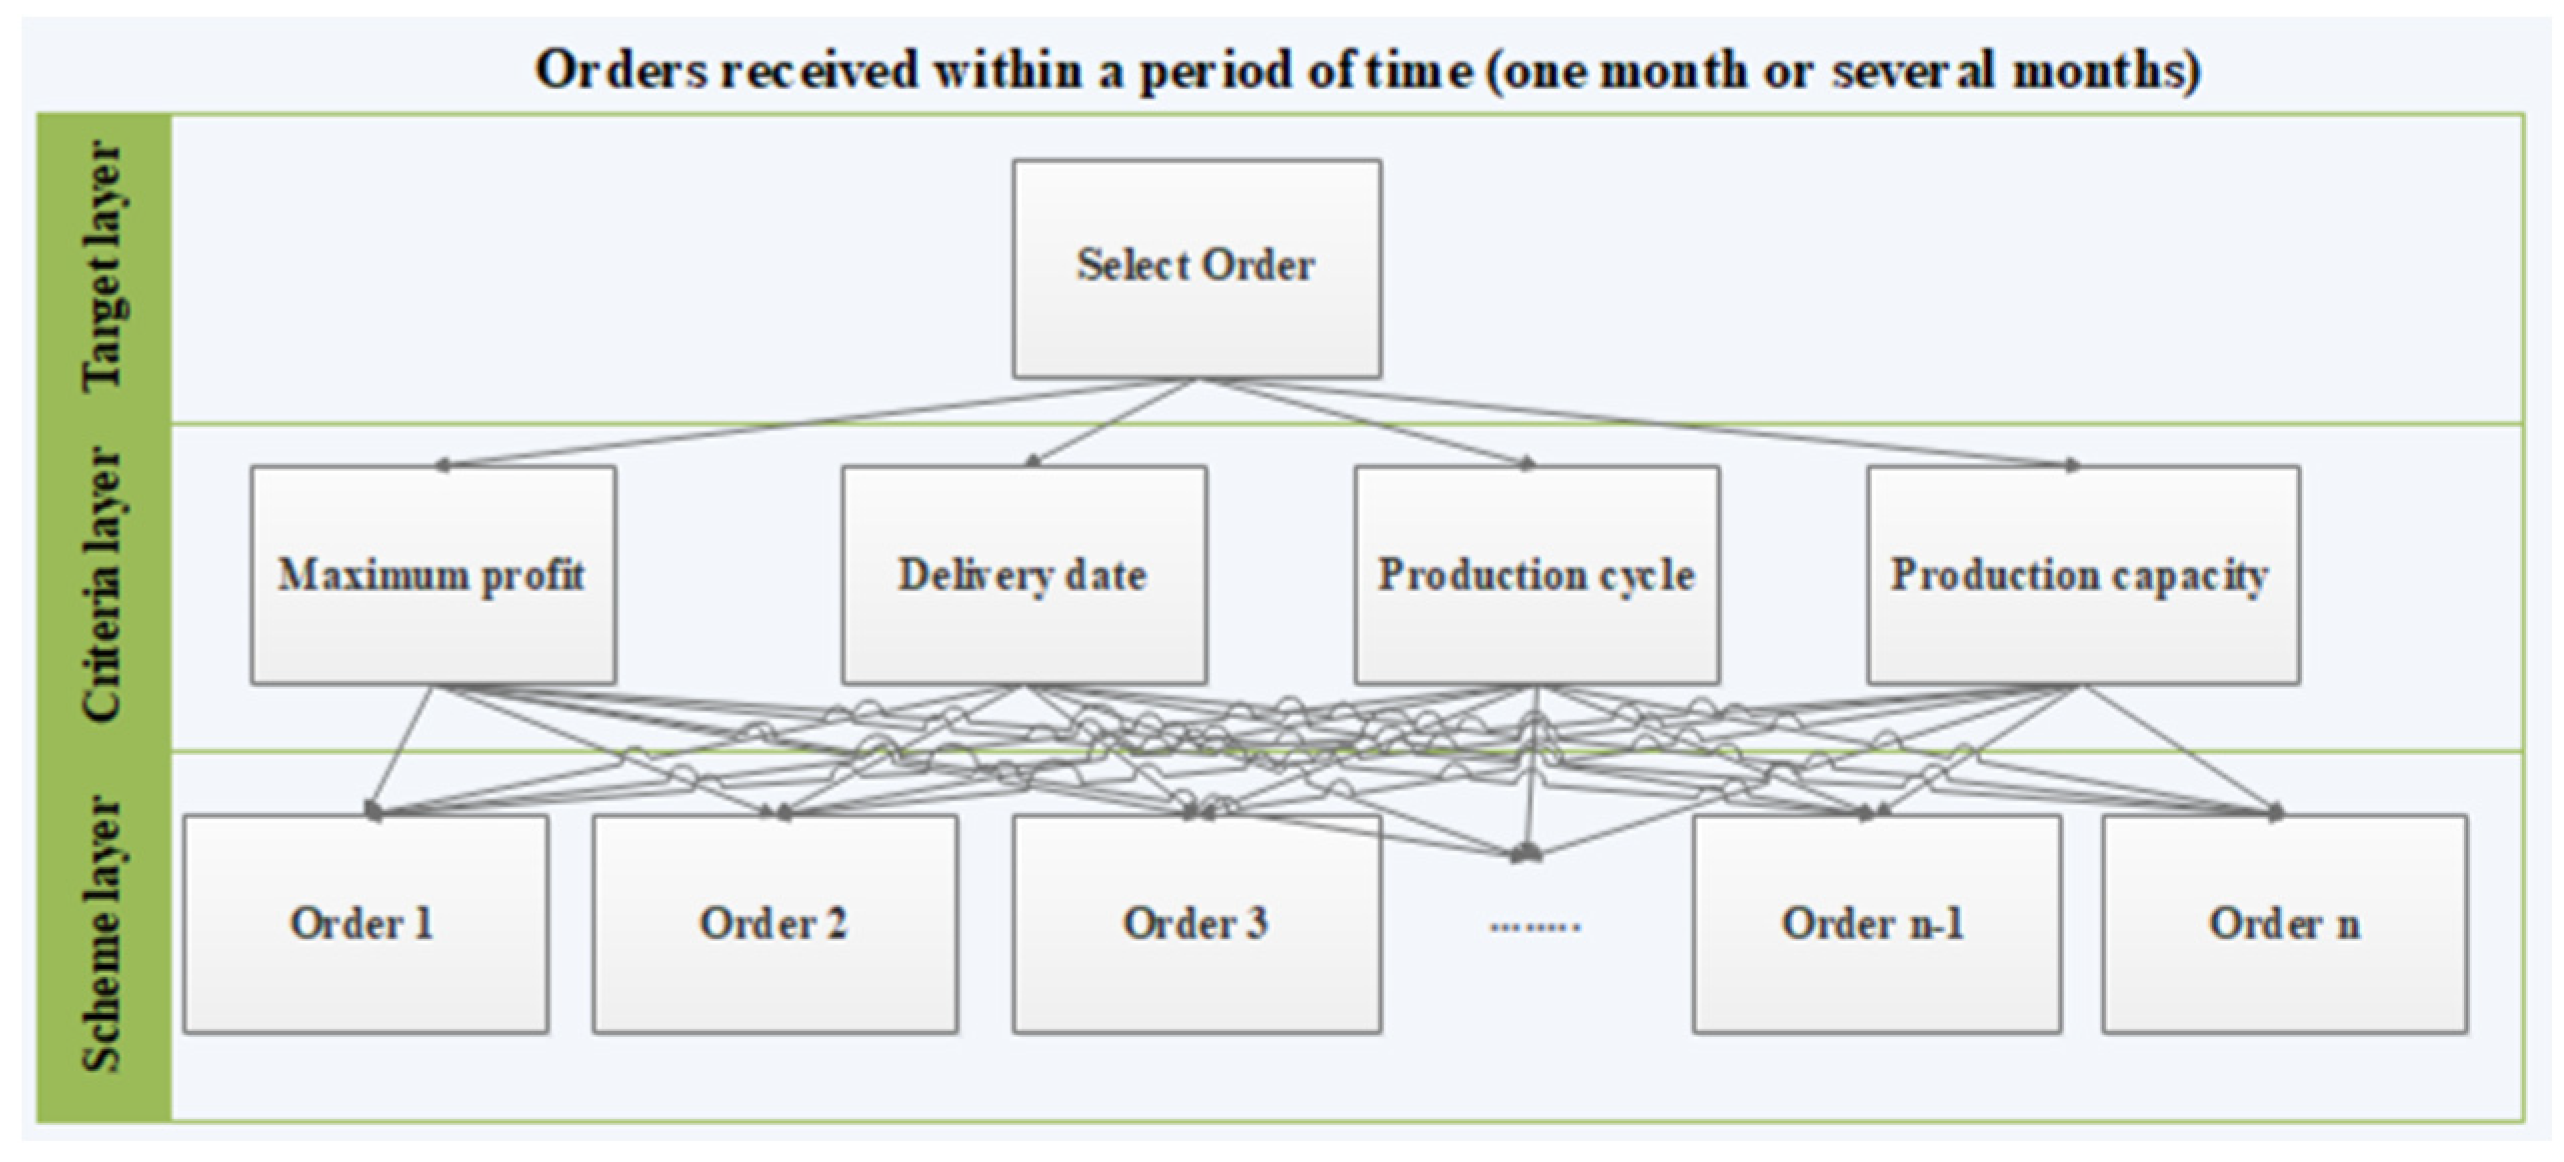
2.2.1. Construct the Hierarchical Structure Model
2.2.2. Construct the Judgment Matrix
2.2.3. Enter the Judgment Matrix A and Find the Weights and MATLAB Code
- Sum_A =sum(A)
- [n,n] =size(A)
- SUM_A = repmat(Sum_A,n,1)
- Stand_A = A./SUM_A
- sum(Stand_A,2)
- disp(sum(Stand_A,2)/n)
2.2.4. Consistency Detection
- If CR < 0.10, the consistency of the judgment matrix is acceptable;
- If CR ≥ 0.10, the judgment matrix needs to be modified in step 2.
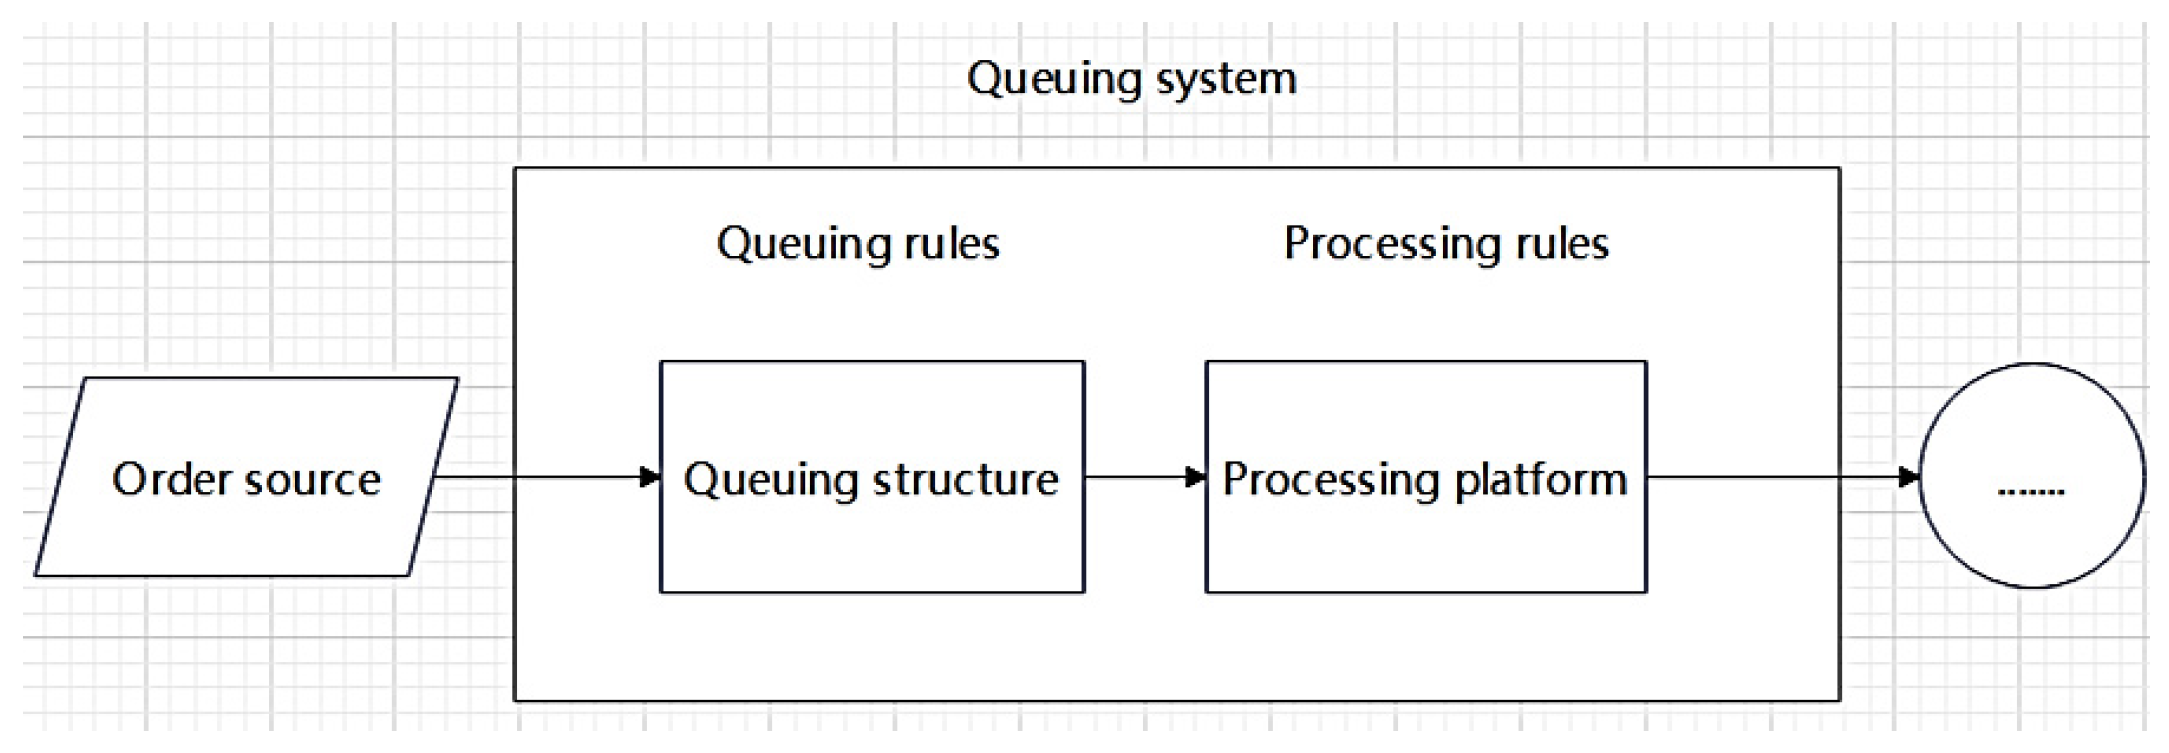
2.3. Step 3—Queuing Theory Calculation
2.3.1. Queuing Process
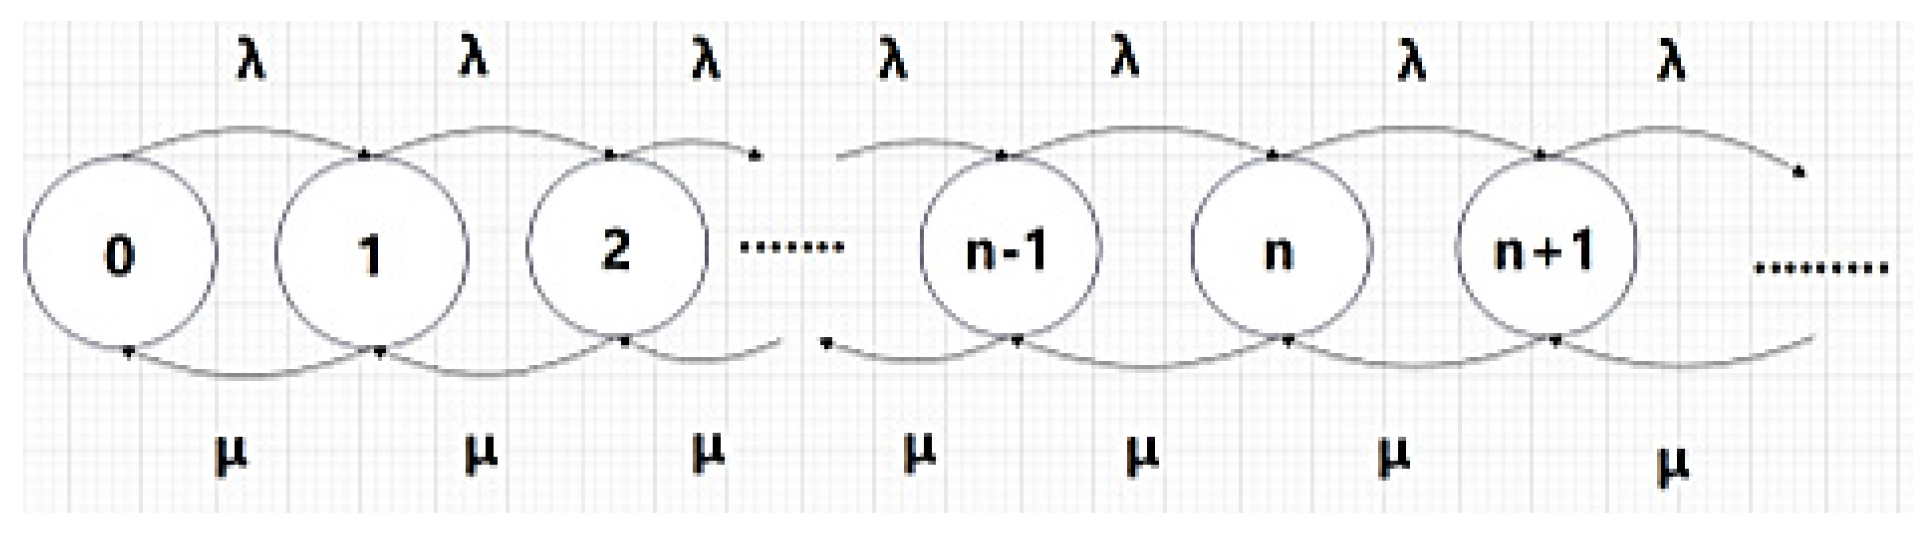
2.3.2. Derive Model M/M/S/∞/∞/PR from Model M/M/1/∞/∞/PR
- Mode l: M/M/1/∞/∞/PR
- The first M shows that the arrival process of the order workpiece follows Poisson flow or that the arrival interval of the order workpiece follows a negative exponential distribution;
- The second M means that the service time is subject to negative exponential distribution;
- 1 indicates 1 workbench;
- The first ∞ means that the system service capacity is unlimited;
- The second ∞ means that the source of the order artifact is unlimited;
- PR stands for priority service;
- Assumption: The average workpiece arrival rate per unit time is λ
- The average service rate of the workbench per unit time is μ
- 0 means that there are 0 workpieces in the system with, a probability of P0;
- 1 means that there is 1 workpiece in the system, with a probability of P1;
- n means that there are n workpieces in the system, with a probability of Pn.
- Model 2: M/M/S/∞/∞/PR
- s = n;
- mu = x;
- lambda = y;
- ro = lambda/mu;
- ros = ro/s;
- sum1 = 0;
- for i = 0:(s − 1)
- sum1 = sum1 + ro.^i/factorial(i);
- end
- sum2 = ro.^s/factorial(s)/(1 − ros);
- p0 = 1/(sum1+sum2);
- p = ro.^s.*p0/factorial(s)/(1 − ros);
- Lq = p.*ros/(1 − ros);
- L = Lq + ro;
- W = L/lambda;
- Wq = Lq/lambda;
3. Conclusions
Author Contributions
Funding
Institutional Review Board Statement
Informed Consent Statement
Data Availability Statement
Conflicts of Interest
References
- Elbasheer, M.; Longo, F.; Nicoletti, L.; Padovano, A.; Solina, V.; Vetrano, M. Applications of ML/AI for Decision-Intensive Tasks in Production Planning and Contro. Procedia Comput. Sci. 2022, 200, 1903–1912. [Google Scholar] [CrossRef]
- Gao, Q.; Cheng, C.; Sun, G. Big data application, factor allocation, and green innovation. Chin. Manuf. Enterp. 2023, 192, 122567. [Google Scholar]
- Long, G.; Lin, B.; Cai, H.; Nong, G. Developing an Artificial Intelligence (AI) Management System to Improve Product Quality and Production Efficiency. Furnit. Manuf. Procedia Comput. Sci. 2020, 166, 486–490. [Google Scholar] [CrossRef]
- Vitliemov, P.; Stoycheva, B. Technology solutions and challenges for innovations that will improve our lives in pandemic crisis. AIP Conf. Proc. 2022, 2449, 070007. [Google Scholar] [CrossRef]
- Azeem, M.; Haleem, A.; Bahl, S.; Javaid, M.; Suman, R.; Nandan, D. Big data applications to take up major challenges across manufacturing industries: A brief review. Mater. Today: Proc. 2020, 49, 339–348. [Google Scholar] [CrossRef]
- Li, C.; Chen, Y.; Chang, Y. A review of industrial big data for decision making in intelligent manufacturing, Engineering Science and Technology. Int. J. 2022, 29, 101021. [Google Scholar]
- Corallo, A.; Crespino, A.M.; Lazoi, M.; Lezzi, M. Model-based Big Data Analytics-as-a-Service framework in smart manufacturing: A case study. Robot. Comput.-Integr. Manuf. 2022, 76, 102331. [Google Scholar] [CrossRef]
- Mei, L.; Yue, L.; Ge, S. Joint decision-making of virtual module formation and scheduling considering queuing time. Data Sci. Manag. 2023, 6, 134–143. [Google Scholar] [CrossRef]
- Seenivasan, M.; Senthilkumar, R.; Subasri, K.S. M/M/2 heterogeneous queueing system having unreliable server with catastrophes and restoration. Mater. Today: Proc. 2022, 51, 2332–2338. [Google Scholar] [CrossRef]
- Wang, Y.; Xia, T.; Xu, X.; Ding, Y.; Zheng, M.; Pan, E.; Xi, L. Joint optimization of flexible job shop scheduling and preventive maintenance under high-frequency production switching. Int. J. Prod. Econ. 2024, 269, 109163. [Google Scholar] [CrossRef]
- Zhou, B.; Bao, J.; Li, J.; Lu, Y.; Liu, T.; Zhang, Q. A novel knowledge graph-based optimization approach for resource allocation in discrete manufacturing workshops. Robot. Comput. -Integr. Manuf. 2021, 71, 102160. [Google Scholar] [CrossRef]
- Hanukov, G. A queueing-inventory system in which customers can orbit during the service. IFAC Pap. 2022, 55, 619–624. [Google Scholar] [CrossRef]
- Vafaei, N.; Delgado-Gomes, V.; Agostinho, C.; Jardim, R. Analysis of Data Normalization in Decision Making Process for ICU’s Patients During the Pandemic. Procedia Comput. Sci. 2022, 214, 809–816. [Google Scholar] [CrossRef]

| Scale | Implication |
|---|---|
| 1 | Indicates that two elements are of equal importance compared to each other |
| 3 | Indicates that the former is slightly more important than the latter |
| 5 | Indicates that the former is significantly more important than the latter |
| 7 | Indicates that the former is more important than the latter |
| 9 | Indicates that the former is the most important when comparing two elements |
| 2, 4, 6, 8 | Represents the intermediate value of the above adjacent judgments |
| The inverse of 1–9 | Indicates the importance of the exchange order comparison of the corresponding two factors |
| Maximum Profit A | Production Cycle B | Delivery Date C | Production Capacity D | |
|---|---|---|---|---|
| Maximum profit A | 1 | 9 | 5 | 1/7 |
| Production cycle B | 1/9 | 1 | 1/3 | 1/6 |
| Delivery date C | 1/5 | 3 | 1 | 1/8 |
| Production capacity D | 7 | 6 | 8 | 1 |
Disclaimer/Publisher’s Note: The statements, opinions and data contained in all publications are solely those of the individual author(s) and contributor(s) and not of MDPI and/or the editor(s). MDPI and/or the editor(s) disclaim responsibility for any injury to people or property resulting from any ideas, methods, instructions or products referred to in the content. |
© 2024 by the authors. Licensee MDPI, Basel, Switzerland. This article is an open access article distributed under the terms and conditions of the Creative Commons Attribution (CC BY) license (https://creativecommons.org/licenses/by/4.0/).
Share and Cite
Bao, G.; Vitliemov, P. An Approach to Building a Smart Decision-Making Process in a Manufacturing Organization in Terms of Profitability. Eng. Proc. 2024, 70, 35. https://doi.org/10.3390/engproc2024070035
Bao G, Vitliemov P. An Approach to Building a Smart Decision-Making Process in a Manufacturing Organization in Terms of Profitability. Engineering Proceedings. 2024; 70(1):35. https://doi.org/10.3390/engproc2024070035
Chicago/Turabian StyleBao, Gang, and Pavel Vitliemov. 2024. "An Approach to Building a Smart Decision-Making Process in a Manufacturing Organization in Terms of Profitability" Engineering Proceedings 70, no. 1: 35. https://doi.org/10.3390/engproc2024070035
APA StyleBao, G., & Vitliemov, P. (2024). An Approach to Building a Smart Decision-Making Process in a Manufacturing Organization in Terms of Profitability. Engineering Proceedings, 70(1), 35. https://doi.org/10.3390/engproc2024070035