Proceeding Paper

Bitcoin Cycle through Markov Regime-Switching Model †

Department of Insurance and Finance Management, Chaoyang University of Technology, Taichung 413310, Taiwan
*
Author to whom correspondence should be addressed.
Presented at the 2024 IEEE 4th International Conference on Electronic Communications, Internet of Things and Big Data, Taipei, Taiwan, 19–21 April 2024.
Eng. Proc. 2024, 74(1), 12; https://doi.org/10.3390/engproc2024074012
Published: 27 August 2024

Abstract

:
We analyzed Bitcoin’s cyclical patterns used by the Markov regime-switching model and explored the impacts of inflation and the US Dollar Index on Bitcoin’s cyclicality. The results showed Bitcoin’s cyclical pattern, the effects of the US dollar index and VIX on Bitcoin’s cyclical pattern, and how the US dollar index and VIX affect BTC’s structural changes in Bitcoin.

1. Introduction

Bitcoin is a new digital money and payment tool that allows traders to transact without the intervention of financial intermediaries. Due to the accelerated application and development of blockchain, the price of Bitcoin hit an all-time high of USD 66,974 in November 2021. However, the price of Bitcoin declined by 50% three months later. This exemplifies the high volatility of Bitcoin, which is affected by its unusually high returns. This volatility engendered the Bitcoin bubble from 2017 to 2018 and early 2021. In November 2018, Bitcoin’s price fell by 54% in one month. Furthermore, Bitcoin’s price fell by 14% in three weeks in January 2021 [1,2]. At the end of 2022, Bitcoin prices crashed due to the collapse of Terra/Luna and the bankruptcy of FTX. These events highlight the importance of cryptocurrency options as a dependable means of hedging price risks.
Since Bitcoin is a virtual currency without intrinsic value, many studies have been conducted to find out the factors that affect the price of Bitcoin. Choi and Shin [3] provide systematic evidence demonstrating the relationship between inflation, uncertainty, and Bitcoin and gold prices. In the study, factors such as the S&P 500, VIX, and policy uncertainty were taken into account. The VIX and the dollar affect the price of Bitcoin [4,5,6]. VIX is regarded as a factor affecting the Bitcoin price mainly because of Bitcoin’s hedging effect [7]. Most studies regard the US dollar as a factor in Bitcoin prices, mainly because of the competition between physical and virtual currency [6].
Figure 1 illustrates that the US dollar index rises with interest rates. Figure 2 demonstrates that since 2021, Bitcoin’s price has fallen, whereas the US dollar index has risen. Such changes have influenced the competition between cryptocurrencies and traditional currencies in the monetary policy of the US Federal Reserve. During periods of high inflation, demand increases for immediate payments, and consumers may prefer traditional currencies over cryptocurrencies, thereby strengthening the US dollar. Additionally, rising interest rates favor the US dollar; one disadvantage of Bitcoin is that it does not generate interest income.
All economic activities undergo periods of recession, depression, recovery, and prosperity, resulting in a cyclical phenomenon [8]. Although Bitcoin has no intrinsic value, investors’ behavior patterns cause Bitcoin prices to be cyclical [9]. Therefore, discussions of Bitcoin price cyclical patterns are essential topics for investors and risk averters. Using the Markov-switching (MS) model, we characterized nonlinearity according to individual economic variables [10,11,12] and found the cyclical pattern of Bitcoin. In addition, the US dollar index and VIX were used to explore the impact of these two factors on the Bitcoin price cyclical pattern and whether they would drive the structural change of Bitcoin.
The rest of this paper is organized as follows. Section 2 describes the data and MS model. Section 3 presents empirical results. The conclusion is presented in the final section.

2. Statistical Methodology and Data Description

2.1. MS Model

Consider the MS model given by
y t u S t = φ 1 ( y t - 1 u S t - 1 ) + φ 2 ( y t - 2 u S t - 2 )   + +   φ q ( y t - q u S t - q )   +   e t
where φ i is the coefficient on the autoregressive term; S t is the unobserved state of the Bitcoin (BTC) cycle: e t i . i . d . N ( 0 , σ S t 2 ) .   u S t and σ S t are the state-dependent conditional mean and standard derivation of y t , respectively, and q is the lag length of the autoregressive specification.
The BTC cycle follows a two-state Markov chain. St = 1 and St = 2 represent high growth (HG) and low growth (LG), respectively. A two-state Markov process with a fixed transition probability matrix is provided as follows:
p ( S t = j   |   S t - 1 = j ) = p j j ,   p ( S t = i   |   S t - 1 = i ) = p j i , i , j = 1 , 2
where p11 + p12 = p21 + p22 = 1. The stochastic process St is a stationary process when 0 < pii < 1 and i = 1 , 2 . Following Hamilton’s (1989) suggestion, we used the smoothed probability to determine whether the BTC was in state one or state two, as well as to determine the turning point of the BTC cycle.

2.2. Data Description

The data used in this study were related to the following variables: Bitcoin (BTC), the US dollar index (US), and the Chicago Board Options Exchange’s Volatility Index (VIX). The BTC, US, and VIX data were collected from January 2018 to September 2022. In addition, to highlight the effects of US and VIX on the BTC cyclical pattern, we regarded only BTC in the MS model as Model I. VIX and BTC were contained in the MS model as Model II. US and BTC were contained in the MS model as a Model III. Three variables, VIX, US, and BTC, are considered in the MS model as Model IV.

3. Results and Discussion

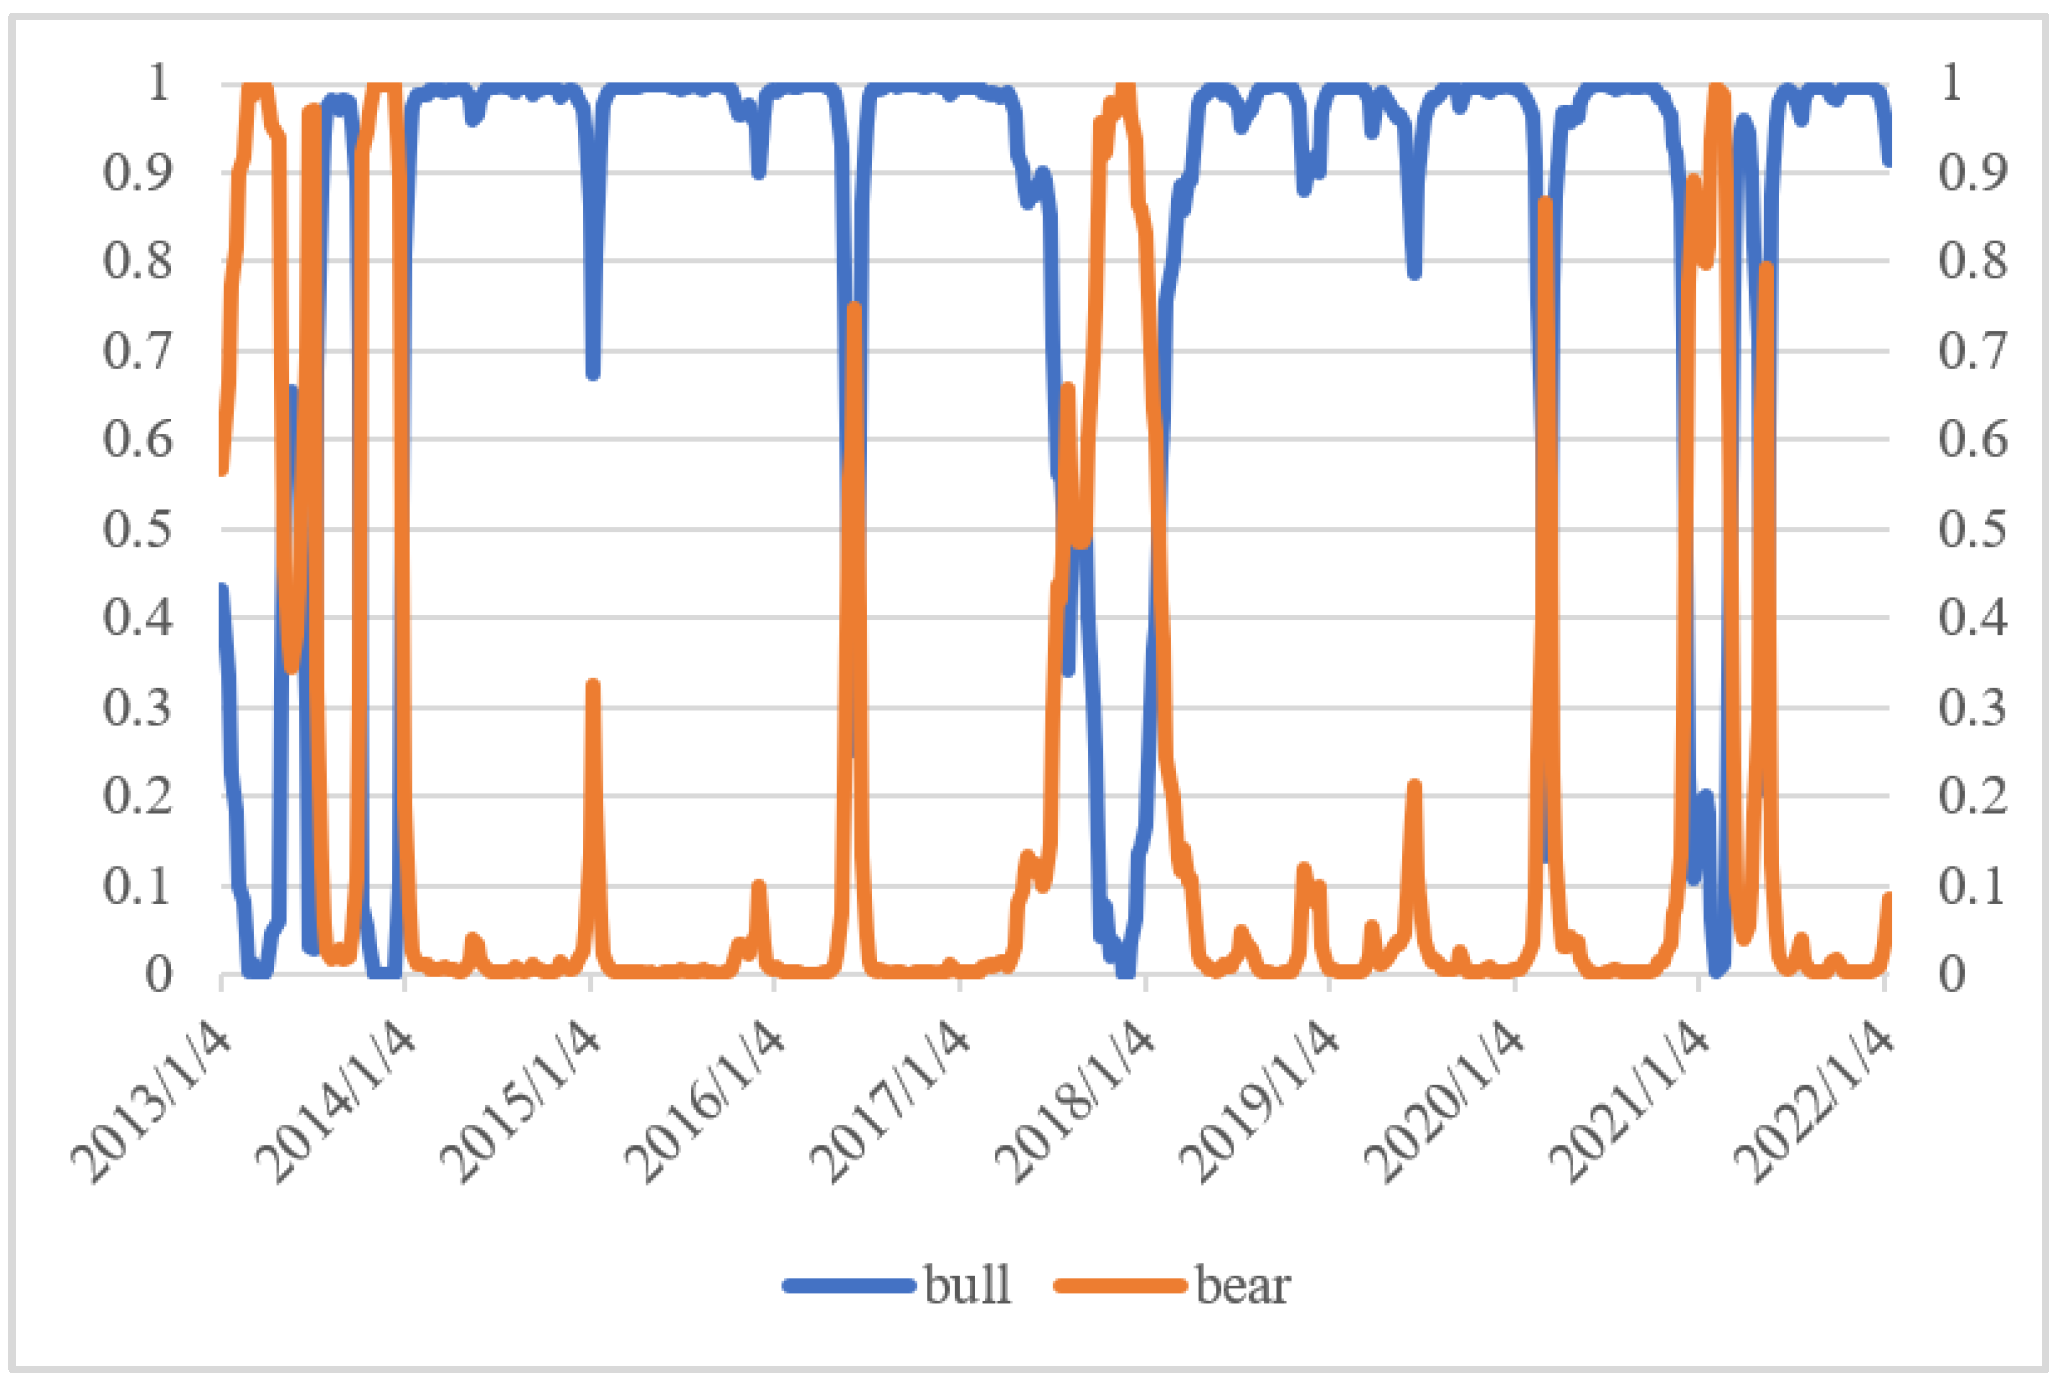
Figure 3 shows the long–short cycle of BTC, with the blue line representing the bull market and the orange line representing the bear market. For the models, σ 1 < σ 2 , and μ2 was 0.091 (Table 1). Even in the bear market, the price of Bitcoin was still in an upward trend. The duration of Model I in Table 1 was 40.357 in the bull market and 8.409 in the bear market, indicating that Bitcoin will be in the bull market most of the time from 2018 to 2022. In addition, the coefficients of XVIX and XUS in Model II and Model III were negative, indicating that the rise of VIX and US caused BTC to fall, and the effect of USD against Bitcoin impacted that of VIX on Bitcoin. The bear market duration affected Model III more than Model I. However, the same phenomenon appeared in the bull market, indicating that adding the dollar factor causes Bitcoin’s cycle to change from a short cycle to a longer cycle.
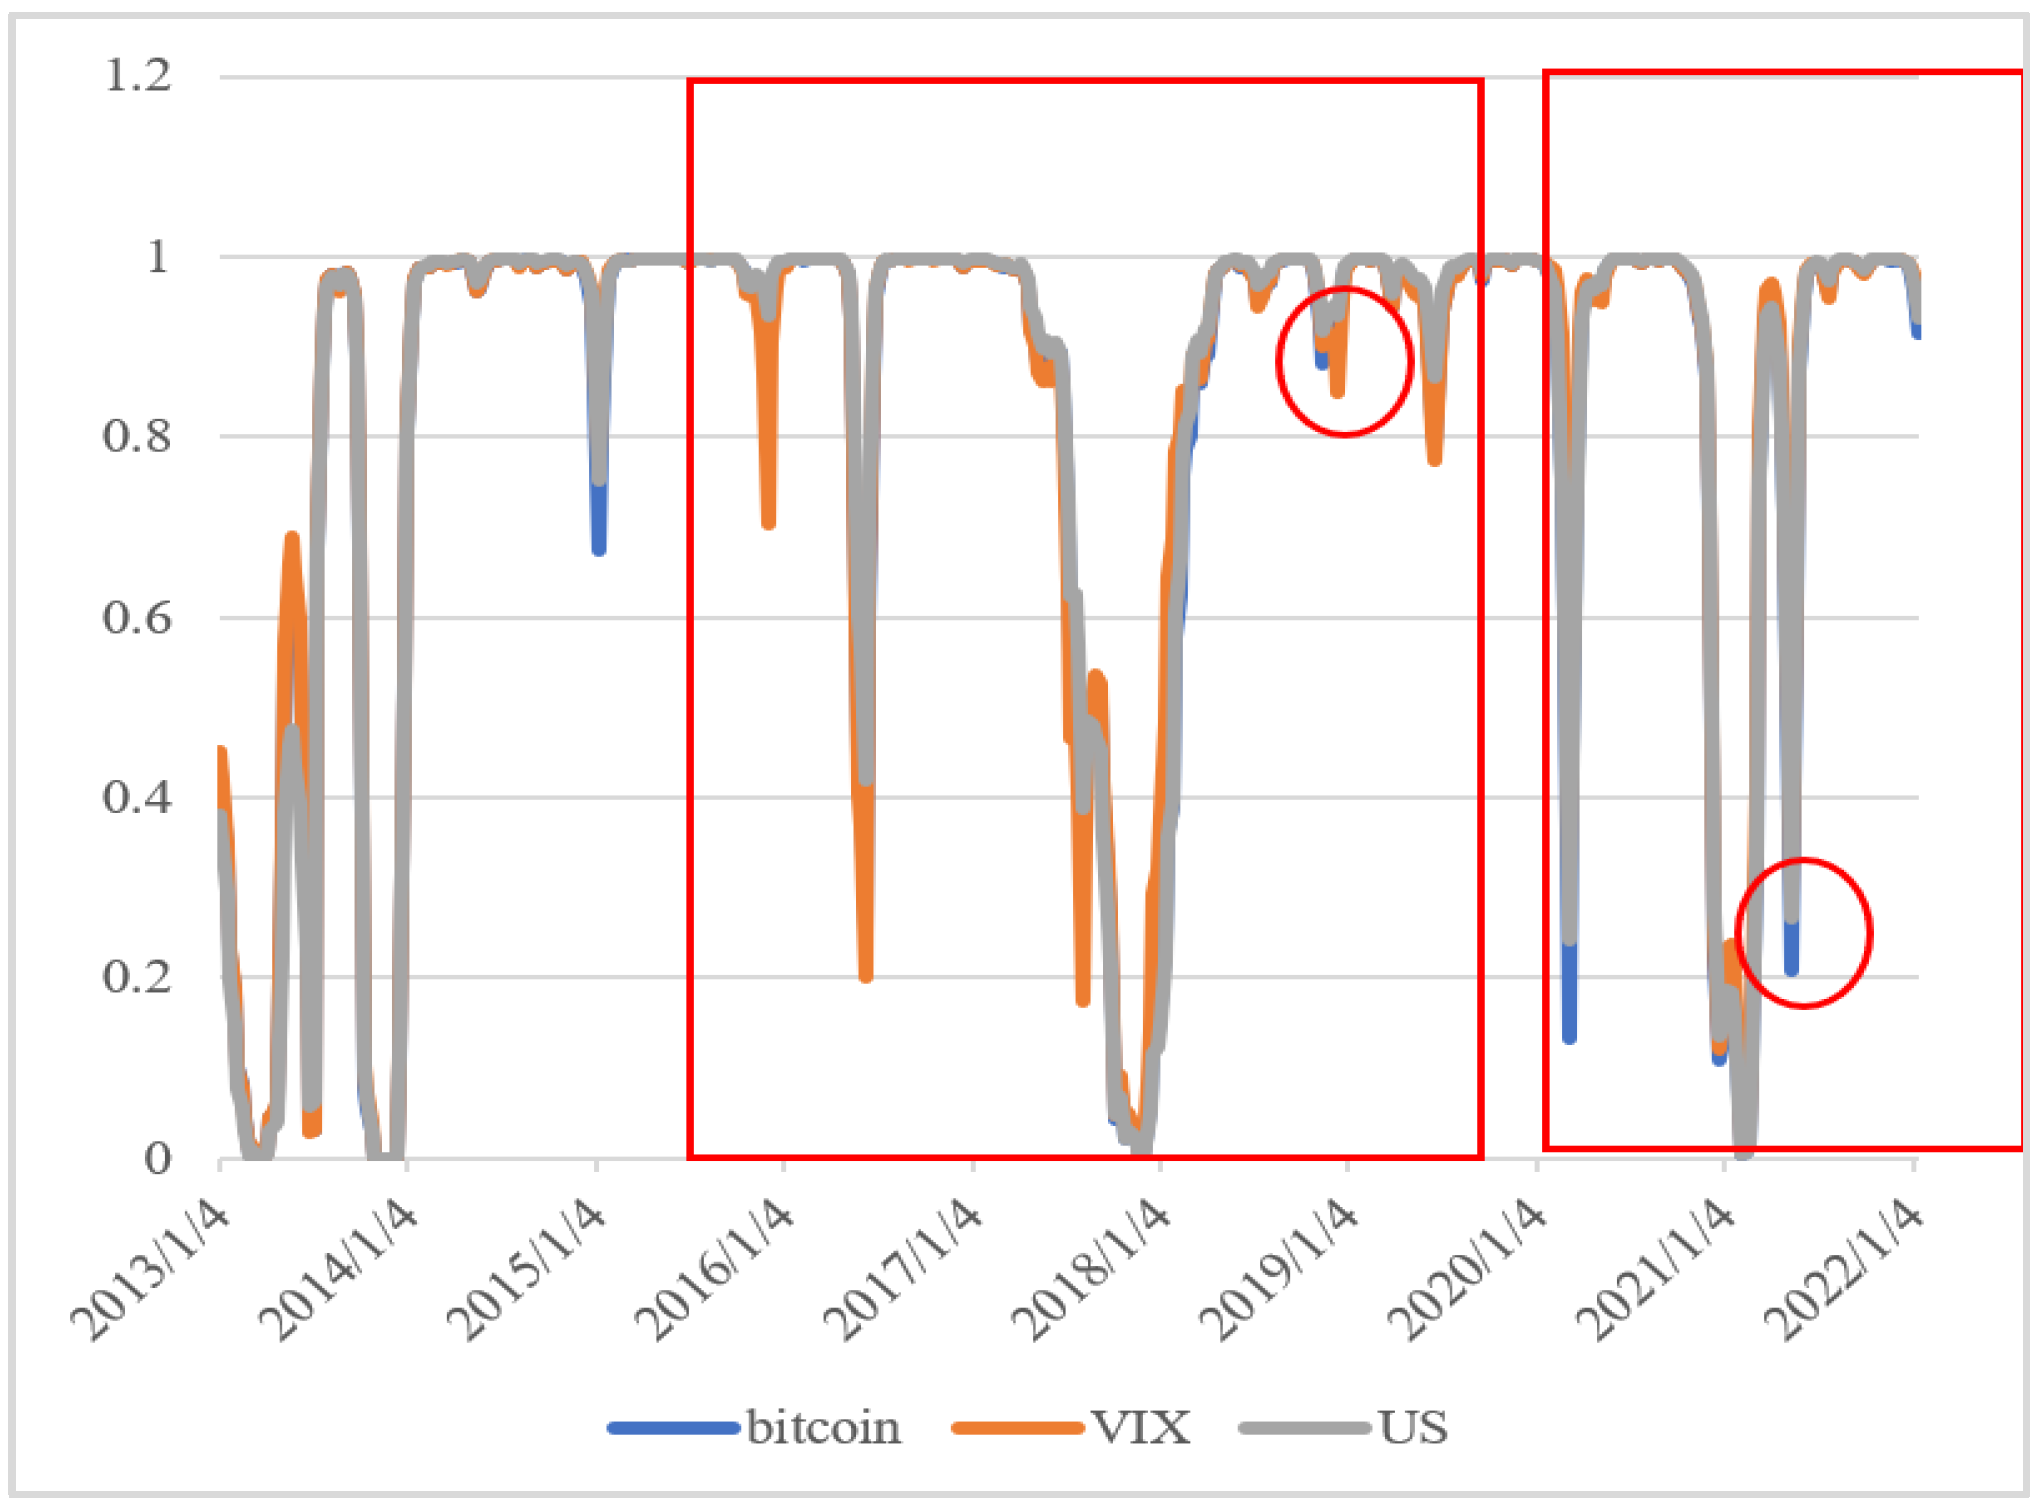
Figure 4 shows the cyclical patterns of VIX, US, and BTC. The gray line is for US, the blue line represents BTC, and the orange line is for VIX. As shown in Figure 2, VIX affected the structural transformation of BTC from 2016 to 2020, but in 2021, the US affected the structural transformation of BTC. VIX significantly impacted BTC during the epidemic, especially in early 2020. However, in early 2021, the U.S. Federal Reserve’s monetary policy impacted the global financial market and strengthened the US’s structural transformation of BTC. This result is in line with expectations.

4. Conclusions

We applied an MS model to examine the cyclical patterns of US, VIX, and BTC. The results revealed BTC’s cyclical pattern, the effects of the US and VIX on BTC’s cyclical pattern, and how the US and VIX affected the structural transformation of BTC.

Author Contributions

Conceptualization, P.-P.H., W.-T.H. and Y.-C.S.; methodology, P.-P.H. and W.-T.H.; validation, P.-P.H. and W.-T.H.; formal analysis, P.-P.H.; resources, P.-P.H.; data curation, Y.-C.S.; writing—original draft preparation, P.-P.H.; writing—review and editing, W.-T.H.; visualization, W.-T.H.; supervision, P.-P.H. and W.-T.H.; project administration, W.-T.H. All authors have read and agreed to the published version of the manuscript.

Funding

This research received no external funding.

Institutional Review Board Statement

Not applicable.

Informed Consent Statement

Not applicable.

Data Availability Statement

The data supporting this study’s findings are available from the corresponding author upon reasonable request.

Acknowledgments

We would like to thank His Chang for her helpful assistance regarding the data resource.

Conflicts of Interest

The authors declare no conflicts of interest.

References

  1. Cross, J.L.; Hou, C.; Trinh, K. Returns, volatility and the cryptocurrency bubble of 2017–18. Econ. Model. 2021, 104, 105643. [Google Scholar] [CrossRef]
  2. Dong, F.; Xu, Z.; Zhang, Y. Bubbly Bitcoin. Econ. Theory 2021, 74, 973–1015. [Google Scholar] [CrossRef]
  3. Choi, S.; Shin, J. Bitcoin: An inflation hedge but not a safe haven. Financ. Res. Lett. 2022, 46, 102379. [Google Scholar] [CrossRef] [PubMed]
  4. Zhu, Y.; Dickinson, D.; Li, J. Analysis on the influence factors of Bitcoin’s price based on VEC model. Financ. Innov. 2017, 3, 3. [Google Scholar] [CrossRef]
  5. Blau, B.M.; Griffith, T.G.; Whitby, R.J. Inflation and Bitcoin: A descriptive time-series analysis. Econ. Lett. 2021, 203, 109848. [Google Scholar] [CrossRef]
  6. Hsu, P.-P.; Chen, Y.-H.C.; Wang, C.-H. Currency or commodity competition? Bitcoin price trends in the post-pandemic era. Int. J. Appl. Econ. Financ. Account. 2023, 15, 61–70. [Google Scholar] [CrossRef]
  7. Chen, C.; Liu, L.; Zhao, N. Fear Sentiment, Uncertainty, and Bitcoin Price Dynamics: The Case of COVID-19. Emerg. Mark. Financ. Trade 2020, 56, 2298–2309. [Google Scholar] [CrossRef]
  8. Burns, A.F.; Mitchell, W.C. Measuring Business Cycles; Columbia University Press (for NBER): New York, NY, USA, 1946. [Google Scholar]
  9. Wang, J.; Ma, F.; Bouri, E.; Guo, Y. Which factors drive Bitcoin volatility: Macroeconomic, technical, or both? J. Forecast. 2022, 42, 970–988. [Google Scholar] [CrossRef]
  10. Hamilton, J.D. A New Approach to the Economic Analysis of Nonstationary Time Series and the Business Cycle. Econometrica 1989, 57, 357–384. [Google Scholar] [CrossRef]
  11. Mérida, A.; Golpe, A.A. Tourism-Led Growth Revisited for Spain: Causality, Business Cycles and Structural Breaks. Int. J. Tour. Res. 2014, 18, 39–51. [Google Scholar] [CrossRef]
  12. Hsu, P.-P. Examination of Taiwan’s travel and tourism market cycle through a two-period Markov regime-switching model. Tour. Manag. 2017, 63, 201–208. [Google Scholar] [CrossRef]
Figure 1. Weekly price trends of the US dollar index and 5-year Treasury interest rate.
Engproc 74 00012 g001
Figure 2. Weekly price trends of the US dollar index and Bitcoin price.
Engproc 74 00012 g002
Figure 3. Smoothing probability of HG and LG for BTC.
Engproc 74 00012 g003
Figure 4. Smoothing probability of HG and LG regimes for VIX, US, and BTC.
Engproc 74 00012 g004
Table 1. Estimation results of three models.
Model IModel IIModel IIIModel IV
σ 1 0.007 σ 1 0.007 σ 1 0.007 σ 1 0.007
σ 2 0.053 σ 2 0.053 σ 2 0.053 σ 2 0.053
u 1 0.010 x V I X −0.061 x U S −0.654 x V I X −0.063
u 2 0.091 u 1 0.010 u 1 0.010 x U S −0.753
p 11 0.975 u 2 0.101 u 2 0.091 u 1 0.010
p 12 0.119 p 11 0.975 p 11 0.979 u 2 0.102
p 21 0.025 p 12 0.128 p 12 0.103 p 11 0.982
p 22 0.881 p 21 0.025 p 21 0.021 p 12 0.098
p 22 0.872 p 22 0.897 p 21 0.018
p 22 0.902
Duration
p 11 40.357 39.508 47.970 54.595
p 22 8.409 7.843 9.701 10.212
Disclaimer/Publisher’s Note: The statements, opinions and data contained in all publications are solely those of the individual author(s) and contributor(s) and not of MDPI and/or the editor(s). MDPI and/or the editor(s) disclaim responsibility for any injury to people or property resulting from any ideas, methods, instructions or products referred to in the content.