Proceeding Paper

Utilization of Phototrophic Bacteria to Enhance Carbon Sequestration in Rice Paddy †

1
Taipei American School, Taipei 111, Taiwan
2
Department of Environmental Engineering and Science, Chia-Nan University of Pharmacy and Science, Tainan 717, Taiwan
3
Bioresource Collection and Research Center, Food Industry Research and Development Institute, Hsinchu 300, Taiwan
*
Authors to whom correspondence should be addressed.
Presented at the 2024 IEEE 4th International Conference on Electronic Communications, Internet of Things and Big Data, Taipei, Taiwan, 19–21 April 2024.
Eng. Proc. 2024, 74(1), 30; https://doi.org/10.3390/engproc2024074030
Published: 30 August 2024

Abstract

:
Rice paddies are a major source of agricultural greenhouse gas emissions, primarily caused by the proliferation of anaerobic, methanogenic bacteria during prolonged inundation. Phototrophic bacteria utilize light energy for metabolism and are potential candidates for carbon and nitrogen fixation, and reduction of methane gas emissions. We investigated the effect of applying the phototrophic bacterium Rhodopseudomonas palustris (PNSB) during the cropping period on soil organic carbon (SOC) and methane emissions for second-crop rice in the Tainan Guantian region. In the experimental group, PNSB was applied five times during the rice cultivation period. Compared to the control group, the experimental group demonstrated a significant reduction in methane emissions, especially in the tillering stage, where emissions averaged 37.26 ± 12.97 g-CH4/m2/season compared to 49.48 ± 25.06 g-CH4/m2/season of the control group. Over the entire growing season, the experimental group reduced the emission of 3.05 Mg·CO2e/ha. Additionally, administering PNSB improved soil carbon sequestration, from 4.89 tons-C/ha in the control group to 17.45 tons-C/ha. The phototrophic bacterium PNSB was beneficial for soil carbon sequestration and reducing greenhouse gas emissions. However, further research is required to optimize the methodology of applying phototrophic bacteria for agricultural purposes.

1. Introduction

Global warming is mainly caused by the emission of carbon dioxide (CO2), methane (CH4), and nitrous oxide (N2O). It has a large impact on human societal, agricultural, and economic activities, as well as on the global ecosystem. To curtail the greenhouse effect, the Paris Agreement proposed limiting the rise of global temperatures to 1.5 °C above pre-industrial levels. Subsequently, a 2018 report from the Intergovernmental Panel on Climate Change (IPCC) proposed net zero emissions as a goal for climate action.
Methane is a serious greenhouse gas that absorbs and retains heat considerably on the Earth’s surface and in the atmosphere [1]. Its global warming potential is 25 times larger than that of carbon dioxide (CO2) [2]. Agriculture is one of the major contributors to methane emissions, accounting for approximately 20% of global emissions. In particular, the cultivation of rice (Oryza sativa), which spans 153 million ha worldwide, is the main source of agricultural methane emissions [3]. In rice cultivation, the soil is constantly flooded, which promotes an anaerobic environment. This anaerobic milieu reduces the oxidative breakdown of organic matter accumulating organic carbon and provides an ideal niche for methanogenic bacteria, which break down the organic material to produce methane. The methane is subsequently released into the atmosphere through bubbling, diffusion, and plant transpiration, resulting in significant greenhouse gas emissions [4]. Therefore, proper management of rice farming must include methods that simultaneously ameliorate methane emissions and sequester organic carbon in the soil [5].
The purple non-sulfur bacteria (PNSB) are a diverse group of microbes that exist as photoautotrophs, photoheterotrophs, chemoautotrophs, and chemoheterotrophs; spanning a variety of habitats in lakes, oceans, and rice paddies. PNSB is capable of promoting plant growth through multiple mechanisms, including fixing atmospheric nitrogen into ammonium or nitrate salts, [6]; solubilizing phosphorous to promote its bioavailability [7]; synthesizing carriers that improve plant iron uptake; as well as synthesizing plant growth hormones such as 5-Aminolevulinic acid (5-ALA) [8] and Indole-3-acetic acid (IAA) [9]. Through these effects, PNSB reduces the reliance on chemical fertilizers by promoting the growth of root systems. Additionally, PNSB is tolerant to hypersaline and poor soil conditions, and aids plant growth in these situations. Considering that the anaerobic milieu of rice paddies provides a suitable niche for PNSB growth, PNSB can be used to outcompete methanogenic bacteria and reduce the breakdown of organic soil material, thus retaining organic carbon in the soil. To prove this, we evaluated the beneficial effects of adding PNSB to rice paddies on reducing methane emissions and increasing soil organic carbon content, compared to a control group of rice paddies without PNSB. The results contribute to the development of agricultural practices to reduce greenhouse gas emissions, improve yields from rice paddies, remedy soil quality, better farmers’ incomes, and enhance climate change preparedness.

2. Materials and Methods

2.1. Field Trial

A field trial was conducted on second-crop rice in an experimental field in Guantian District, Tainan City, Taiwan (23°10′00.0″ N and 120°20′43.7″ E), in collaboration with the Taiwan Food Industry Research and Development Institute (FIRDI) and with local farmers. The experimental field was divided into a control group (0.2 ha) and an experimental group (0.3 ha). The fields were separated by ridges, and each possessed a separate water supply. The fertilizer management protocol for the control group was based on recommendations from the Agricultural Research and Extension Station and local farming practices. No pre-planting fertilizer was used, topdressing was applied during the seedling development and tillering phases, and earing fertilizer was used during the young panicle formation stage. Fertilizers dosed 400 kg per hectare of ammonium sulfate and Biotec Organic Compound Fertilizers #39 (Taiwan Fertilizer Co., Taipei, Taiwan). The experimental group was treated with 10–20 L of PNSB (Rhodopseudomonas palustris), provided by FIRDI and administered via flood irrigation.
The strain planted was Taiwan Sen glutinous 2 (TCSW2), which was cultivated for 103 days. The fertilizer management protocol for the experimental and control groups was based on recommendations from the Agricultural Research and Extension Station and local farming practices. No pre-planting fertilizer was used. In the seedling development phase, ammonium sulfate and #1 Instant Water Soluble Fertilizer (Taiwan Fertilizer Co., Taipei, Taiwan) were applied. The doses for the experimental and control group were 400 and 640 kg/ha, respectively. During the young panicle formation stage, 300 kg/ha of Biotec Organic Compound Fertilizers #39 (Taiwan Fertilizer Co., Taipei, Taiwan) was used as earing fertilizer. Agricultural pests were managed with pesticides according to best practices. Additionally, the experimental group was treated five times with a compound PNSB formulation provided by FIRDI, administered via flood irrigation. Each dose of PNSB was 200 kg/ha.

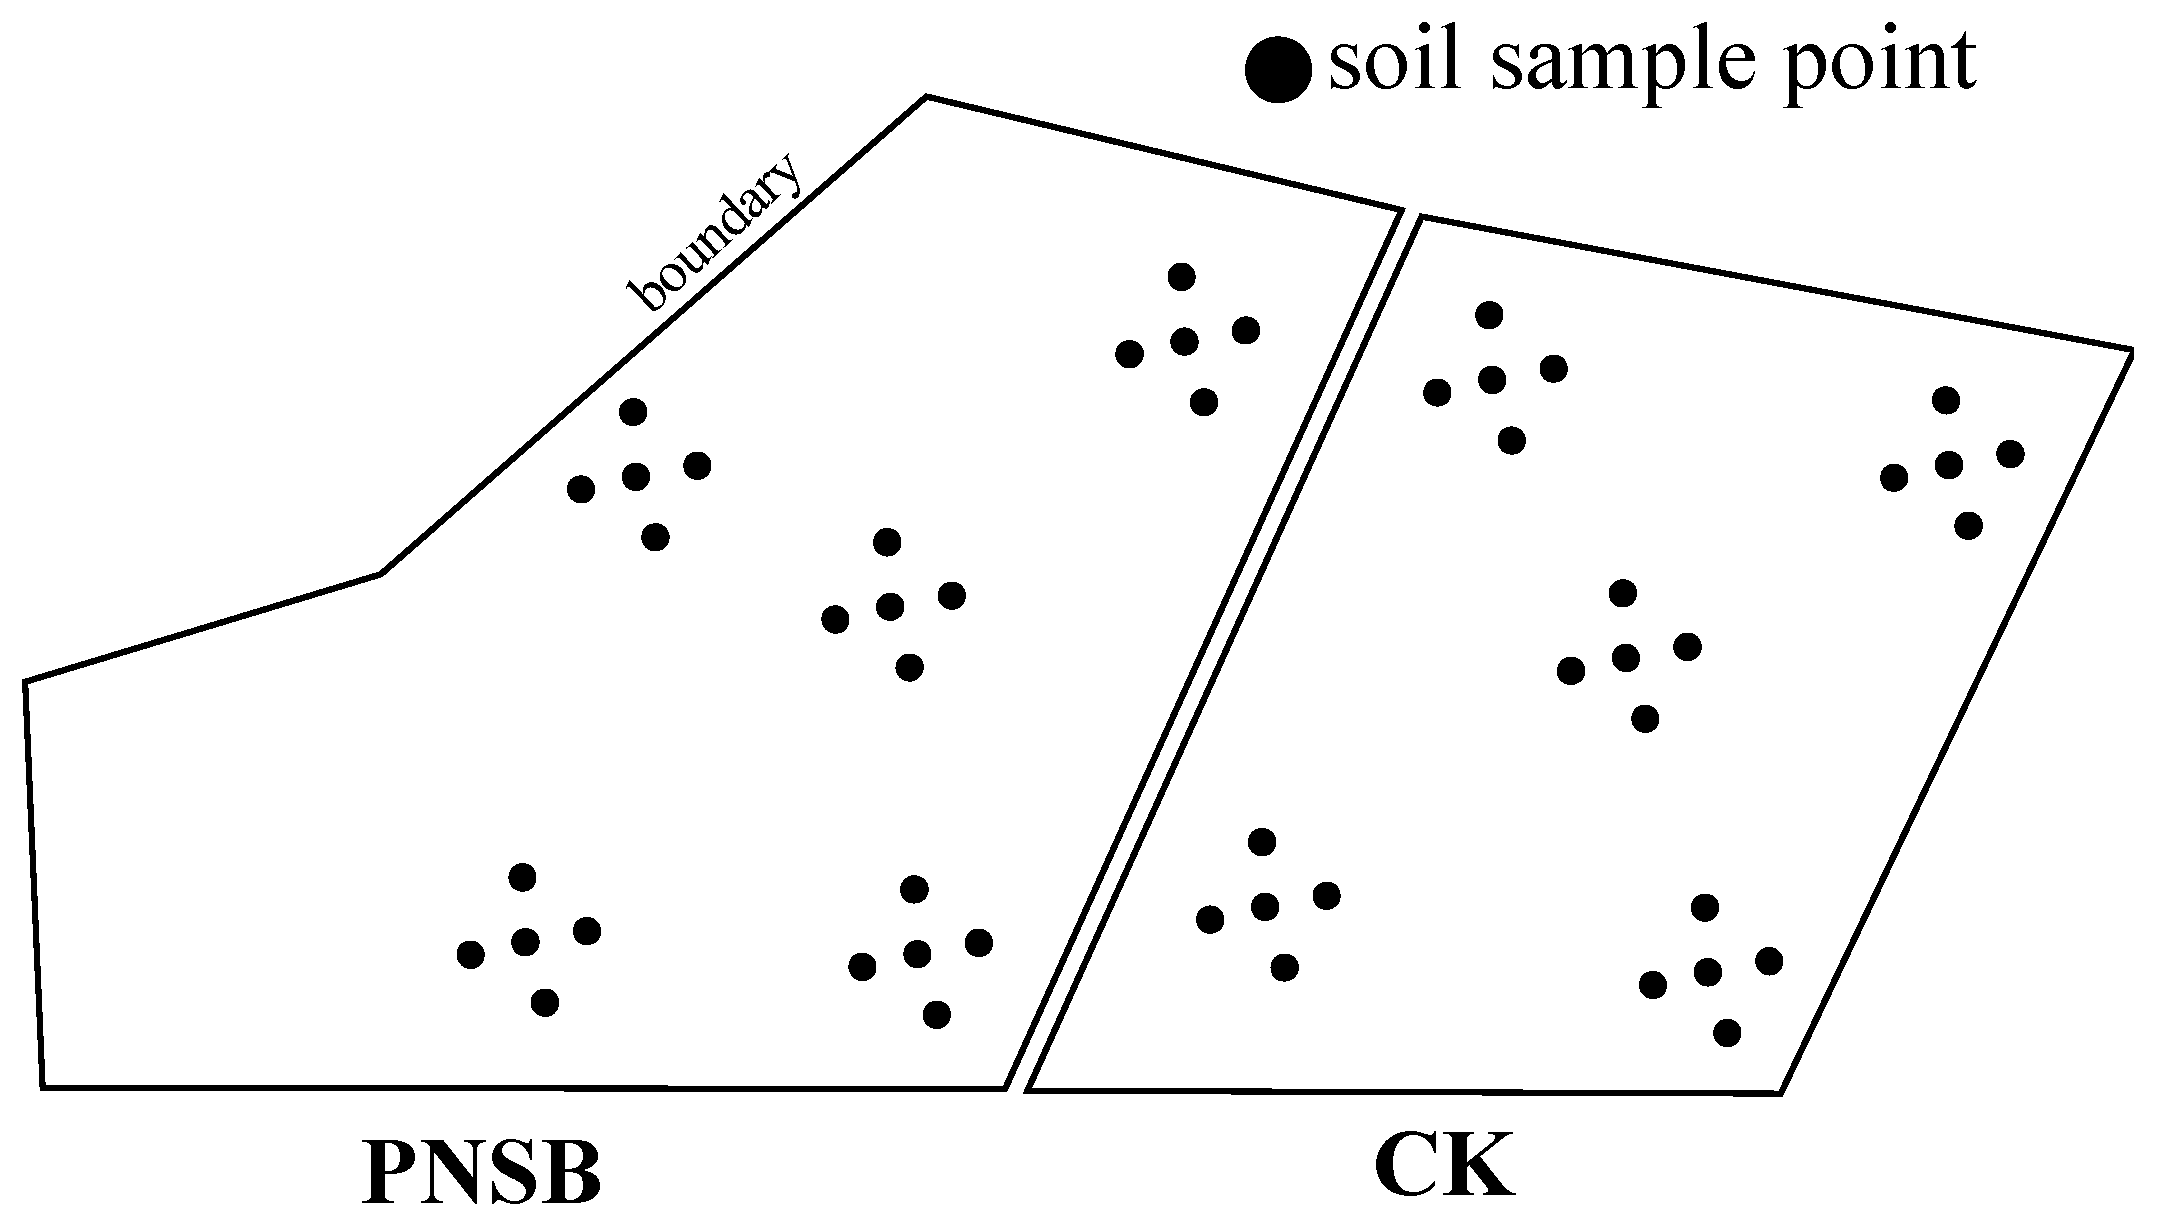
2.2. Collection and Analysis of Soil Samples

The sample analysis protocol was adapted from Ref. [10], where five sampling points were selected in each field, with four in the periphery and one in the center (Figure 1). Five samples were collected from each sampling point. To analyze organic carbon content in different soil layers, stainless steel soil core samplers were used to extract soil from three different depths (0–10, 10–20, and 20–30 cm). The samples were stored in individual low-density polyethylene (LDPE) plastic bags and transported to the laboratory.
For each soil sample, the density, gravel content, organic carbon content, and organic matter content were determined. Samples were weighed and dried, then powdered and sieved through a 2 mm sieve. The amount of gravel and large soil particles larger than 2 mm were weighed and used to adjust the soil density calculation and determine the soil gravel content. The sieved fine sample was ground and homogenized, then analyzed using a Total Organic Carbon (TOC) analyzer. The soil organic carbon content in each soil layer was affected by the soil density and gravel content, which were taken into account using the following equation described by the IPCC in 2006.
SOCstock = SOCcon fine soil ∗ FSS
(FSS is the fine soil stock.)
SOCi stock(Mg C ha−1) = OCi * BDfine 1i ∗ (1 − Ci) ∗ ti ∗ 0.1
(SOCi: soil organic carbon at depth i (mg C ha−1)
OCi: fine-earth organic carbon at depth i (mg C g−1 fine earth)
BDfine1i: the overall fine-earth density at depth i (g fine earth, cm−3 fine earth)
1 − vCi: the proportion of fine earth by volume (cm3 fine earth cm−3 soil)
vCi: the proportion of coarse fragments by volume (cm3 coarse fragment cm−3 soil)
ti: the thickness of soil at depth i (depth, cm)
0.1: the constant used for converting mg C cm−1 into Mg C ha−1)

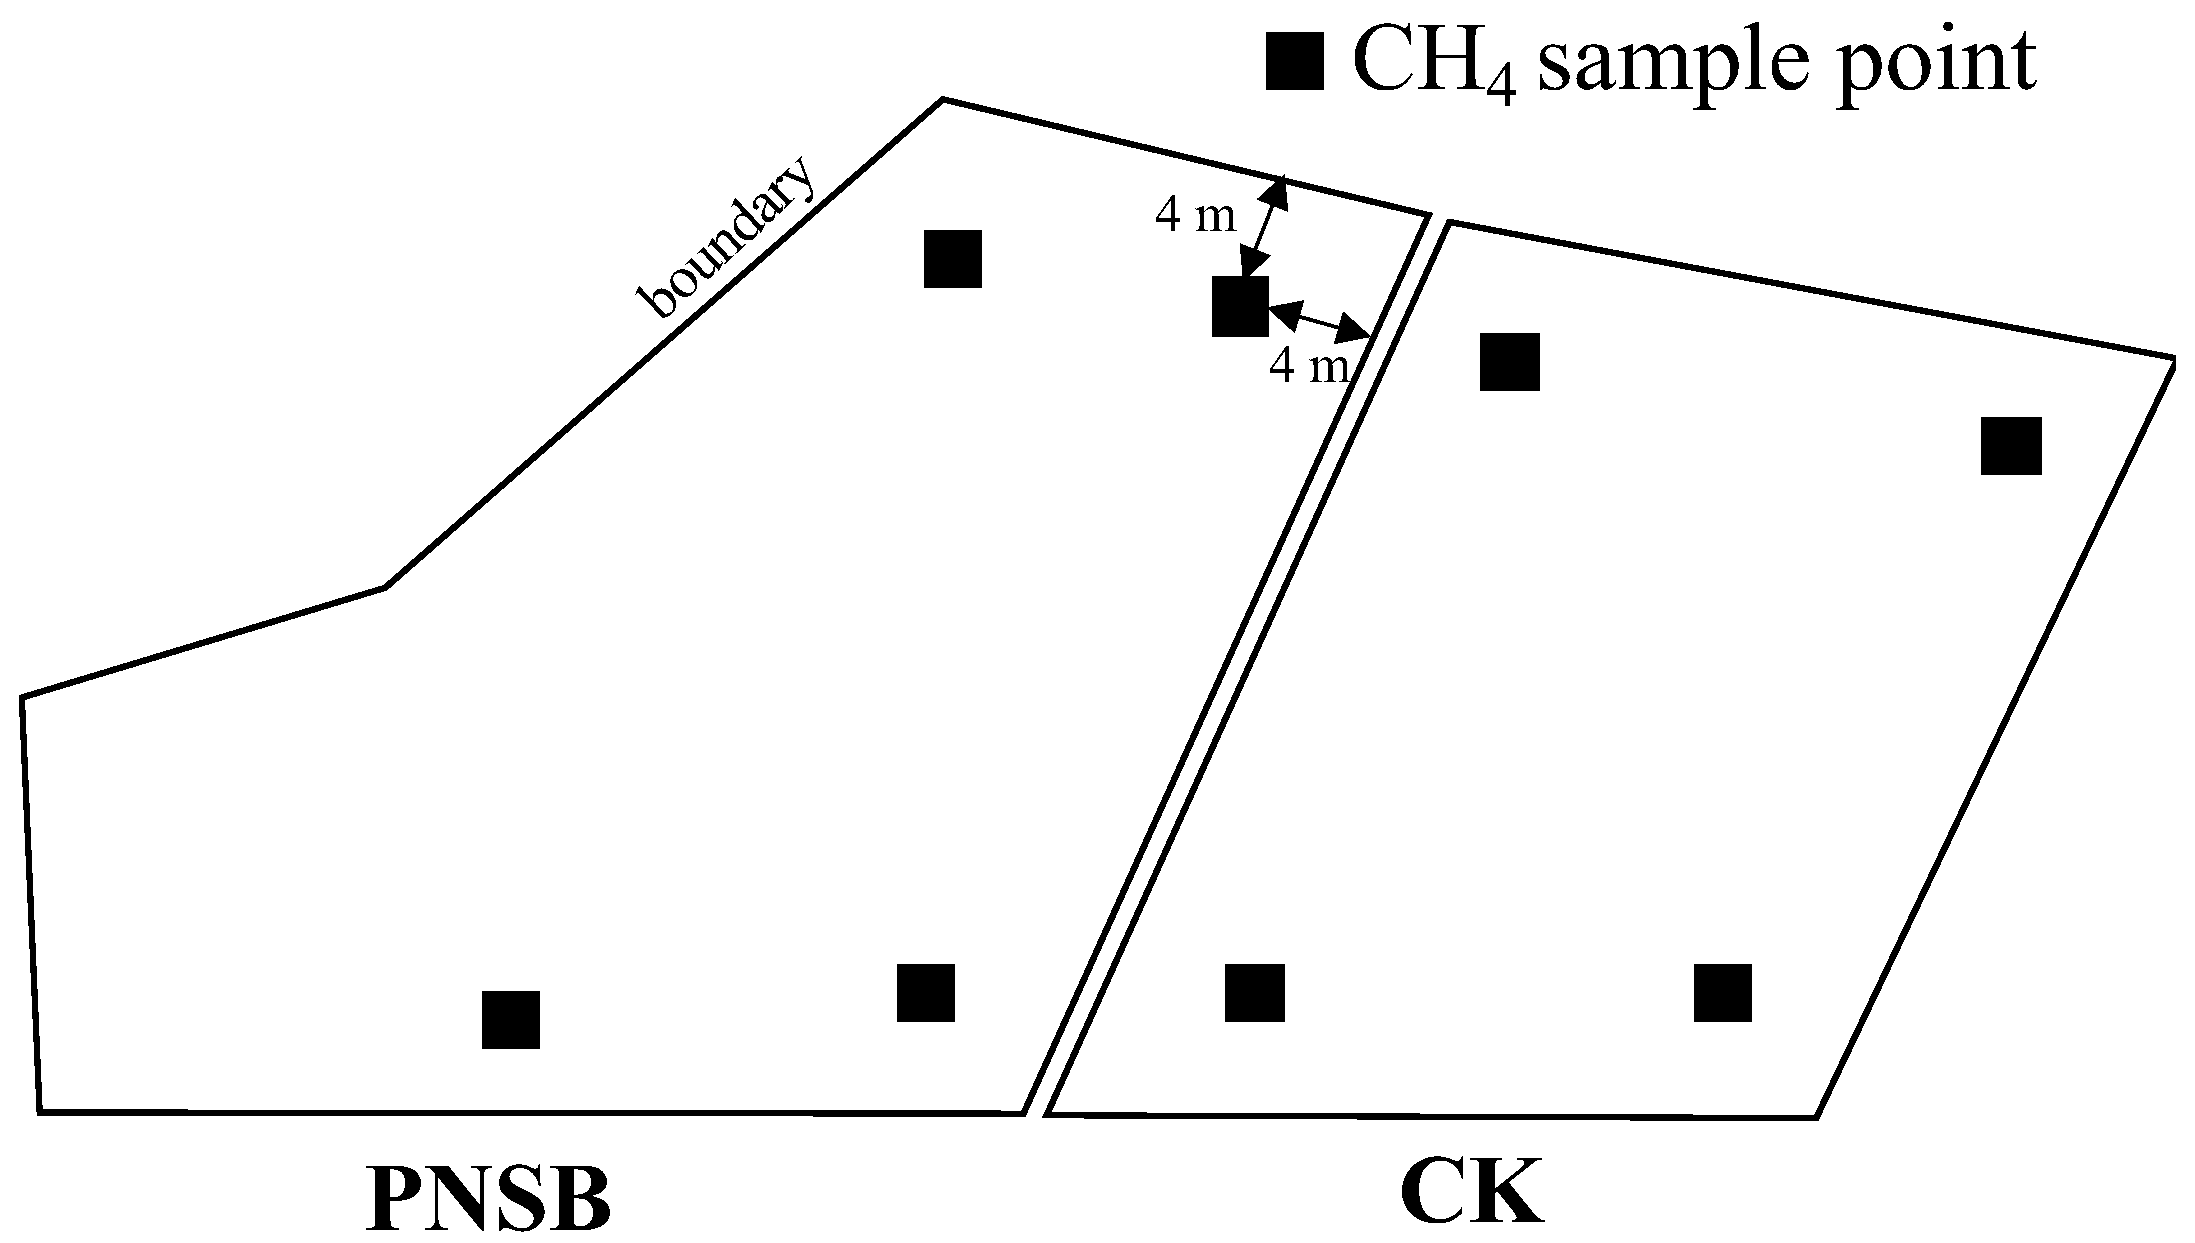
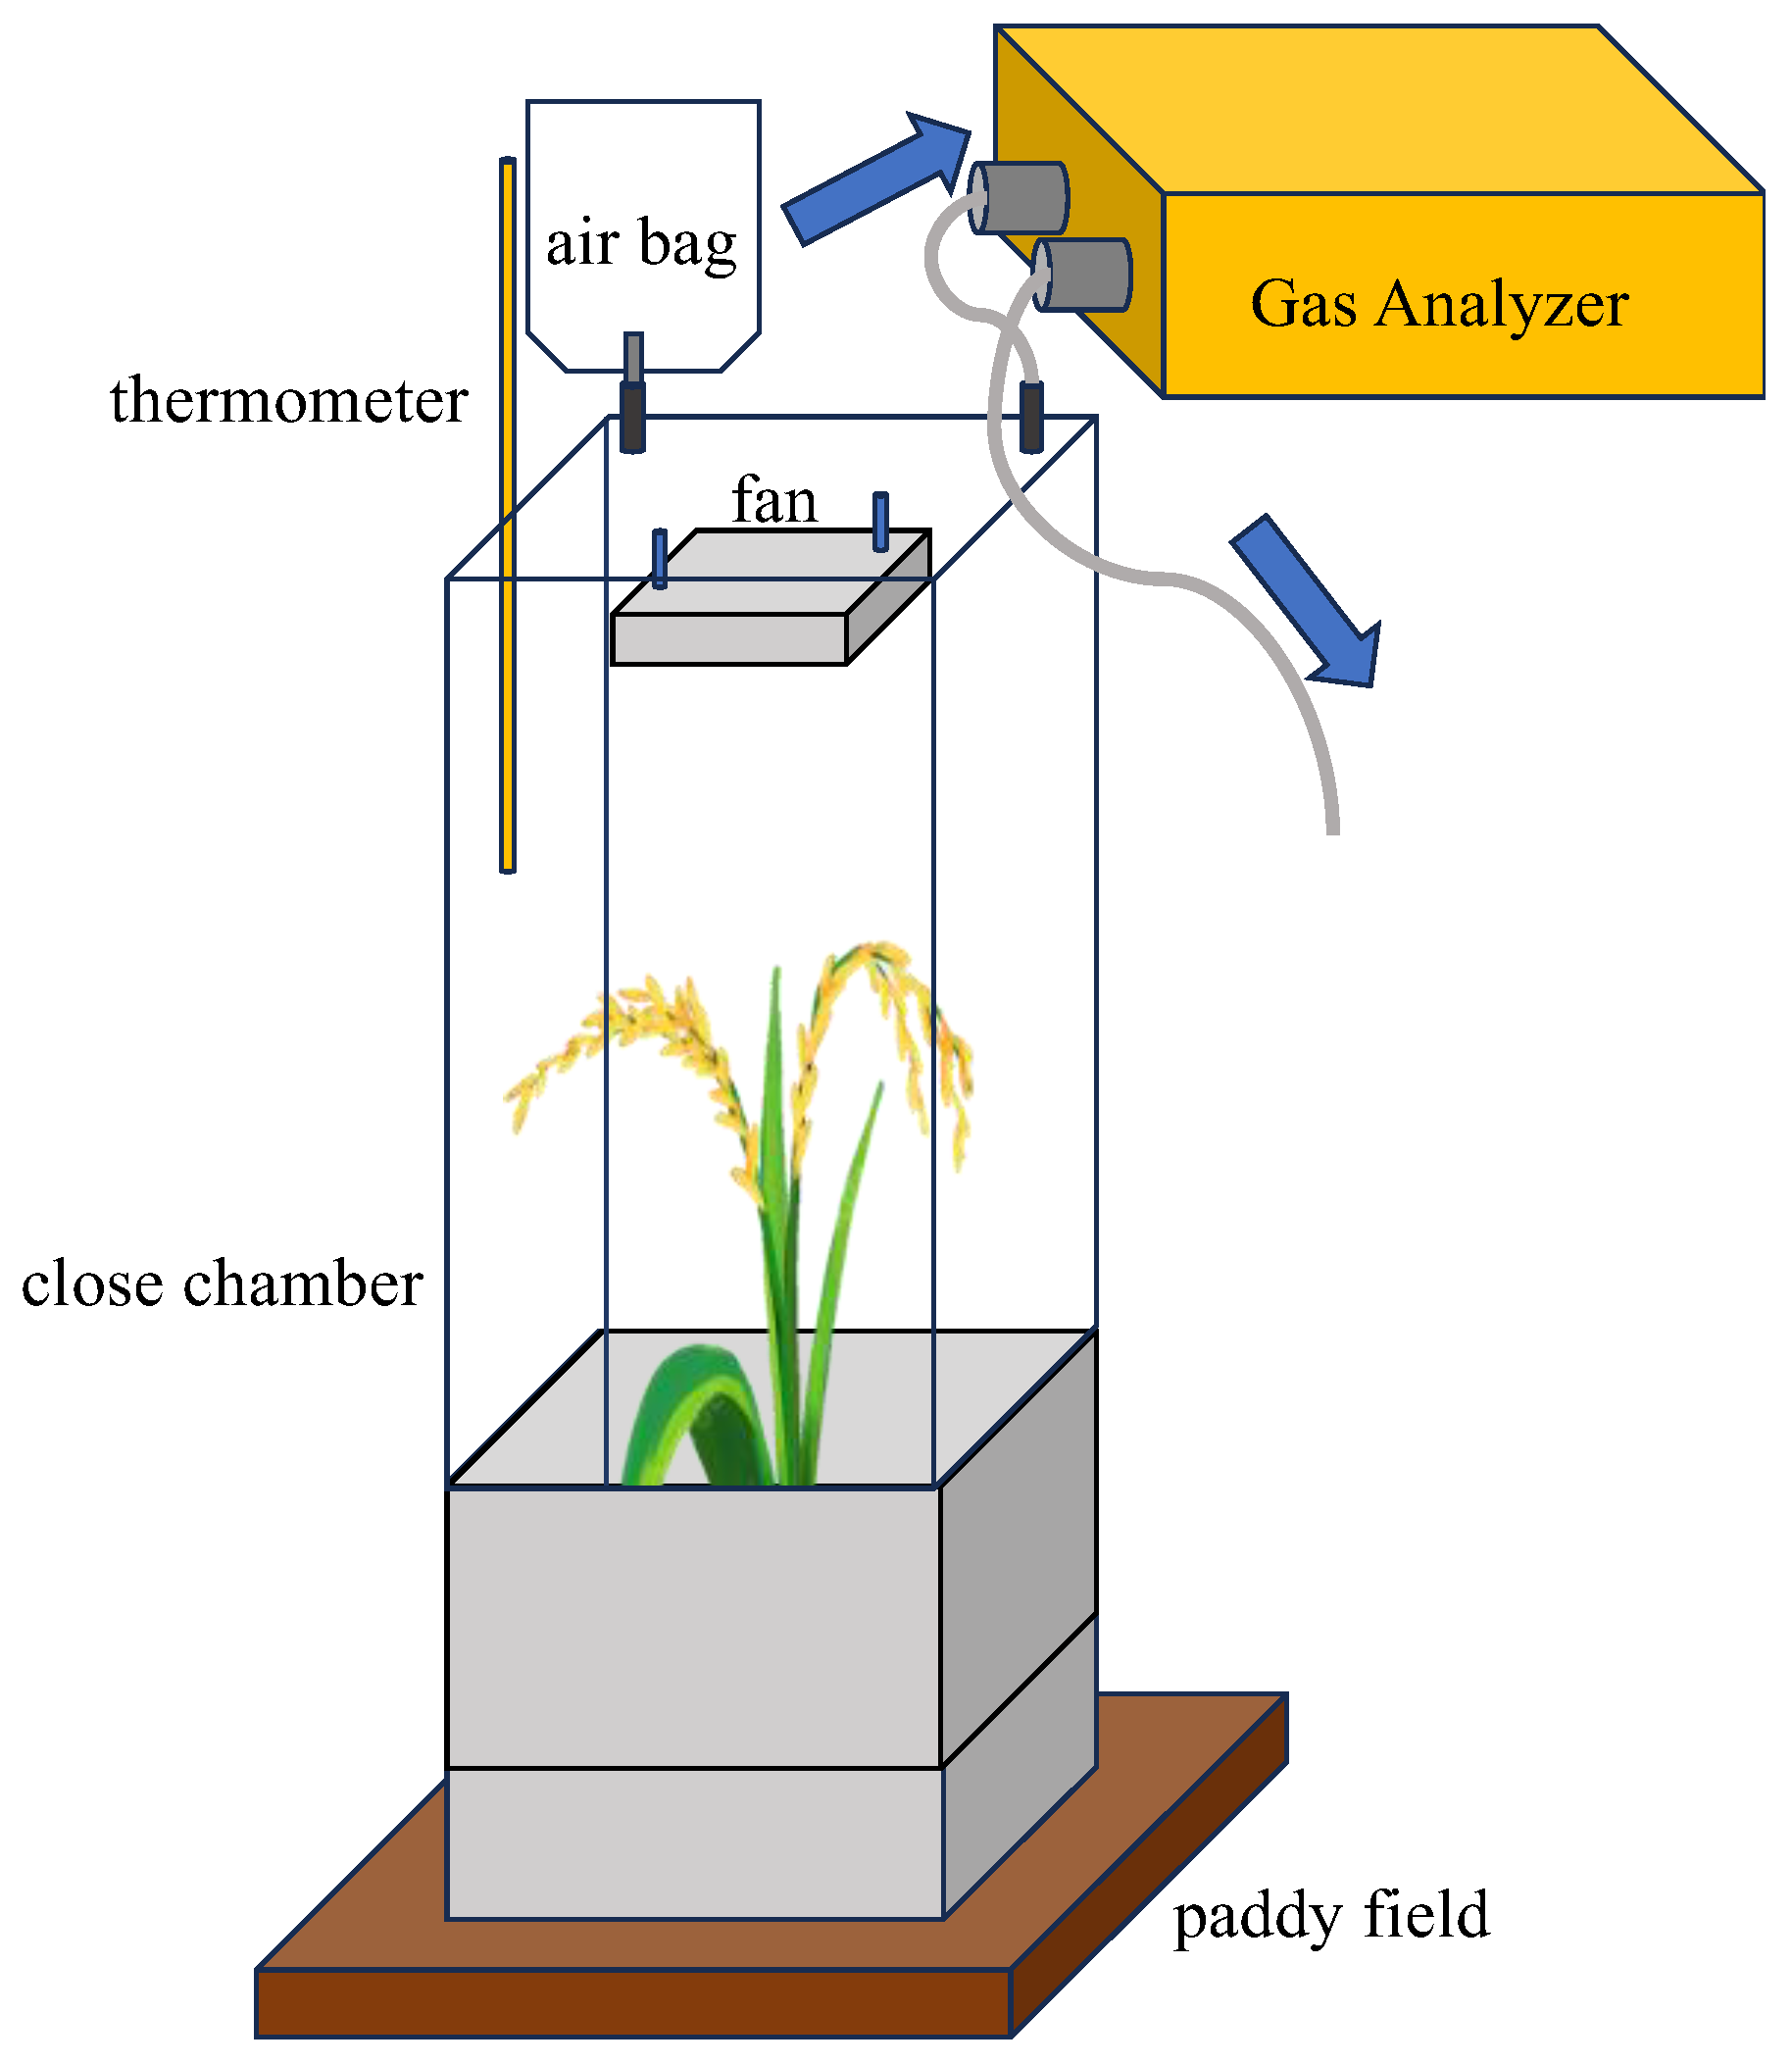
2.3. Collection and Analysis of Gas Samples

Gases from the experimental paddies were collected using a close chamber method during the period of rice cultivation. Samples were collected every two weeks, 5 times in total. Methane emissions were collected between 9:30 and 10:30 AM at four locations every 4 m (Figure 2) to obtain results that best correlated with overall emission levels [11]. We collected gas samples from the collection hoods placed horizontally on the field, and methane concentrations were measured at 0, 20, and 40 min after placement.
The sample collection hood was composed of a bottomless acrylic hood and a stainless-steel box that surrounds the rice plant (Figure 3) The acrylic hood contained a thermometer to measure the atmospheric temperature inside the hood, pipes, an airbag for gas collection, a barometer, and a small fan to ensure even mixing of gases in the hood. The size of the stainless-steel box was adjusted to accommodate different rice plant sizes. During sample collection, the sample collection hood was placed horizontally over one rice plant in a stable fashion. The fan in the hood was then powered on to cycle the air inside the hood. A greenhouse gas analyzer (LGR-ICOSTM GLA131-GGA Greenhouse Gas Analyzer) was connected to the hood to obtain instant readings of methane concentrations inside the hood.

2.4. Calculation of Carbon Dioxide Equivalents

The effect of our intervention on reducing emissions from each hectare of second-crop rice cultivation was calculated from the differential amount of methane between the experimental and control groups, using the following equation:
Kg CO2e/ha/season = CH4(CK) − CH4(PNSB) ∗ 25

2.5. Quantification of Soil Carbon Content (SOC)

By comparing the change in SOC and methane emissions between the experimental and control groups, the beneficial effects of PNSB were quantified. SOC was monitored over time in both fields, and the rate of SOC was increased. The annual rate of SOC stock increase was calculated according to an equation published by the IPCC in 2006, by converting SOC (g C kg−1) to SOC per unit area (ton C ha−1) and then dividing by the timespan between measurements.

2.6. Evaluation of Oryza Sativa Growth

On the 90th day of the field trial, a Soil Plant Analysis Development (SPAD) chlorophyll meter was used to measure the chlorophyll content of 20 randomly selected plants in each cohort. The height of the plants, as well as their eventual crop yield, were also collected.

2.7. Analysis of PSNB Content in Soil and Water

After planting, soil samples were collected from five locations in each field, four near the perimeter and one in the center. Three soil cores were collected from each location. After each sample was evenly mixed, 100 g of soil was aliquoted and placed in a sample bottle. The bottles were placed in a low-temperature storage box and then transported to the lab for immediate processing. At the same time, water samples were collected from five locations in each field, four near the perimeter and one in the center. The temperature, pH, and dissolved oxygen (DO) in each sample were quantified on site, and 600 mL of each sample was transported to the lab for immediate processing.

2.8. Analysis of PSNB Content by Most Probable Number (MPN) Method

At the lab, soil and water samples were evenly mixed, serially diluted in NS medium (BCRC 522), and cultured. The most probable number (MPN) method was used to estimate the concentration of photosynthetic bacteria in the samples.

3. Results and Discussion

3.1. SOC

Five samples were collected from each of the five locations in each cohort. The SOC levels are reported in Table 1. The experimental cohort, to which PNSB was added, displayed a slight decrease in the SOC of 0–10 cm deep soil after rice cultivation. The decrease was caused by an increase in water oxygen content caused by PNSB, which promoted aerobic bacterial activity and facilitated the breakdown of soil organic matter. In 10–30 cm, there was a marked increase in SOC in the experimental group after cultivation. The control group did not exhibit significant changes in SOC between the depths of 0–10 cm. Between 10–30 cm, small amounts of SOC increase were observed, the extent of which was less than that of the experimental group. These results suggested that PNSB addition promoted SOC accumulation in 10–30 cm deep soil by reducing methane production and thus curtailing the associated loss of organic matter.
The soil density and gravel content (defined as the percentage of particles greater than 2 mm) are shown in Table 2 and Table 3. According to TOC calculations, the control group had OC levels of 30.812 and 35.704 tons-C/ha before and after cultivation, respectively, corresponding to a 4.89 tons-C/ha increase. The experimental cohort with PNSB had organic carbon levels of 27.05 and 44.503 tons-C/ha before and after cultivation, corresponding to a 17.45 tons-C/ha increase (Table 4).

3.2. Analysis of Methane Emissions

The amount of emitted methane was measured on five days—17, 29, 34, 48, and 82 days after planting, respectively (Figure 4). During the initial phase of rice cultivation (0–17 days), the control and experimental groups did not exhibit significant differences in methane release. During the tillering phase (17–48 days), the amount of methane released gradually increased. We tallied the methane emissions during the period as a proxy of methane emissions across the entire second crop growth season. The control cohort released 49.48 ± 25.06 g-CH4/m2/season, while the PNSB cohort released 37.26 ± 12.97 g-CH4/m2/season. PNSB led to a 12.22 g-CH4/m2/season (122.2 Kg-CH4/ha/season) reduction in methane emissions, which is equivalent to 3.05 tons·CO2e/ha/season in terms of carbon dioxide equivalents.

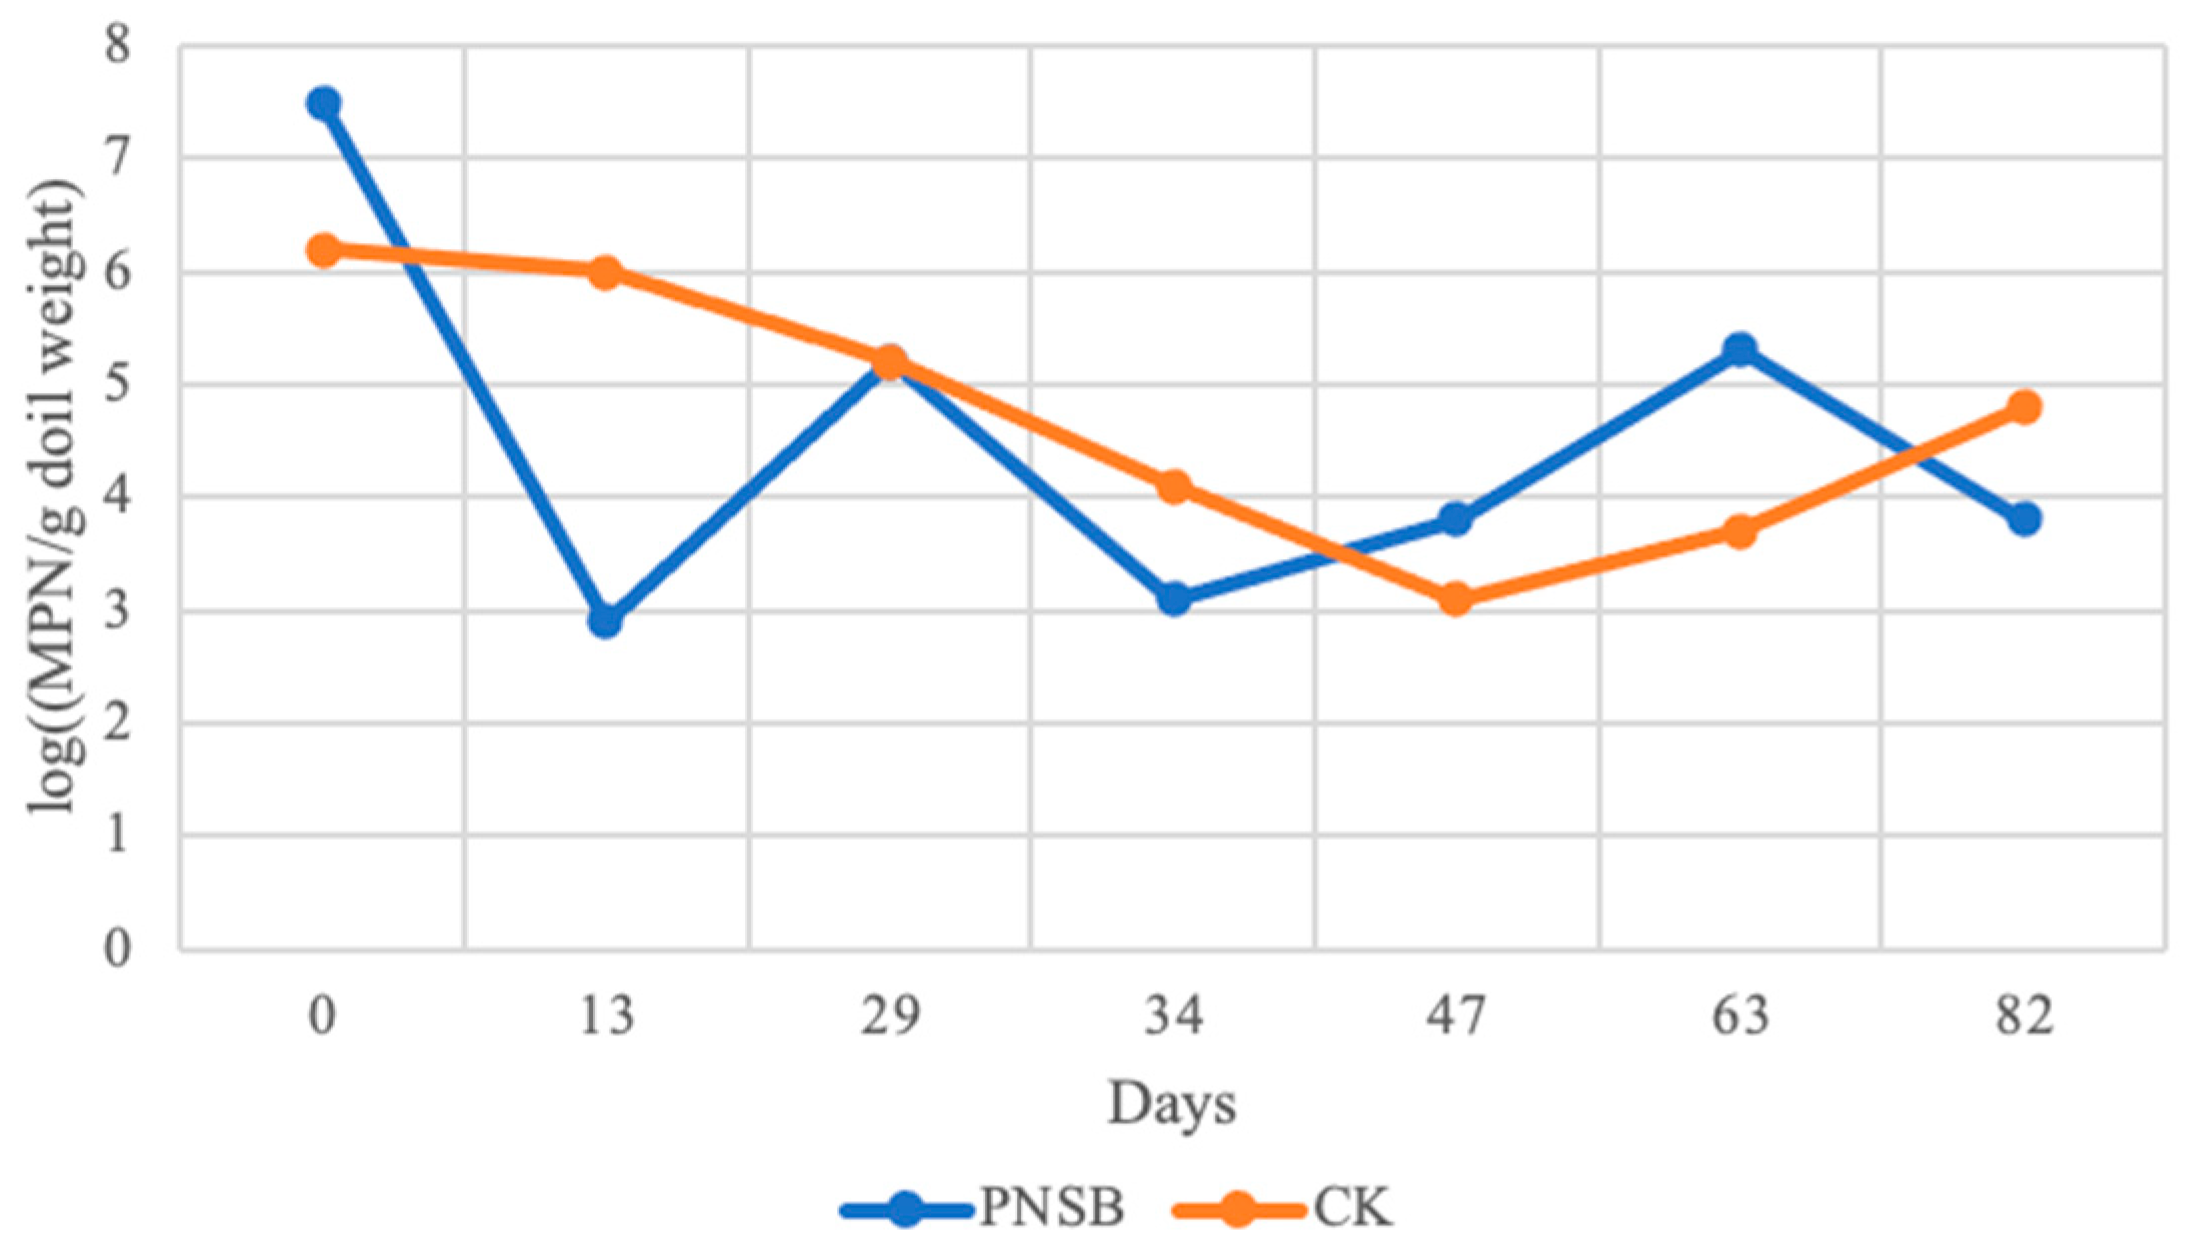
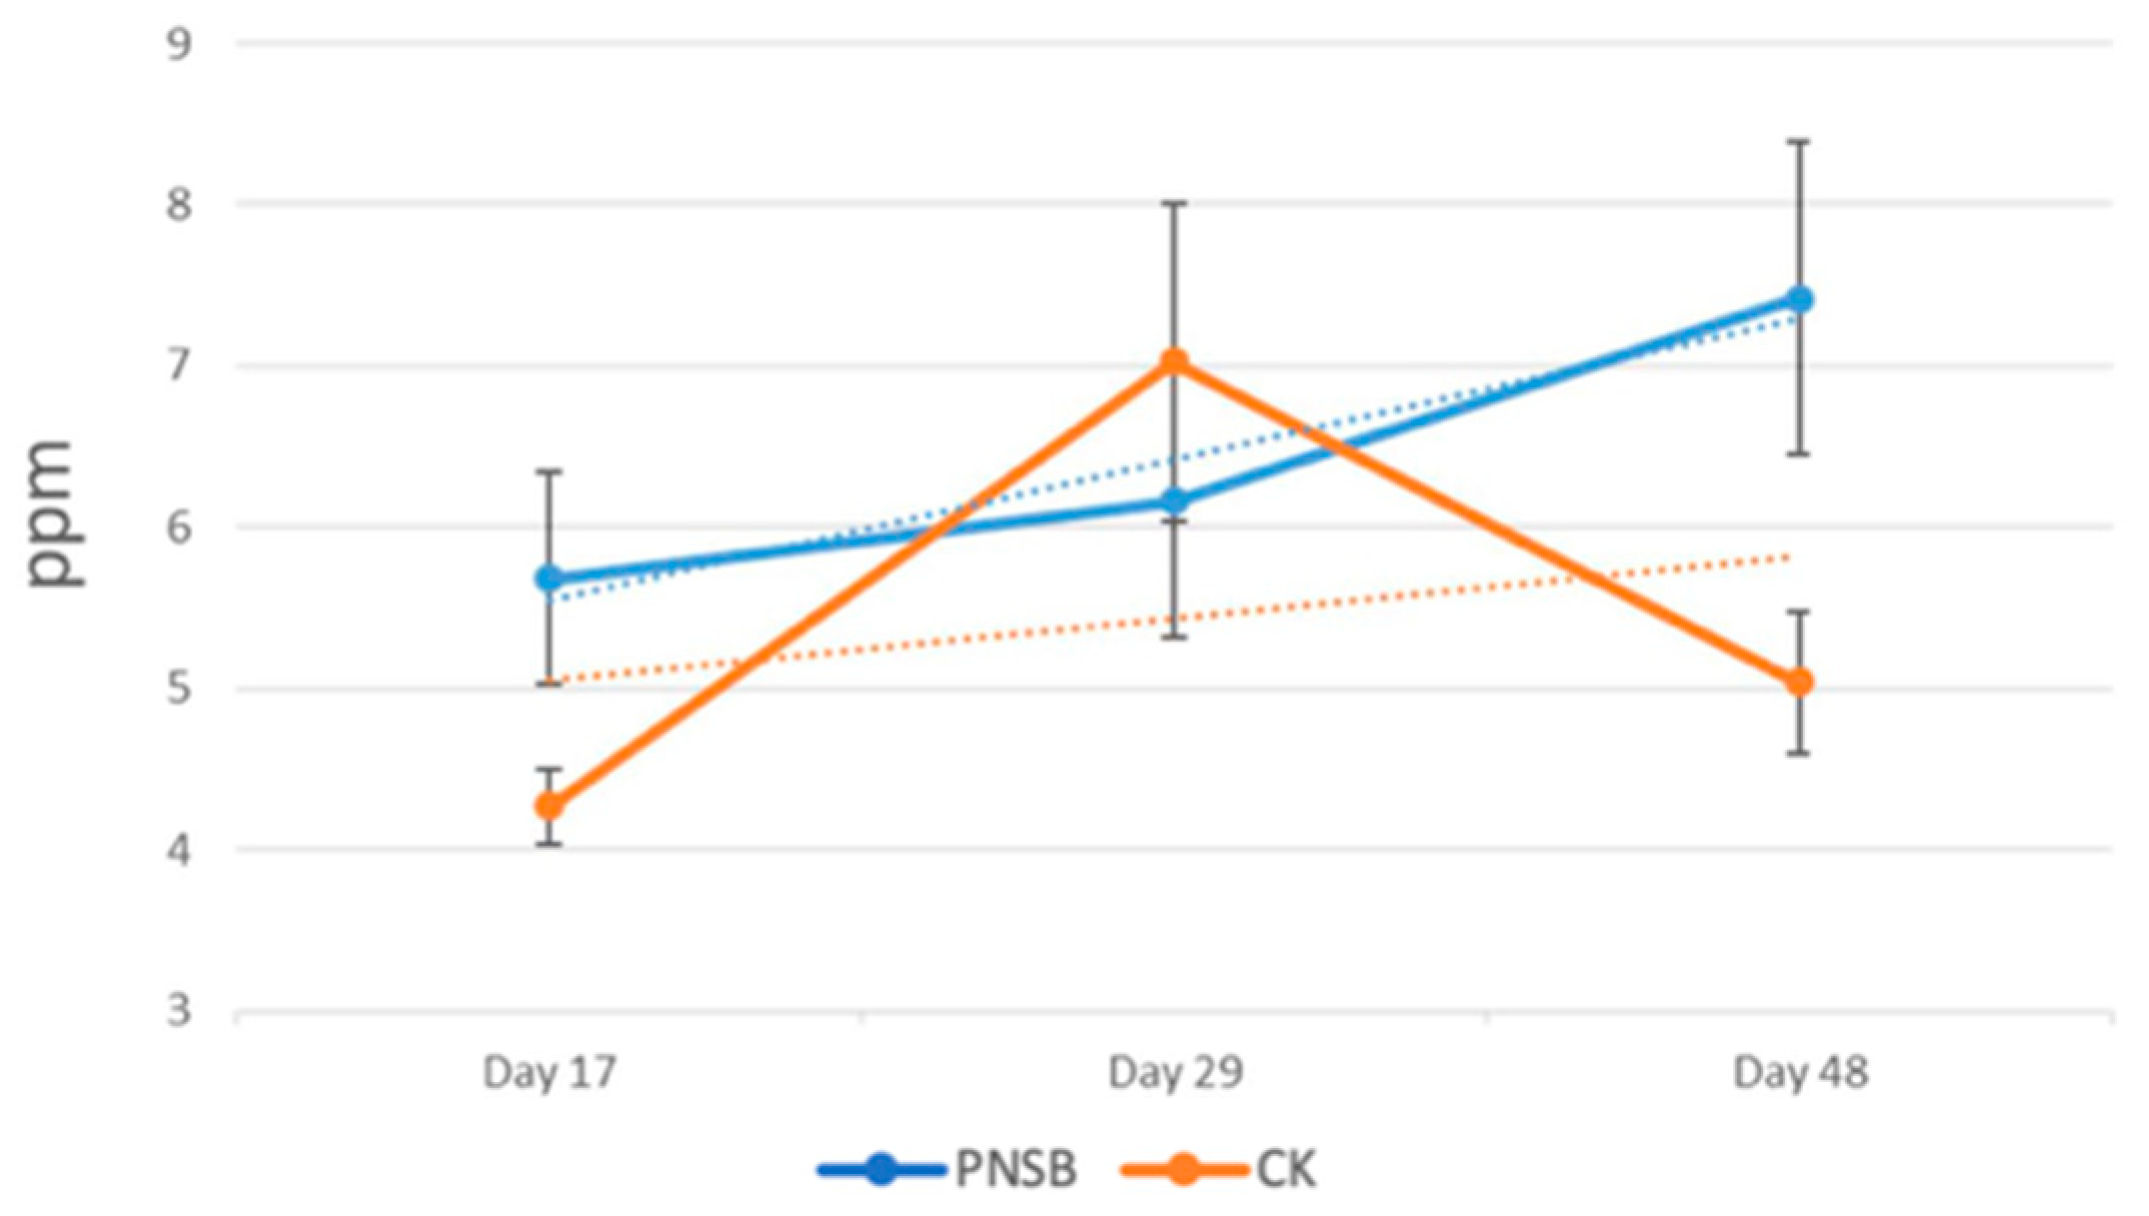
3.3. PNSB in Field Trials

PNSB content in water samples was measured using serial dilution followed by MPN. PNSB concentrations in water in the experimental group were higher than those in the control group (Figure 5). The addition of PNSB in this experiment increased the PNSB population size in water. On the contrary, soil PNSB concentrations were not correlated with the presence or absence of PNSB supplementation (Figure 6). Soil PNSB levels were higher during the first 45 days than later. Additionally, the concentrations of PNSB in water were positively correlated with the amount of dissolved oxygen (Figure 7). This indicated that a high PNSB concentration in water increased the amount of DO.

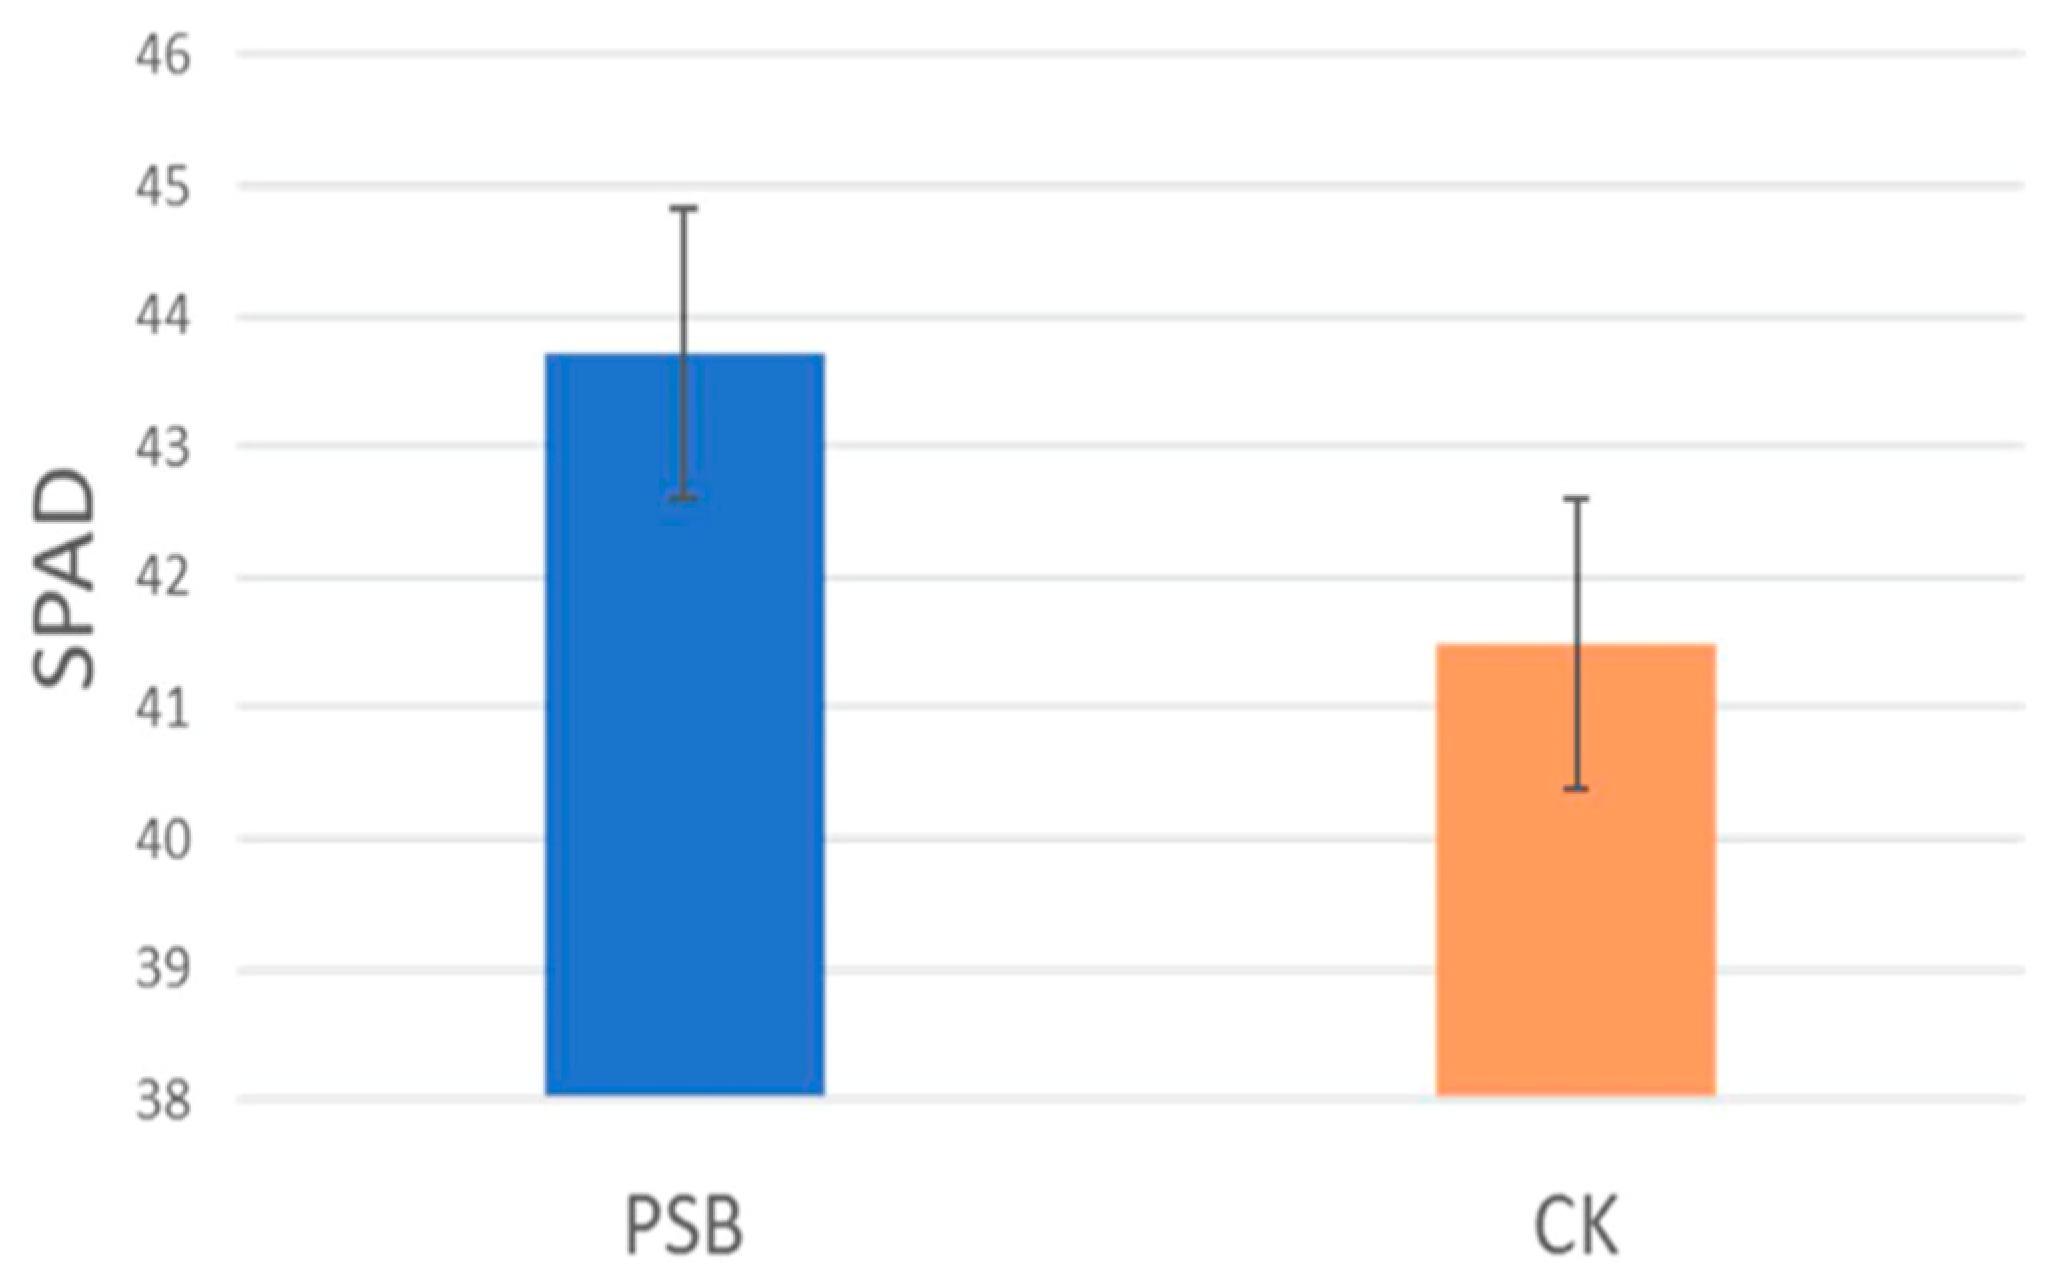
3.4. Evaluation of Oryza Sativa Growth

Chlorophyll content and plant height on the 90th day of Oryza sativa cultivation are shown in Figure 8 and Figure 9. Measurements from the SPAD chlorophyll meter revealed that plants in the PNSB cohort contained more chlorophyll compared to those in the control cohort (43.7 ± 4.05 and 40.91 ± 3.41, respectively). The average heights of PNSB-treated and control plants were similar (104.64 ± 4.40 and 105.44 ± 6.80 cm, respectively). We harvested the rice on the 103rd day. In the growing season, a hurricane and pests affected the growth, resulting in a reduced yield compared to prior years. The PNSB and control cohorts had yields of 5786.7 and 5645.0 Kg/hectare, respectively, with the PNSB cohort producing a 2.51% higher yield.

4. Conclusions

PNSB promoted plant growth, increased nitrogen fixation, and reduced greenhouse gas emissions, which proved that PNSB is a promising candidate for agricultural application. PNSB administration on second-crop rice (Oryza sativa) in the Guantian region proved to be effective in its growth. PNSB increased SOC and reduced greenhouse gas emissions. According to the national greenhouse gas inventory reports by the Ministry of Environment in Taiwan, the amount of methane emission coming from rice fields is affected by multiple factors, including climate, organic matter, soil properties, rice strains, and flood management. While the results of this research have demonstrated emission mitigation in the Tainan Guantian region, more field trials are needed in the future to assess the impact of PNSB administration on rice cultivation in other regions. Additionally, SOC contents must be monitored for longer durations to develop PNSB administration methodology for agricultural carbon sequestration.

Author Contributions

Conceptualization, Y.-C.K. and R.-M.L.; methodology, Y.-C.K. and R.-M.L.; validation, Y.-C.K.; formal analysis, Y.-C.K.; investigation, K.-Y.K. and A.K.W.; resources, Y.-C.K., R.-M.L., and K.-Y.K.; data curation, Y.-C.K.; writing—original draft preparation, K.-Y.K. and A.K.W.; writing—review and editing, Y.-C.K. and R.-M.L.; visualization, K.-Y.K. and A.K.W.; supervision, Y.-C.K.; project administration, Y.-C.K. and R.-M.L.; funding acquisition, Y.-C.K. and R.-M.L. All authors have read and agreed to the published version of the manuscript.

Funding

This research was funded by the National Science and Technology Council and Ministry of Agriculture.

Institutional Review Board Statement

Not applicable.

Informed Consent Statement

Not applicable.

Data Availability Statement

Data supporting reported results can be made available upon reasonable request from the corresponding author.

Acknowledgments

This research acknowledges BCRC, the Food Industry Research and Development Institute.

Conflicts of Interest

The authors declare that they have no known competing financial interests or personal relationships that could have appeared to influence the work reported in this paper.

References

  1. Shindell, D.T.; Faluvegi, G.; Koch, D.M.; Schmidt, G.A.; Unger, N.; Bauer, S.E. Improved attribution of climate forcing to emissions. Science 2009, 326, 716–718. [Google Scholar] [CrossRef] [PubMed]
  2. Stocker, T.F.; Qin, D.; Plattner, G.K.; Alexander, L.V.; Allen, S.K.; Bindoff, N.L.; Bréon, F.M.; Church, J.A.; Cubasch, U.; Emori, S.; et al. Technical summary. In Climate Change 2013: The physical science basis. Contribution of Working Group I to the Fifth Assessment Report of the Intergovernmental Panel on Climate Change; Cambridge University Press: Cambridge, UK, 2013; pp. 33–115. [Google Scholar]
  3. Carlson, K.M.; Gerber, J.S.; Mueller, N.D.; Herrero, M.; MacDonald, G.K.; Brauman, K.A.; Havlik, P.; O’Connell, C.S.; Johnson, J.A.; Saatchi, S.; et al. Greenhouse gas emissions intensity of global croplands. Nat. Clim. Chang. 2017, 7, 63–68. [Google Scholar] [CrossRef]
  4. Wassmann, R.; Aulakh, M.S. The role of rice plants in regulating mechanisms of methane missions. Biol. Fertil. Soils 2000, 31, 20–29. [Google Scholar] [CrossRef]
  5. Liu, Y.; Ge, T.; van Groenigen, K.J.; Yang, Y.; Wang, P.; Cheng, K.; Zhu, Z.; Wang, J.; Li, Y.; Guggenberger, G.; et al. Rice paddy soils are a quantitatively important carbon store according to a global synthesis. Commun. Earth Environ. 2021, 2, 154. [Google Scholar] [CrossRef]
  6. Huang, Y.; Yan, C.F.; Guo, C.Q.; Lu, Z.X.; Shi, Y.; Wang, Z.D. Synthesis of GO-modified Cu2O nanosphere and the photocatalytic mechanism of water splitting for hydrogen production. Int. J. Hydrogen Energy 2017, 42, 4007–4016. [Google Scholar] [CrossRef]
  7. Li, Y.; Liu, X.; Hao, T.; Chen, S. Colonization and Maize Growth Promotion Induced by Phosphate Solubilizing Bacterial Isolates. Int. J. Mol. Sci. 2017, 18, 1253. [Google Scholar] [CrossRef] [PubMed]
  8. Lee, D.H.; Jun, W.J.; Shin, D.H.; Cho, H.Y.; Hong, B.S. Effect of Culture Conditions on Production of 5-Aminolevulinic Acid by Recombinant Escherichia coli. Biosci. Biotechnol. Biochem. 2005, 69, 470–476. [Google Scholar] [CrossRef] [PubMed]
  9. Bric, J.M.; Bostock, R.M.; Silverstone, S.E. Rapid in situ assay for indoleacetic Acid production by bacteria immobilized on a nitrocellulose membrane. Appl. Environ. Microbiol. 1991, 57, 535–538. [Google Scholar] [CrossRef] [PubMed]
  10. Blake, G.R.; Hartge, K.H. Bulk Density. In Methods of Soil Analysis: Part 1 Physical and Mineralogical Methods; American Society of Agronomy: Madison, WI, USA, 1986; pp. 363–375. [Google Scholar] [CrossRef]
  11. Zhang, X.Y.; Qiu, S.Y. Method for on-Site Measurement of Methane in Paddy Fields. Available online: https://www.hdares.gov.tw/upload/hdares/files/web_structure/13721/02%E6%B0%B4%E7%94%B0.pdf (accessed on 29 August 2024).
Figure 1. Sample collection points in the experimental field.
Engproc 74 00030 g001
Figure 2. Sampling points for the collection of gas samples.
Engproc 74 00030 g002
Figure 3. Design of the sample collection hood.
Engproc 74 00030 g003
Figure 4. Monitoring of methane emissions in field trials.
Engproc 74 00030 g004
Figure 5. PNSB content in water.
Engproc 74 00030 g005
Figure 6. PNSB content in soil.
Engproc 74 00030 g006
Figure 7. DO in water.
Engproc 74 00030 g007
Figure 8. Chlorophyll content on the 90th day of rice cultivation.
Engproc 74 00030 g008
Figure 9. Plant height on the 90th day of rice cultivation.
Engproc 74 00030 g009
Table 1. SOC (%) in various soil layers.
PNSBBefore cultivationAfter cultivationDifference (%)Total (%)
0–10 cm1.433 ± 0.1861.484 ± 0.14−0.0880.737
10–20 cm1.623 ± 0.2271.756 ± 0.1610.209
20–30 cm1.763 ± 0.2482.159 ± 0.1410.615
Control groupBefore cultivationAfter cultivationDifference (%)Total (%)
0–10 cm1.448 ± 0.1281.488 ± 0.0510.0030.209
10–20 cm1.705 ± 0.2071.779 ± 0.090.172
20–30 cm2.006 ± 0.1541.779 ± 0.090.034
Table 2. Overall densities of various soil layers.
PNSBBefore cultivationAfter cultivation
0–10 cm1.433 ± 0.1861.484 ± 0.14
10–20 cm1.623 ± 0.2271.756 ± 0.161
20–30 cm1.763 ± 0.2482.159 ± 0.141
Control groupBefore cultivationAfter cultivation
0–10 cm1.448 ± 0.1281.488 ± 0.051
10–20 cm1.705 ± 0.2071.779 ± 0.09
20–30 cm2.006 ± 0.1541.779 ± 0.09
Table 3. Gravel content (%) of various soil layers.
DepthPNSBControl Group
0–10 cm0.19590.1897
10–20 cm0.2290.2012
20–30 cm0.3050.4786
Table 4. Soil Organic Carbon Content of various soil layers.
Soil Organic Carbon Content
(tons-C/ha)
Amount Sequestered
(tons-C/ha)
(A) a(B) b(C) c Total d
Control groupBefore cultivation15.5649.5305.71730.8124.89
After cultivation15.99612.8326.87735.704
PNSBBefore cultivation14.3019.8252.92927.05517.45
After cultivation13.54414.48416.47544.503
a. 0~10 cm, b. 10~20 cm, c. 20~30 cm, d. A + B + C.
Disclaimer/Publisher’s Note: The statements, opinions and data contained in all publications are solely those of the individual author(s) and contributor(s) and not of MDPI and/or the editor(s). MDPI and/or the editor(s) disclaim responsibility for any injury to people or property resulting from any ideas, methods, instructions or products referred to in the content.

