Abstract
In early 2020, the outbreak of COVID-19 brought a global pandemic, challenging healthcare systems worldwide and prompting countries to implement various measures to contain the spread. These measures, while necessary, led to significant socioeconomic disruptions. One of the most pressing concerns was the strain on healthcare systems, which caused shortages of medical supplies, hospital beds, and healthcare personnel. This raised the prospect of a healthcare system collapse. Using data analysis, we studied how to understand the dynamics of COVID-19 transmission in the context of urban structures, focusing on preventing healthcare system collapse.
1. Introduction
In early 2020, the outbreak of COVID-19 rapidly became a global pandemic, putting immense pressure on healthcare systems worldwide and leading to various containment measures being implemented by nations. While these measures were necessary to control the spread of the virus, they also caused significant disruptions to society. One of the most pressing issues was the strain on healthcare systems, which led to shortages of medical supplies, hospital beds, and healthcare personnel and increased the risk of system collapse. Two research studies have been conducted in this area. The first study, conducted by Sato et al., focused on the impact analysis of COVID-19 on hospital bed availability in Shiga Prefecture, Japan, using a mathematical infectious disease model. The second study was conducted by Hirata et al. to predict the spread and convergence of COVID-19 using deep learning techniques. Both studies analyzed related data and predicted COVID-19 effects without considering urban structures.
Urban areas in Japan are classified into diffuse and intensive urban areas. Diffuse urban areas refer to areas where the development of urban structures disperses from the central region to the surrounding areas. On the other hand, intensive urban areas refer to areas where urban structures develop intensively from the central region. In this study, we focused on Kumamoto Prefecture, Japan, which falls into the intensive urban category [1]. There is a risk of inadequate medical services due to a critical shortage in the medical field and the collapse of the healthcare system. The Japanese healthcare system will likely collapse when the hospital bed occupancy rate exceeds 50%. This rate is chosen based on the welfare index of infection status proposed by the Ministry of Health, Labor, and Welfare of Japan in 2020 [2]. The standard changes annually starting in 2020, and starting in 2022, a bed occupancy rate of 50% or less is considered appropriate.
In this research, we explored how COVID-19 spread within various urban structures and focused on maintaining the resilience of the healthcare system by keeping the bed occupancy rate below 50%. This paper details the data collection from Kumamoto Prefecture, the data analysis, and the evaluation of two models.
2. Data Collections
In this research, we focused on intensive urban structure and collected all related data on Kumamoto Prefecture. Eight types of data were collected, including the number of infected individuals, hospitalized individuals, hospital beds, severely ill individuals, deaths, number of vaccinations, average temperatures, and changes in the mobility trends of visitors to specific locations (grocery stores, parks, etc.) over time. We collected two significant policies implemented in Japan.
The first was the declaration of a state of emergency [3]. This policy is based on the Law on Special Measures against the New Coronavirus, enacted on 13 March 2020. The prime minister declared the period and area where emergency measures could be used in the event of a nationwide and rapid spread of the virus, which could profoundly impact the lives of the people and the economy. The prefectural governor of the study area may request residents to refrain from leaving their homes and cooperate in other ways necessary to prevent the spread of the disease, except when necessary to maintain their livelihood. In addition, the governor may request or give instructions to close schools and restrict the use of facilities that attract large numbers of people, such as department stores and movie theaters, and may use land or buildings for the construction of temporary medical facilities when particularly necessary without the consent of the owners. The second policy is the Law on Priority Measures for the Prevention of the Spread of Disease [4]. Priority measures for the prevention of the spread of new coronavirus infection are region-specific efforts to prevent the spread of new coronavirus infection. The government publicly announces these measures for specific areas where the spread of infection is likely to have a significant impact on people’s lives and the economy, and where there is a risk of disruption to the medical system and public health. Specific measures include restrictions on eating and drinking establishments, use of facilities, events, etc., as well as requests to go out, travel, and go to work.
2.1. Infected Individuals, Hospitalizations, and Bed Capacities
The number of infected individuals, hospitalized individuals, hospital beds, severely ill individuals, and fatalities were collected for this study. The data were compiled based on the data from the Health Information and Response System for Individuals Infected with New-type Coronavirus (HER-SYS) provided by the Ministry of Health, Labor, and Welfare [5,6,7]. The period of data collection was from 16 January 2020 to 8 May 2023.
2.2. Vaccination Rate
The vaccination rate for seven doses was collected. The data was compiled based on the Vaccination Record System (VRS) provided by Digital Agency [8] for 12 April 2021 to 16 November 2023.
2.3. Average Temperature
The average temperatures in Kumamoto Prefecture were collected from 9 May 2020 to 9 May 2023, and they were provided by the Japan Meteorological Agency [9].
2.4. Mobility Changes
The rate of change in mobility trends of visitors to specific locations (grocery stores, parks, etc.) from 1 January 2022 to 1 October 2022 was collected. Google’s Community Mobility Report [10] was used to aggregate anonymous mobility data from Google Maps. The data showed how visitors to (or time spent at) places classified in each category changed compared to the base value for each day of the week. The details of the reference values and locations were as follows.
The base value was the median value by day of the week from 1 March 2020 to 2 June 2020 (5 weeks) in Kumamoto Prefecture (the period just before people’s behavior changed in response to COVID-19). Study locations include grocery stores, parks, train stations, retail and entertainment (restaurants, cafes), residences, and workplaces.
3. Data Analysis
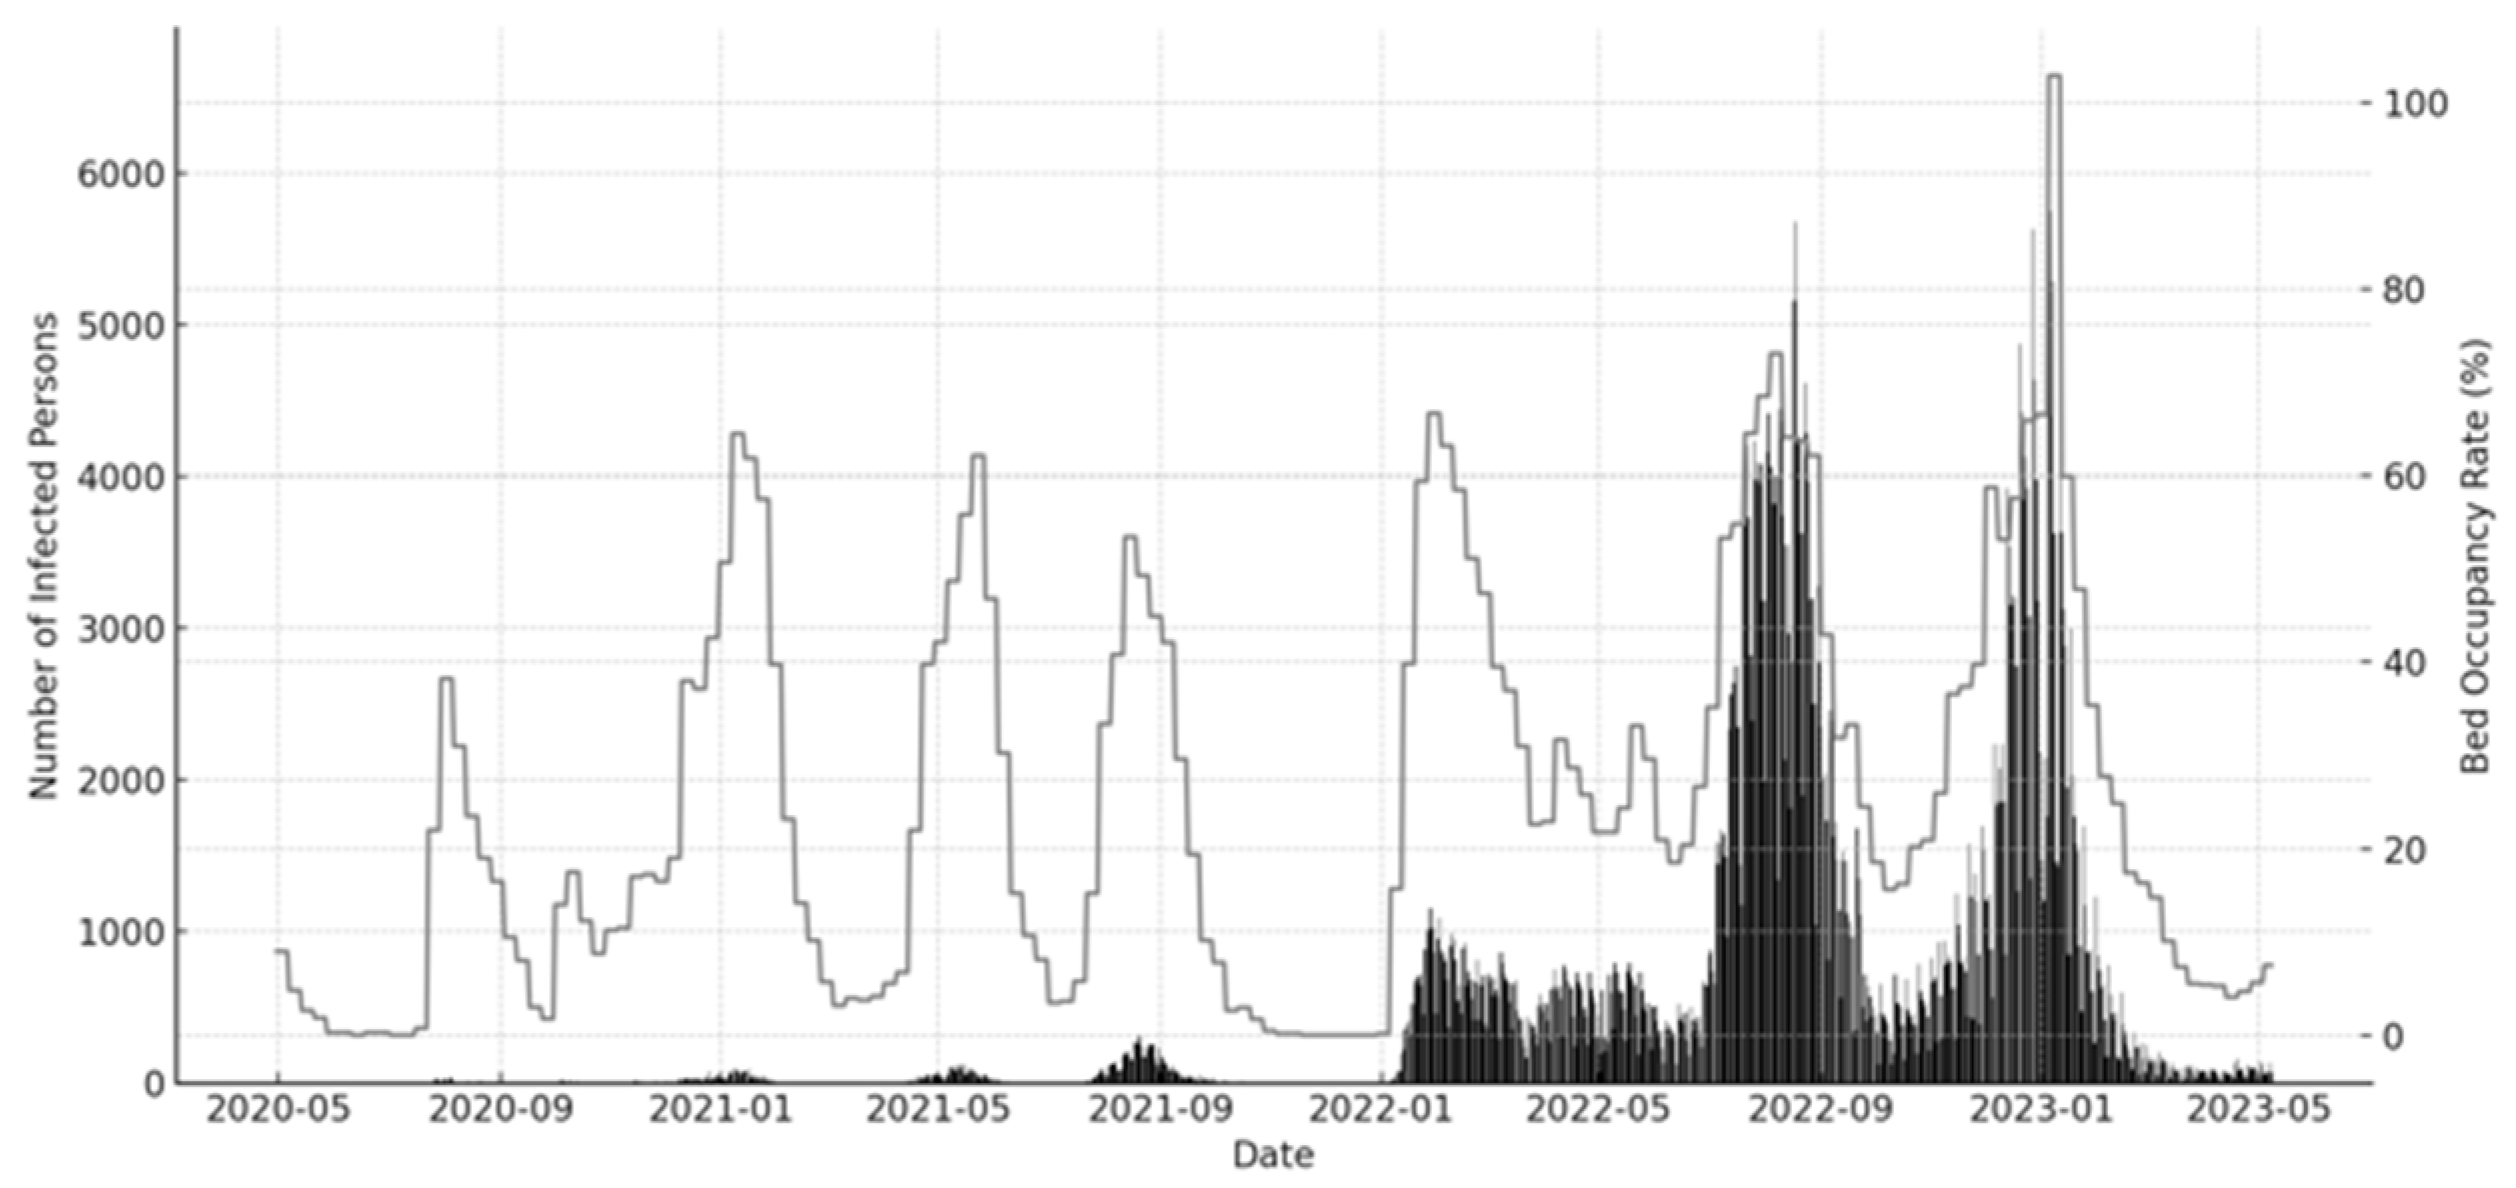
We visualized the data. Figure 1 displays the correlation between infected individuals and hospital bed occupancy rate. The result indicated a direct correlation, highlighting the critical influence of infection rates on the utilization of hospital resources. The bed occupancy rate exceeded 50% six times throughout the entire period.
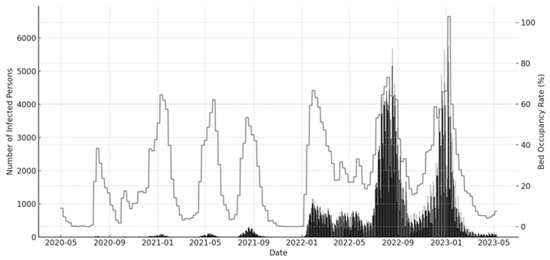
Figure 1.
COVID-19 infected individuals and bed occupancy rate.
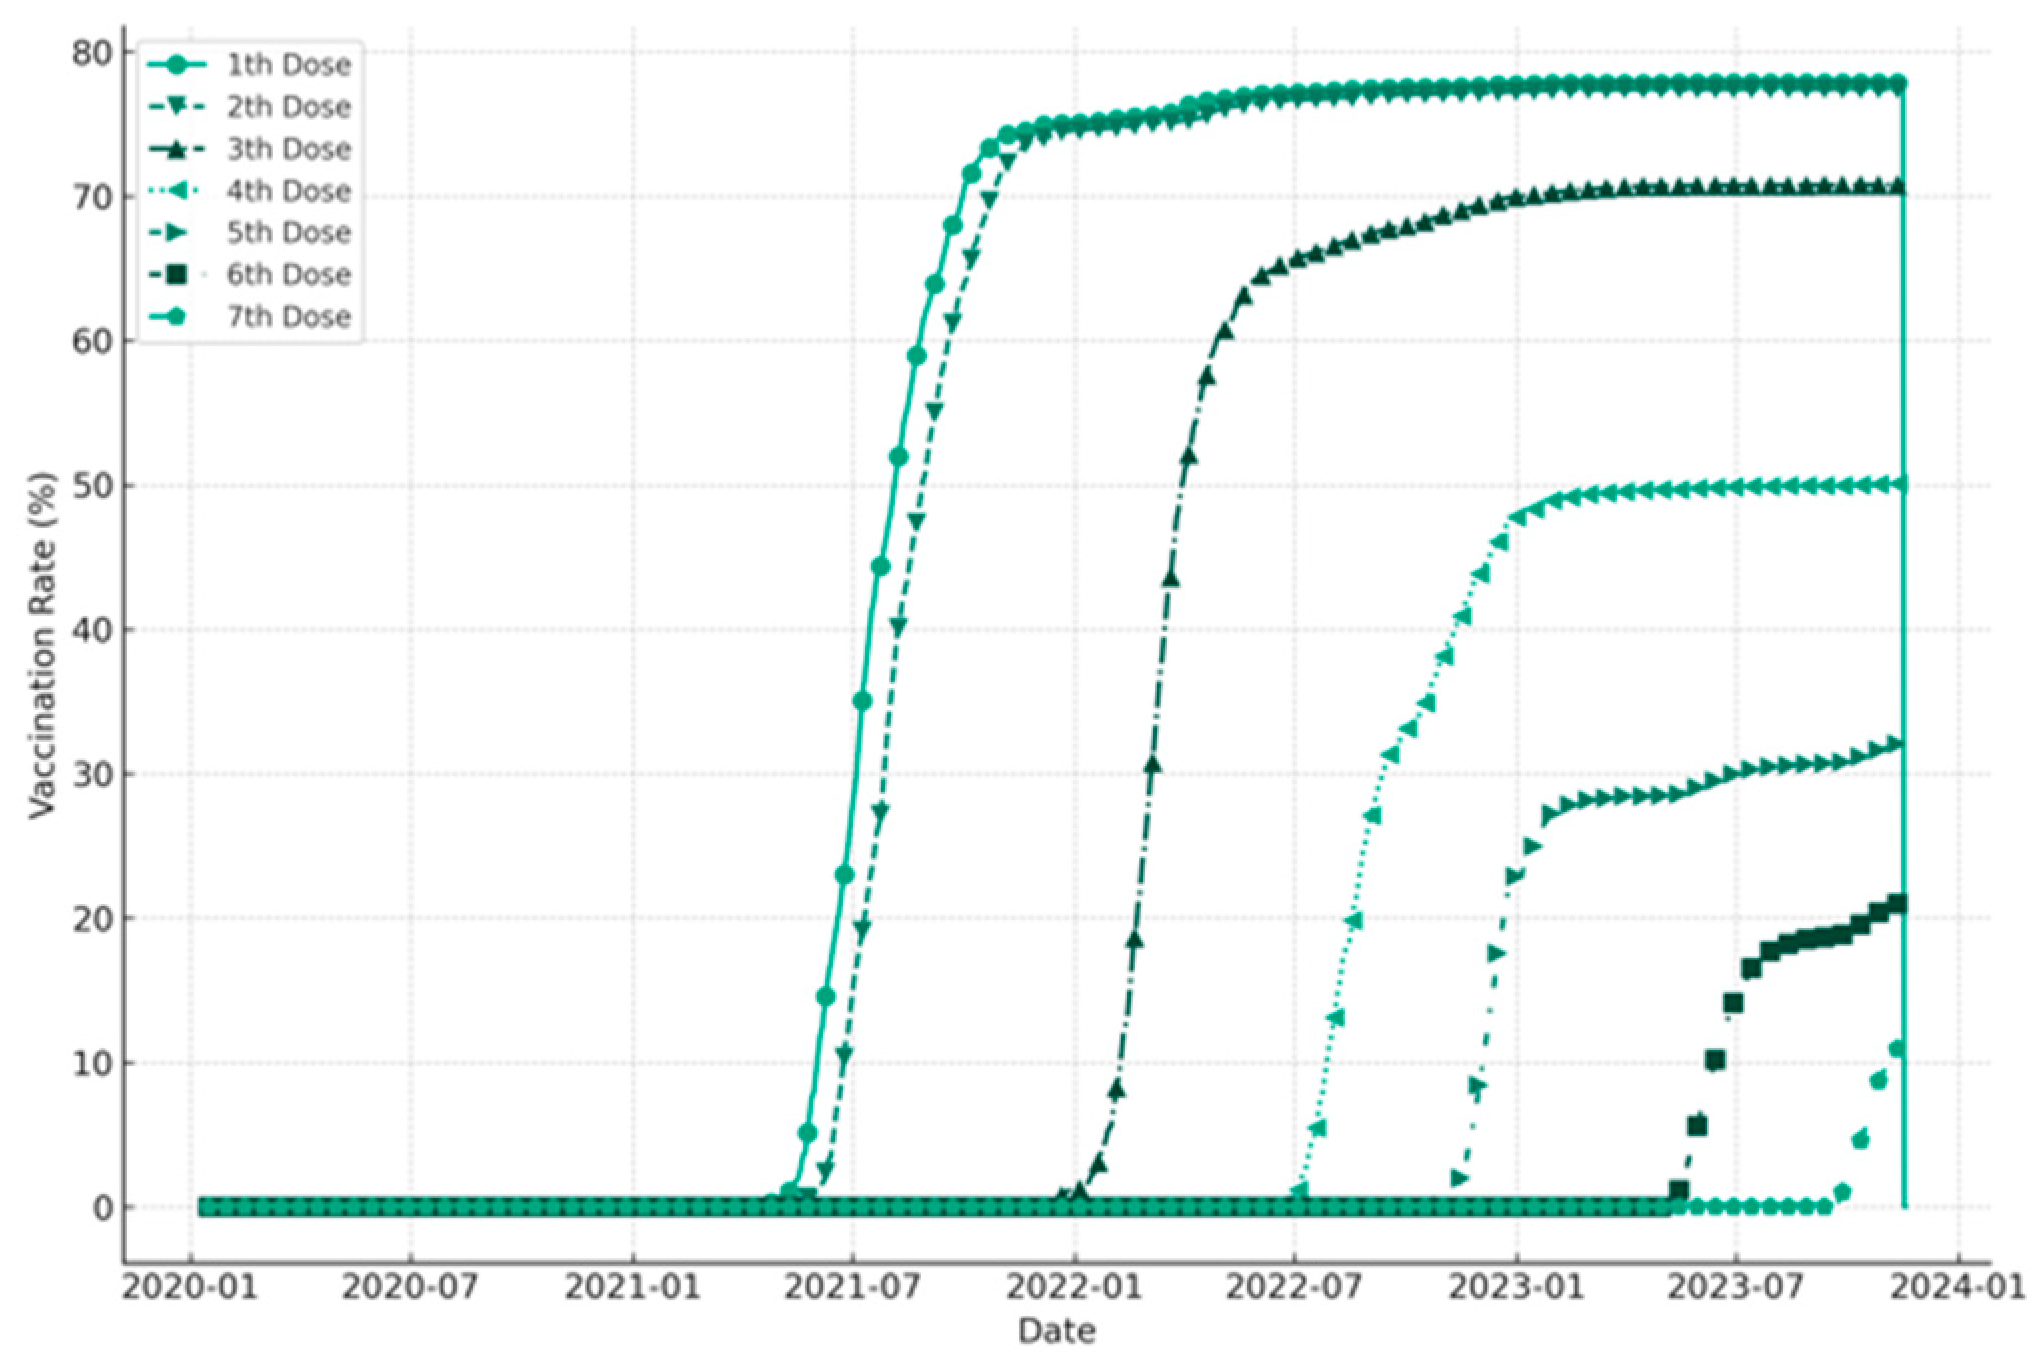
This finding is noteworthy given the current state of the world, where the COVID-19 pandemic has strained healthcare systems worldwide. It underscored the importance of taking measures to reduce the spread of the virus and ensure that hospital resources are available to those who need them the most. We plotted the vaccination rate from the first to the seventh dose over time (Figure 2). The data showed that up to the second dose, about 80% of the population was vaccinated. High vaccination rates are essential to curb the spread of the virus and reduce the burden on healthcare systems. However, there were still significant disparities in vaccination rates between different regions and demographic groups to achieve herd immunity.
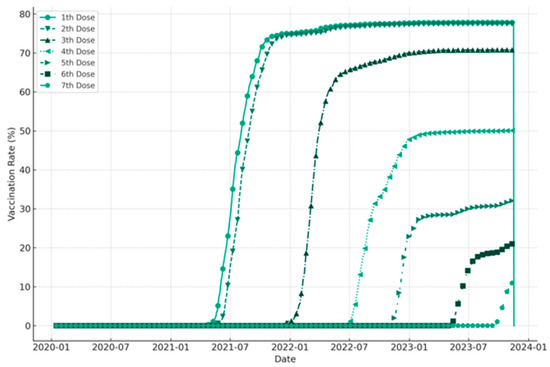
Figure 2.
Vaccination rate over time.
We analyzed the relationship between mobility changes and average temperature. Increasing human movement affected the number of new infections. The data for average temperature and mobility changes is illustrated in Figure 3.
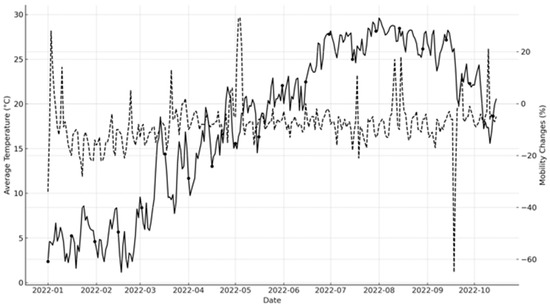
Figure 3.
Average temperature and mobility change over time.
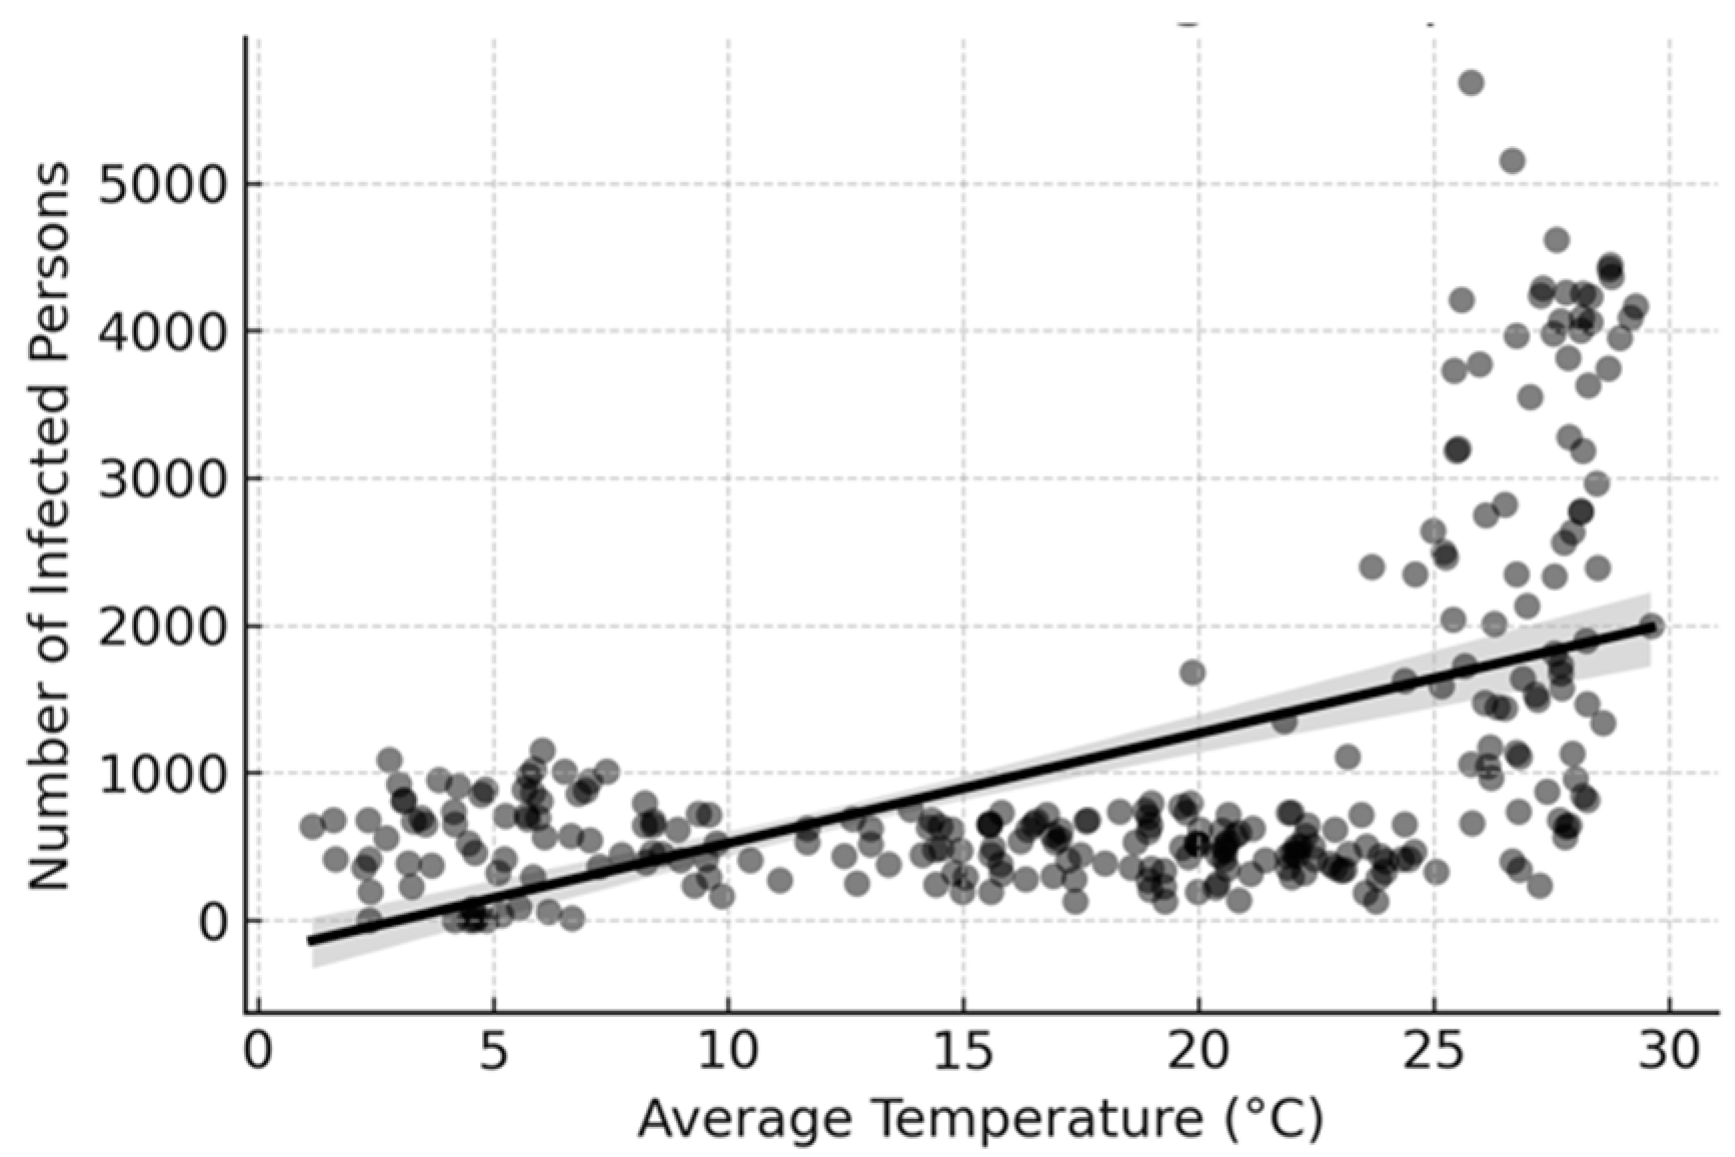
This finding highlights the importance of considering external factors that influence the spread of the virus such as mobility patterns and environmental conditions. It also emphasizes the need for targeted interventions that consider these external factors to curb the spread of the virus effectively. To better understand the data visualized above by focusing on the correlation between infected individuals and average temperature, we analyzed a linear trend, and the result suggested that higher temperatures were associated with higher reported infections (Figure 4). This reflected seasonal variations in virus transmission or testing behavior. The seasonal variation in virus transmission was more significant than expected. It also underscores the importance of considering external factors such as temperature when developing public health interventions to address the pandemic.

Figure 4.
Correlation between infected individuals and average temperature.
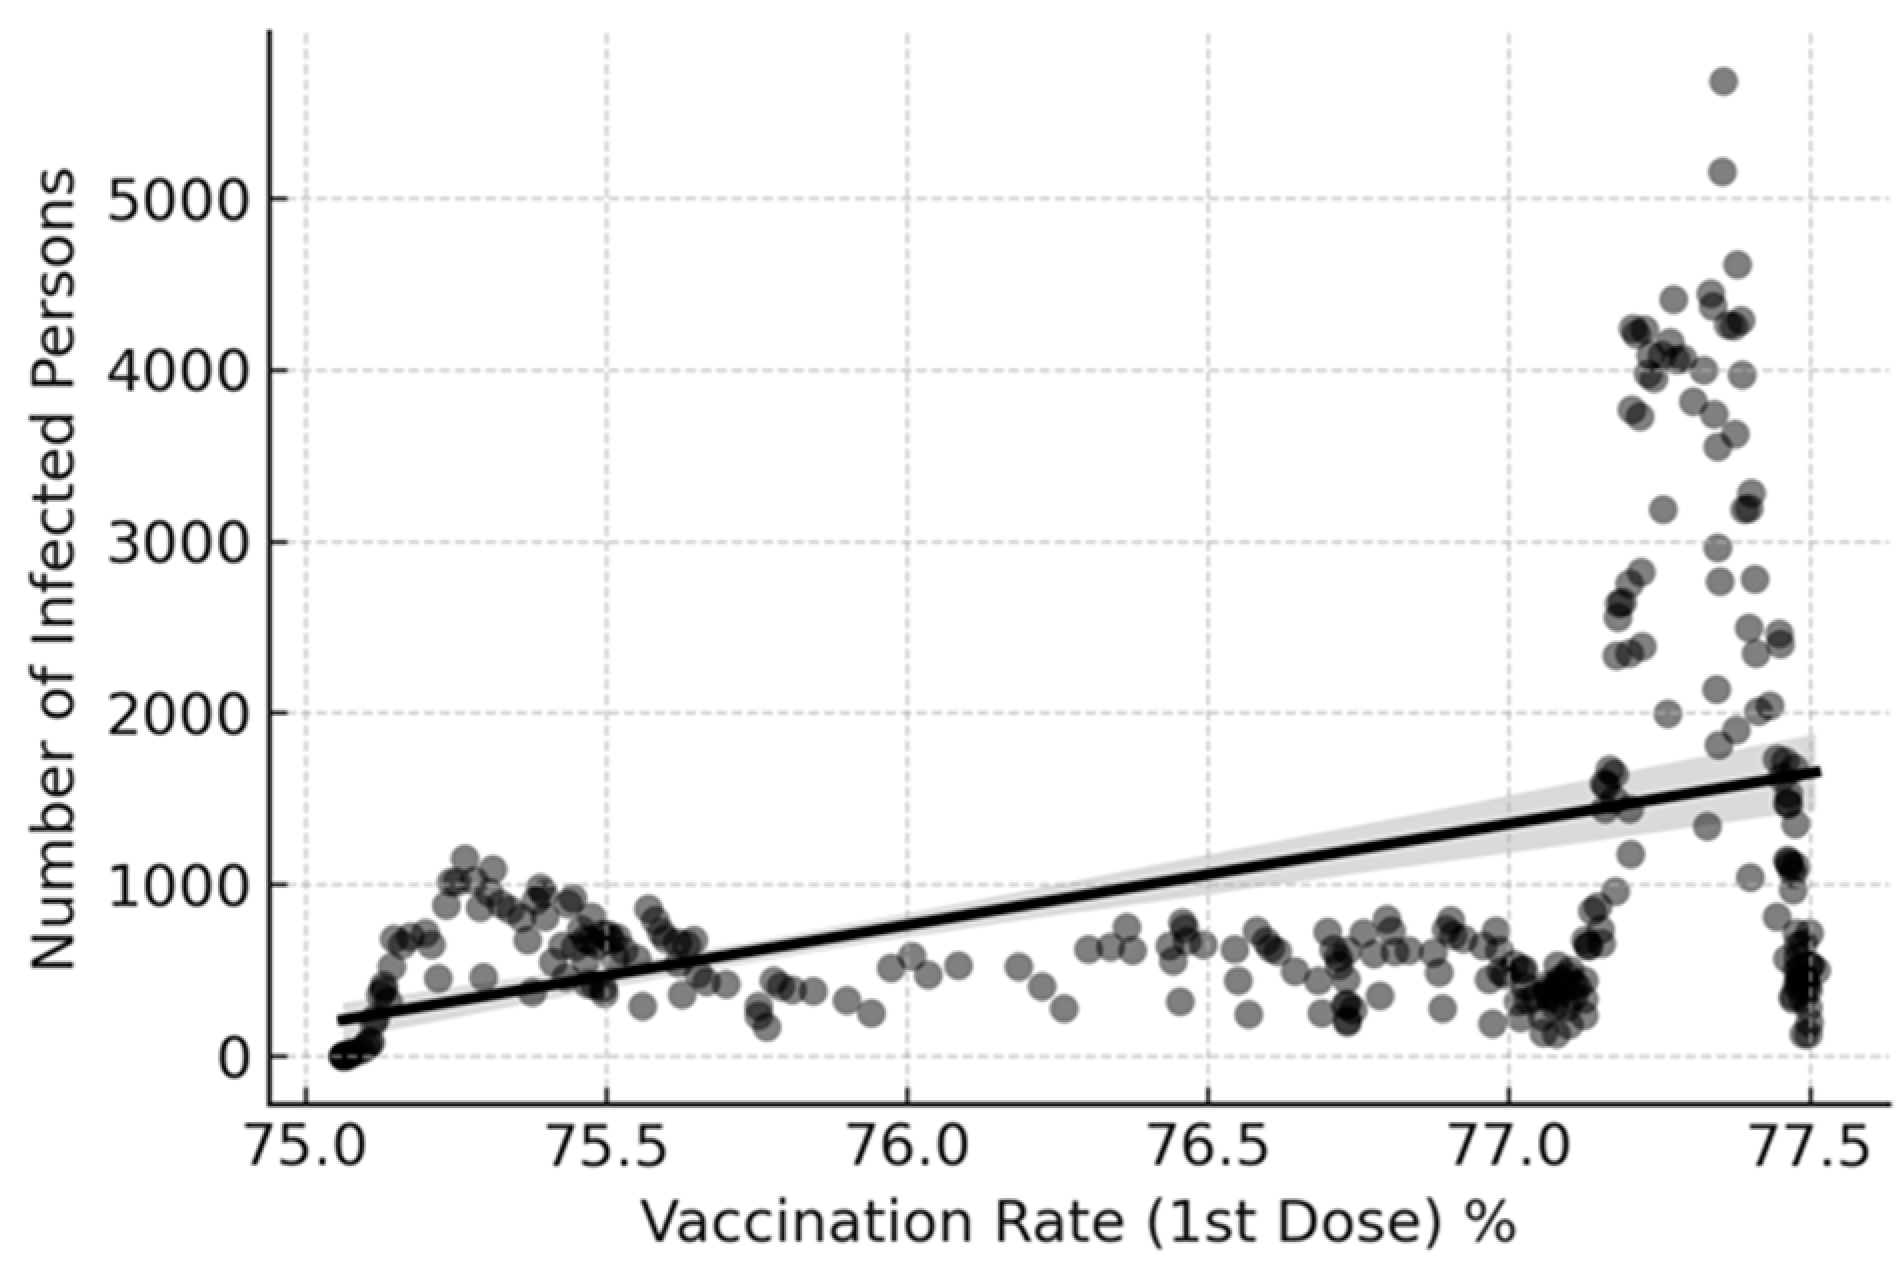
We analyzed the correlation between infected individuals and vaccination rate (1st dose) as shown in Figure 5. The moderate positive correlation suggested that as the vaccination rate increased, so did the number of reported infections. This could be due to increased testing alongside vaccine rollout efforts or a reflection of peaks in reporting as vaccines became available. This finding highlights the need to be cautious when interpreting data related to vaccination rates and infection rates. While high vaccination rates are critical in curbing the spread of the virus, external factors such as testing behavior must be taken into account when interpreting these data.

Figure 5.
Correlation between infected individuals and vaccination rate (1st dose).
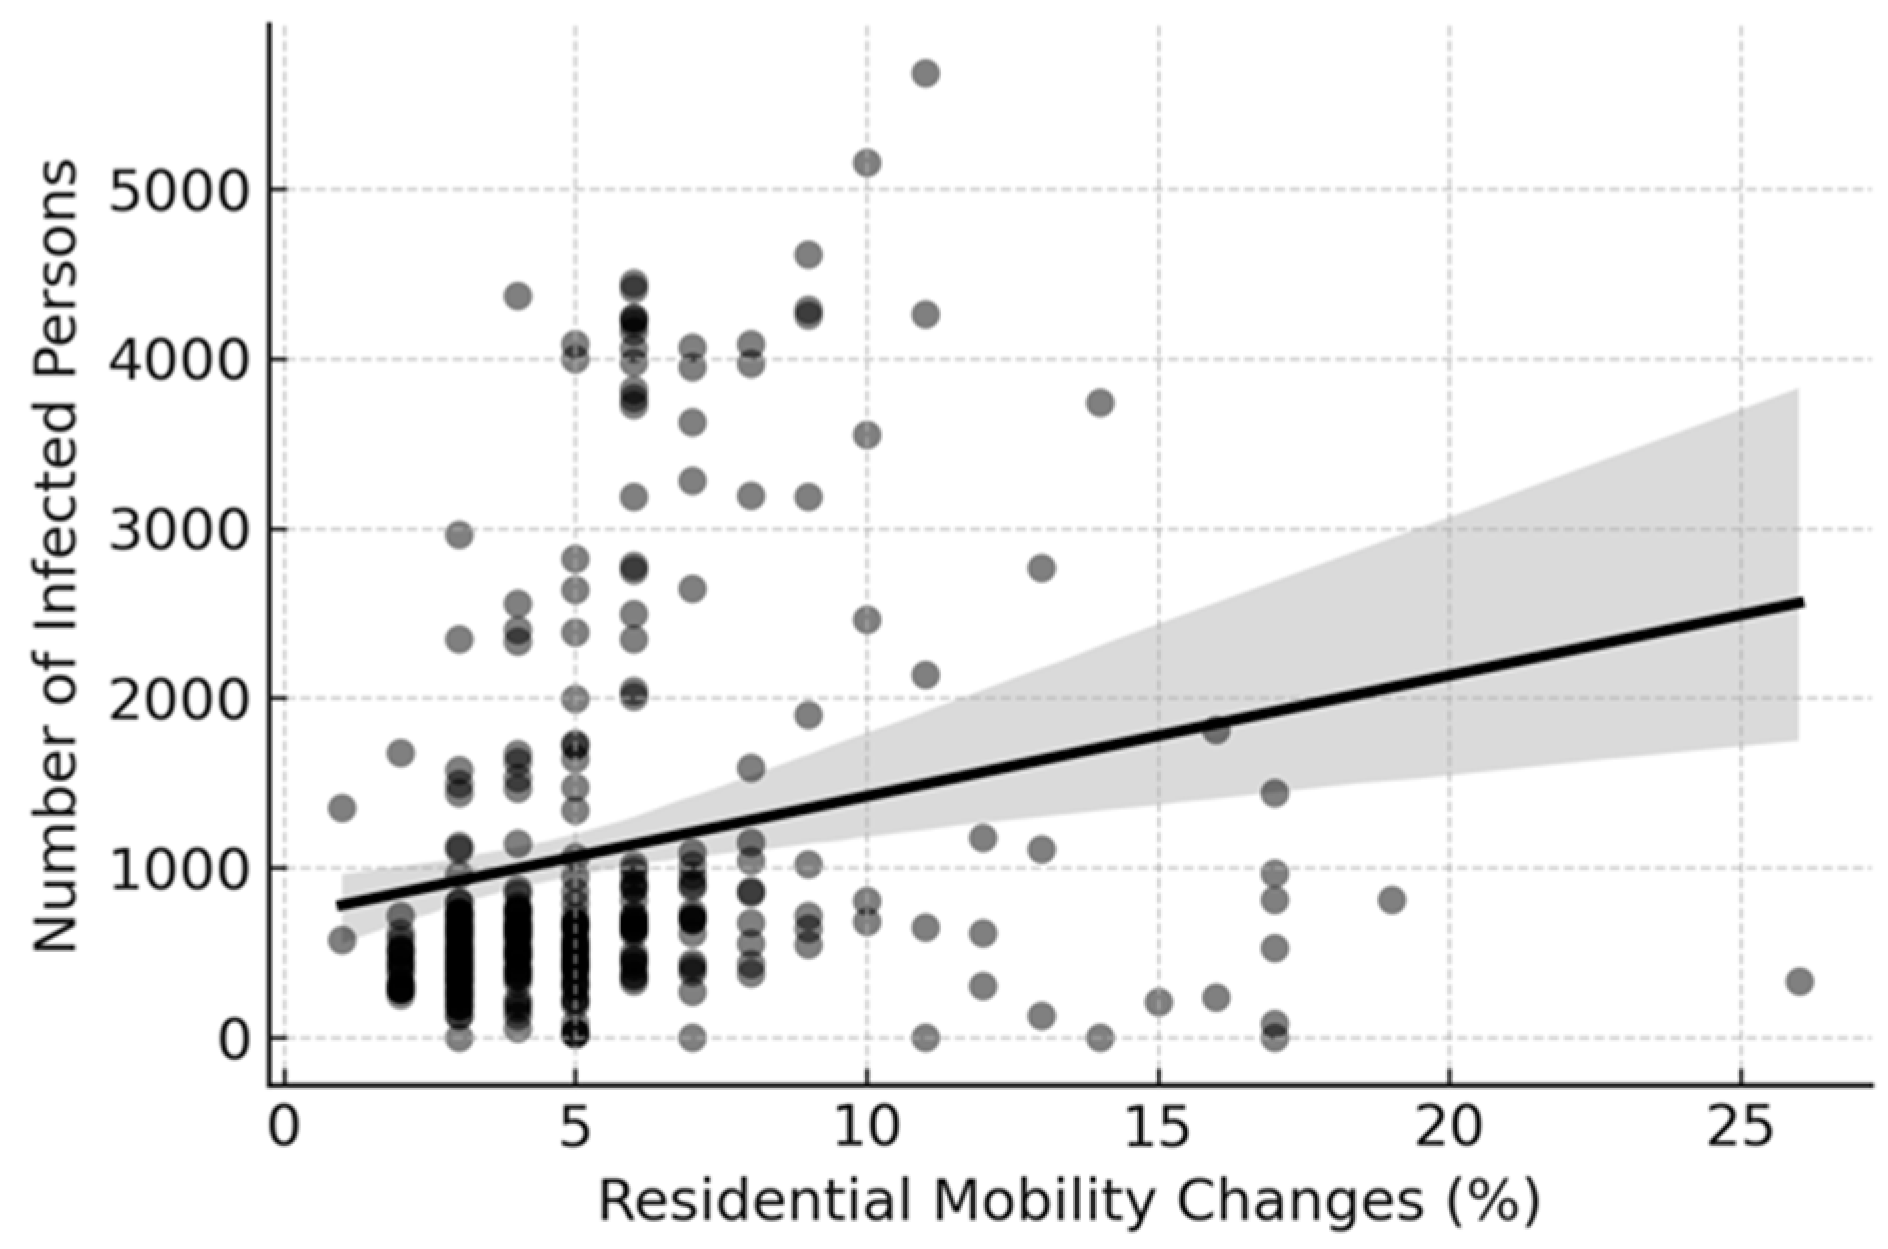
Finally, we investigated the correlation between residential mobility and infection (Figure 6). Higher residential stay percentages coincided with lockdown periods and were correlated with increased infection rates. The positive correlation was more visible, implying that the higher residential stay percentage (during lockdowns) was associated with more reported infections. This reflected the pattern of outbreaks leading to stricter homestay measures. This finding underscores the importance of targeted interventions and external factors such as mobility patterns to reduce the spread of the virus effectively. It also highlights the need for policymakers to balance lockdown measures’ economic and public health impacts to address the pandemic effectively.
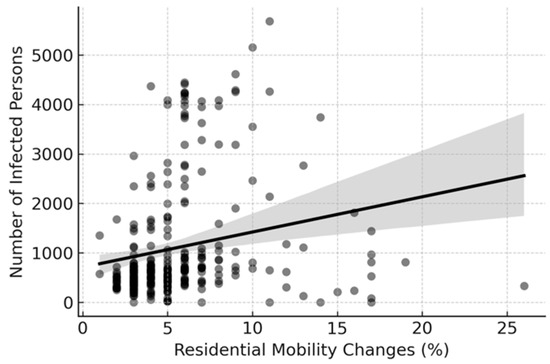
Figure 6.
Correlation between infected individuals and mobility changes.
4. Model Development
We evaluated the effectiveness of the linear regression and Random Forest models in predicting hospital bed occupancy rates. The models were analyzed using various predictors, including mobility data, vaccination rates, weather conditions, and demographic factors. Performance metrics such as Mean Squared Error (MSE) and R-squared values are reported.
The four steps to evaluate the models included the following:
- Feature Selection: relevant features were selected based on the correlation and time series analysis conducted in the previous session;
- Data Preparation: the data were split into training and testing sets to validate the model’s performance;
- Model Training: the model was trained on the training data;
- Model Evaluation: the model was evaluated using appropriate metrics such as R-squared and Mean Squared Error;
4.1. Linear Regression Model
We constructed a linear regression model to predict the bed occupancy rate and understand the direct linear relationships between the predictors, such as mobility changes, the number of infected individuals, weather, the response variable, and the bed occupancy rate. The model showed a mean square error (MSE) of 51.25. This value represents the average squared difference between the actual and predicted bed occupancy rates. A lower MSE indicates a better fit of the model to the data. Although the absolute number might seem high, it is more relevant when compared to the variance in bed occupancy rates. The R-squared (R2) was 0.834. This metric indicates how well the features in the model explain the variability in bed occupancy rate. An R2 of 0.834 suggested that the model explained approximately 83.4% of the variability in bed occupancy rate, which was good for complex real-world data.
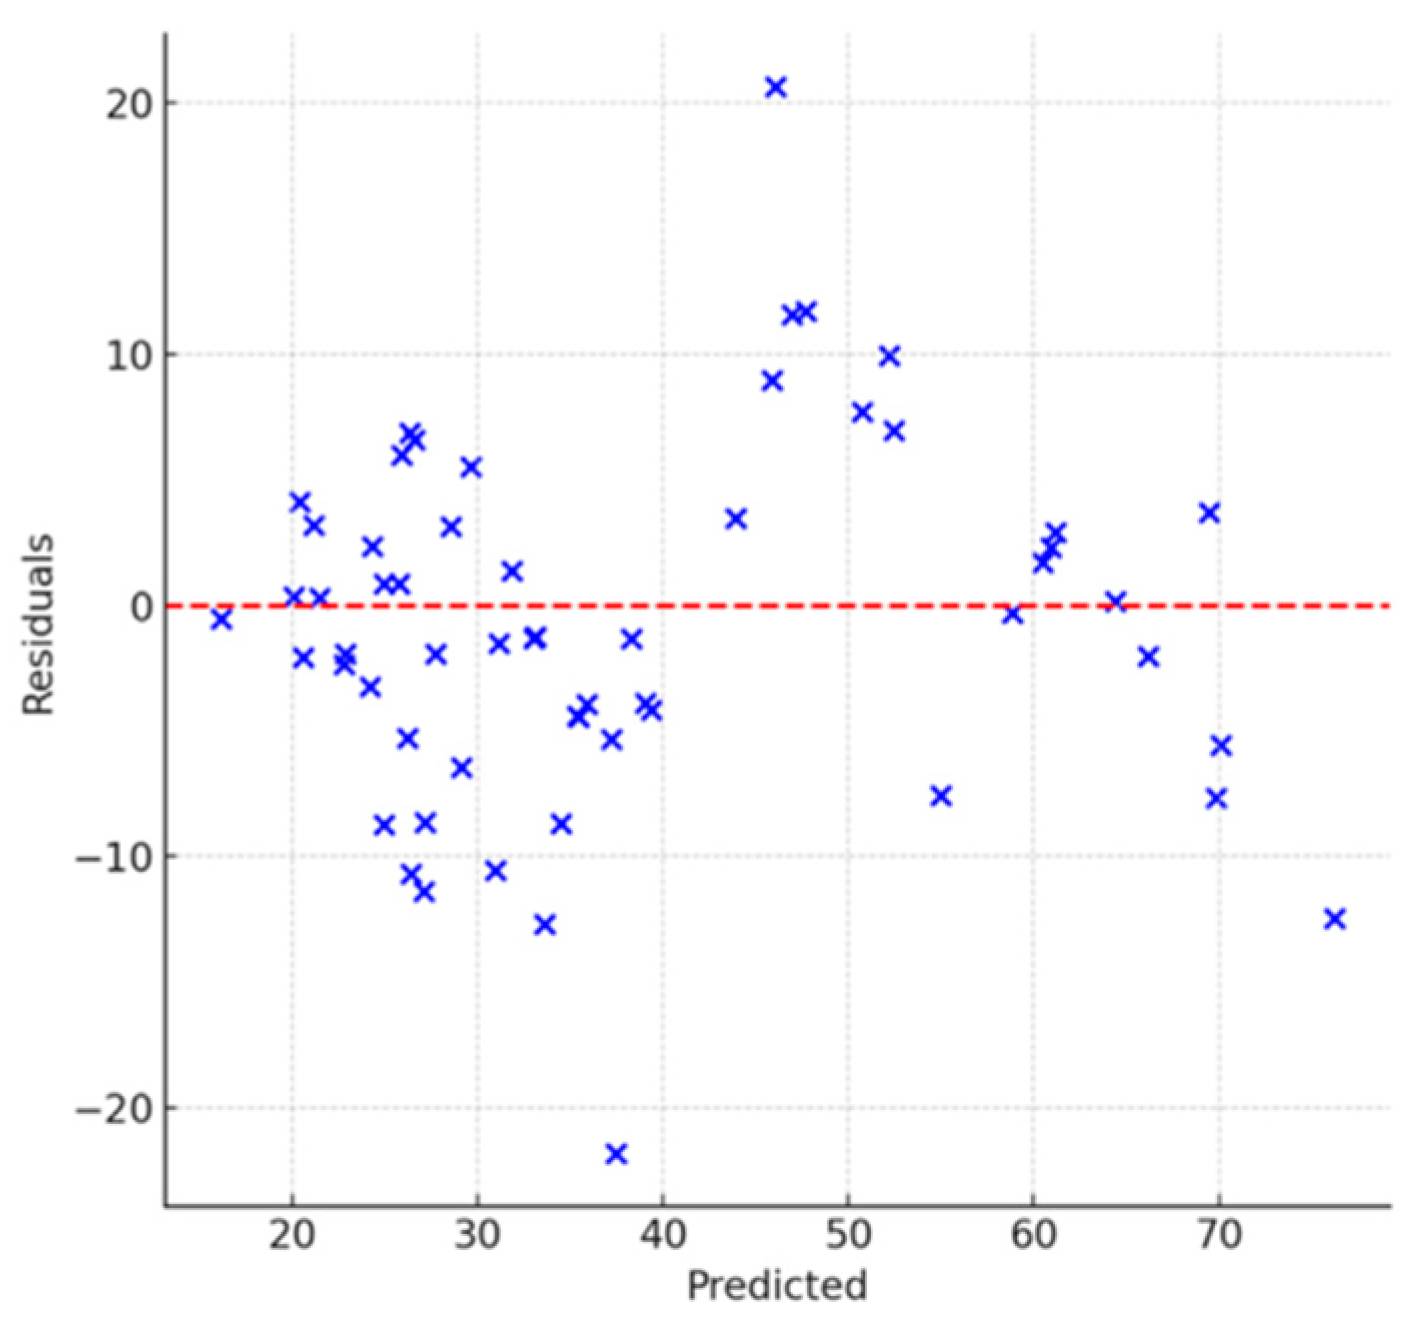
Next, we visualized the linear regression model results to explore its performance and the nature of the errors. Figure 7 shows the result of checking the residuals (errors) distribution to indicate nonlinearity or heteroscedasticity. The residuals are scattered around the horizontal line at zero without apparent pattern or systematic deviation. This indicates that the model does not suffer from nonlinearities or heteroscedasticity (i.e., the variance of the residuals is constant across all levels of prediction). There are a few points further from the line, indicating several predictions with higher errors, which could be outliers or instances where the model assumptions fail.
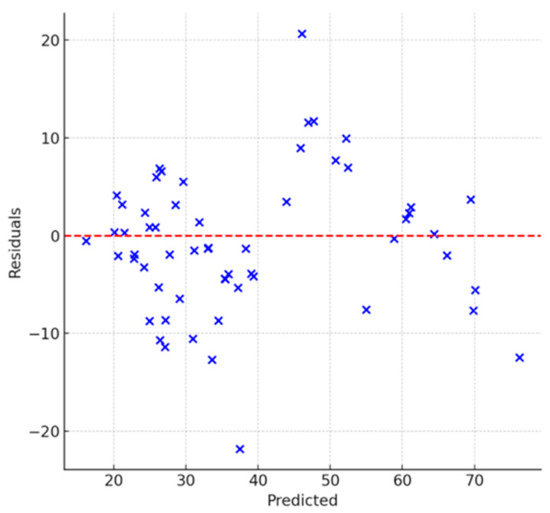
Figure 7.
Analysis of model evaluation for residuals vs predicted.
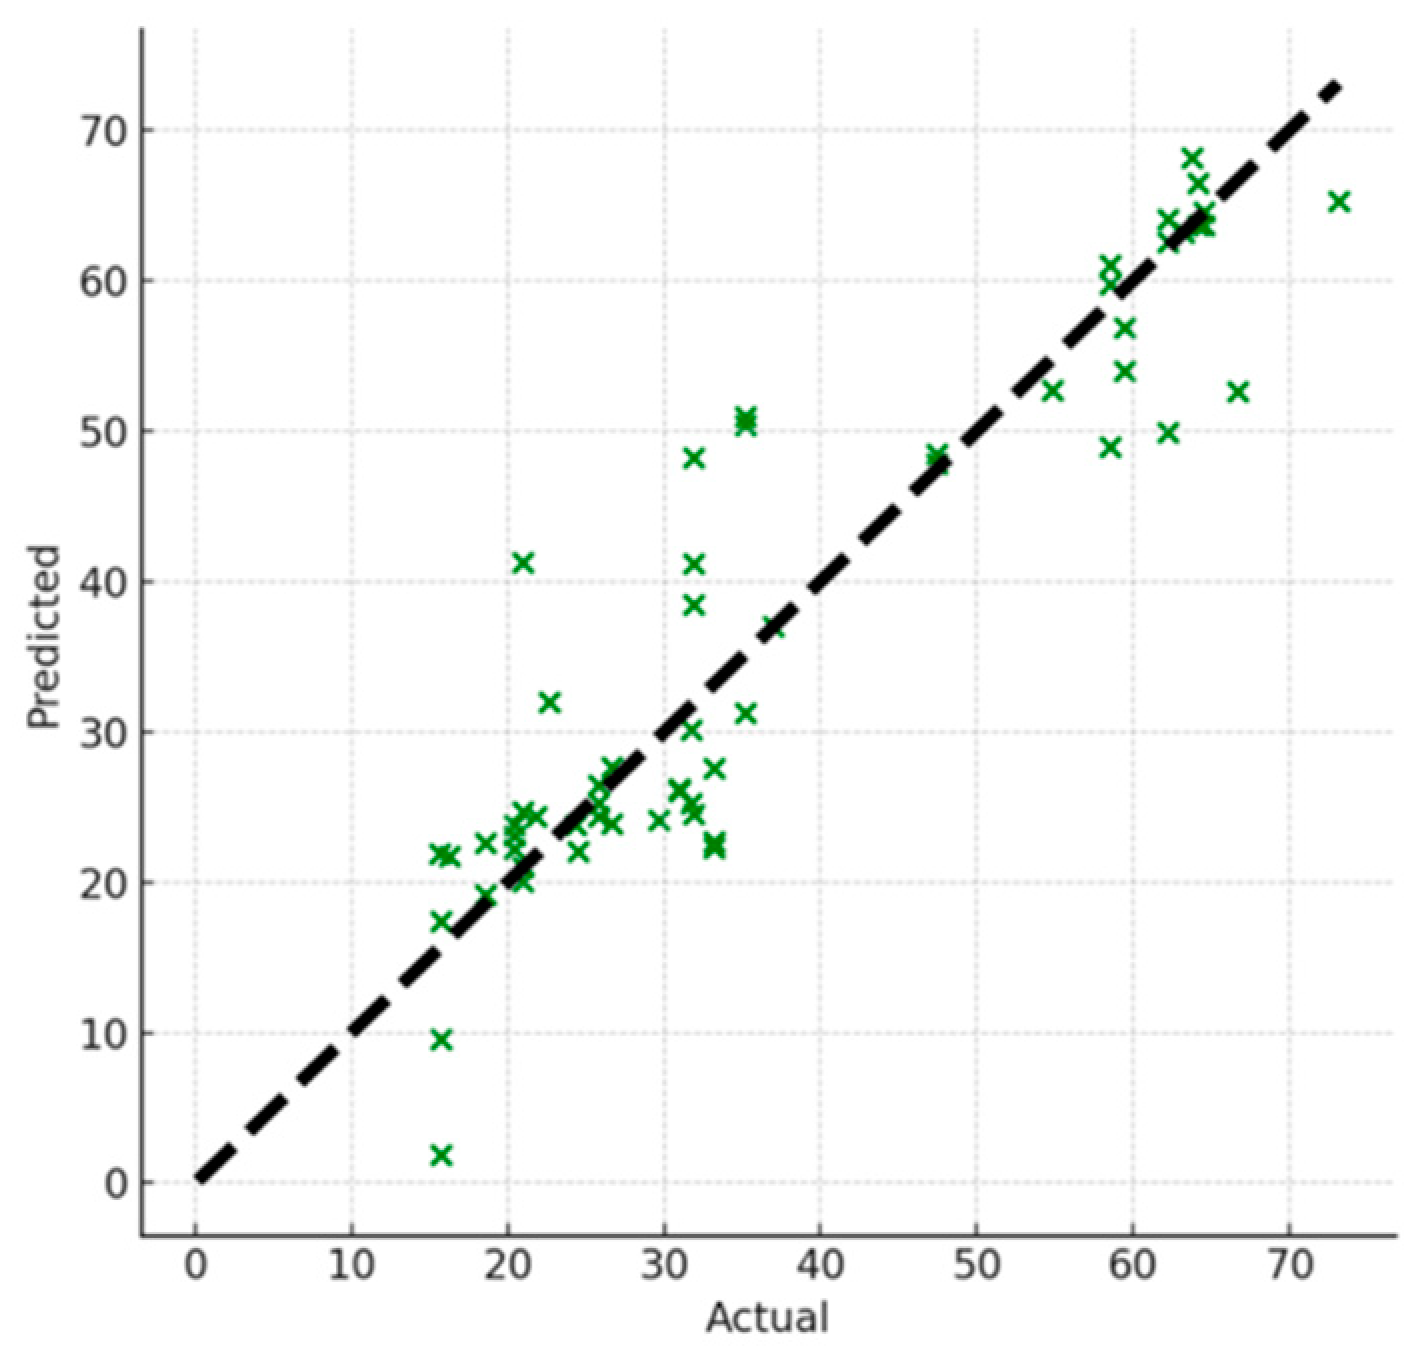
Figure 8 shows the prediction results vs actual data to assess the model. The points are generally close to the diagonal line, showing that the predicted values are reasonably close to the actual values across the range. The model performed consistently across different values of the target variable with a slight deviation at higher actual values where the model underpredicted the occupancy rate. The linear regression model performed well given the complexity of the dataset and the relationships involved. However, models such as Random Forest can capture subtler interactions and nonlinearities not accounted for by linear regression.
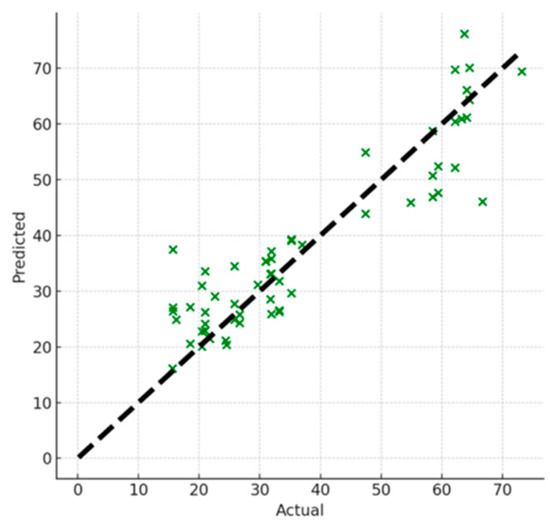
Figure 8.
Analysis of model evaluation for predicted vs actual.
4.2. Random Forest Model
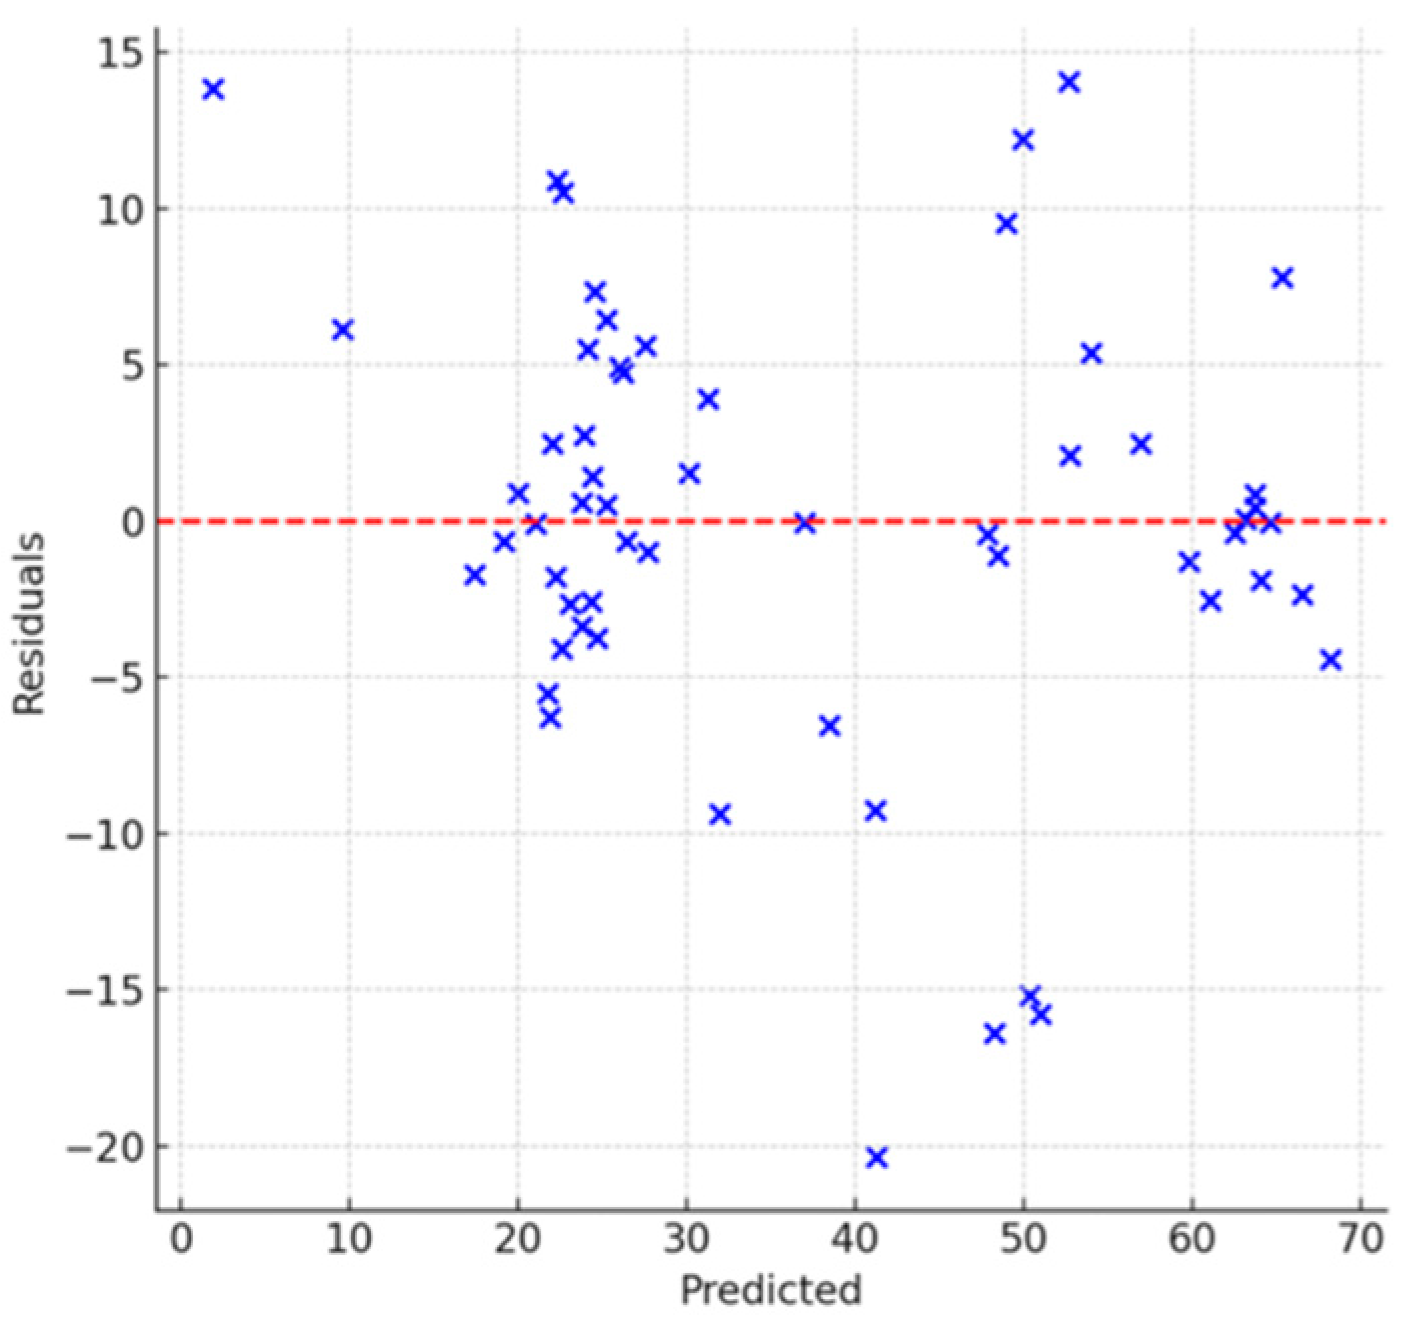
Random Forest is a robust ensemble method that performs well on complex datasets by effectively handling nonlinearities and feature interactions. The model showed an MSE of 48.02, indicating better results than the linear regression model. An R2 of 0.844 suggested that the model explained approximately 84.4% of the variability in the bed occupancy rate, which is an improvement over the linear model. The residuals are randomly distributed around the zero line, suggesting that the Random Forest model does not exhibit systematic errors (Figure 9). No clear patterns indicate heteroscedasticity or nonlinearity. A few outliers exist where the model predictions deviate significantly from actual values due to unusual cases or noise in the data.
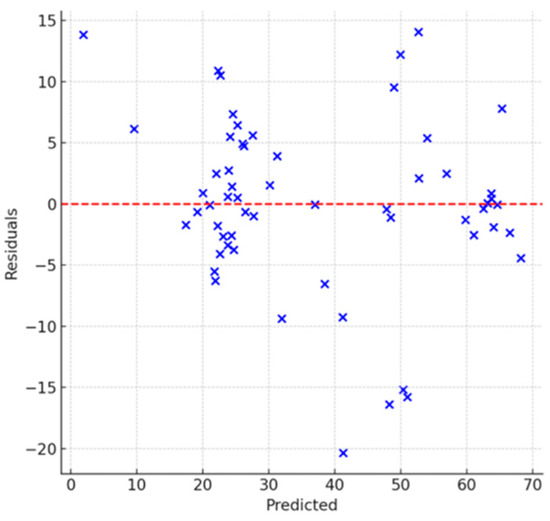
Figure 9.
Analysis of model evaluation for residuals vs predicted.
The points closer to the diagonal line indicate better agreement between the predicted and actual values (Figure 10). The model was consistent across the range of bed occupancy rates. However, there were under or over-predictions at higher rates. The Random Forest model performed better than the linear regression model and effectively handled the data in this study.

Figure 10.
Analysis of model evaluation for predicted vs actual.
5. Conclusions
We conducted data analyses highlighting the importance of urban structures in managing the COVID-19 pandemic and preventing the collapse of healthcare systems. The findings suggested that a nuanced approach to pandemic preparedness and response is necessary with urban-specific strategies considering local conditions and infrastructure as crucial. The findings provide knowledge to safeguard public health and healthcare systems against pandemics in urban settings. We compared the effectiveness of two models, linear regression and Random Forest in predicting hospital bed occupancy rates. We evaluated the models using various predictors, such as mobility data, vaccination rates, weather conditions, and demographic factors. The Random Forest model showed an R2 of 0.844, indicating that the model explained approximately 84.4% of the variability in the bed occupancy rate. This was a significant improvement over the linear model.
Author Contributions
Conceptualization, A.A.; methodology, R.G. and A.A.; software, A.A.; validation, R.G. and A.A.; formal analysis, R.G. and A.A.; data curation, R.G. and A.A.; writing—original draft preparation, R.G. and A.A.; writing—review and editing, A.A; visualization, R.G. and A.A.; supervision, A.A. All authors have read and agreed to the published version of the manuscript.
Funding
This research received no external funding.
Institutional Review Board Statement
Not applicable.
Informed Consent Statement
Not applicable.
Data Availability Statement
The secondary data that were used for analysis in this study are available from the corresponding author upon request.
Conflicts of Interest
The authors declare no conflicts of interest.
References
- Ministry of Land, Infrastructure, Transport and Tourism. Compact Town Development Based on Public Transportation. Available online: https://www.mlit.go.jp/common/001095208.pdf (accessed on 17 March 2024).
- “Indicators for Determining COVID-19 Level” such as Hospital Bed Usage Rate by Prefecture. Available online: https://www3.nhk.or.jp/news/special/coronavirus/level/ (accessed on 17 March 2024).
- First State of Emergency Declaration. Available online: https://www3.nhk.or.jp/news/special/coronavirus/emergency/ (accessed on 17 March 2024).
- What Are the Priority Measures to Prevent the Spread? Available online: https://www.kaonavi.jp/dictionary/manenboshitojyutensochi/ (accessed on 17 March 2024).
- Ministry of Health, Labor and Welfare. New Coronavirus Infection Situation from Data. Available online: https://covid19.mhlw.go.jp/ (accessed on 17 March 2024).
- Ministry of Health, Labor and Welfare. Survey on Medical Treatment Status, Number of Inpatient Beds, etc. Available online: https://www.mhlw.go.jp/stf/seisakunitsuite/newpage_00023.html (accessed on 17 March 2024).
- Ministry of Health, Labor and Welfare. Press Release Materials Regarding the New Coronavirus Infection. Available online: https://www.mhlw.go.jp/stf/seisakunitsuite/bunya/0000121431_00438.html (accessed on 17 March 2024).
- Digital Agency. New Coronavirus Vaccination Status. Available online: https://info.vrs.digital.go.jp/dashboard (accessed on 17 March 2024).
- Japan Meteorological Agency. Historical Weather Data Resource. Available online: https://www.data.jma.go.jp/risk/obsdl/ (accessed on 17 March 2024).
- Google. Community Mobility Reports. Available online: https://www.google.com/covid19/mobility// (accessed on 17 March 2024).


Disclaimer/Publisher’s Note: The statements, opinions and data contained in all publications are solely those of the individual author(s) and contributor(s) and not of MDPI and/or the editor(s). MDPI and/or the editor(s) disclaim responsibility for any injury to people or property resulting from any ideas, methods, instructions or products referred to in the content. |
© 2024 by the authors. Licensee MDPI, Basel, Switzerland. This article is an open access article distributed under the terms and conditions of the Creative Commons Attribution (CC BY) license (https://creativecommons.org/licenses/by/4.0/).