Proceeding Paper

Industrial Metabolism MFA Model Applied in a Startup in Canada †

by
Jorge Hernán Torres-Berrío
1 and
Miguel Ángel Ospina Usaquén
2,*
1
Science and Arts Faculty, Université de Montréal, Montréal, QC H3T 1J4, Canada
2
Production Engineering Program, Faculty of Technology, Universidad Distrital Francisco José de Caldas, Bogotá 111941, Colombia
*
Author to whom correspondence should be addressed.
Presented at the 1st International Conference on Industrial, Manufacturing, and Process Engineering (ICIMP-2024), Regina, Canada, 27–29 June 2024.
Eng. Proc. 2024, 76(1), 11; https://doi.org/10.3390/engproc2024076011
Published: 16 October 2024

Abstract

:
Industrial metabolism is a recent field of research in engineering and sustainability. Its practical objective is to provide structural solutions to organizations and regulate the productive, ecological, and economic system. Due to being a relatively new topic and without a known pattern, the present research adapts the 4R (resources) urban metabolism MFA model developed at ETH in Switzerland by Professor Peter Baccini and applies it to a Canadian food startup (Missfresh). Within the adjusted model, clean production tools, circularity plans, ecological design, inventory flow analysis, and the four general study variables (materials, infrastructure, impacts, and standards) were used for solutions within the company. This research seeks two academic results: the metabolic map (static–dynamic animation) that describes the behavior of the company during a period of time, and the industrial metabolism model adapted and validated for subsequent applications. In practical results, the impacts of the model in the 3Es of sustainability in the industry and the sector are evaluated: ecology, ergonomics, and economy. This research is conducted within the framework of an internship to obtain a master’s degree in Sustainable Development and Environment at the University of Montreal.

1. Introduction

One of the current challenges of industry is to reduce its environmental problems. In North America, according to the US EPA (Environmental Protection Agency), about 42% [1] of the impacts correspond to the “quiet pollution” of industry of multiple pollutants, of which, in Canada, 70% are produced by SMEs (small and medium enterprises) [2]. In Canada, an industrial and entrepreneurial sector that has gained a market in the last five years is the “Meal Kits” food startup, Prêt à manger. The objective of this business is to sell recipes and their high quality ingredients online, and send them to their customers in cardboard and plastic packages that are adequate to maintain their condition. Therefore, this increases the levels of pollution if not managed accordingly.
Since 2017, at least one hundred and fifty Meal Kits SMEs have been created. One of the criticisms of them relates to the impacts of waste associated with the production chain, transport, and packaging [3]. To study the situation and find a solution for one of the companies in the sector and within the framework of a master’s thesis, it is proposed to answer the following research question: Is it possible to create a metabolic model that identifies, characterizes, and improves the flows of materials, reduces waste, and increases the economic participation of the startup in the sector?
This study aims to investigate this question by adapting and applying an urban metabolism model, and converting it to an industrial metabolism model linked to the original urban model. The industrial metabolism model was applied to Missfresh, an SME with 250 employees founded in 2016 in Montreal, Canada, and the outcomes were assessed over a six-month period. The applied methodology is based on and linked to the 4R urban metabolism model [4] by Peter Baccini, emeritus professor at ETH in Switzerland. The variables of the urban model were changed and the model was applied in the company for six months. For this period, three phases were planned:
  • Analysis and design of the model: For two months the Baccini model was analyzed, the variables in the company were adapted, and the flows of materials and waste generation were analyzed. This was conducted between August and September 2018.
  • Data collection and application: In a format, the four types of resources (4R: geosphere, transformation, impacts, and standards) were collected in the company to describe their inputs, transformation variables, and impacts, all under the relevant standards. This took place between October and November 2018.
  • Follow-up and presentation of results: The appropriate final model was established and, once the data were collected, the dynamic industrial metabolic map of the behavior of the 4Rs was created during a period of time in the company. The results of the tools were recorded for the clean production model, circularity plan, and business culture to finally measure the results of progress that will support future decisions and their impacts on the 3E sustainable variables: industrial ecology, economy, and ergonomics. This was undertaken between December 2018 and January 2019.
This sui generis model is one of the first industrial metabolism models applied to industry, with recognition both at the Missfresh company and at the University of Montreal.

2. Materials and Methods

2.1. Context of Industrial Metabolism

As antecedents to this work and to structure a generic state of the art, general concepts of biological metabolism and exchanges to maintain a living system dating back to the Middle Ages were used by the professor at the University of Padua, Sanctorious Sanctorious. This professor studied the affectations of the human body system and its changes in significant variables such as weight and height, among others, over a period of thirty years [5]. In turn, these were divided into two concepts: kinetic energy and chemical energy [6]. Later, the study of these theories of metabolism was resumed during the industrial revolution by Herbert Spencer in a chemical energetic way [7], and in Karl Marx’s material flow analysis (MFA) in kinetics and its application to cities [8]. This was supported by the studies of Paul-Emile de Puydt on the connection of the ancient Greek topic of “Panarquia”, or the different systems of nature through mathematical variables [9].
From the post-war industrial impacts, the concerns about seeking controls and prevention of industrial waste once again led to reflection in academia on sustainability and ways to reduce industrial impacts. This led to the Spaceship economy theories of professor Kenneth Boulding, who saw the Earth’s economy as a Spaceship in which humans need to recycle their waste [10]. Additionally, the urban energy metabolism in chemical energy arose with the studies of professor Paul Duvigneaud [11]. In this regard, we must highlight the anecdote of Professor Guillermo Camacho Caro and Richard Evans Schultes at Harvard University about towns’ proteins and carbohydrates, and the energy value translated to the countries [12].
The urban metabolism of material flow in the 1970s was taken up by professors such as Peter Baccini [4]. All these reflections led to the three phases of the business development model: end-of-pipe measures, on-site regulation, and eco-design [13]. However, although standards were used to create quality systems during the 1990s, it is necessary to see production management and its impacts in a model that integrates and allows analysis of the company’s resources through the interaction of variables and results with society.
This is why it is necessary to generate a metabolism model. The base chosen is the Baccini model due to its structure, which helps in the understanding of the relationship between metabolism and industry. The current study shows its suitability in an internet food sales startup in Canada. This food sector has had rapid growth in North America but generates a high environmental impact in the transfer of waste management, not only in production but also to the customer [14]. Therefore, the application of the model for a period of six months is a priority for the theoretical advance of industrial metabolism and the positive impact on the industry.

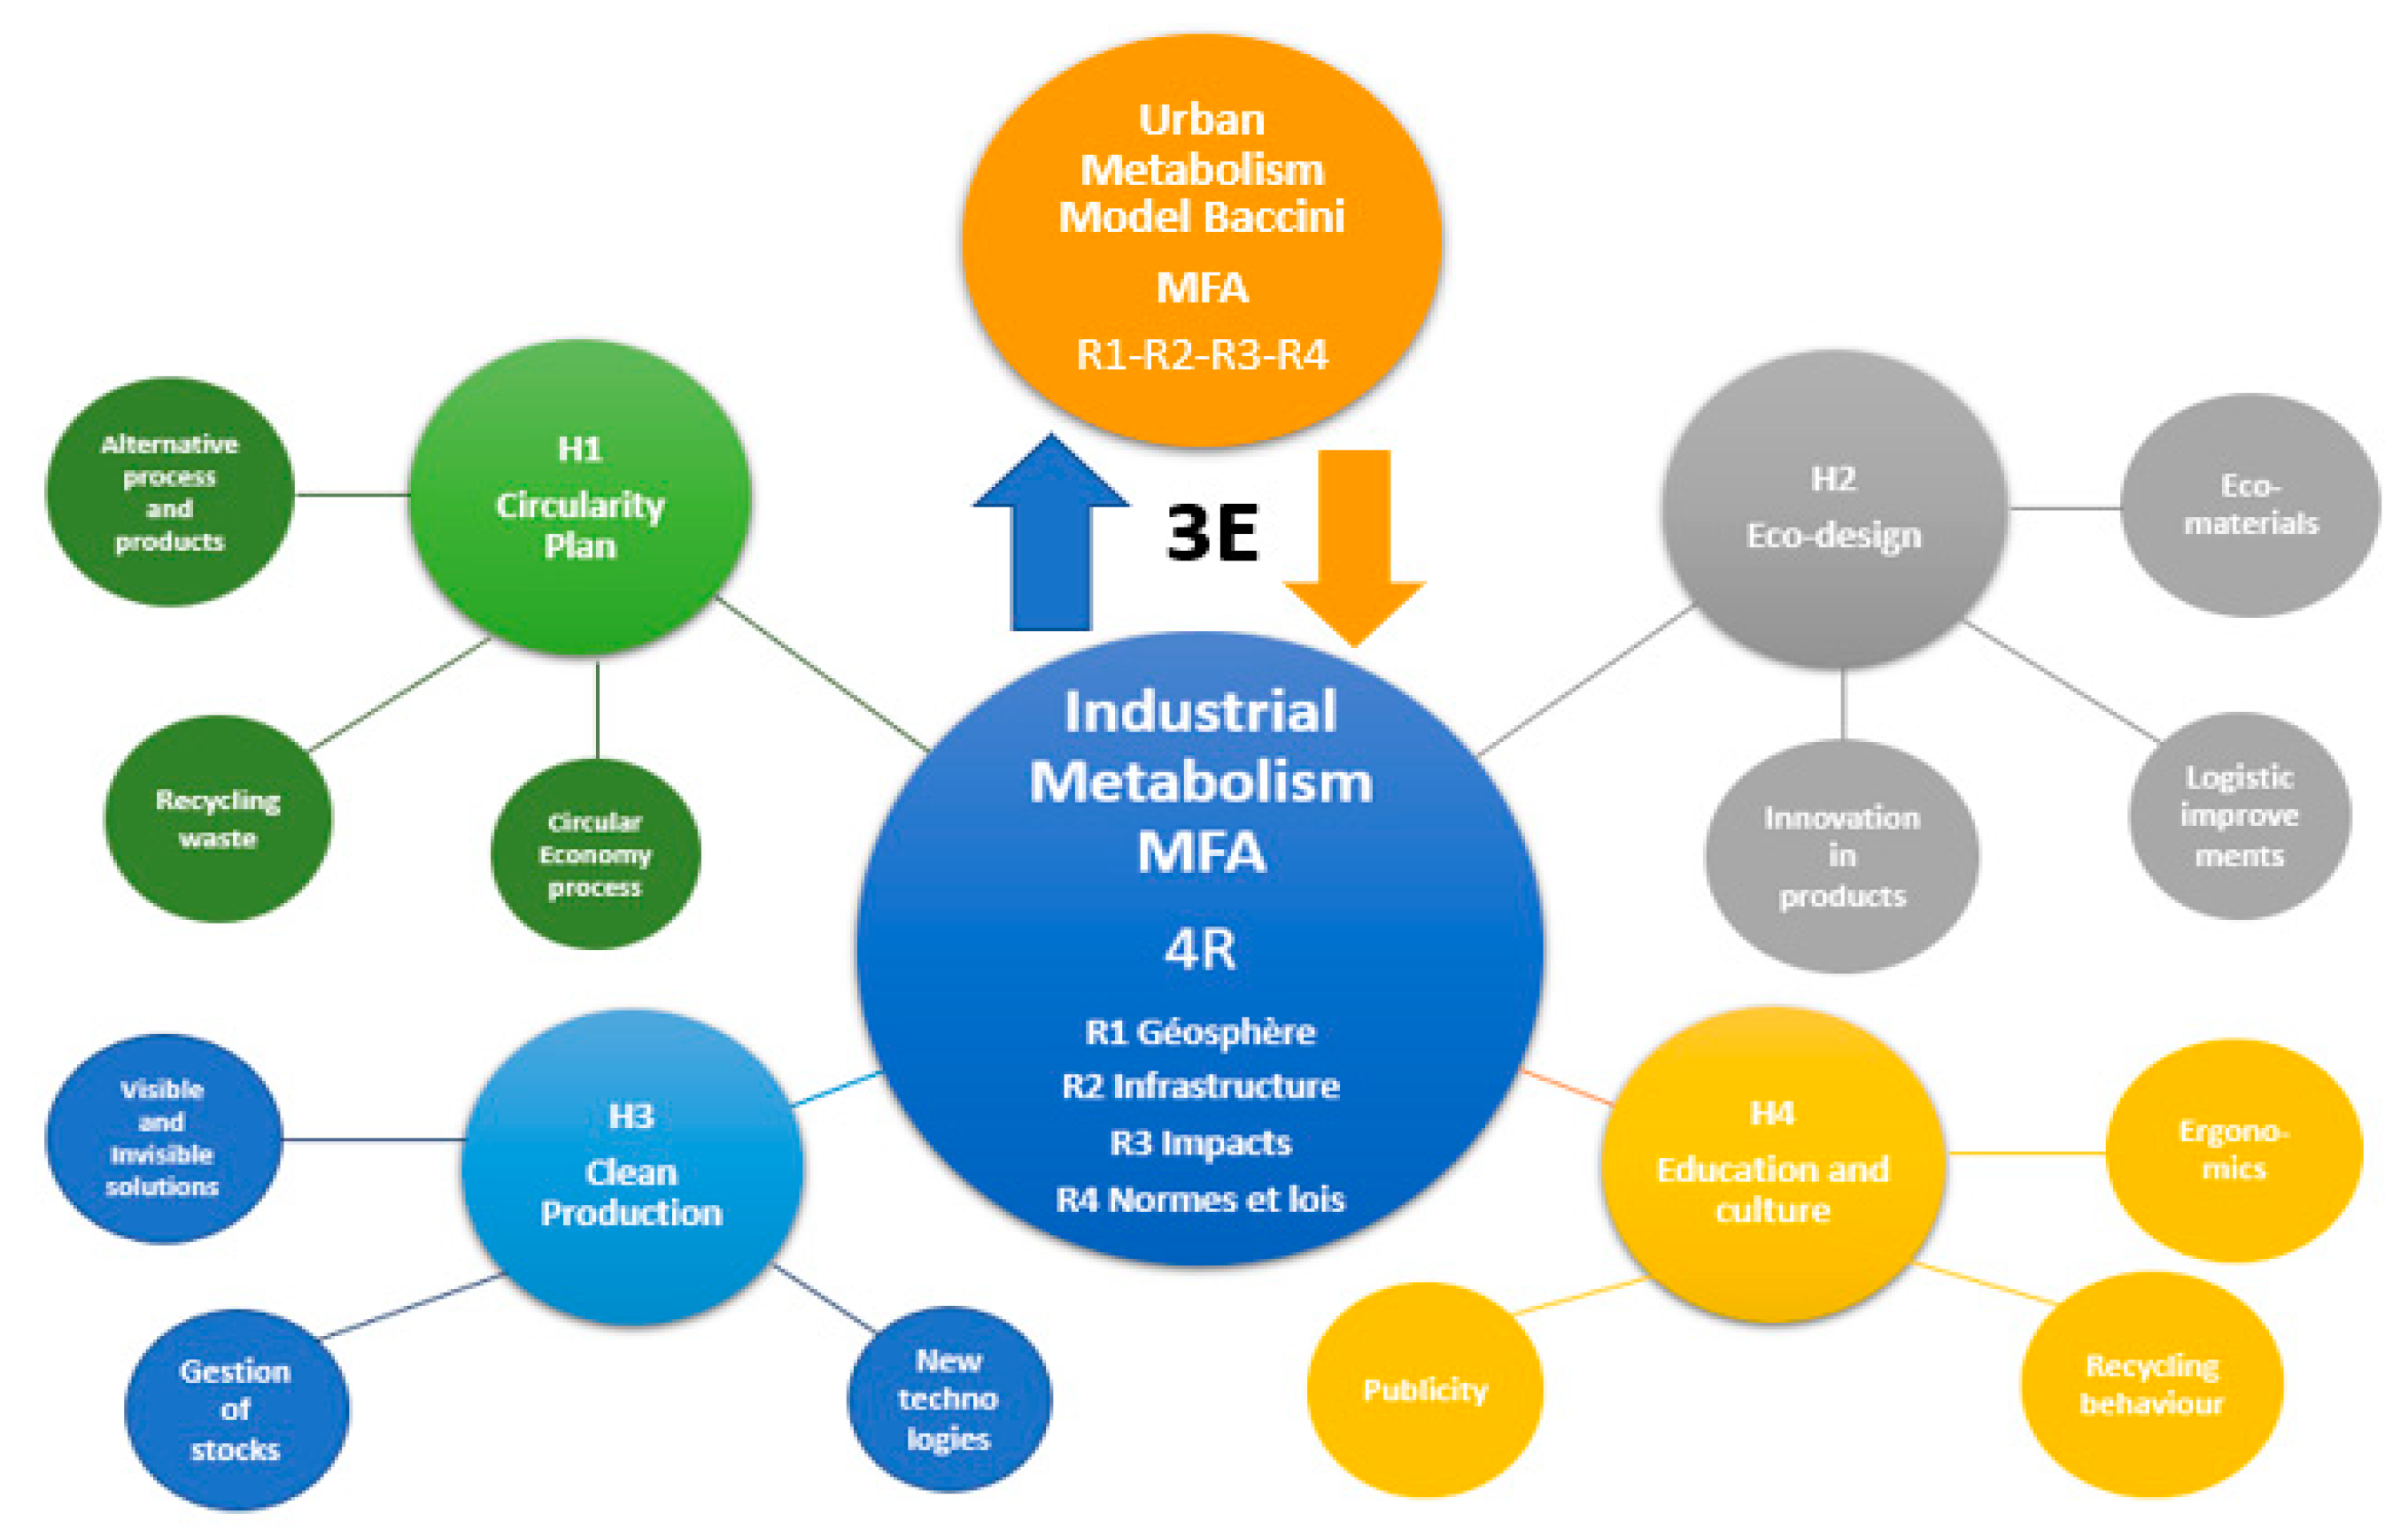
2.2. Model 4R—Baccini MFA

The MFA model of Professor Baccini [4] is based on the study of four generic variables, which range from the external environment of the system to the internal transformation and its performance (Figure 1).

3. Results

For this research, results were divided into two types due to the two audiences involved in the evaluation: academia and industry. The first type of results aims to build a theory that feeds the scientific literature on MFA-type industrial metabolism aimed at the academic community. The second type of results is practical as a consequence of the application of the academic model implemented within Missfresh.

3.1. Academic Results—Metabolism Model 4R UdeM

The first academic result was the adaptation of Peter Baccini’s MFA model to the Missfresh company (Figure 2). For this, after analyzing the behavior and productive system of the company during the first weeks, the four variables, or 4R resources, were changed and defined, and four 4H tools were additionally integrated as follows:
  • Resources 1 (R1—Geosphere and Biosphere): This is the analysis of the variables of the resources that a city has and that are used to generate its economic activity and vitality, such as the types of energy, water, and raw materials, among others. R1 was changed to R1 Ingredients and raw materials, since it better represents the name within the company. In this initial division, five input sub-variables were created (vegetables, meat, canned food, dairy, and packaging and production inputs), where the units of number of pallets, kilograms, and units were analyzed each week during the first two months.
  • Resources 2 (R2—Infrastructure): These are the physical technological variables of the means of the city and its distribution, and, in the same way, the number of people who mobilize the resources that enter the biosphere into the city. This name was kept because the name of infrastructure in the company is the same as that of a city. In turn, the sub-variables of analysis were the number of employees per shift, energy consumed, available space, space per worker, and technological level of the machines.
  • Resources 3 (R3—Business World): These are the variable impacts of the inputs in R1 and the transformation in R2. They are measured via sustainable indicators of productivity, environmental impacts, energy consumption, wealth generated, and social progress. R3 was renamed R3 Economic and environmental impacts of the company. The study variables were recipe production per week, amount of missing ingredients and type of error, surplus ingredients and inventory, production extras, amount of waste generated in cardboard, plastics, biodegradable, sales per week, profits, dead stock, and new customers.
  • Resources 4 (R4—Institutions): These are variables of the governmental or representative bodies of the city used to evaluate, legislate, and regulate the resources R1, R2, and R3. The name was changed to R4 Norms since the companies are governed by legislation in each sector. In the case of Missfresh, the city of Montreal and the federal and provincial governments of Quebec were investigated using the codes of food handling, HACCP standards, industrial safety standards, social responsibility, waste management codes, and government aid for good management.
The additional tools for the model, designated 4H, are as follows:
-
H1 Circularity Plan: A innovative document in this research that studies and classifies what to do with each of the raw materials that generate waste, both in the company and with customers, in search of solutions and circular economy projects for the elimination of waste and emissions from Missfresh.
-
H2 Eco-Design: The company seeks to change a liner or protective food bag that preserves temperature and quality, to a liner that is reusable and made of ecological materials, due to its non-reusable plastic components.
-
H3 Clean Production: The model seeks to study the organization of production to improve the circulation of the productive flow, organization of production, and proper waste management [15].
-
H4 Culture and Education: The model uses this informative tool to ensure Missfresh workers are attentive to changes in clean production practices, eco-design, and circularity in order to improve understanding and application of the changes within the company.
These four 4H tools, which make up the support for the 4R model, were necessary since, during the study, shortcomings were found at the productive and environmental levels, and possible solutions were grouped in the best way possible. We started from the metabolic concept of “A healthy mind in a healthy body” of the poet Juvenal of ancient Rome to see the visible problems of the company because, when visiting the Missfresh plant, concurrent production errors were photographed. Additionally, interviews were conducted with ten production workers. The invisible origins related to management or administration problems were then investigated.
After the application of the model and the data collection over the six-month period, two metabolic maps were constructed, one static (Figure 3) and the other dynamic (developed in 3MAX software, 2019 version) [16]. The first contained generic information on the flows of the company during the first two weeks of September 2018. Both the static and dynamic maps illustrate the situation of Missfresh at the same time and help to plan production for the next years.

3.2. Impacts of Tools on the 3Es

3.2.1. E1—Industrial Ecology—Circularity Plan

This is a document where each problem in the generation of waste is analyzed and a project is proposed for the use of each type of waste to enable recycling. All material inputs from the company and their subsequent end of life were analyzed. In total, seven sectors were analyzed according to the type of waste, such as cardboard, PET packaging plastics, biodegradable, food donations, dead inventories and correct management of purchases, customer packaging, and chemicals. Three significant examples of the results are the following:
Cardboard: Every week during the months of August 2018 and January 2019, the company sent 1 ton to a cardboard container that was collected. For this service it paid CAD 105 to the recycling company, Kruger. It was proposed to buy a cardboard compactor to make two recycled buckets each weighing 500 kg and sell them as recycled cardboard to Kruger at 85 CAD per week each, totaling 680 CAD per month. The value of the new T450 compactor with installation was CAD 16,400, which would pay for itself in about two years. The project was under study approval at the end of the study for its profitability.
Dead stock: Ingredient inventories were measured to assess their consumption and reuse rate. After the report, they were classified with the quality team and reused in the first three months as already packaged food (overlogs) for the value of CAD 4888, which the company saved in future productions.
A kind of industrial metabolic fast: In addition, it was proposed to improve purchasing management to order a quantity of material that ensures a safety stock of two weeks per ingredient under the formula of:
Quantity product order = (QW-3 + QW-2 + QW-1)/3
where:
  • QW-3 = Weekly ingredient consumption three weeks before production;
  • QW-2 = Weekly ingredient consumption two weeks before production;
  • QW-1 = Weekly ingredient consumption one week before production.
The goal is to maintain tight stock quantities for production and to optimize ingredient warehouse space.
Packaging towards the client: The types of packaging and their materials sent to the client and the quantities were analyzed, as well as the actions to prevent contamination as a result of the social responsibility that the company should have. As a result, four types of plastic bottles were found in 6PS, five low-density polypropylene plastic bags in various sizes (2 to 10 pounds), and five jars from 0.5 ounces to 6 ounces, among others. For each of the packages, an impact assessment was undertaken in the case of non-recycling in terms of eutrophication, acidification of the soil, and toxicity in a negative scenario. The quantities measured in the study period were 37,104 plastic bags, 9604 bottles, and 21,300 cans of aluminum. Due to the complexity of monitoring these possible wastes and their impacts if they are not recycled, Missfresh created an informative web page for the client on the importance of recycling this packaging, since the responsibility is shared with the client.

3.2.2. Eco-Design

The other significant result of the industrial ecology of the model in Missfresh was the ecological design in the change of the liner or protective food bag in customers who did not receive their recipes directly at home but picked them up in supermarkets for ease of schedule. This represented 20% of weekly sales, with around 120 sales. Each recipe is sent in a special plastic box or TOTE that contains the liner and two icepacks that must maintain the temperature of the food at zero degrees for up to three days, thus guaranteeing its quality. The objective was to find a new reusable liner that conserves the temperature, and at a better price. Forty suppliers from countries such as Canada, the United States, China, and England were explored; twelve products were received, and seven tests were conducted where the aspects of temperature conservation, adaptability, reuse, and price were evaluated. The liner selected was that of the English company Woolcool [17], whose constitution is a liner or temperature protector made with a durable plastic coating and an interior of sheep’s wool. This product met all expectations during the temperature test, and in terms of cost and eco-design.

3.2.3. E2—Ergonomics

In terms of ergonomics or improvements in production methods focused on workers, the plant was made aware of the importance of clean production and separating waste for internal recirculation through an information campaign. In the same way, the work tools were reorganized into kits per production team. The workers were trained in the separation of waste and the cleaning and order (everything in its place) of the workstations before and after production.
In addition to the use of a conveyor dolly and supply chain in order to reduce physical wear and tear in the internal transport of ingredients, the ingredient warehouse was reorganized according to the type of food and weight, placing ingredients close to the production line, to avoid physical effort and wear and tear. At the end of the study, the clean production flows were evident and recorded before and after for each problem detected in the research.

3.2.4. E3—Economy

Regarding the results of the application of the model in the company in economic matters, the following analysis results were found. In general, before the internship and the study, the company had low productivity during the months of August and September due to time wasted because of the disorganization of the production line during working hours in the week. At the end of October, productivity stabilized, time indicators improved, and employees had more hours to dedicate to maintaining and ordering the plant. A year after the study, the company grew from 250 employees to more than 500. Therefore, it stopped being a small company and consolidated itself as a medium-sized company with a quality system such as HACPP and the working industrial metabolism model.

4. Conclusions

This research aimed to answer the following research question: Is it possible to create a metabolic model that identifies, characterizes, and improves the flows of materials, reduces waste, and increases the economic participation of the startup in the sector?
According to this research, the answer is that it is possible to create and adapt a metabolic model for companies that improves material flows, enables the reduction and recirculation in waste, and improves the company’s participation in the market, as we saw in Missfresh during the study period. The 4R model was empirically adjusted to the company and served to provide advances in its daily life and in the medium term, with various visible and invisible results within Missfresh to be rediscovered and rethought. This company was sold to Cook It, an industry leader who discovered the potential of Missfresh through its innovative advancements.
In academic matters, a medium-term field of research is left open in the two types of MFA material flow metabolism, as well as in a completely new one: industrial energy metabolism applied as a consultancy in SMEs that seek to reduce their environmental impact. This is via an applied model that should be translated in the future into animated simulations of metabolic maps to aid management decisions through the design of industrial metabolism software and metabolic maps, similar to that developed by Lockheed in the United States for the manufacture of the F35 aircraft [18].
Similarly, another phase of future research is to integrate mathematical models that describe the behavior of the production and reduction in waste or the energy efficiency of companies. During the six months of this study, the transformation of the company was seen, from the management, who was more environmentally conscious, to the clients and the media, who noticed the change. One of the significant changes is in terms of communication between the purchasing, marketing, and production departments. These three must be aligned to maintain sustainability and changes in the metabolism model. The model was very well qualified both in its approach and application, in both academia and in the company. Similarly, the model was commented on in several articles in the local press because of Missfresh’s innovative commitment to sustainability [19].
The graphic interaction of the four variables or resources R1 (Biosphere), R2 (Infrastructure), R3 (Business World), and R4 (Institutions) in a metabolic map helps to place the activity of a city in history [4,11].

Author Contributions

Both authors contributed equally to the work. All authors have read and agreed to the published version of the manuscript.

Funding

This research received no external funding.

Institutional Review Board Statement

Not applicable.

Informed Consent Statement

Not applicable.

Data Availability Statement

The data supporting the reported results are not publicly available due to privacy and confidentiality restrictions.

Conflicts of Interest

The authors declare no conflict of interest.

References

  1. Agency, E.P. National Multi-Pollutant Emissions by NEI Year; EPA: Durham, NC, USA, 2014.
  2. Maxime, D. Développement Durable dans les Petites et Moyennes Entreprises au Québec; Centre Universitaire de Formation en Environnement: Montréal, QC, Canada, 2012. [Google Scholar]
  3. Sifferlin, A. Why Meal Kits Haven’t Delivered a Cooking Revolution—Yet. TIME, 19 July 2017. [Google Scholar]
  4. Baccini, P.; Brunner, P. Metabolism of the Anthroposphere; The MIT Press: Cambridge, MA, USA, 2012; p. 283. [Google Scholar]
  5. Newell, J.; Joshua, C. The Boundaries of Urban Metabolism: Towards a Political-Industrial Ecology. Prog. Hum. Geogr. 2014, 39, 1–27. [Google Scholar] [CrossRef]
  6. Molnar, C.; Gair, J. Concepts of Biology; OpenStax College: Houston, TX, USA, 2013; pp. 110–111. [Google Scholar]
  7. Padovan, D. The Concept of Social Metabolism in Classical Sociology. Available online: https://www.redalyc.org/articulo.oa?id=12400203 (accessed on 19 May 2019).
  8. Pincelt, S.; Bunje, P.; Holmes, T. An expanded urban metabolism method: Toward a systems approach for assessing urban energy processes and causes. Landsc. Urban Plan. 2012, 107, 193–202. [Google Scholar]
  9. De Puydt, P.-E. Panarchy. Revue Trimestrielle, July 1860. Available online: https://www.panarchy.org/depuydt/1860.eng.html (accessed on 24 April 2019).
  10. Boulding, K. The Economics of the Coming Spaceship Earth. In Environmental Quality in a Growing Economy; RFF Press: Washington, DC, USA, 1966; pp. 3–14. [Google Scholar]
  11. Duvigneaud, P. L’Ecosysteme Urbain; Programme Biologique International: Brussels, Belgium, 1977. [Google Scholar]
  12. Caro, G.C. Lo Importante es el Hombre; HEC Montreal: Montréal, QC, Canada, 1997. [Google Scholar]
  13. Kazazian, T. The Ecodesign Process. In Perspectives on Industrial Ecology; Routledge: New York, NY, USA, 2017; pp. 82–83. [Google Scholar]
  14. Zweep, C. Meal Kits: Convenience vs. Packaging. 24 April 2018. Available online: https://www.foodincanada.com/features/meal-kits-convenience-vs-packaging/ (accessed on 19 May 2019).
  15. ONUDI. Manual de Producción más Limpia; ONUDI: Geneve, Switzerland, 2006. [Google Scholar]
  16. Torres, C. Director, MIssfresh Metabolisme Draft 1. [Film]. Canada: Carlos TORRES. 2019. Available online: https://www.youtube.com/watch?v=4eL2GOgj6bo&t=16s (accessed on 19 May 2019).
  17. Woolcool. Woolcool. 2018. Available online: https://www.woolcool.com/ (accessed on 19 May 2019).
  18. The F-35 Factory. [Film]. US: Lockheed Martin. 2012. Available online: https://www.youtube.com/watch?v=df_MHNkAVrw&t=1s (accessed on 19 May 2019).
  19. Morissette, N. La Presse. 03 06 2019. Available online: https://plus.lapresse.ca/screens/e8303522-f286-440f-aa68-926b2f3447a1__7C___0.html (accessed on 19 May 2019).
Figure 1. Baccini urban metabolism model—MFA, 4R. Source: The figure is the authors’ own creation, based on the Baccini model (2012) [4] as presented in Metabolic Maps.
Engproc 76 00011 g001
Figure 2. Industrial metabolism MFA model UdeM. Source: Authors’ own creation.
Engproc 76 00011 g002
Figure 3. Static metabolic map. Source: Authors’ own creation.
Engproc 76 00011 g003
Disclaimer/Publisher’s Note: The statements, opinions and data contained in all publications are solely those of the individual author(s) and contributor(s) and not of MDPI and/or the editor(s). MDPI and/or the editor(s) disclaim responsibility for any injury to people or property resulting from any ideas, methods, instructions or products referred to in the content.

