Abstract
This paper investigates active thermography models for non-destructive testing of composites, with a focus on continuous carbon fiber reinforced thermoplastic polymer (CCFRTP) components, in order to detect flaws such as porosity and delamination. The application of finite elements in this study with a numerical model of thermography focuses on collecting data, with critical points verified and validated by an experimental model. The study aims to understand the influence of different, independent parameters on the active thermography test, making it possible to develop optimized models. The numerical solution is close to the experimental results, indicating the potential to refine future experimental configurations.
1. Introduction
In modern industry there is a great need for technological innovations related to composite materials that are capable of dealing with the difficulties that previous techniques still present [1]. An example of innovation, therefore, is the development of carbon fiber reinforced polymers (CFRP), used for applications in various fields, such as construction, mechanics, automotive, biomedical, marine and, above all, aeronautics and aerospace [2], where properties such as resistance to heat and corrosion are important, as well as the strength-to-weight ratio and cost benefit [3]. Faced with the difficulties of standard manufacturing techniques with complex CFRP parts, the additive manufacturing method or extrusion deposition technique has emerged, in which carbon fiber reinforced polymer parts can be designed more quickly and take less time to manufacture, even if they have certain levels of complexity [4,5]. The main advantages of this continuous carbon fiber technology method are its reliability, low maintenance requirements, low investment cost, wide availability of low-cost filament materials, cost-effectiveness, and high customizability [6,7].
As a result, due to their outstanding properties and manufacturing characteristics, carbon fiber reinforced polymers are now utilized not only in secondary structures but also in safety-critical primary structures. Thorough inspection of these structures is essential to prevent catastrophic failures, with porosity posing a significant risk by compromising material strength. Therefore, employing non-destructive testing (NDT) methods for defect detection and characterization is imperative. NDT involves discrete inspections using physical measurements that do not affect the structure’s condition or service life [3]. Various methods exist, including visual testing, ultrasonic testing, thermography, radiographic testing, electromagnetic testing, acoustic emission, and shear testing [8]. Among these options, thermography stands out as an effective technique for complex parts, offering environmental neutrality. Thermography relies on an external energy source to create a temperature contrast between defective and non-defective areas of a specimen under examination [9]. Its advantages include non-contact inspection, real-time application, rapid inspection of large areas, and no limitations concerning part geometry [10,11]. It is worth noting that infrared thermography, despite its potential, lacks sufficient quantitative data for reliably detecting porosity in composite parts.
Therefore, in view of this problem, numerical models representing active thermography have been developed in order to obtain data that will be compared with experimental models, with the aim of creating reliable sources that will make it possible to validate and certify this non-destructive method for analyzing and characterizing the porosity of structures made of carbon fiber reinforced polymers [12]. The aim of this study, therefore, will be to implement an experimental plan to examine the influence of parameters on active thermography testing, using a numerical model for data collection and then applying an experimental model to verify and validate the critical points obtained. The distinction of this study from previous ones lies in its precise analysis of each individual parameter within the model. Previous studies primarily focused on developing the numerical model of active thermography without such detailed parameter examination.
2. Methods
2.1. Experimental Plan
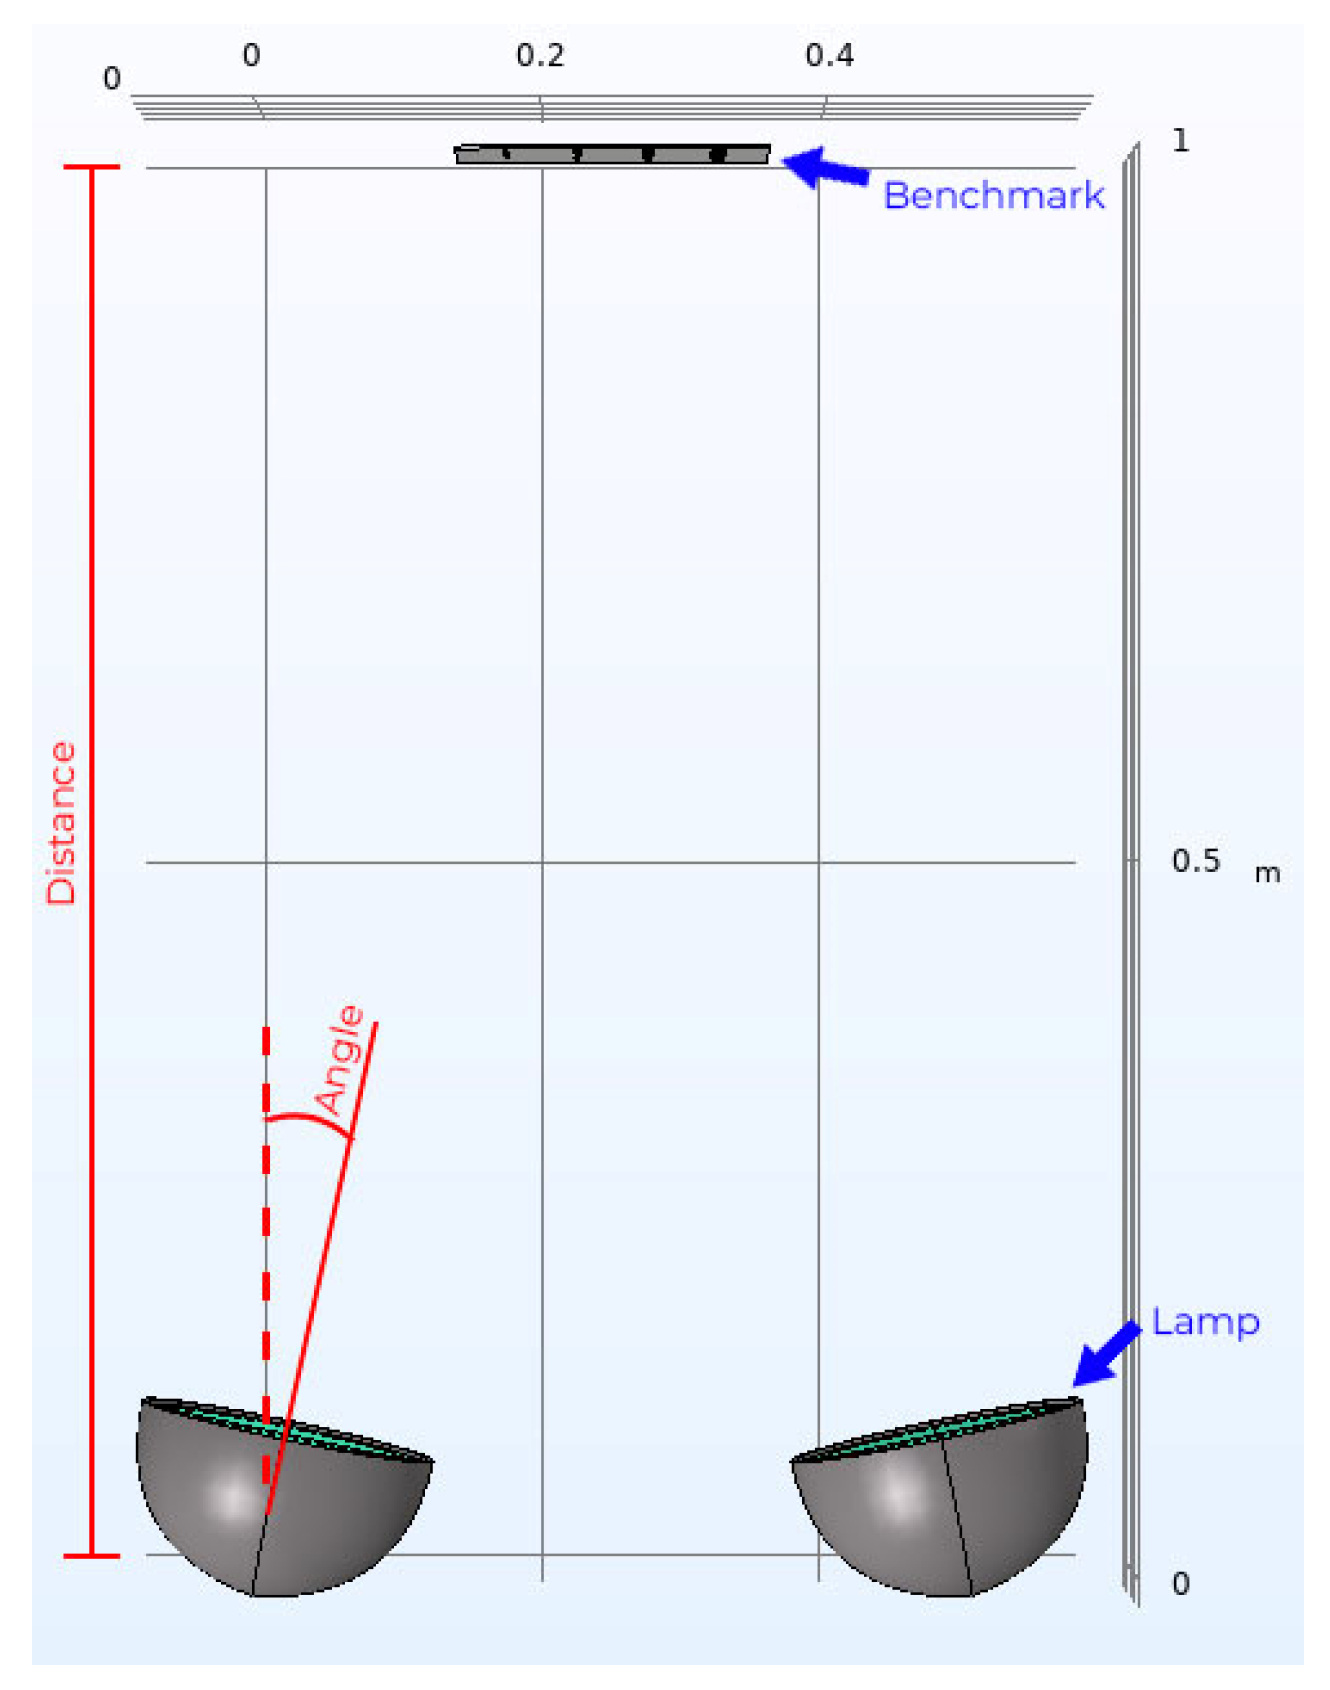
The experiment to be followed is based on analyzing different configurations of the active thermography test, in which parameters such as angle of the lamps, distance between benchmark and bulbs and time exposition of the sample are changed separately to understand the influences that each one has in the results. Thus, the model will have each parameter altered independently in order to analyze how the radiation distribution behaves with each change. Figure 1 shows a representation of the changes that will be made, where the distance is measured from the origin of the lamps to the surface of the benchmark, the angle of the lamps is rotated in relation to its center and the exposure time is changed only by the length of time that the heat source is on.
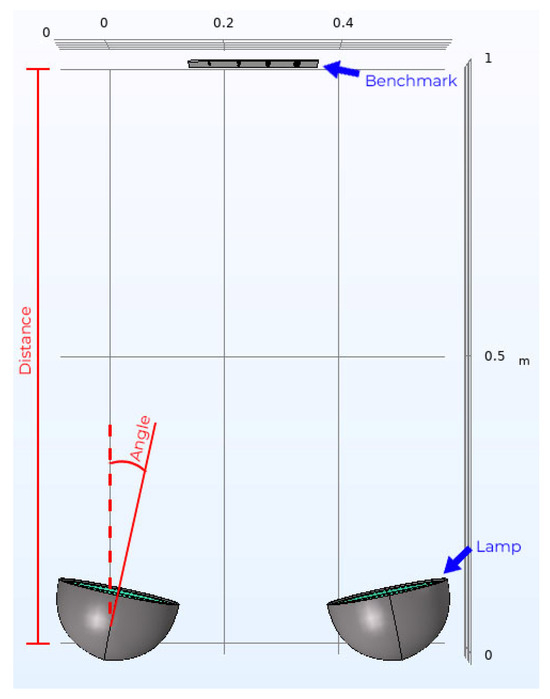
Figure 1.
Top view of the numerical model of active thermography with two lamps and one benchmark, representing the changes to be made to the lamp angles, benchmark/lamp distance and sample exposure time.
The table below shows the different model configurations, in which each parameter changes, while the others remain constant.
2.2. Application of Finite Element Method to Study the Experimental Plan
In order to have a wider range of data, the previously validated numerical model in the aforementioned article [12] is used for the first stage of the study, in which the thermography test is recreated in the COMSOL Multiphysics finite element program. The model has a flat CFRP benchmark with internal porosities and its first configuration can be seen in Figure 2b, where the parameters are an angle of 20 degrees, a distance between benchmark and lamps of 1 m and a time exposition of 10 s. All the changes mentioned in Table 1 will be executed in this model. Figure 2a shows the geometry of the benchmark, with the shapes, sizes and depths of the porosities, as well as the temperature collection points.

Figure 2.
(a) Technical drawing of the flat benchmark, units in [mm], with evaluation zone: blue point for the non-defect area and red point for the defect area; (b) isometric view of the model taken as basis, representing the two lamps in gray and the benchmark in blue.

Table 1.
Configuration of the model with the representation of each parameter used and changed.
2.3. Experimental Critical Points to Be Compare with the Numerical Model
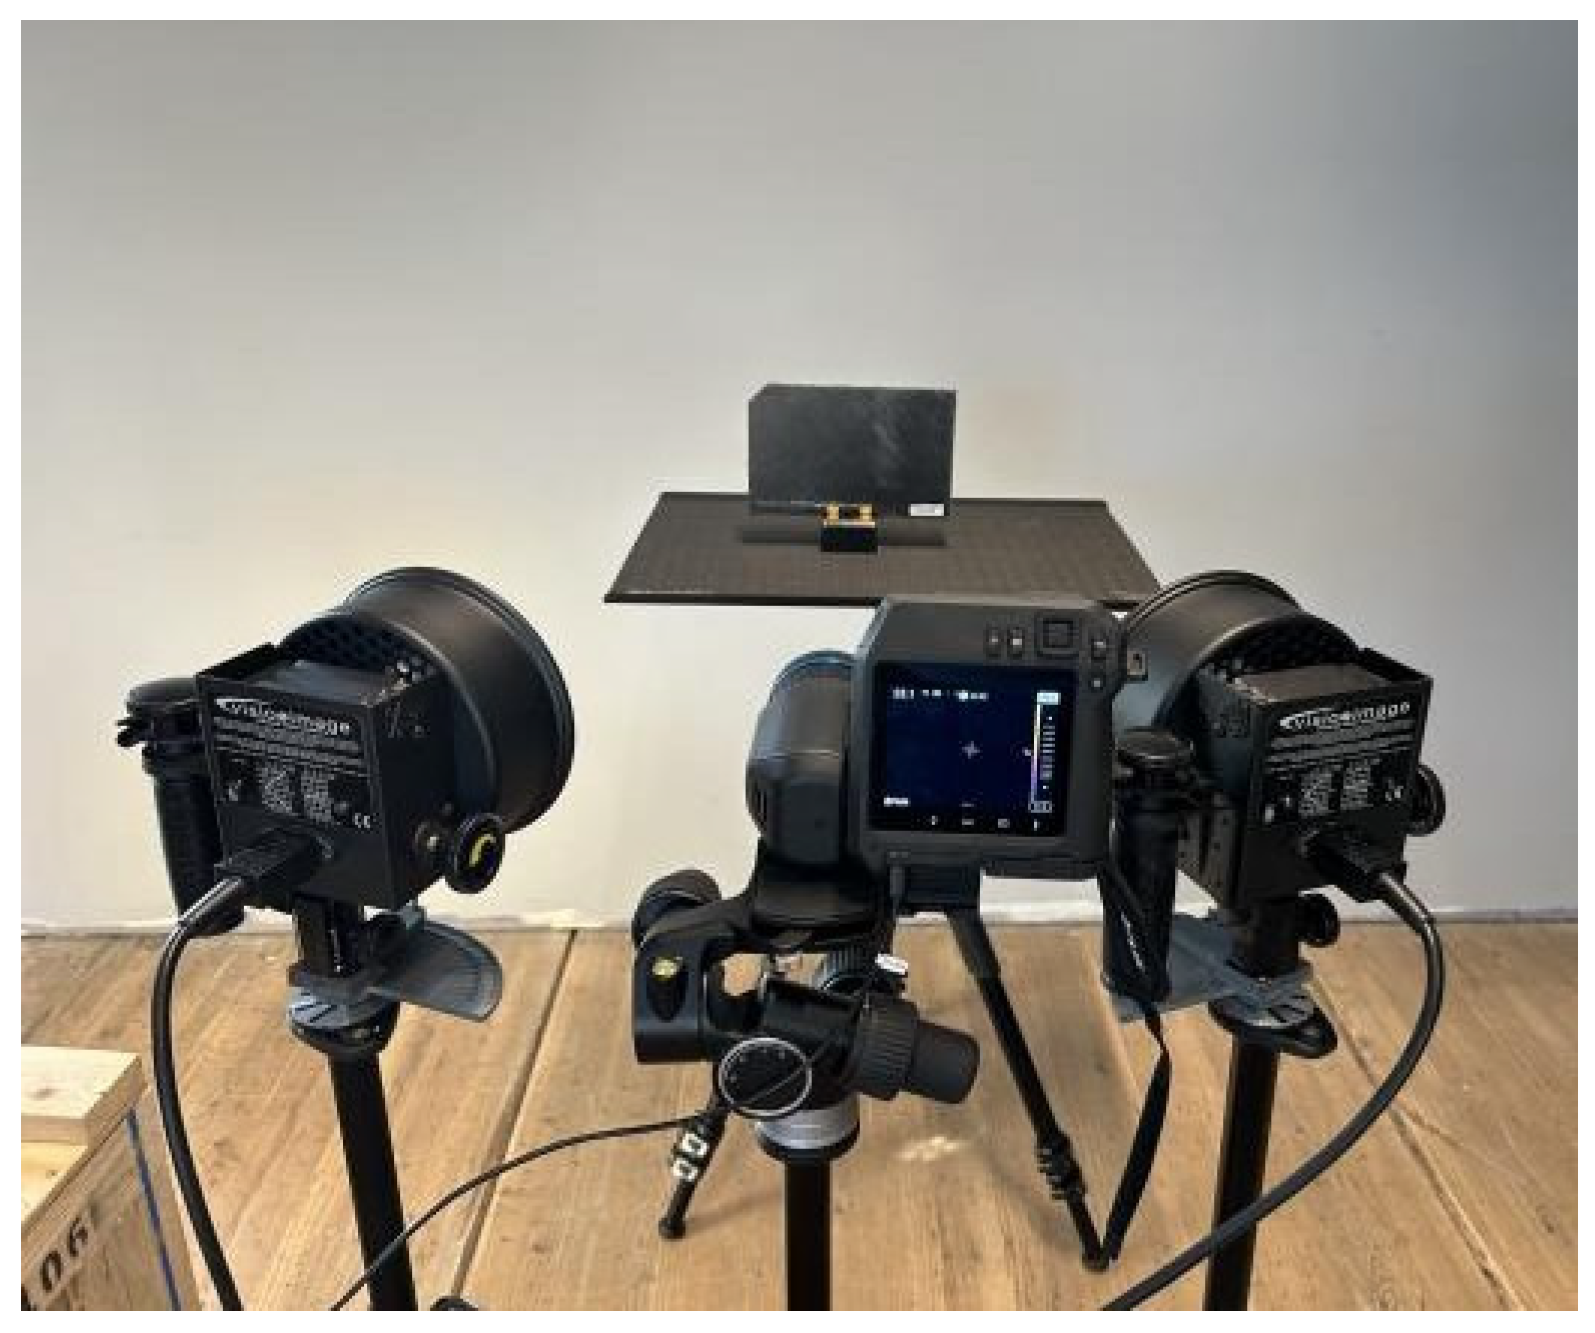
To validate the study on the influence of parameters on the numerical model in active thermography, an experimental test was conducted using the most significant points obtained from the numerical results, aiming also to visualize the behavior of the heating uniformity. It is important to note that the experimental coupon was fabricated using additive manufacturing using an Anisoprint A4 printer, which is a printer that utilizes coextrusion technology, allowing the printing of continuous carbon fiber composites [13]. The set-up consisted of two 1000 W halogen lamps, each installed on a tripod and a FLIR T560 infrared camera with a focus lens of 17 mm, located at the same distance as the lamps and at the same height as the benchmark under study. This experimental configuration can be seen in Figure 3.
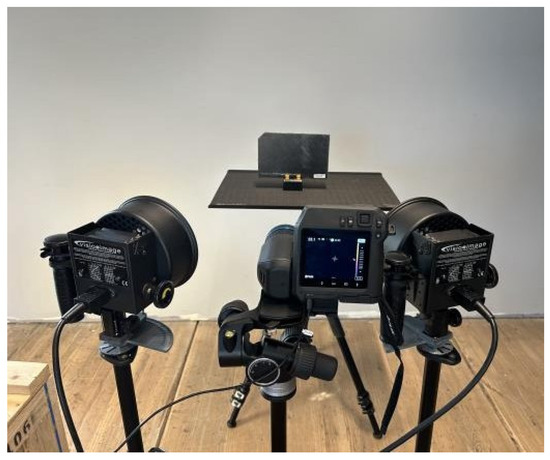
Figure 3.
Experimental set-up with two halogen lamps, one CFRP benchmark and one thermal camera.
3. Results
The maximum value of the temperature contrast curve of the active thermography test will be used as a criterium for comparison and analysis, as this value represents the greatest temperature difference between the defective zone and the non-defective zone. Therefore, the higher this value, the better the visualization of defects in the part. Given that, the two results with the greatest difference obtained were the one from the model with a time exposition of 2 s and a distance benchmark/lamp of 100 cm and the other from the model with a distance of 70 cm and a time exposition of 10 s. The first case has an insufficient contrast curve value because the sample was not heated sufficiently, rendering it inadequate for long-pulsed active thermography. Meanwhile, the second case proved to be the most optimized model, where the sample is adequately heated at this distance, maximizing the utilization of radiation distribution from the lamp filaments. In Figure 4, a graph showing the temperature curves for the two most extreme cases can be seen, where it is important to notice the different temperature ranges.

Figure 4.
Temperature curves graph of (a) optimized model, with distance benchmark/lamp of 70 cm, lamps angled at 20° and with a time exposition of 10 s; (b) model with distance benchmark/lamps of 100 cm, lamps angled at 20° and a time exposition of 2 s.
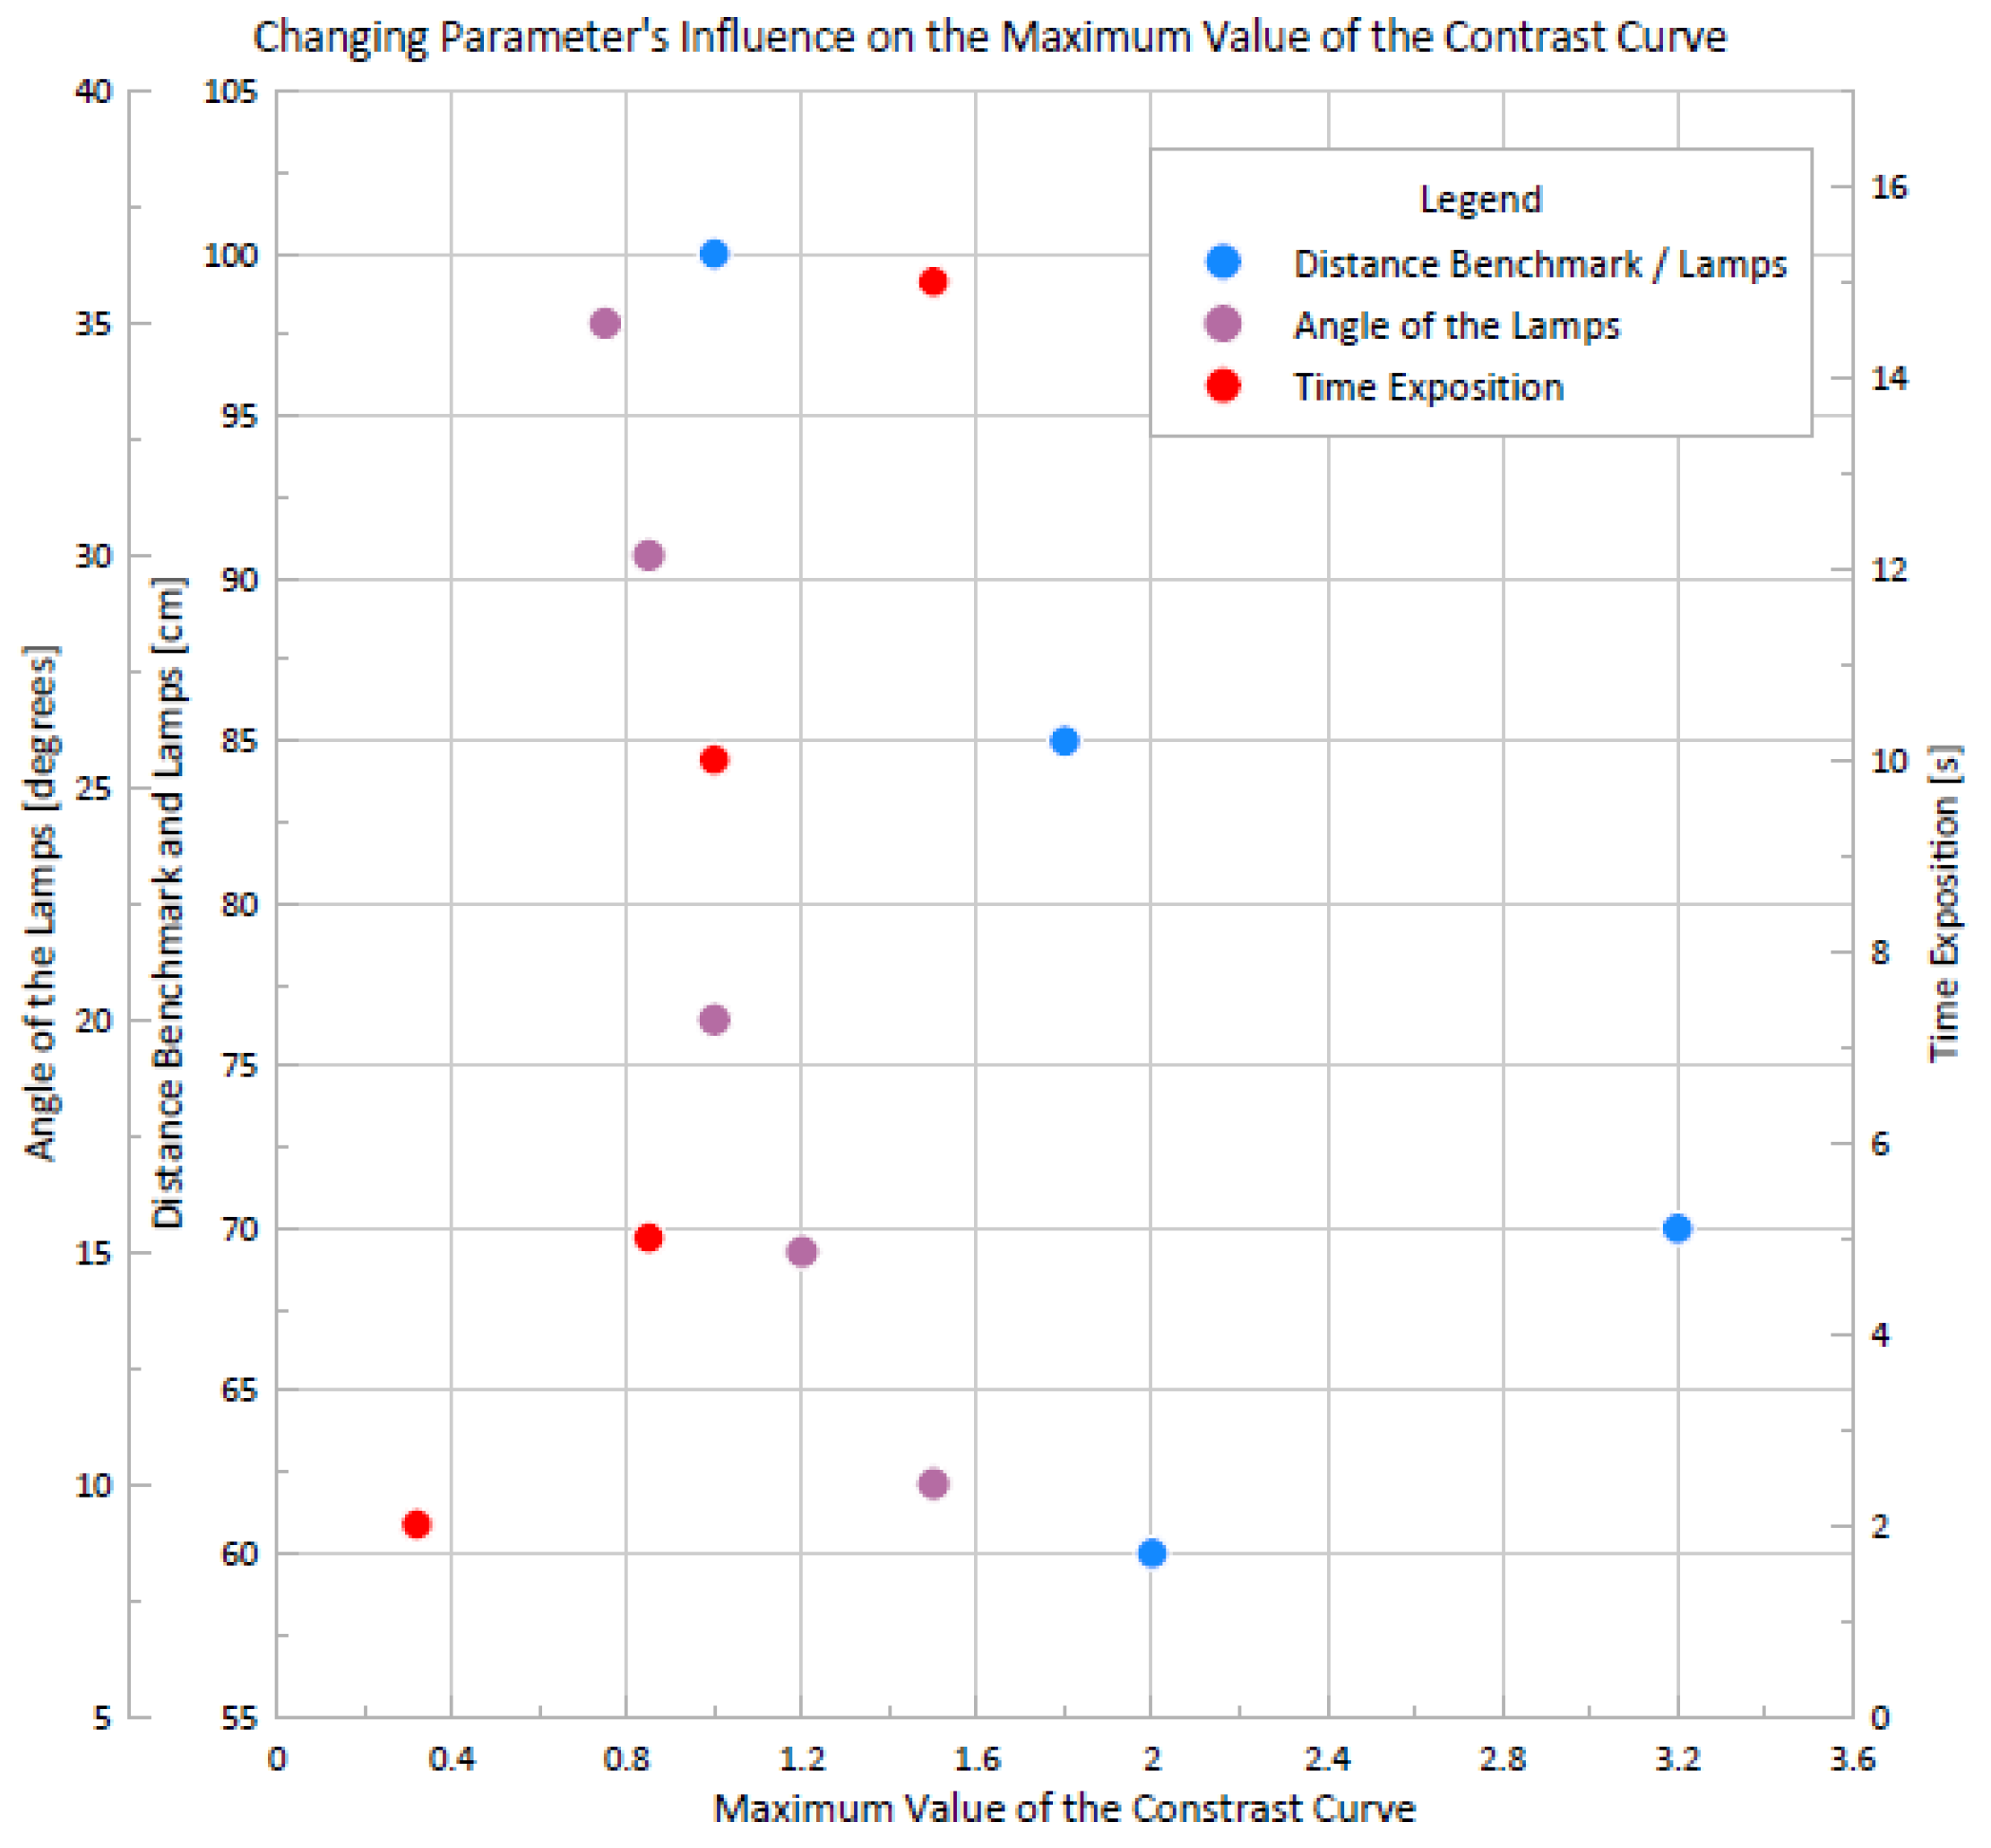
In order to visualize the results of all changes, the graph in Figure 5 was developed, which shows the maximum value of the temperature contrast curve for each case.
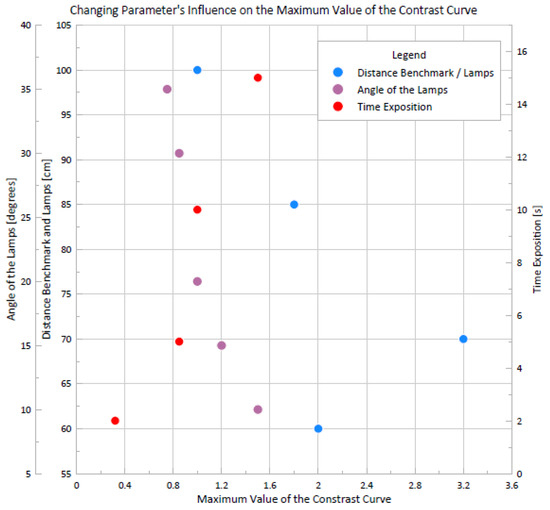
Figure 5.
Graph of the points representing the maximum value of the temperature contrast curve for each parameter change model configuration. Fixed parameters of the base model: distance benchmark/lamps of 1 m, lamps angled at 20° and a time exposition of 10 s.
The lamp angle demonstrates minimal influence on temperature contrast values compared to other parameters, with only a 0.75 variation observed despite a 25-degree-angle change. Conversely, the distance between the benchmark and lamps significantly impacts contrast curve values. A mere 15 cm adjustment, bringing the distance to 70 cm, results in a 1.4 increase in the maximum temperature contrast value. However, reaching the 70 cm limit yields diminishing returns, as reducing the distance to 60 cm decreases values by 1.2. Thus, optimizing an active thermography model should prioritize analyzing this parameter first, given its potential for substantial thermogram and graph variations. Regarding time exposure changes, longer lamp heating increases temperature variations but risks damaging the part. Conversely, very short exposures, such as 2 s and 5 s, yield almost negligible temperature variations between defective and non-defective zones. Hence, careful consideration of exposure time is crucial for classifying the developed thermography type.
4. Discussion
In Figure 5, it can be seen that four points define the graph’s boundaries, two vertically constraining parameter changes and two horizontally limiting maximum values of the temperature contrast curve. These are the critical points and are detailed in Table 2. Notably, the angle of the lamps remains unchanged at these points, as this parameter does not show a significant influence.

Table 2.
Representation of each parameter setting of the numerical models that generated the critical points.
Based on this, the experimental model is used to support and validate the numerical study of the influences of each parameter on thermography, in which four set-ups were car ried out following the configurations in Table 2. A representation of the critical points with the digital and experimental thermograms obtained can be seen in Table 3.

Table 3.
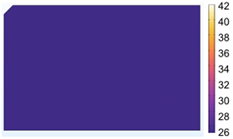
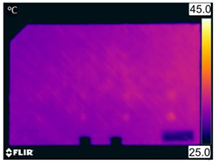
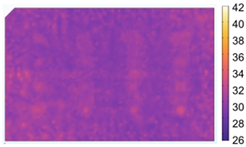
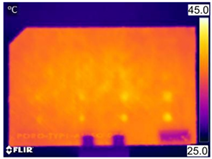
Experimental and numerical models thermograms, including the range temperature, of each model that generated the critical points.
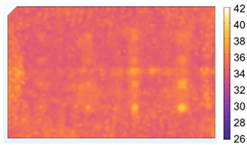
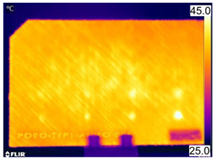
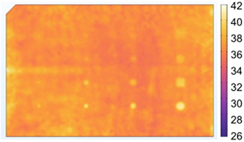
Comparing the experimental and numerical thermograms, it can be seen that the behavior of the heat distribution in the sample and the temperatures for both cases are very similar. Thus, the numerical data obtained can be validated, even if the experimental models show slightly higher temperatures, because they are highly dependent on external parameters, such as the ambient temperature. Therefore, small differences in temperature distribution are possible, but they do not influence the value of the temperature contrast curve, which is the factor used to characterize a defect. In the analysis, only the exposure time was changed and the other parameters were kept constant, as was the case up to the third thermogram. The importance of the correct sample heating time in order to define the type of thermography is proven because the experimental and numerical thermograms in case number 1, with an exposure time of only 2 s, do not show the porosity of the sample. Comparing the four thermograms, both experimental and numerical, it becomes evident that as the maximum values of the temperature contrast curve progress, the defects become increasingly visible, even those that are smaller and deeper, and the uniformity of radiation distribution on the benchmark also increases. It is noteworthy that the last two thermograms, case number 4, exhibit the best porosity visualization, where it is possible to observe the smallest and deepest defects, as well as their shapes, and these thermograms have the most heating uniformity. Therefore, these thermograms confirm the result chosen earlier from the graph in Figure 5, in which the optimized model is the model with a distance of 70 cm and an exposure time of 10 s.
5. Conclusions
The analysis of both numerical and experimental data indicates that the distance between the benchmark and lamps significantly impacts active thermography results, whereas lamp angle has minimal effect. Exposure time is crucial: insufficient durations yield inappropriate results (e.g., 2 s and 5 s), while longer periods (e.g., 15 s) may cause damage. The policy recommendation is to use the optimal model adjustment, bringing the flat benchmark 70 cm closer to the 20-degree-angled lamps and heating the sample for 10 s, maximizing temperature contrast and ensuring uniform heating for defect visualization improvement. The strategy for determining these parameters involves independent adjustments followed by their integration into a comprehensive model. From this perspective, further development of the numerical model is needed to identify optimal parameters, considering that the maximum contrast indicator may not effectively detect distributed defects. Exploring heat distribution across the plate suggests an alternative indicator, necessitating the development of an image processing method for uniformity quantification.
Author Contributions
Conceptualization, C.B. and A.D.; methodology, C.B. and A.N.; validation, C.B., A.D. and A.N.; resources, A.D.; writing—original draft preparation, C.B.; writing—review and editing, C.B., A.D., A.N. and S.S.C.J.; supervision, A.D. All authors have read and agreed to the published version of the manuscript.
Funding
This research was funded by the Government of the French Community (named Fédération Wallonie-Bruxelles) in Belgium and related to a FRHE project called THERMPOCOMP.
Institutional Review Board Statement
Not applicable.
Informed Consent Statement
Not applicable.
Data Availability Statement
Data are contained within the article.
Conflicts of Interest
The authors declare no conflicts of interest.
References
- Ahmed, O.; Wang, X.; Tran, M.V.; Ismadi, M.Z. Advancements in fibre-reinforced polymer composite materials damage detection methods: Towards achieving energy-efficient SHM systems. Compos. Part B Eng. 2021, 223, 109136. [Google Scholar] [CrossRef]
- Wang, Z.; Wan, L.; Zhu, J.; Ciampa, F. Evaluation of defect depth in CFRP composites by long pulse thermography. NDT E Int. 2022, 129, 102658. [Google Scholar] [CrossRef]
- Bossi, R.H.; Georgeson, G.E. Nondestructive testing of aerospace composites polymer composites in the aerospace industry. In Polymer Composites in the Aerospace Industry; Woodhead Publishing: Sawston, UK, 2020. [Google Scholar]
- Zhuo, P.; Li, S.; Ashcroft, I.A.; Jones, A.I. Material extrusion additive manufacturing of continuous fiber reinforced polymer matrix composites: A review and outlook Material extrusion additive manufacturing of continuous fiber reinforced polymer matrix composites. Compos. Part B Eng. 2021, 224, 109143. [Google Scholar] [CrossRef]
- Karayel, E.; Bozkurt, Y. Additive manufacturing method and different welding applications. J. Mater. Res. Technol. 2020, 9, 11424–11438. [Google Scholar] [CrossRef]
- Demarbaix, A.; Ochana, I.; Levrie, J.; Coutinho, I.; Cunha, S.S., Jr.; Moonens, M. Additively Manufactured Multifunctional Composite Parts with the Help of Coextrusion Continuous Carbon Fiber: Study of Feasibility to Print Self-Sensing without Doped Raw Material. J. Compos. Sci. 2023, 7, 355. [Google Scholar] [CrossRef]
- Dizon, J.R.C.; Espera, A.H., Jr.; Chen, Q.; Advincula, R.C. Mechanical characterization of 3D-printed polymers. Addit. Manuf. 2018, 20, 44–67. [Google Scholar] [CrossRef]
- Mayr, G.; Plank, B.; Sekelja, J.; Hendorfer, G. Active thermography as a quantitative method for non-destructive evaluation of porous carbon fiber reinforced polymer. NDT&E Int. 2011, 44, 537–543. [Google Scholar]
- Deane, S.; Avdelidis, N.P.; Ibarra-Castanedo, C.; Zhang, H.; Nezhad, H.Y.; Williamson, A.A.; Mackley, T.; Davis, M.J.; Maldague, X.; Tsourdos, A. Application of NDT thermographic imaging of aerospace structures. Infrared Phys. Technol. 2019, 97, 456–466. [Google Scholar] [CrossRef]
- Hedayatrasa, S.; Poelman, G.; Segers, J.; Van Paepegem, W.; Kersemans, M. Performance of frequency and/or phase modulated excitation waveforms for optical infrared thermography of CFRPs through thermal wave radar: A simulation study. Compos. Struct. 2019, 225, 111177. [Google Scholar] [CrossRef]
- Saeed, N.; Abdulrahman, Y.; Amer, S.; Omar, M.A. Experimentally validated defect depth estimation using artificial neural network in pulsed thermography. Infrared Phys. Technol. 2019, 98, 192–200. [Google Scholar] [CrossRef]
- Notebaert, A.; Quinten, J.; Moonens, M.; Olmez, V.; Barros, C.; Cunha, S.S., Jr.; Demarbaix, A. Numerical Modelling of the Heat Source and the Thermal Response of an Additively Manufactured Composite during an Active Thermographic Inspection. Materials 2024, 17, 13. [Google Scholar] [CrossRef] [PubMed]
- Berde, N.N.; Sanap, S.B.; Thorat, S.G. Study of impact and fatigue on 3D printed. Mater. Today Proc. 2021, 47, 2376–2378. [Google Scholar] [CrossRef]
Disclaimer/Publisher’s Note: The statements, opinions and data contained in all publications are solely those of the individual author(s) and contributor(s) and not of MDPI and/or the editor(s). MDPI and/or the editor(s) disclaim responsibility for any injury to people or property resulting from any ideas, methods, instructions or products referred to in the content. |
© 2024 by the authors. Licensee MDPI, Basel, Switzerland. This article is an open access article distributed under the terms and conditions of the Creative Commons Attribution (CC BY) license (https://creativecommons.org/licenses/by/4.0/).

