
IMU Sensor for In-Situ 3D Movement Monitoring of Particulate Matter †


Abstract
1. Introduction
2. Materials and Methods
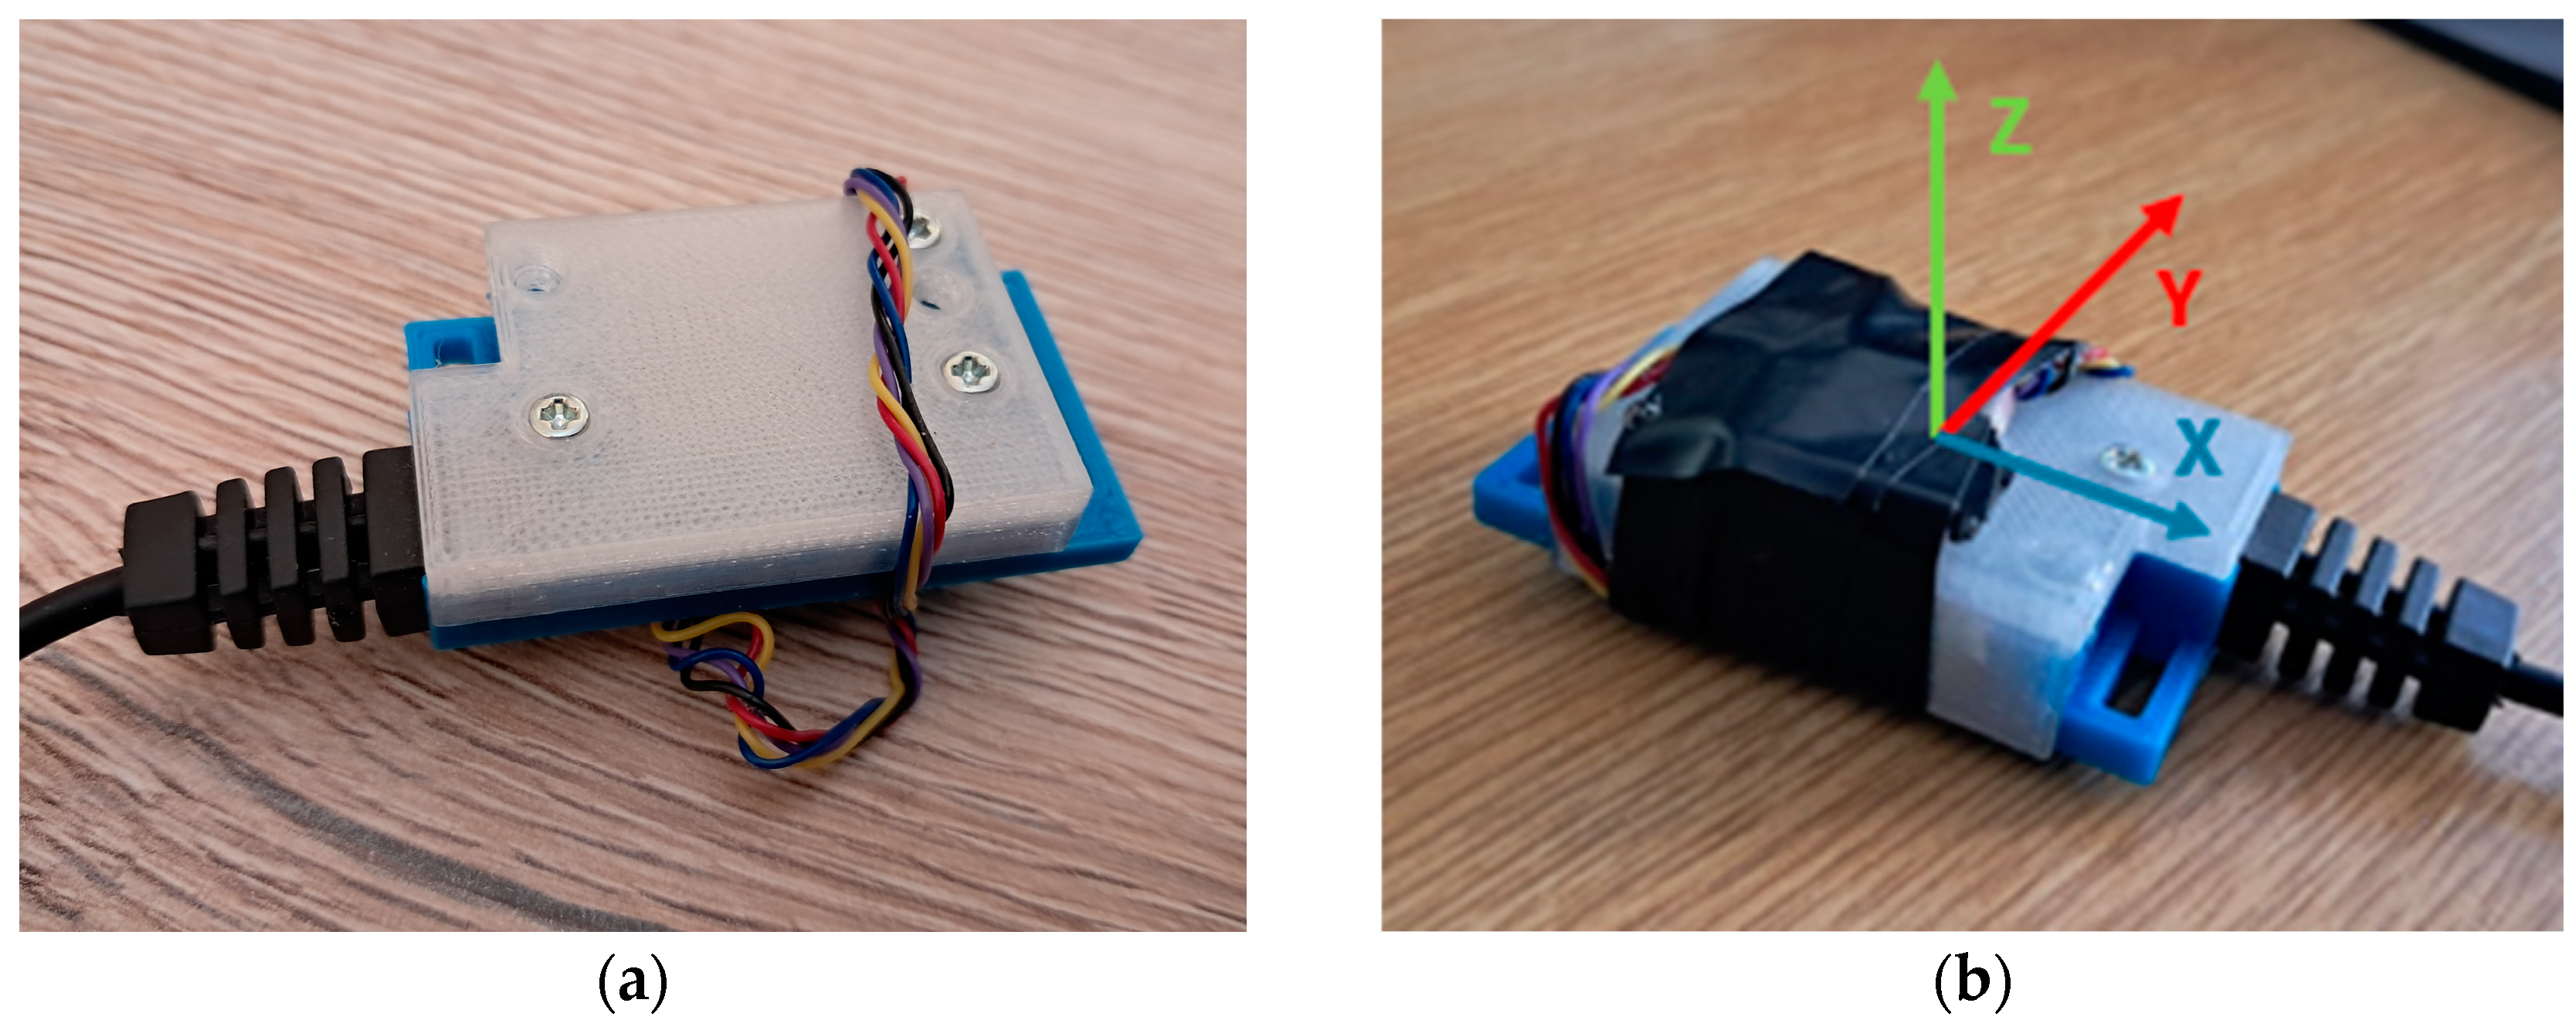
2.1. Module Assembly
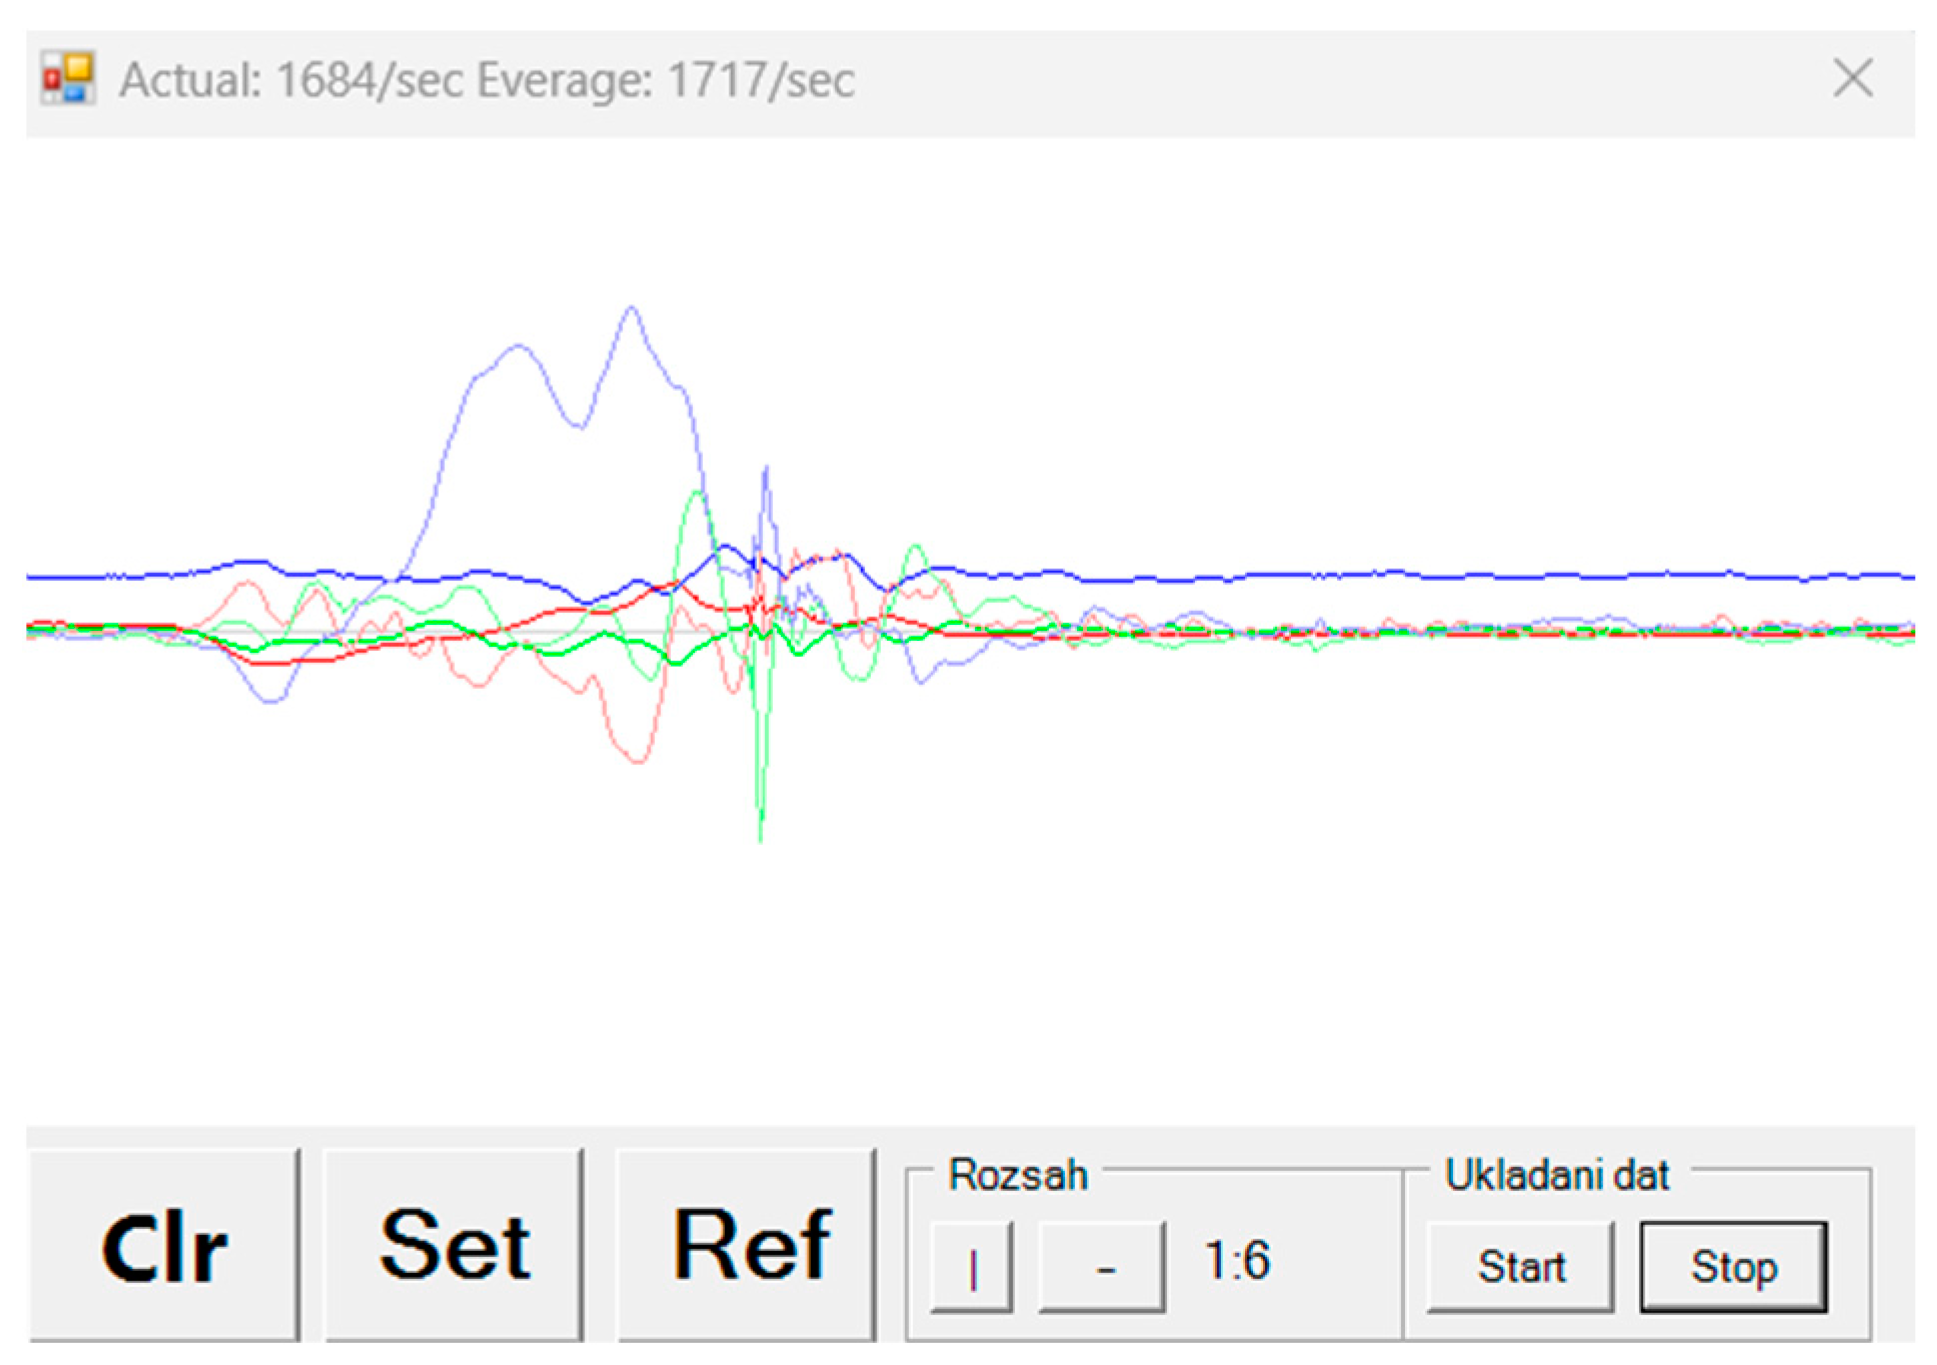
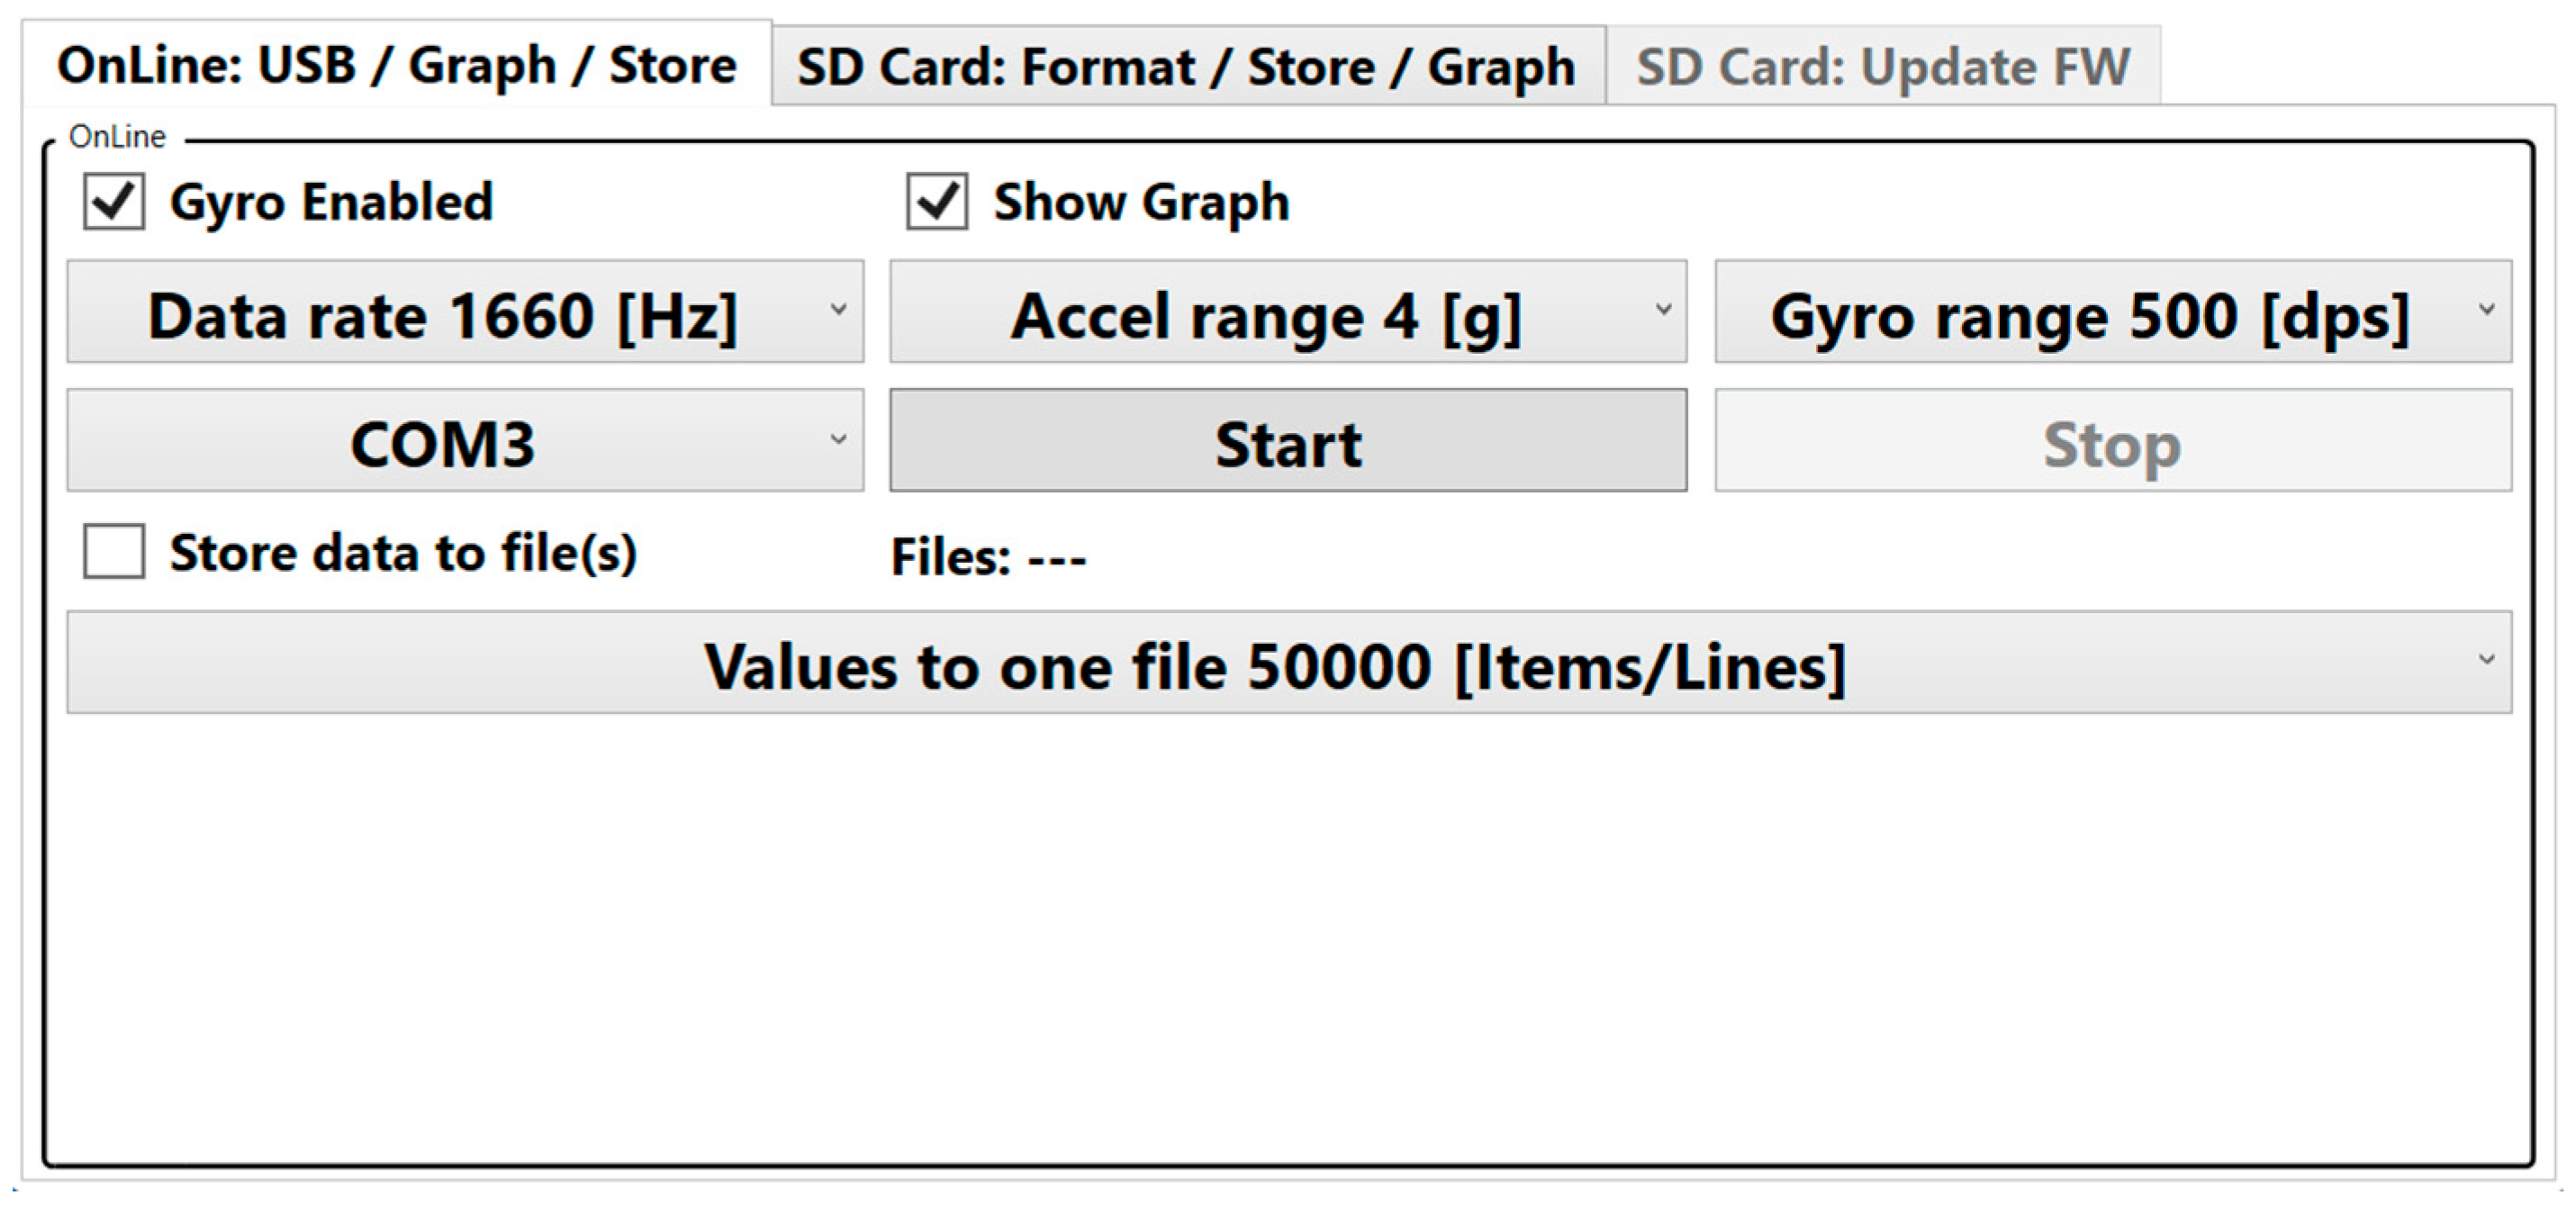
2.2. The Software
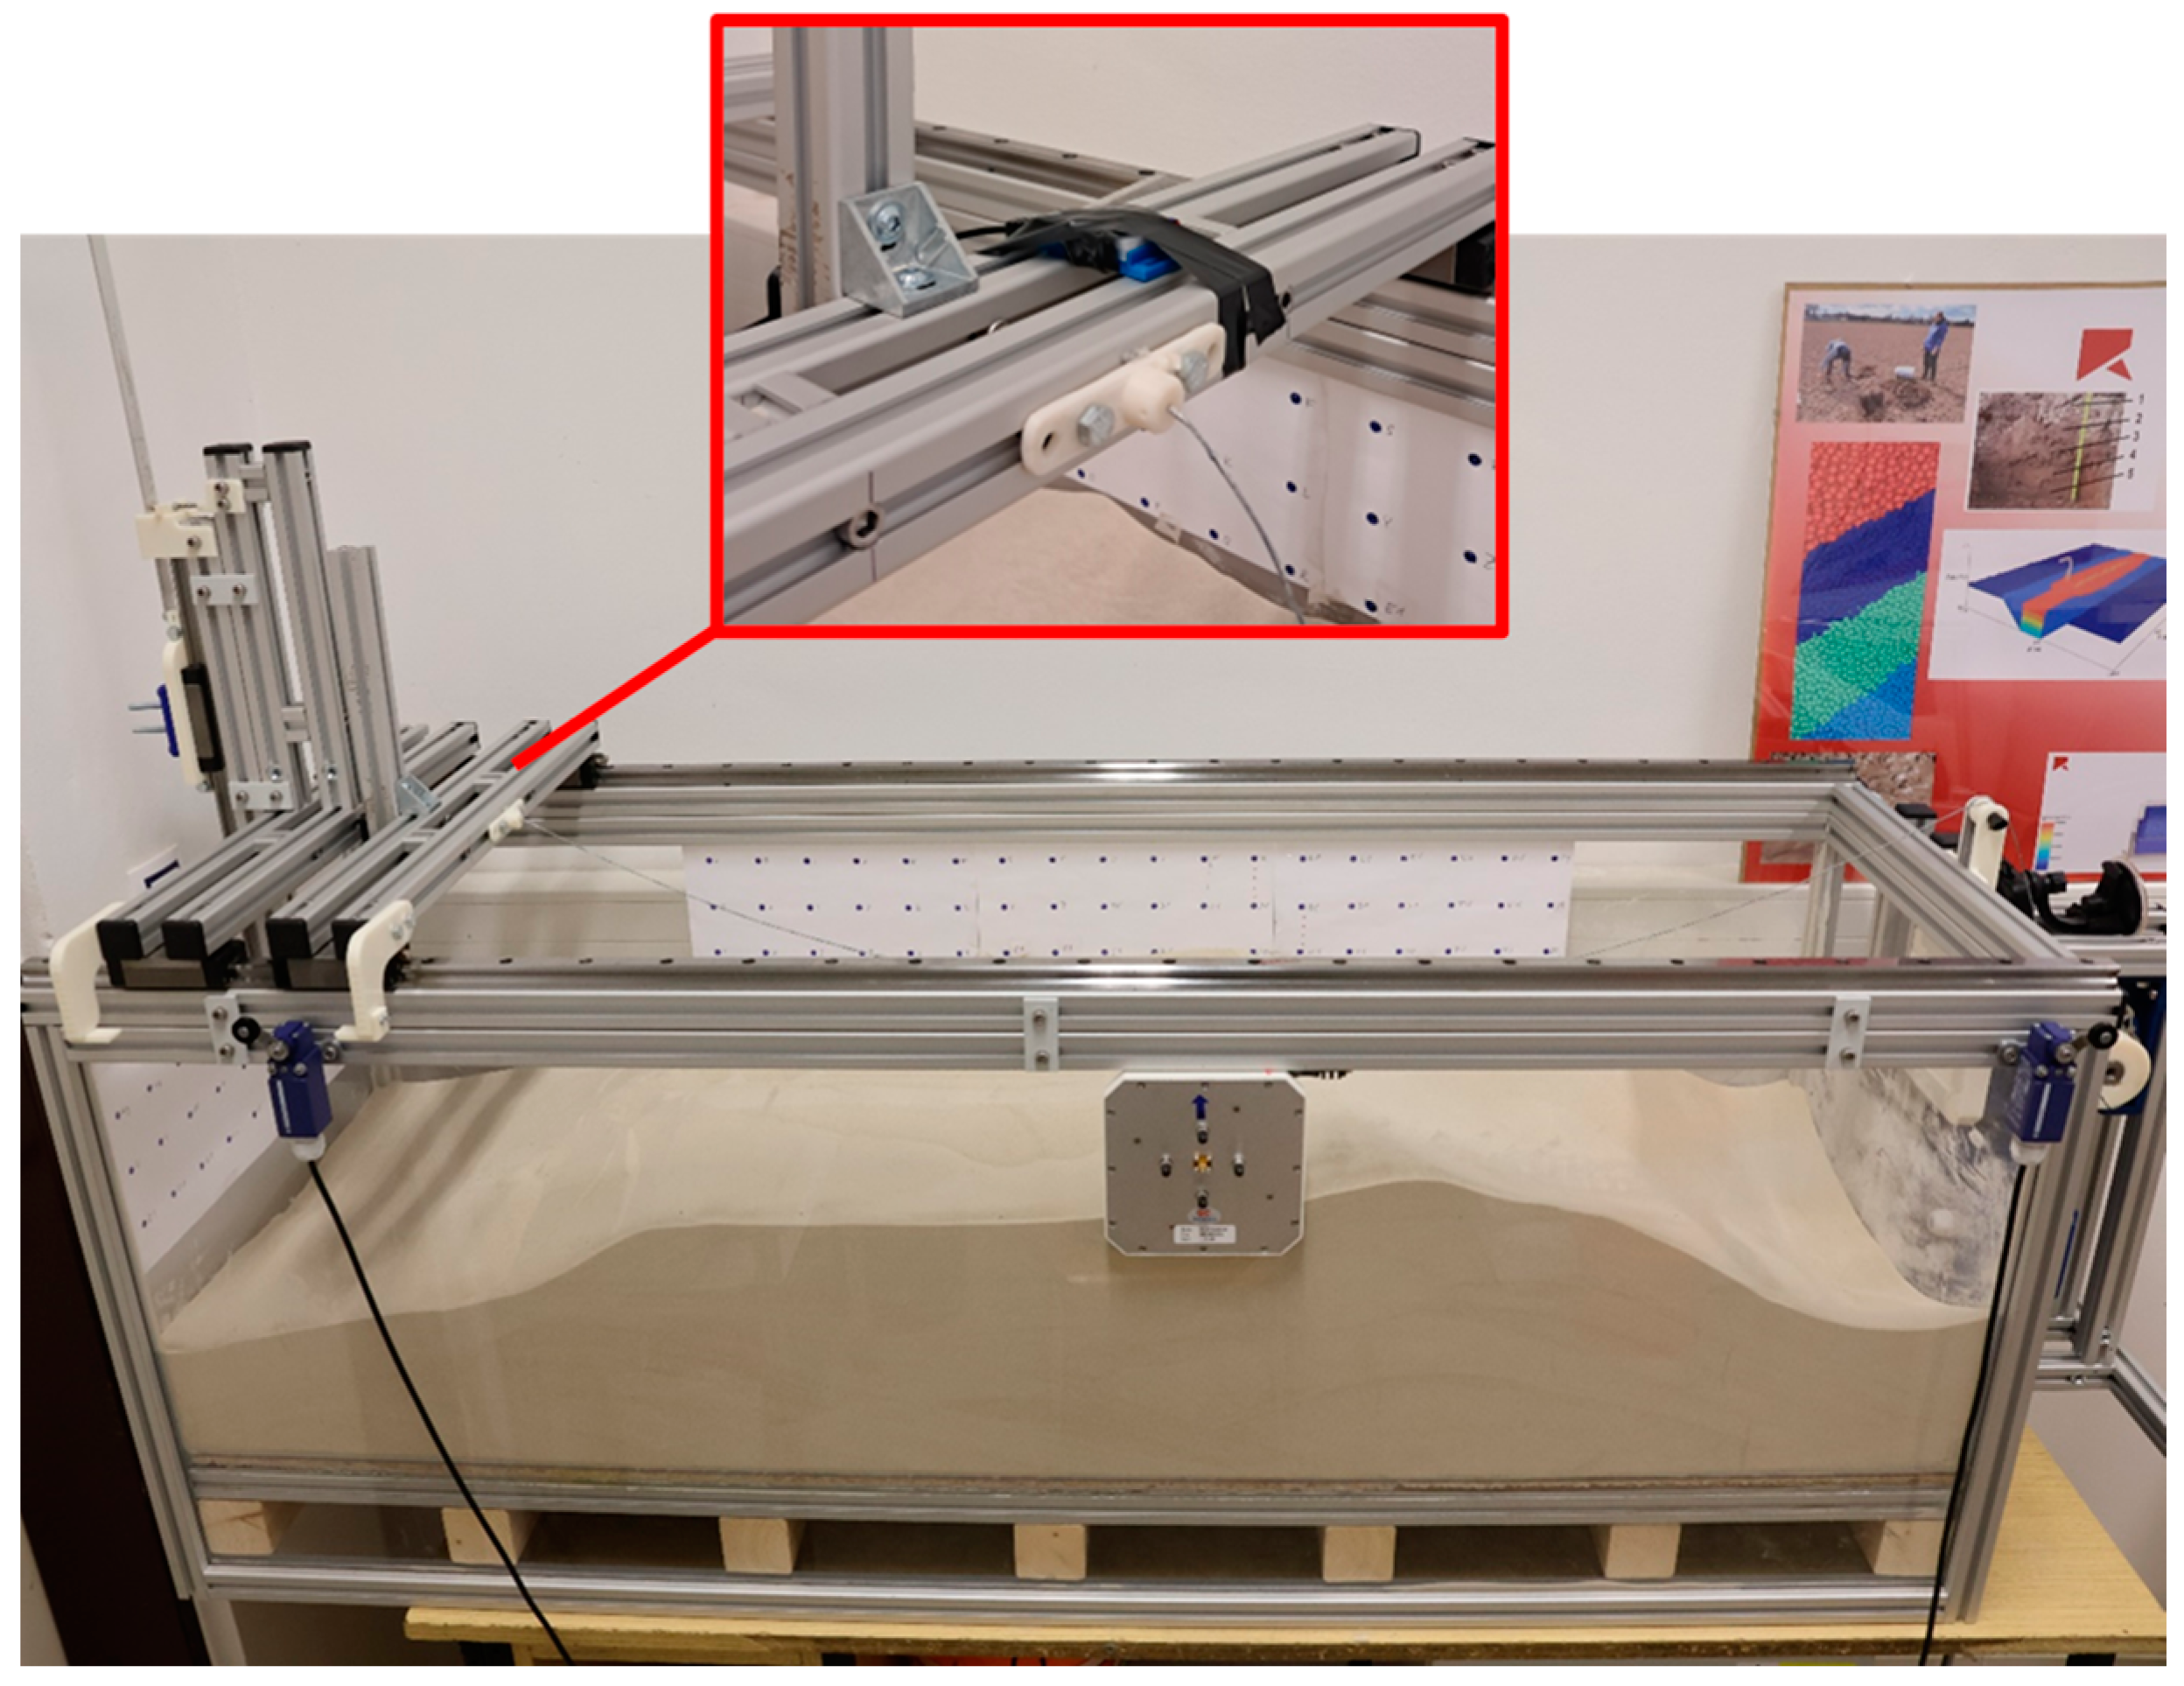
2.3. The Experiment
3. Results
- represents the acceleration in a given step (m/s2);
- is the acceleration in the given step (g);
- 1 g = 9.81 m/s2.

- is the velocity in the current time step (m/s);
- is the acceleration in the current time step (m/s2);
- is the current time (s);
- is the time from the previous time step (in s);
- represents the time interval between the two measurements (s);
- is the velocity from the previous time step (m/s).
- is the distance in the current time step (m);
- is the velocity in the current time step (m/s);
- is the time in the current time step (s);
- is the time from the previous time step (s);
- is the time interval between the two measurements (s);
- is the distance from the previous time step (m).
4. Discussion and Conclusions
Author Contributions
Funding
Institutional Review Board Statement
Informed Consent Statement
Data Availability Statement
Acknowledgments
Conflicts of Interest
References
- Ariza-Sentís, M.; Vélez, S.; Martínez-Peña, R.; Baja, H.; Valente, J. Object detection and tracking in Precision Farming: A systematic review. Comput. Electron. Agric. 2024, 219, 108757. [Google Scholar] [CrossRef]
- Ooi, G.L.; Wang, Y.H. Applying MEMS Accelerometers to Measure Ground Vibration and Characterize Landslide Initiation Features in Laboratory Flume Test. In Proceedings of the Geo-Congress 2014, Atlanta, GA, USA, 23–26 February 2014; pp. 2019–2028. [Google Scholar] [CrossRef]
- Zhang, D.; Liu, C.; Nguyen, B.K. Low-Cost Real-Time Localisation for Agricultural Robots in Unstructured Farm Environments. Machines 2024, 12, 612. [Google Scholar] [CrossRef]
- Hu, S.; Reverter, A.; Arablouei, R.; Bishop-Hurley, G.; McNally, J.; Alvarenga, F.; Ingham, A. Analyzing Cattle Activity Patterns with Ear Tag Accelerometer Data. Animals 2024, 14, 301. [Google Scholar] [CrossRef]
- Singh, A.; Nawayseh, N.; Samuel, S.; Dhabi, Y.K.; Singh, H. Real-time vibration monitoring and analysis of agricultural tractor drivers using an IoT-based system. J. Field Robot. 2023, 40, 1723–1738. [Google Scholar] [CrossRef]
- Kusumawardani, R.; Nugroho, U.; Fansuri, M.H.; Mindiastiwi, T.; Yuniarti, W.; Hilmi, A.S. The impact of vehicle load inducing vibrations on the subgrade soil particle acceleration. J. Eng. Sci. Technol. 2018, 13, 1440–1450. [Google Scholar]
- Justa, J.; Šmídl, V.; Hamáček, A. Fast AHRS Filter for Accelerometer, Magnetometer, and Gyroscope Combination with Separated Sensor Corrections. Sensors 2020, 20, 3824. [Google Scholar] [CrossRef] [PubMed]
- Shaheb, M.R.; Sarker, A.; Shearer, S.A.; Shaheb, M.R.; Sarker, A.; Shearer, S.A. Precision Agriculture for Sustainable Soil and Crop Management. In Soil Science—Emerging Technologies, Global Perspectives and Applications; IntechOpen: Rijeka, Croatia, 2022. [Google Scholar] [CrossRef]
- Kaharuddin, S.; Ain, M.F.; Mamat, M.N.; Abdullah, M.N.; Yusob, M.F.B.M. Soil mass movement monitoring for landslide detection using low-cost accelerometer sensor as inclinometer. J. Phys. Conf. Ser. 2022, 2312, 012056. [Google Scholar] [CrossRef]
- Rossi, Y.; Tatsis, K.; Awadaljeed, M.; Arbogast, K.; Chatzi, E.; Rothacher, M.; Clinton, J. Kalman filter-based fusion of collocated acceleration, gnss and rotation data for 6c motion tracking. Sensors 2021, 21, 1543. [Google Scholar] [CrossRef] [PubMed]
- Saho, K. Kalman Filter for Moving Object Tracking: Performance Analysis and Filter Design. In Kalman Filters—Theory for Advanced Applications; IntechOpen: Rijeka, Croatia, 2018. [Google Scholar] [CrossRef]
- Rzucidło, P.; Kopecki, G.; Szczerba, P.; Szwed, P. Analysis of Stochastic Properties of MEMS Accelerometers and Gyroscopes Used in the Miniature Flight Data Recorder. Appl. Sci. 2024, 14, 1121. [Google Scholar] [CrossRef]
- El Dahr, R.; Lignos, X.; Papavieros, S.; Vayas, I. Dynamic Assessment of the Structural Behavior of a Pedestrian Bridge Aiming to Characterize and Evaluate Its Comfort Level. Buildings 2023, 13, 3053. [Google Scholar] [CrossRef]
- Tahir, S.B.U.D.; Jalal, A.; Kim, K. Wearable Inertial Sensors for Daily Activity Analysis Based on Adam Optimization and the Maximum Entropy Markov Model. Entropy 2020, 22, 579. [Google Scholar] [CrossRef] [PubMed]
- Tereshkov, V.M. A Simple Observer for Gyro and Accelerometer Biases in Land Navigation Systems. J. Navig. 2015, 68, 635–645. [Google Scholar] [CrossRef]
- Pásthy, L.; Szabó, B.; Tamás, K. Measuring and modelling of soil displacement from a horizontal penetrometer and a sweep using an IMU sensor fusion and DEM. Soil Tillage Res. 2024, 244, 106207. [Google Scholar] [CrossRef]


Disclaimer/Publisher’s Note: The statements, opinions and data contained in all publications are solely those of the individual author(s) and contributor(s) and not of MDPI and/or the editor(s). MDPI and/or the editor(s) disclaim responsibility for any injury to people or property resulting from any ideas, methods, instructions or products referred to in the content. |
© 2025 by the authors. Licensee MDPI, Basel, Switzerland. This article is an open access article distributed under the terms and conditions of the Creative Commons Attribution (CC BY) license (https://creativecommons.org/licenses/by/4.0/).
Share and Cite
Černilová, B.; Kuře, J. IMU Sensor for In-Situ 3D Movement Monitoring of Particulate Matter. Eng. Proc. 2024, 82, 57. https://doi.org/10.3390/ecsa-11-20509
Černilová B, Kuře J. IMU Sensor for In-Situ 3D Movement Monitoring of Particulate Matter. Engineering Proceedings. 2024; 82(1):57. https://doi.org/10.3390/ecsa-11-20509
Chicago/Turabian StyleČernilová, Barbora, and Jiří Kuře. 2024. "IMU Sensor for In-Situ 3D Movement Monitoring of Particulate Matter" Engineering Proceedings 82, no. 1: 57. https://doi.org/10.3390/ecsa-11-20509
APA StyleČernilová, B., & Kuře, J. (2024). IMU Sensor for In-Situ 3D Movement Monitoring of Particulate Matter. Engineering Proceedings, 82(1), 57. https://doi.org/10.3390/ecsa-11-20509