Abstract
This study examines human factors in bus accidents using bibliometric analysis to identify publications, research trends, and collaborative relationships between authors and institutions. Data from 1.834 publications in the Scopus database during the period 2014–2024 were analyzed using VOS viewer software to display network visualization and density. The results show a significant increase in publications since 2018, with a peak in 2022. Research related to human factors in bus accidents is growing, with a focus on fatigue, distraction, and driver behavior. The keyword and density analysis identified that “Human” was the most frequently discussed topic. China is the country with the highest contribution, and the medical field plays a major role in this topic. These findings highlight the importance of understanding human factors in efforts to improve transportation safety.
1. Introduction
The Ministry of Transportation noted that traffic accidents in the Indonesian LLAJ (Traffic and Road Transportation) transportation mode experienced several spikes. The number of accidents investigated by the National Transportation Safety Committee from 2014 to 2021 in the road transportation mode, specifically bus accidents, amounted to 34 cases, involving a total 1.024 victims [1]. Accident cases involving buses are of concern because they have the potential to claim many victims [2]. Many factors can influence the occurrence of bus accidents, one factor that is still rarely discussed but makes a significant contribution is the human factor. The human factor includes various elements related to the performance, behavior, and psychological and physical conditions of the individuals involved [3].
Driver fatigue is one of the important aspects of human factors that can cause bus accidents. Distractions while driving can also divert the driver’s attention from the road, increasing the likelihood of an accident [4]. In addition, drivers who are less experienced in driving are not prepared to face emergencies on the road [5]. Human error is related to many things. Human error is not only related to individual performance but also related to system design, training, and operational management.
Understanding how human factors interact and contribute to accidents is essential to reduce the occurrence of bus accidents [6]. To better understand how human factors contribute to bus accidents, several case studies from different countries can provide deeper insights. These case studies reveal how human error, fatigue, distraction, and risky behavior can lead to fatal accidents.
The bibliometric mapping method analyzes and visualizes patterns in scientific literature by utilizing bibliographic data from scientific publications such as journal articles, books, or conference proceedings. This method analyzes various aspects of research, such as citation distribution, topic trends, and relationships between authors. The following are some of the main components of bibliometric mapping:
- Citation Analysis: Assessing how many times other publications cite a scientific work to evaluate its influence and relevance in a particular field.
- Connections Between Authors: Discovering collaborations between authors or institutions and networks formed through collaborative research.
- Research Trends: Identifying key research topics and how they are evolving.
- Journal and Conference Analysis: Determining which journals or conferences are the most cited and published in a field.
This method usually involves the use of bibliometric programs, such as VOS viewer and CitNetExplorer, to assist in processing and visualizing bibliographic data [7,8]. Bibliometric mapping has advantages that help the research and management of scientific knowledge, including the following:
- Identifying Research Trends
Bibliometric mapping can help identify research trends and emerging topics. This allows researchers and institutions to focus on emerging and important areas in the future.
- 2.
- Measuring the Impact of Research
Bibliometric mapping can be used to measure the influence of a particular article or journal by analyzing citations. This helps evaluate the relevance and impact of research in a particular field.
- 3.
- Revealing the Structure of Science
Bibliometric mapping can reveal relationships between different research topics and research collaborations and how a particular field has developed over time. This provides insight into the structure of science itself.
- 4.
- Helping Decision Making
Policy makers can use information from bibliometric analysis to make better decisions regarding the allocation of research funds, the development of academic curricula, or the setting of research priorities in institutions.
- 5.
- Effectiveness in Conducting Literature Review
Bibliometric mapping enables researchers to search literature effectively by depicting the network of relevant topics, authors, or journals. This saves time in understanding the broad research landscape [9].
Bibliometric mapping involves measuring and analyzing various aspects, as explained earlier. The following are some common and frequently used types of bibliometric mapping:
- Keyword Mapping
Keyword mapping is used to identify and explain key terms or concepts in the literature. This mapping helps us understand the main themes and subthemes that develop in a particular research field.
- 2.
- Citation Mapping
Citation mapping involves analyzing the relationships between documents through citation patterns. Citation mapping is used to identify the most influential literature, understand the intellectual relationships between documents, and track the development of research topics.
- 3.
- Collaboration Mapping
Collaboration mapping identifies and illustrates collaborative relationships between authors, institutions, or countries in a research field. This mapping is usually conducted through co-authorship analysis, which can help us to understand collaboration networks in the scientific community, identify leading research centers, and map global collaboration patterns.
- 4.
- Literature Network Mapping
Literature network mapping involves creating maps that depict document relationships based on citations, co-citations, or bibliographic associations. Literature network mapping provides visualizations that help us to understand the structure of literature networks in a field. This mapping is used to identify groups of related studies, find clusters in the literature, and explore relationships between studies.
- 5.
- Thematic Mapping
Thematic mapping is used to identify important themes in the scientific literature and to understand how these themes develop. This is usually conducted through keyword analysis or abstract clusters.
- 6.
- Research Evolution Mapping
This mapping illustrates the temporal evolution of a research field. By linking the trends of keywords, authors, and documents over time, this mapping helps in understanding how a topic or research field has evolved [10].
2. Method
This study aims to identify publications related to human factors in bus accidents and to visualize the results of the identification. This study uses bibliometric visualization and bibliometric analysis methods. As a quantitative method, bibliometric analysis uses an evaluative and descriptive approach. The sample in this study comprises 1.834 publications taken from the Scopus database using appropriate keywords. The keywords in this study are “BUS” AND “ACCIDENTS”, “CAUSED”, AND “BY”, “HUMAN”, AND “FACTORS”. The selected publications are from the last ten years, 2014–2024, using VOS viewer, and two views are used in VOS viewer, namely network visualization and density visualization. The indicators used consider the number of citations and the total strength between the objects displayed. The stages of bibliometric analysis were adopted from previous studies [11,12,13]. The stages of the bibliometric analysis method are as follows. Figure 1 shows the bibliometric analysis method stages.
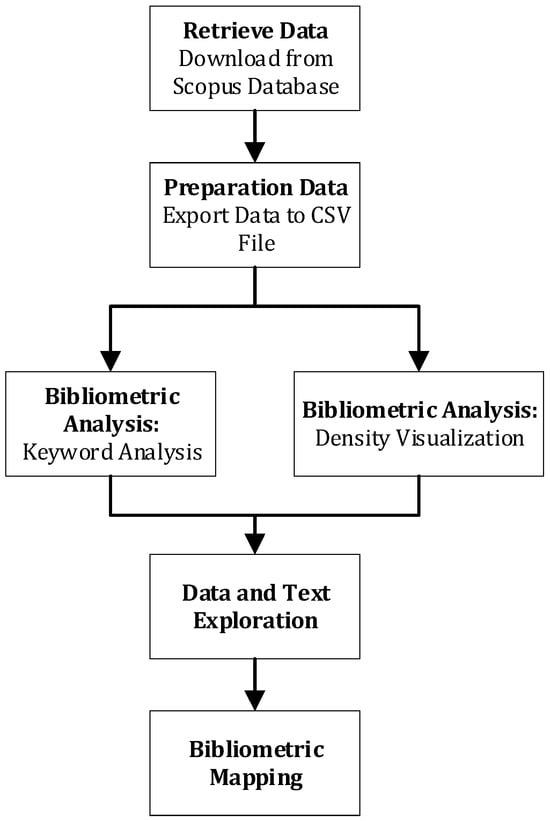
Figure 1.
Bibliometric analysis method stages.
3. Results and Discussion
The Results and Discussion Section presents the results of a bibliometric analysis of human factors in bus accidents based on publication data from the Scopus database, covering the period from 2014 to 2024. This section provides an in-depth discussion of the visualization of research trends and collaborations between authors and institutions, as well as keyword and density analyses to offer insights into the development and primary focus areas within this research. The results and the discussion can be seen below.
3.1. Publication Development of Research Topics Human Factors in Bus Accidents
The results of the analysis of the development of publications in the last ten years (2014–2024) contain 1.834 articles; the largest number was in 2022. The development of international publications related to human factors in bus accidents has increased significantly since 2018. Table 1 shows an analysis of the number of publications by year and period, which continues to increase. The development of publications related to research on human factors in bus accidents in 2014–2024 shows a continuous growth in the publications of bus accident research. The data show that there is an increasing trend in publications every year, and studies in which the topic of research is the human factors in bus accidents are increasingly in demand by experts. The data are shown on Table 1 below, and we can see the graphical illustration of the data development of human factors in bus accidents in Figure 2.

Table 1.
Development of human factors in publications of bus accident studies in the last 10 years (2014–2024).
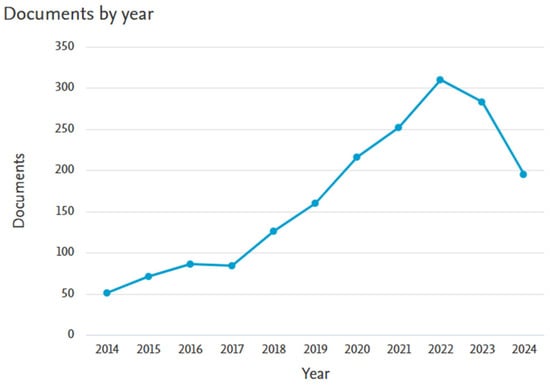
Figure 2.
Publication development graph from Scopus database.
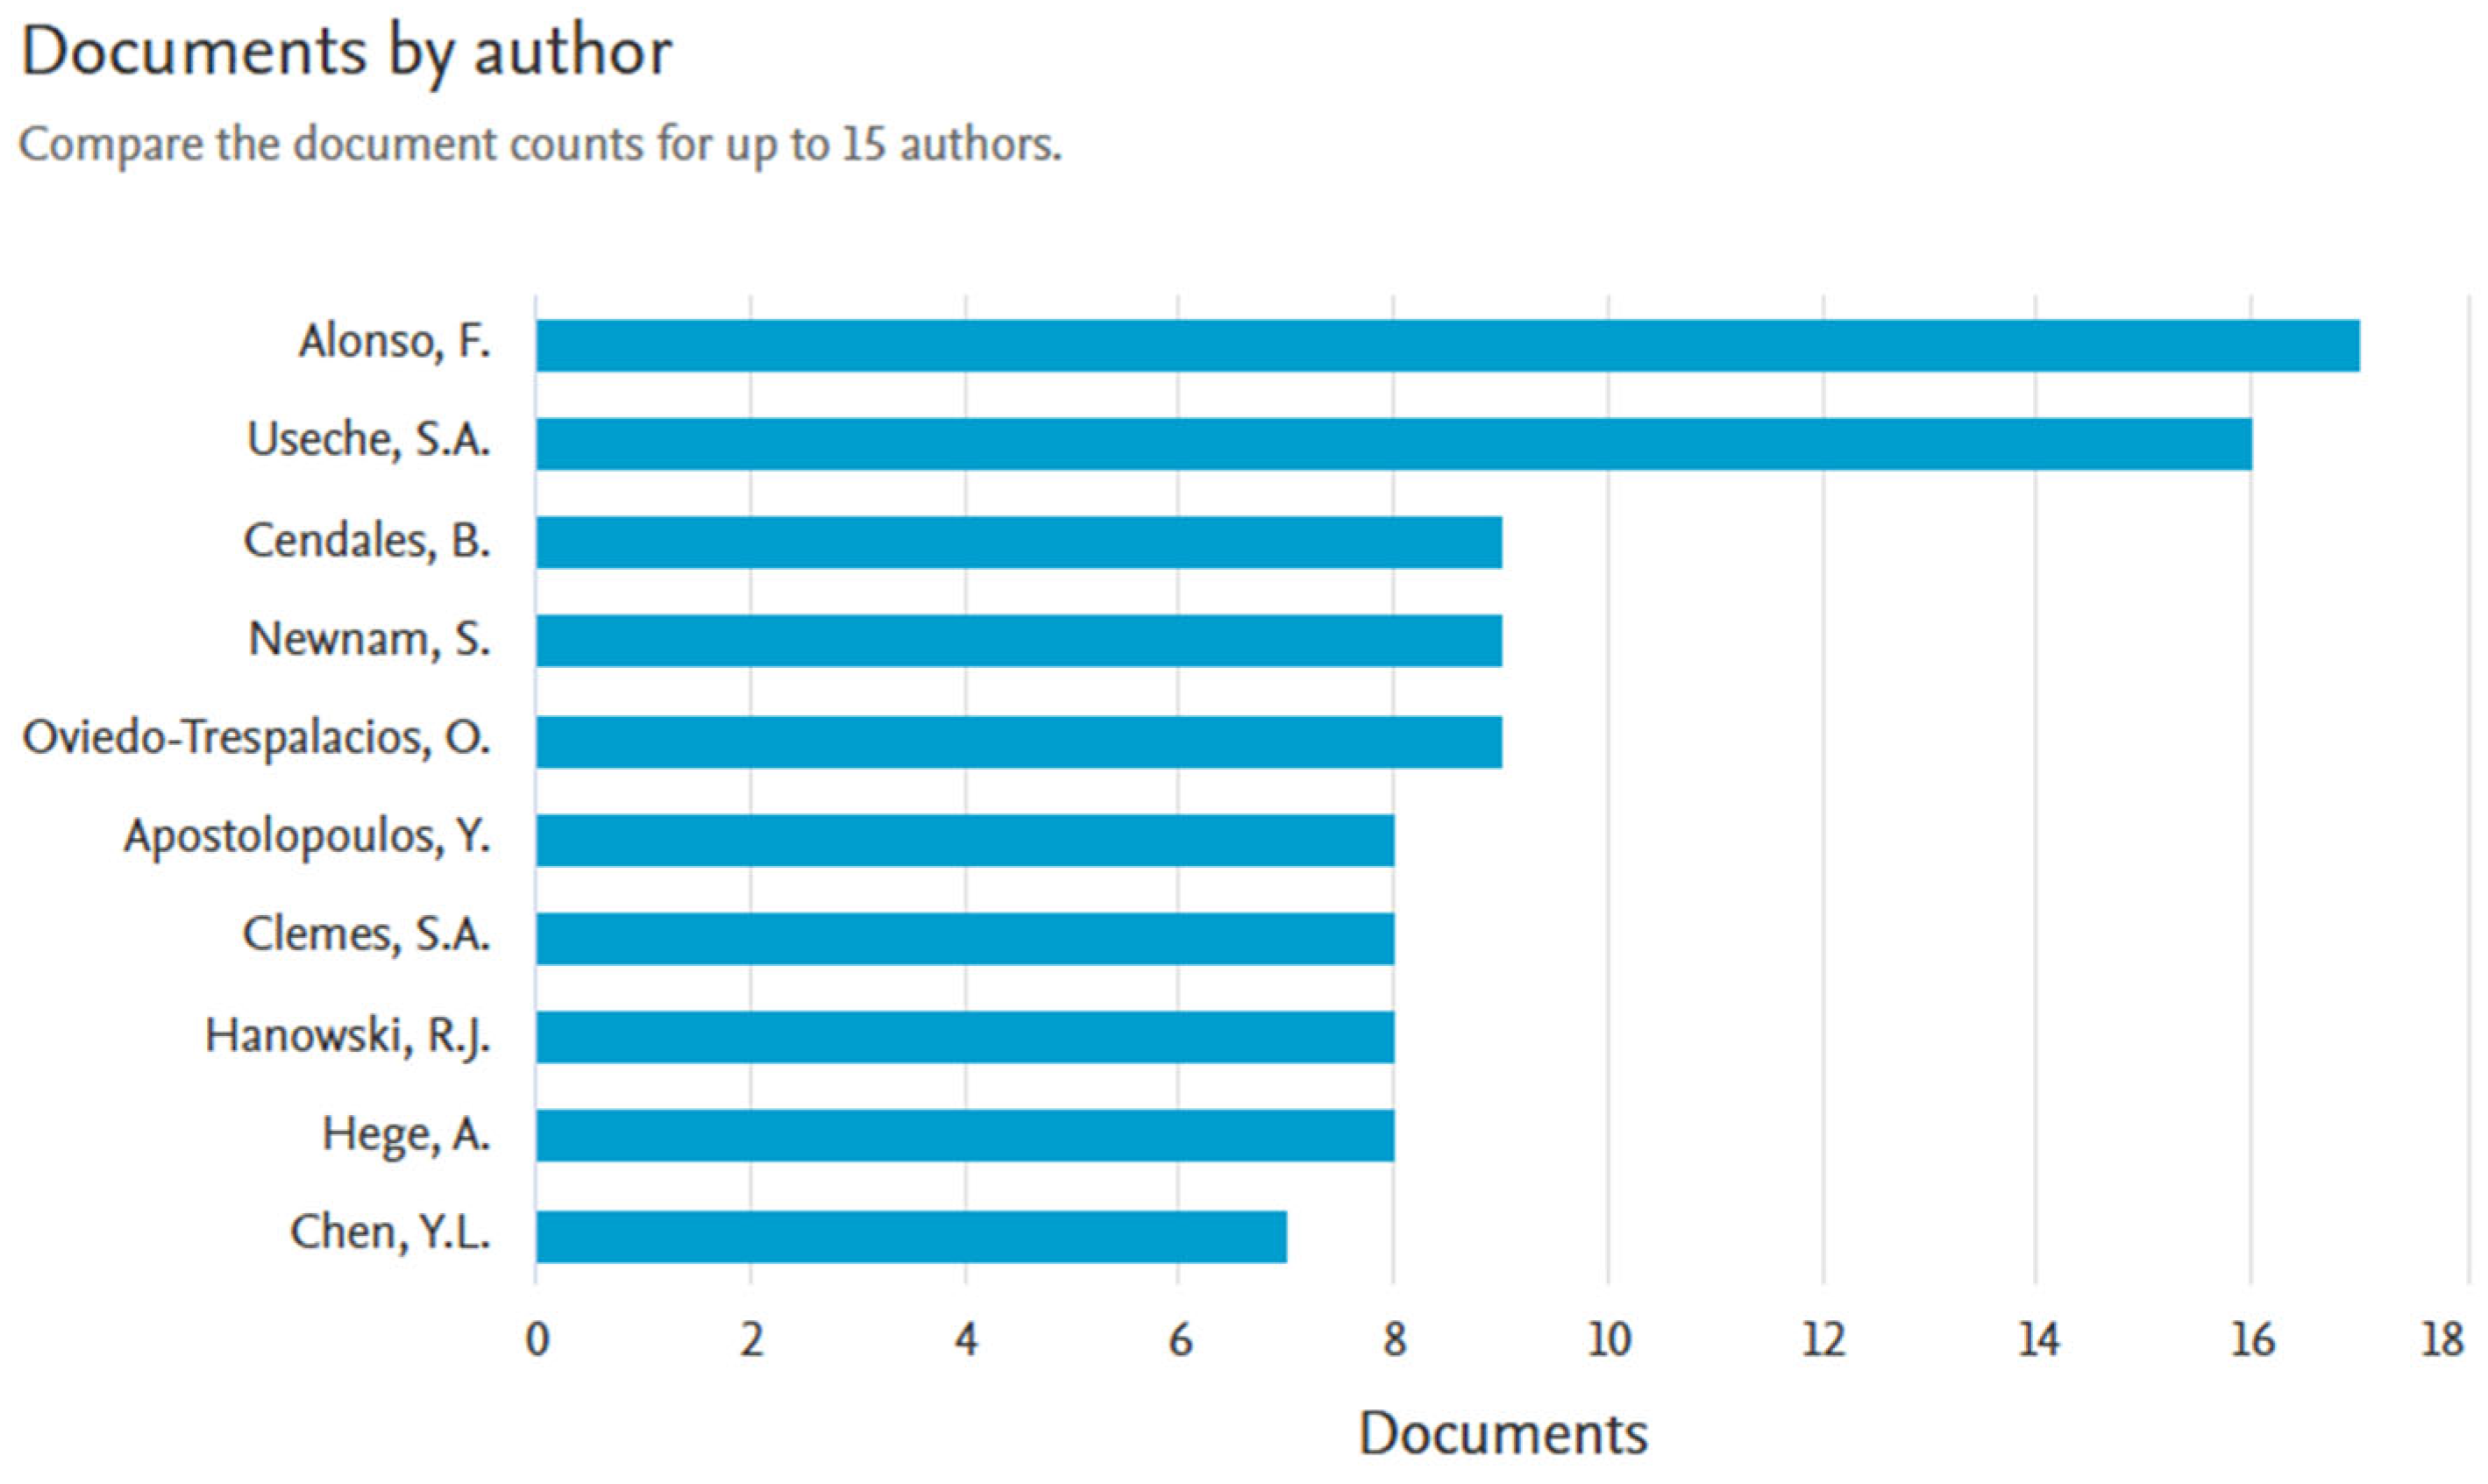
3.2. Authors and Affiliations of Scopus Database Research Topics
Bibliometric analysis identified the authors and the number of citations. The results can be seen in Figure 2; no author has a dominant number of studies. On average, authors have only 1–17 studies on bus accident research, as shown in Figure 3.
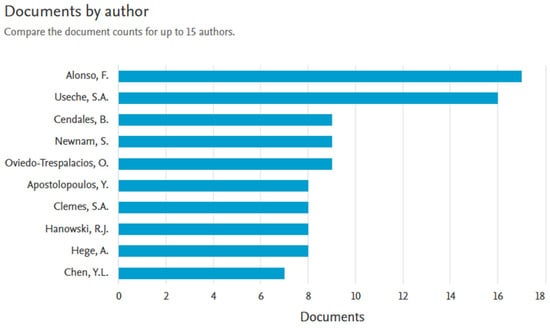
Figure 3.
Number of documents based on author.
Figure 3 shows that Francisco Alonso from the Universitat de Valencia is the most prolific author in terms of research on human factors in bus accidents.
3.3. Country Affiliation
Scopus identified 1.834 documents from various countries, as shown in Figure 4. The countries with the highest contributions during 2014–2024 were China with 352 documents, the United States with 351 documents, the United Kingdom with 234 documents, and Australia with 172 documents.
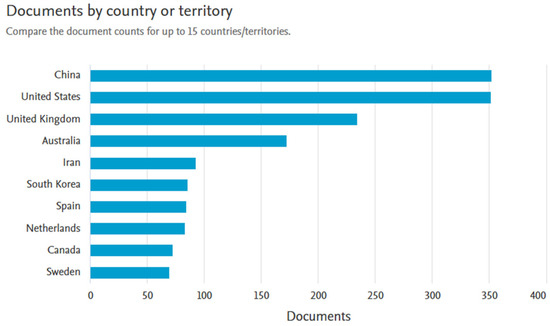
Figure 4.
Number of publication documents by country.
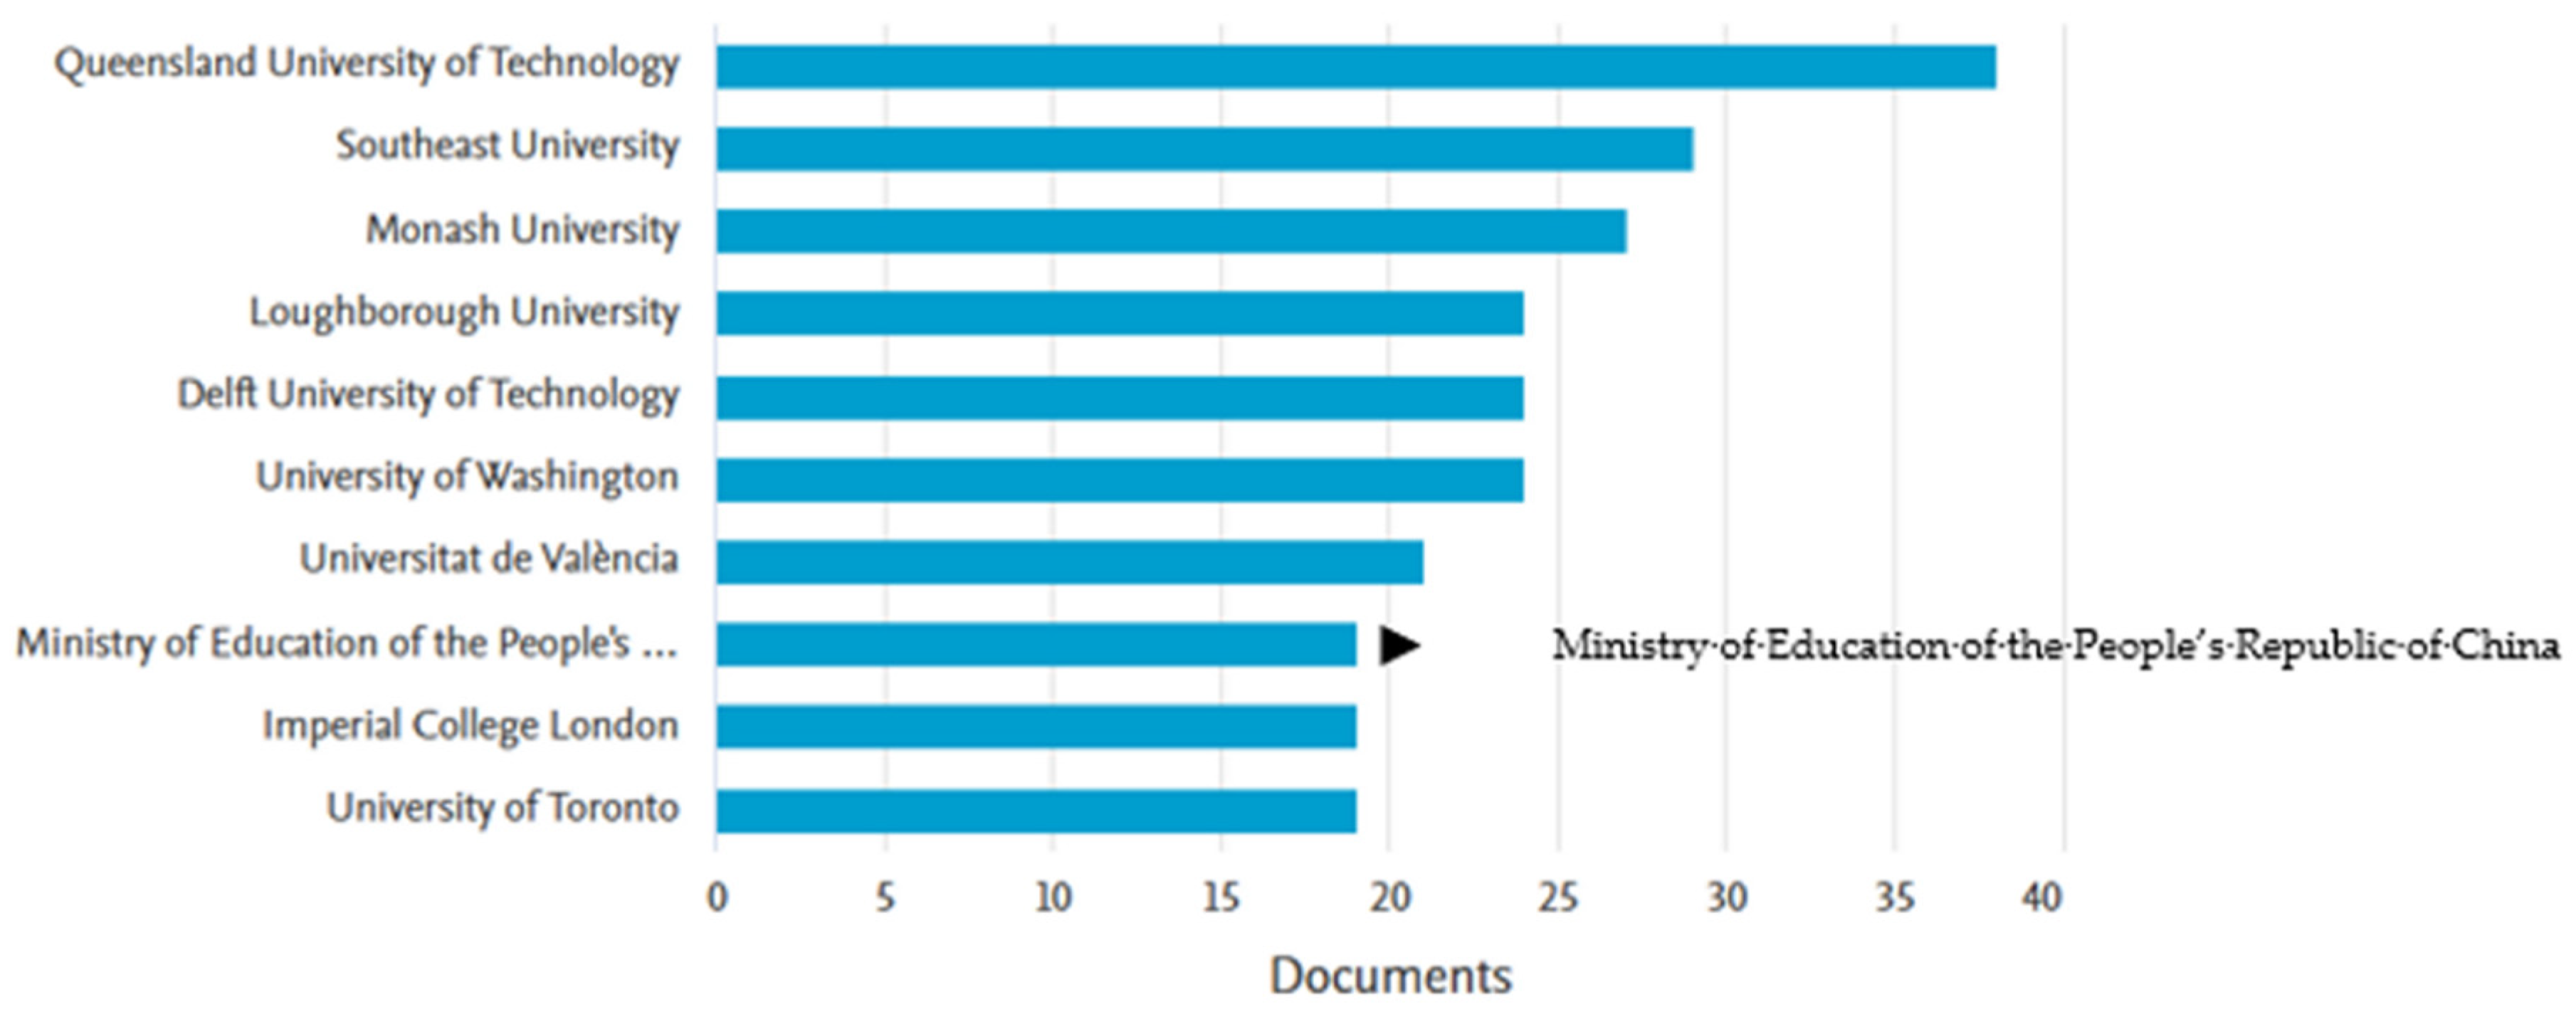
3.4. Institutional Affiliation
Figure 5 shows institutional affiliations based on the topic cluster of human factors in bus accidents. The Queensland University of Technology institutional affiliation dominates the bus accident research topic, with 38 research documents produced.

Figure 5.
Number of documents based on institutional affiliation.
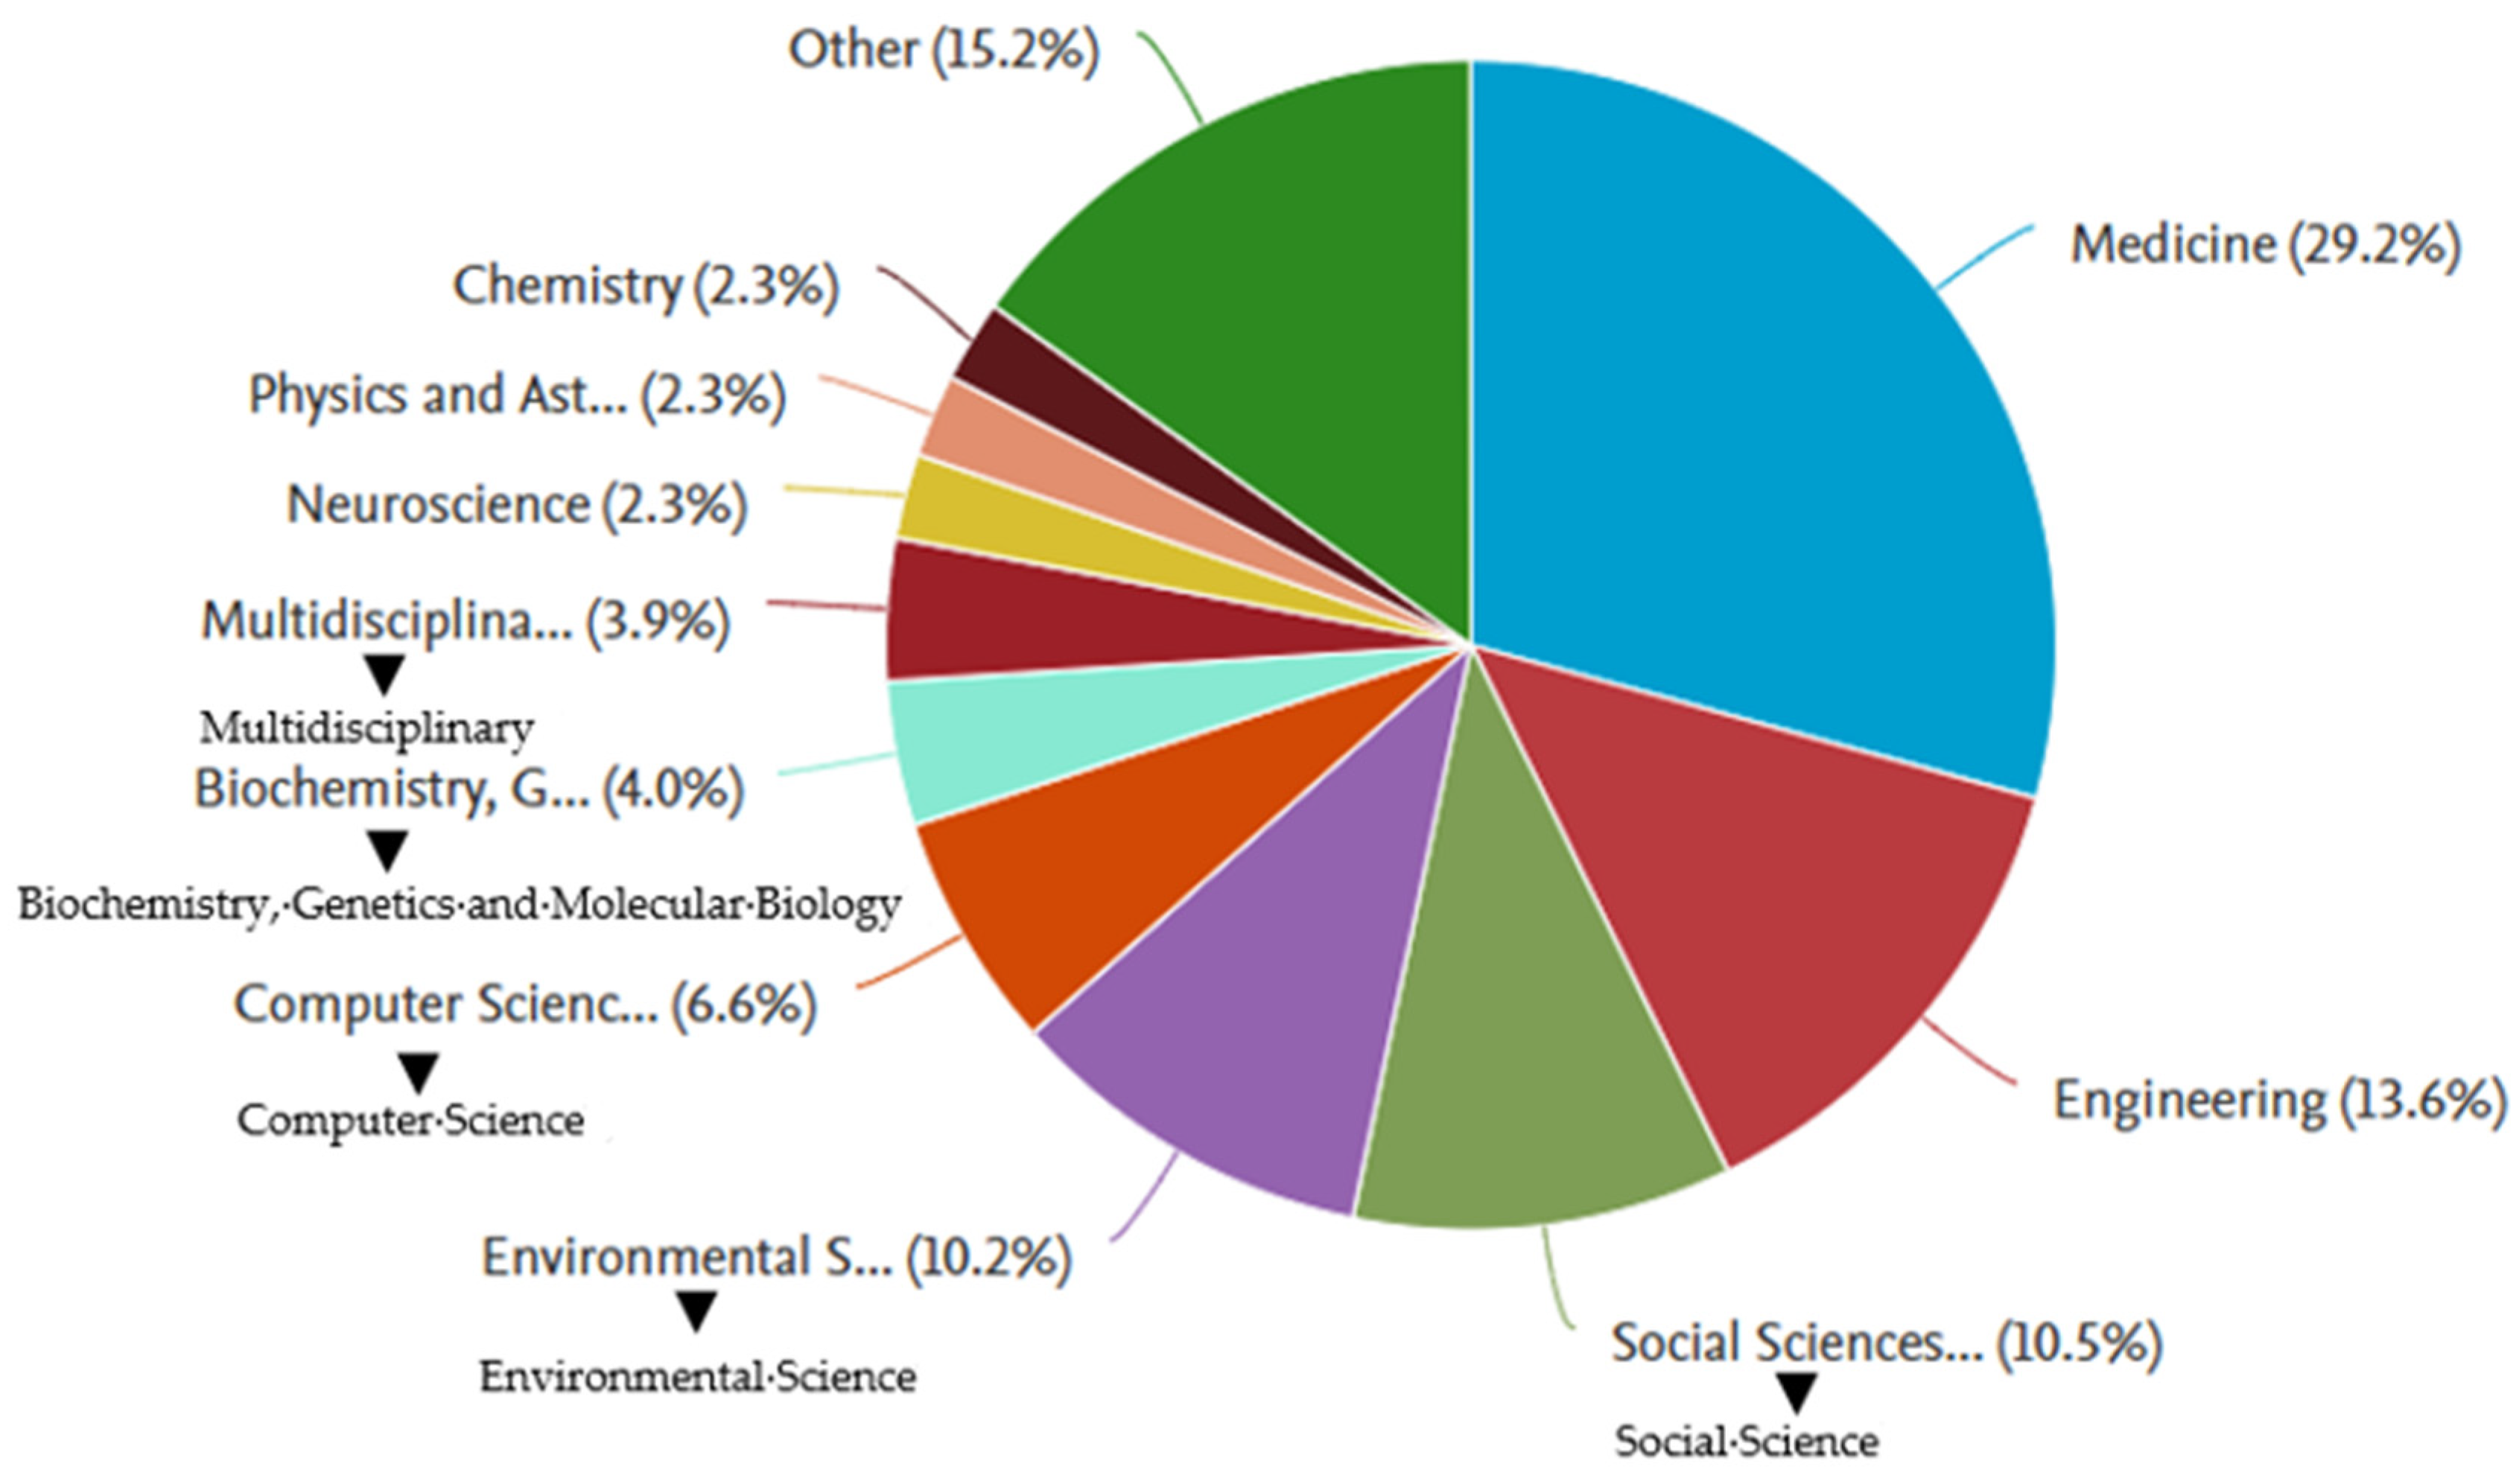
3.5. Domain of Knowledge
Medicine is known to be the main contributor of the research and publications on human factors in bus accidents until 2024, at 29.2%. It is followed by engineering as the scientific field with the second highest contribution, at 10.5%. The number of documents based on scientific field can be seen in Figure 6.
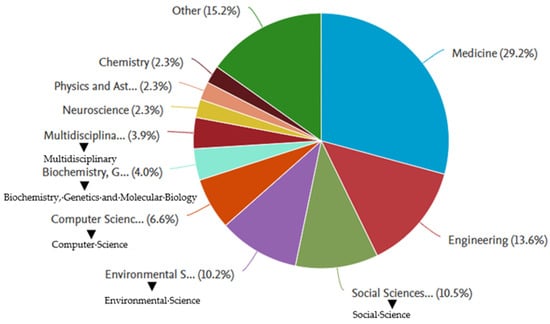
Figure 6.
Number of documents based on scientific domain.
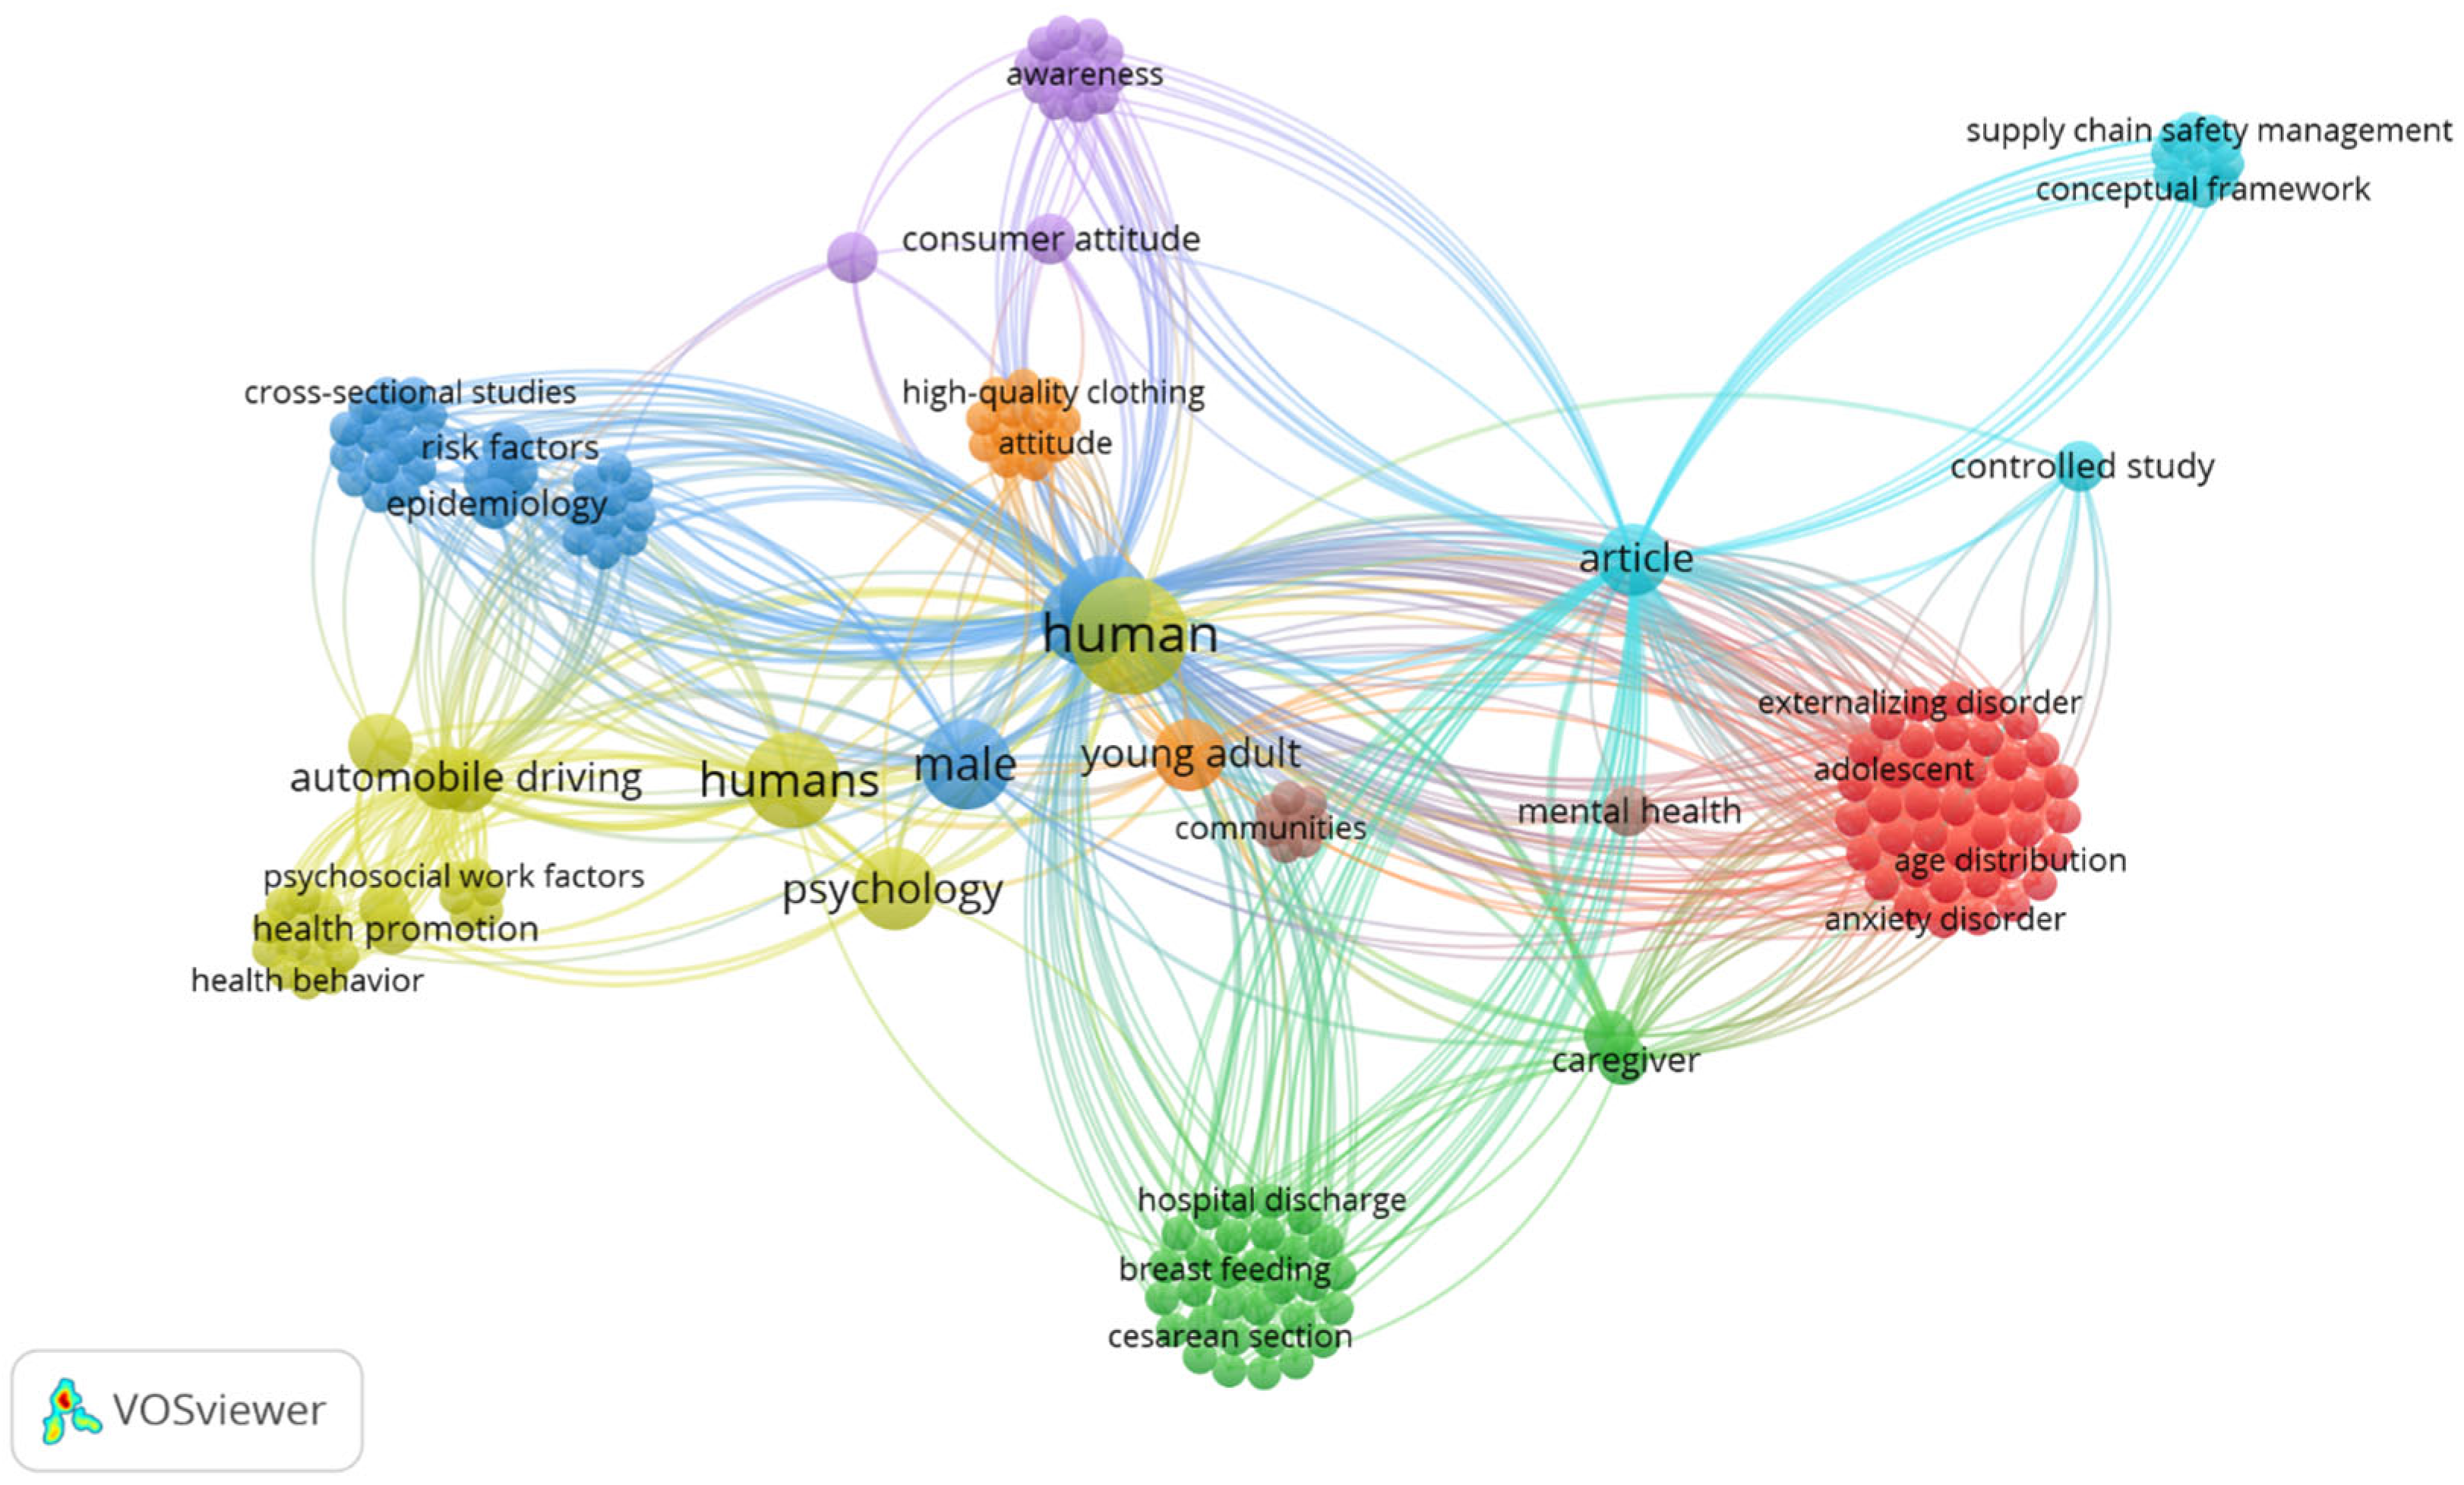
3.6. Keyword Analysis
Keyword analysis was performed using the co-occurrence network in the software [14]. The keyword analysis is shown in Figure 7.

Figure 7.
Keyword analysis.
Table 2 shows the 10 keywords with the highest total link strength. The human factor keywords are closely related to male, adult, female, and humans. Network analysis with co-occurrence was conducted to form eight clusters, as follows.
Table 2.
Most productive journals.
- Cluster 1 (40 items): adolescent, adolescent depression, adolescent health, age distribution, air pollution, anxiety assessment, anxiety disorder, blood sampling, center for epidemiology, child, child mental health, cohort analysis, demoralization, depression, disease association, disease transmission, DNA, epigenetics, externalizing disorder, follow-up, individual behavior assessment, intergenerational transmission, lifespan, longitudinal study, major clinical study, maternal blood, maternal mental health, maternal stress, maternal welfare, neurotoxicity, polycyclic aromatic hydrocarbons, prenatal exposure, prenatal period, prenatal stress, prospective study, revised children’s manifest anxiety scale, structural, equation model, third trimester of pregnancy, youth self-report of the children’s behavior checklist.
- Cluster 2 (33 items): breast feeding, caregiver, caregivers cesarean section, child parent relations, childbirth, decision making, education, gestational age, Ghana, health care personnel, health care personnel, healthcare workers, home care, hospital discharge, hospital patient, hospitalization, human experimental infant, newborn infant, premature infants, intensive care units, neonatal intensive care unit, neonatologist, newborn, pregnancy, prematurity, qualitative research, semi-structured interview, tertiary care center, tertiary care centers, thematic analysis, twins, vaginal delivery.
- Cluster 3 (32 items): accidents, traffic accidents, adult, agricultural sector, agricultural worker, agriculture, cross-sectional studies, cross-sectional study, epidemiology, farmers, farming, female, injury, injury severity, machine learning algorithm, male, middle age, mixed crash data, occupational accident, occupational health and safety, occupational risk factors, prevention and control, single-vehicle crashes, risk factors, risk factors, speeding behavior, traffic accident, turkey, turkey (bird), work-related accidents, wounds and injuries.
- Cluster 4 (27 items): automotive driving, car driving, cardiometabolic health, commercial drivers, diet, driver, exercise, freight worker, health, health behavior, health promotion, human, humans, meta-analysis, motor vehicles, occupational health, physical activity, procedures, psychology, psychosocial work factors, sedentary behavior, sedentary lifestyle, truck drivers, work environment, working conditions, workplace.
- Cluster 5 (16 items): awareness, carbon, consumer, consumer attitude, data quality, data quality assessment, digital marketing, grounded theory, human cell, information quality evaluation, lifestyle, low-carbon, machine learning, marketing, random forest, trustworthiness.
- Cluster 6 (15 items): article, conceptual framework, controlled study, institutional pressures, pharmaceutics, pressure, prevention, safety, small and medium-sized manufacturing suppliers, social work, supply chain safety management, theory of planned behavior, war, willingness to respond, work safety behavior.
- Cluster 7 (14 items): attitude, behavior, clothing, consumer behavior, eco-friendly clothing, high-quality clothing, intention, pro-environmental self-identity, questionnaire, secondhand clothing, self-concept, surveys and questionnaires, sustainable clothing, young adult.
- Cluster 8 (10 items): communities, compensation, compensation and redress, disaster, disasters, mental health, mental stress, psychology, systematic review, wellbeing.
3.7. Density Visualization Analysis
The density visualization analysis has a color that indicates the item at that point. The colors range from blue to green to yellow. The brighter the color at that point, the greater the density of the topic indicated at that point [15]. The results of the analysis in Figure 8 show that the human is the topic that is discussed the most, with a total link strength of 235; customer attitude is the least discussed, with a link strength of 39.
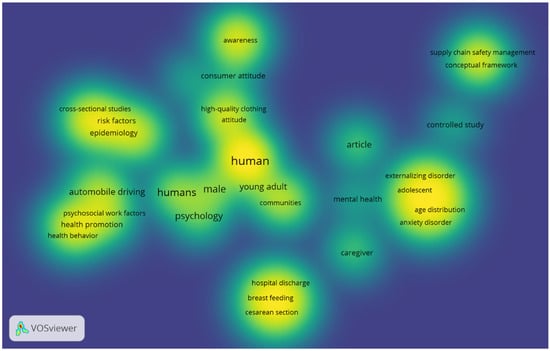
Figure 8.
Publication topic density analysis.
Citation bibliometric analysis was conducted to determine the research trends in the total number of researchers’ works that were frequently cited in a particular year [16]. The five most cited articles were published between 2015 and 2016. Table 3 shows the five articles with the highest number of citations on the topic of bus accidents.
Table 3.
Top five articles with the most citations.
4. Conclusions
Based on the results and discussion, it can be concluded that the highest growth of research on human factors in bus accidents from 2014 to 2024 indexed by Scopus occurred in 2022, reaching 310 publications. Francisco Alonso from the Universitat de Valencia is the most productive and instrumental writer with the largest number of topics in the field of human factors. Queensland University of Technology dominates the research topic of human factors in bus accidents with the number of studies produced reaching as many as 38 documents. China is the largest contributor of research on the topic of human factors in bus accidents, namely 352 documents. Medicine is known to be the main contributor of research and publications on the topic of human factors in bus accidents until 2024, namely 29.2%.
The development map of the instrumental field based on co-words is grouped into eight clusters. The most discussed topic is Human, which has a total strength of 235 links. The topic “Human” is referred to as a trend from the bibliometric analysis that has been carried out. The topic is developing and receiving attention in research because it continues to experience an increase in publications. The increase in the number of publications over time indicates the relevance and significance of the topic in the world of research. This reflects an increased awareness to explore and solve problems related to the topic.
Author Contributions
Conceptualization, B.S. and E.M.; Methodology, E.N.F.S.; Software, E.N.F.S.; Validation, B.S. and E.M.; writing—original draft preparation, E.N.F.S. All authors have read and agreed to the published version of the manuscript.
Funding
This research received no external funding.
Institutional Review Board Statement
Not applicable.
Informed Consent Statement
Not applicable.
Data Availability Statement
The bibliometric data analyzed in this study were obtained from Scopus Database and processed using VOSviewer. Due to database restrictions, the raw data cannot be shared, but they can be accessed through Scopus Database with the appropriate sub-scription or institutional access.
Conflicts of Interest
The authors declare no conflict of interest.
References
- Mutharuddin, M.; Puriningsih, F.S.; Maulidina Siregar, N.A.; Mardiana, T.S.; Subaryata, S.; Putra, H. Peningkatan Keselamatan Bus Penumpang dengan Metode Human Factor Analysis and Classification System (HFACS). J. Penelit. Transp. Darat 2023, 25, 61–73. [Google Scholar] [CrossRef]
- Feng, S.; Li, Z.; Ci, Y.; Zhang, G. Risk factors affecting fatal bus accident severity: Their impact on different types of bus drivers. Accid. Anal. Prev. 2016, 86, 29–39. [Google Scholar] [CrossRef] [PubMed]
- Wise, J.M.; Heaton, K.; Patrician, P. Fatigue in Long-Haul Truck Drivers: A Concept Analysis. Workplace Health Saf. 2019, 67, 68–77. [Google Scholar] [CrossRef] [PubMed]
- Sundh, J. Human behavior in the context of low-probability high-impact events. Humanit. Soc. Sci. Commun. 2024, 11, 902. [Google Scholar] [CrossRef]
- Zhang, X.; Hu, W.; Zhou, J.; Zuo, Q.; Wu, R.; Tang, Z. The Failure Route between Active and Latent Error in Bus Accident. IEEE Access 2019, 7, 164941–164951. [Google Scholar] [CrossRef]
- Konu Kadirhanogullari, M.; Ozay Kose, E. A Bibliometric Analysis of Articles on Bibliometric Studies in Science Education. Int. J. Res. Educ. Sci. 2024, 10, 315–339. [Google Scholar] [CrossRef]
- Leydesdorff, L.; Wouters, P.; Bornmann, L. Professional and citizen bibliometrics: Complementarities and ambivalences in the development and use of indicators—A state-of-the-art report. Scientometrics 2016, 109, 2129–2150. [Google Scholar] [CrossRef] [PubMed]
- Norris, S. Bibliometrics and Research Evaluation: Uses and Abuses [Book Review]. J. Librariansh. Sch. Commun. 2019, 7, 1–3. [Google Scholar] [CrossRef]
- Rip, P.; Courtial, A. Co-Word Maps of Biotechnology: An Example of Cognitive scientometrics. Scientometrics 1984, 6, 381–400. [Google Scholar] [CrossRef]
- Sarjana, S. Analisis Bibliometrik Transit-Oriented Development. War. Penelit. Perhub. 2022, 34, 149–160. [Google Scholar] [CrossRef]
- Dewi, P.S.; Widodo, A.; Rochintaniawati, D.; Prima, E.C. Web-Based Inquiry in Science Learning: Bibliometric Analysis. Indones. J. Sci. Math. Educ. 2021, 4, 191–203. [Google Scholar] [CrossRef]
- Susilo, H.N. Analisis Bibliometrik untuk Penentuan Celah Penelitian, Pengembangan, Pengkajian, dan Penerapan IPTEK Nuklir. Pros. Semin. Nas. Inov. dan Pendayagunaan Teknol. Nukl. 2020, 2, 1–9. [Google Scholar]
- van Eck, N.J.; Waltman, L. Visualizing Bibliometric Networks; Springer: Cham, Switzerland, 2014. [Google Scholar] [CrossRef]
- Hofmann, M.; Chisholm, A. Text Mining and Visualization Case Studies Using Open-Source Tools; Chapman & Hall/CRC: London, UK, 2016. [Google Scholar]
- Glänzel, W. Bibliometrics as a Research Field: A Course on Theory and Application of Bibliometric Indicators; Researchgate: Berlin, Germany, 2003; pp. 1–115. Available online: https://www.researchgate.net/publication/242406991_Bibliometrics_as_a_research_field_A_course_on_theory_and_application_of_bibliometric_indicators (accessed on 10 December 2024).
- Piepoli, M.F.; Hoes, A.W.; Agewall, S.; Albus, C.; Brotons, C.; Catapano, A.L.; Cooney, M.T.; Corrà, U.; Cosyns, B.; Deaton, C.; et al. 2016 European Guidelines on cardiovascular disease prevention in clinical practice: The Sixth Joint Task Force of the European Society of Cardiology and Other Societies on Cardiovascular Disease Prevention in Clinical Practice (constituted by representative). Atherosclerosis 2016, 252, 207–274. [Google Scholar] [CrossRef] [PubMed]
- Chung, F.; Abdullah, H.R.; Liao, P. STOP-bang questionnaire a practical approach to screen for obstructive sleep apnea. Chest 2016, 149, 631–638. [Google Scholar] [CrossRef] [PubMed]
- Piepoli, M.F.; Hoes, A.W.; Agewall, S.; Albus, C.; Brotons, C.; Catapano, A.L.; Cooney, M.T.; Corra, U.; Cosyns, B.; Deaton, C.; et al. 2016 European Guidelines on cardiovascular disease prevention in clinical practice the Sixth Joint Task Force of the European Society of Cardiology and Other Societies on Cardiovascular Disease Prevention in Clinical Practice (constituted by representative). Eur. J. Prev. Cardiol. 2016, 23, NP1–NP96. [Google Scholar] [CrossRef] [PubMed]
- Katrakazas, C.; Quddus, M.; Chen, W.H.; Deka, L. Real-time motion planning methods for autonomous on-road driving: State-of-the-art and future research directions. Transp. Res. Part C Emerg. Technol. 2015, 60, 416–442. [Google Scholar] [CrossRef]
- Young, M.S.; Brookhuis, K.A.; Wickens, C.D.; Hancock, P.A. State of Science: Mental Workload in Ergonomics. Ergonomics 2015, 58, 1–17. [Google Scholar] [CrossRef] [PubMed]


Disclaimer/Publisher’s Note: The statements, opinions and data contained in all publications are solely those of the individual author(s) and contributor(s) and not of MDPI and/or the editor(s). MDPI and/or the editor(s) disclaim responsibility for any injury to people or property resulting from any ideas, methods, instructions or products referred to in the content. |
© 2025 by the authors. Licensee MDPI, Basel, Switzerland. This article is an open access article distributed under the terms and conditions of the Creative Commons Attribution (CC BY) license (https://creativecommons.org/licenses/by/4.0/).