Abstract
The active thermographic techniques are well-established for controlling composite components subjected to low-velocity impact damage. However, in recent years, the main works on thermographic techniques have focused on processing the raw data with the aim of increasing the signal-to-noise ratio and the probability of damage detection. It is well-known that assessing the residual strength of the material is crucial for quantifying the damage extension. In this regard, the aim of this work is to quantify the damage produced by impacted tests on hybrid woven composites by means of thermographic techniques. In particular, a novel procedure based on applying two filters frame by frame on the thermographic data obtained after applying the pulse thermographic technique was proposed, and information about the damage extension was provided. The results showed the possibility of quantitively estimating the damage and the effect of momentum in hybrid natural fiber composites.
1. Introduction
The outstanding properties of carbon-glass fiber composite materials (CFRP/GFRP), in terms of high strength and low weight, make them suitable to be employed in many engineering fields. Nevertheless, these materials are not recyclable and biodegradable; therefore, disposal of them at the end of life can be very expensive. For this reason, in recent decades, the use of carbon-glass fibers, in both structural and non-structural applications, has been drawn into question, leading many researchers to study new composite materials made of natural fibers, such as mineral, vegetable, and animal ones [1,2].
In the literature, the hybridization approach is extensively adopted to ensure the same mechanical properties of natural composites with respect to their synthetic counterparts. This approach consists of combining two or more different kinds of fibers in a single matrix; in this way, the synthetic fibers are partially or totally substituted with the natural ones [1,3,4,5,6].
One of the main failure mechanisms that can significantly affect the structural integrity of these hybrid natural composites is the damage due to the low-velocity impact. In this regard, it is necessary to carry out non-destructive test (NDT) techniques in order to characterize the damage qualitatively and quantitatively [1,4].
In recent years, several NDTs have been adopted for characterizing impact damage in composite materials, such as ultrasound (UT) [7,8], active thermography (AT) [9,10,11,12,13,14,15,16], X-ray [8,17], and so on. Among these techniques, AT has considerable advantages, since it is a contactless and full-field technique, so it allows the scanning of a large area of the specimen in just a few minutes. This technique is based on exciting the surface of the specimen with an external heat stimulus, and simultaneously recording the thermal material response with an infrared (IR) camera remotely.
According to the modulated thermal wave shape, active thermography can be divided into pulsed (PT) [9,18,19], Step (ST) [20,21], and Lock-in (LI) [7,10,11,12,14,22,23,24,25,26] techniques. Pulsed and Step techniques are similar and based on modulating the heat source with a square wave. The main difference between them is based on the duration of the excitation; regarding the PT, the thermal wave lasts a few milliseconds (~ 5 ms, like a Dirac impulse), and the thermograms are collected and analyzed during the cooling phase. Instead, for ST the heat source lasts a few seconds; therefore, the thermal wave can achieve the damaged area during the heating phase, thus the thermograms can be analyzed both during the heating and cooling phases.
On the contrary, LI is based on a periodic modulation of the thermal source with a square or sine wave, and the thermal sequence is analyzed for the complete duration of the test.
Currently, few works adopt AT to characterize the damaged area in composite materials subjected to low-velocity impact [7,27]. In the work of Sachin et al. [28], the authors used PT to test a master specimen with artificial defects placed at different depths. Then, the acquired thermal sequence was processed with the pulsed phase thermography (PPT) algorithm to calibrate the depth of the defects with a linear regression using the blind frequency approach. Subsequently, this calibration curve was applied to estimate the depth of the delamination of barely visible impact damage (BVID) in polymer–matrix composite laminates.
Difficulties can arise in detecting damage to hybrid woven laminated with thermographic techniques. It is important to highlight that the different thermophysical properties and emissivity of the fibers inside the hybrid composite can generate different thermal material responses, thereby making the characterization of the damaged area very challenging. In this regard, Poelman et al. [29], proposed an interesting approach for processing the pulsed thermal data acquired on four CFRP woven laminates impacted by low velocity tests. The authors applied a k-space approach to the thermal data in order to remove the effect of the periodical pattern, thus increasing the signal-to-noise ratio between sound and damaged area. However, the characterization of the damaged area in terms of depth and size was not performed.
It is well-known that, to perform the estimation of the residual life of a composite component, it is necessary to quantitatively characterize the damage in terms of its extension. To the best of our knowledge, few works have quantitatively evaluated the depth and size of the damaged area in hybrid woven laminates subjected to low-velocity impact. In this regard, the aim of this work was to develop a suitable post-processing procedure to enhance the detectability of the damaged area in order to quantitatively characterize the extension of the damage in the impacted hybrid composite.
Three different specimens made of flax and basalt fiber combined in a polypropylene matrix with the addition of a coupling agent (PPc) subjected to different masses of 3, 6, and 9 kg and the same energy level of 3 J were investigated with pulsed thermography technique. Then, the proposed procedure of data analysis was applied for each specimen and an estimation of the damaged area was provided.
2. Pulse Thermography
Pulsed thermography is based on heating the surface of the specimen with a huge quantity of energy in a few ms by means of external heat sources [18,19,20,21,22,23]. In order to simplify the thermal material response with an analytical expression, some strong hypotheses can be considered; these include homogeneous and isotropic material, a semi-infinite dimension defect, and that the heat conduction along the depth of the specimen is assumed to be one-dimensional. Under this condition, the thermal material response can be described as follows (Equation (1)) [18]:
where ΔT(z,t) is the temperature increasing after the instantaneous heating on the surface of the specimen, Q (J/m2) is the energy absorbed, z is the depth, k, ρ, cp are the thermophysical properties, i.e., thermal conductivity, density, and heat capacity, and α is the thermal diffusivity of the material.
The IR camera records the cooling phase as long as the surface of the specimen reaches the environment temperature. Therefore, since the IR camera monitors the surface of the specimen z = 0, Equation (1) can be re-written as in Equation (2):
The thermal wave penetrates the body of the specimen by propagating with a diffusivity rate that strictly depends on the thermophysical properties of the material. The presence of a defect beneath the surface of the specimen that has different thermophysical properties with respect to the surrounding sound area alters the diffusivity rate of the thermal wave. This variation generates over the defect a local variation in the temperature.
3. Materials and Set-Up
Three test coupons measuring 154 × 104 mm were subjected to impact tests at room temperature considering a kinetic impact energy of 3 J. To evaluate the effect of momentum, three different masses of 3, 6 and 9 kg were used by means of a drop-weight impact testing machine (Instron/CEAST 9340) adopting a hemispherical tip with a diameter of 12.7 mm.
The laminates were manufactured adopting a compression molding machine by stacking layers (0/90) of hybrid woven fabric (basalt/flax) and layers of polypropylene films (PP) with a coupling agent (2 wt%) to increase the adhesion between natural fibers and the thermoplastic matrix. The final laminate thickness was 2.2 ± 0.1 mm.
Table 1 summarizes the test conditions for each specimen.

Table 1.
Test conditions for each specimen.
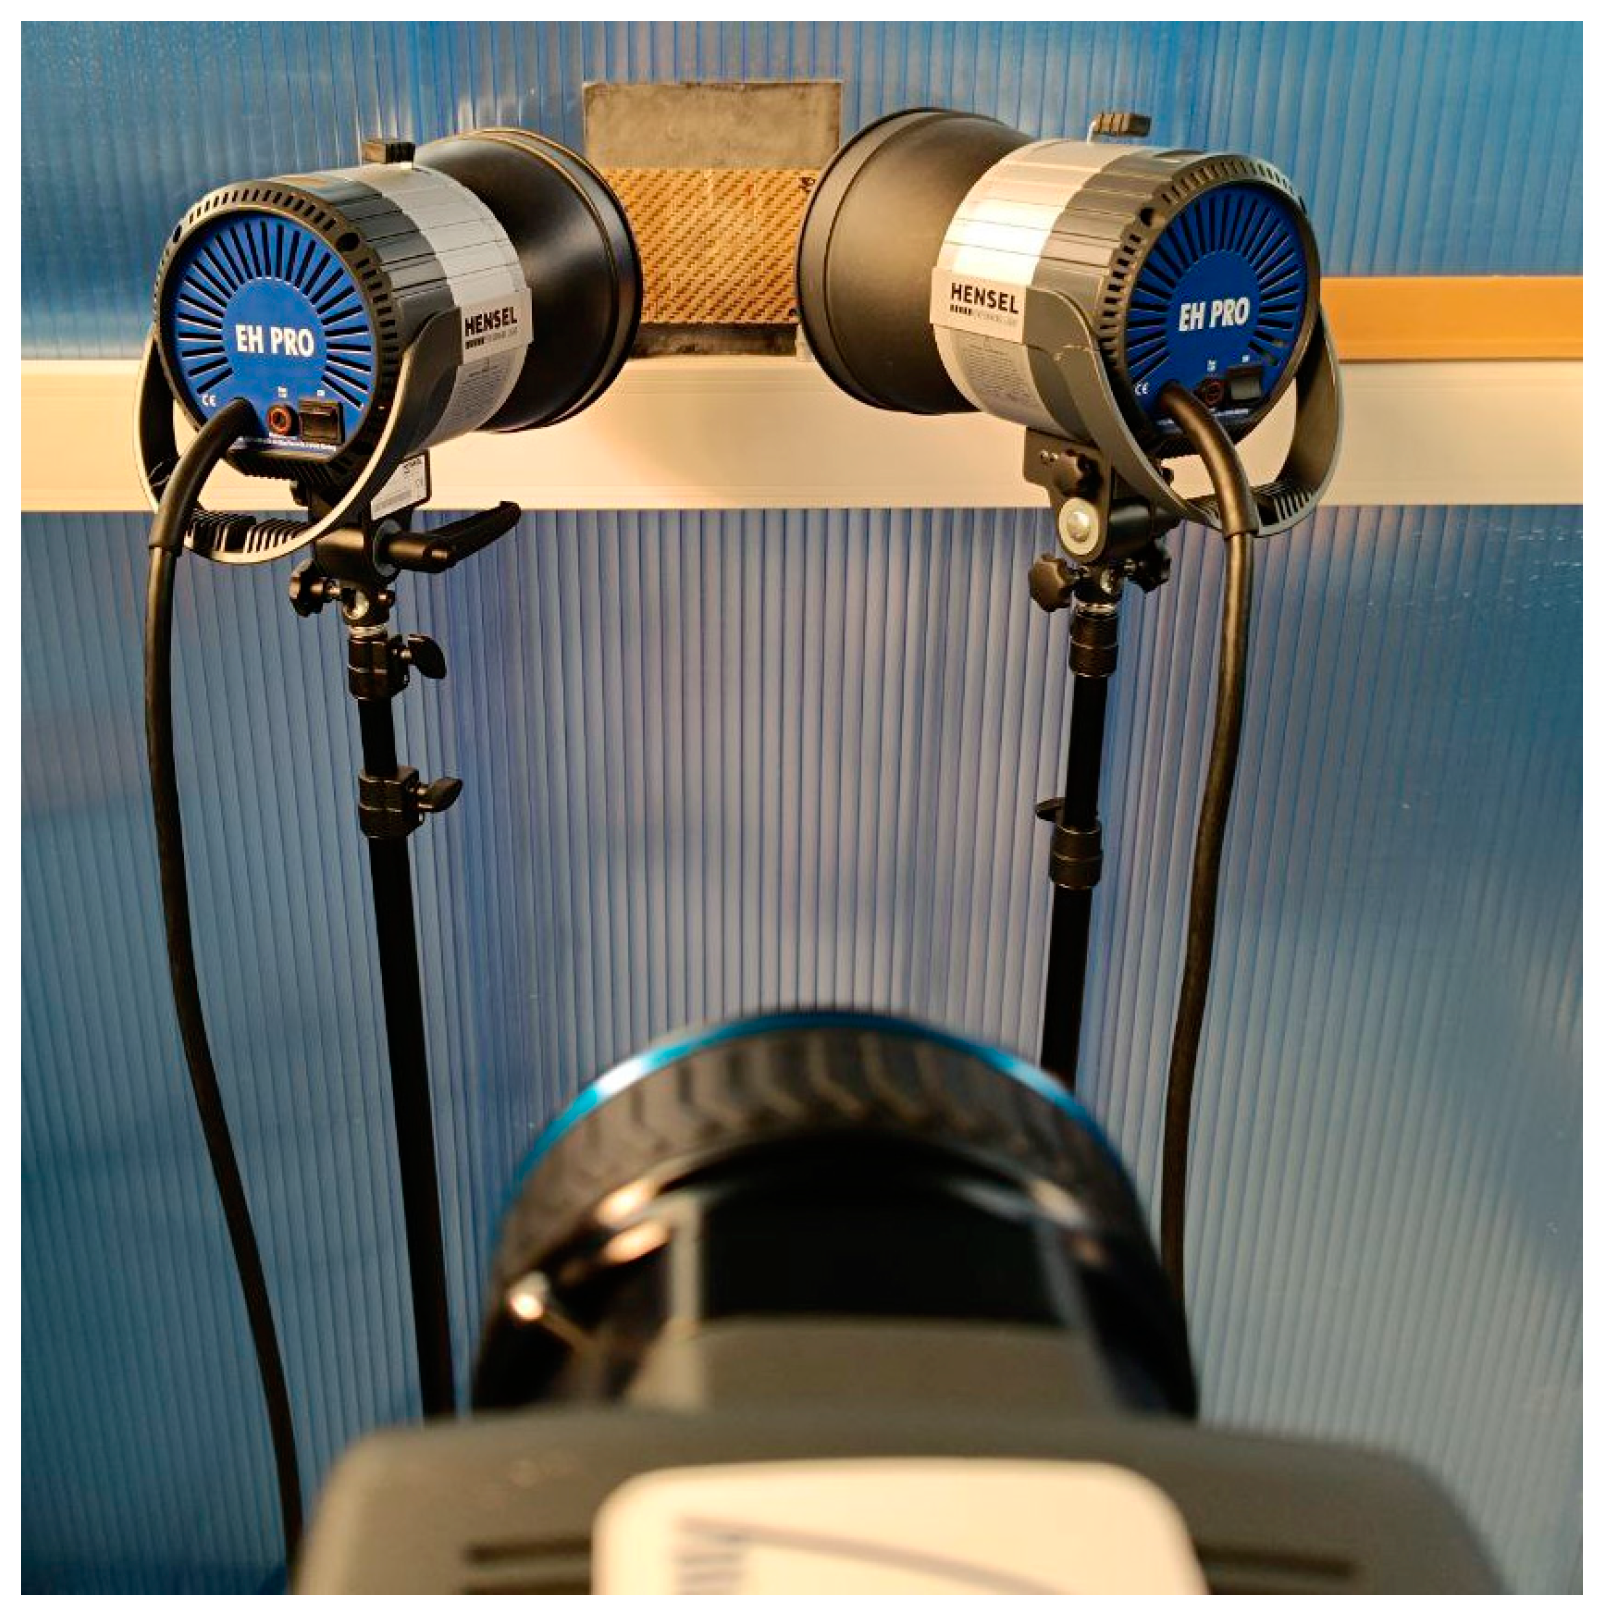
Thermographic tests were carried out by adopting the MultiDES Flash Lamps System composed of a motherboard for controlling and synchronizing the flash lamps with the IR Sensor, the flash generator Hensel EH pro 6000, and two flash lamps of energy 3000 J (6000 J total) with a pulse duration of about 2 ms. The thermographic sequences were acquired using the cooled IR camera A6751 by FLIR equipped with an FPA detector with a size 640 × 512 and a thermal resolution NETD < 20 mK. The experimental set-up was in reflection mode (Figure 1), and the geometrical resolution was 0.3 mm/pixel (50 mm lens).
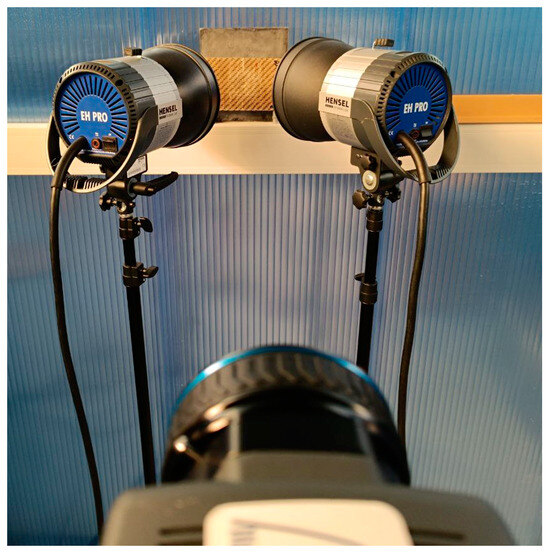
Figure 1.
The adopted reflection mode set-up.
Finally, the software IR Max 4 by Flir was used for acquiring thermal sequences with a frame rate of 200 Hz. Post-processing and data analysis of the thermographic sequences were carried out by adopting MatLab® R2023a codes.
4. Methods
In this section, the adopted approach to increase the signal-to-noise ratio and then the detectability of the damaged area is shown. First, a median filter was applied on each frame of the raw sequences in order to remove the non-homogeneous heating. Then, the processed sequence was studied in the frequency domain to remove the frequency components due to the woven periodical pattern. This proposed approach was applied to each investigated specimen.
Data Analysis (Median and 2D fft Filter)
It is difficult to guarantee uniform heating of the surface of the specimen during the test phase. Therefore, it is necessary to carry out some post-processing analysis on the acquired thermal sequences to remove the effect of non-homogeneous heating. A simple and feasible way is to apply a median filter [30,31]. In this work, a median filter with a large kernel size was considered to avoid filtering the contribution due to the damaged area. In this regard, the kernel was chosen to be bigger (121, 121) with respect to the actual damage dimension [30,31].
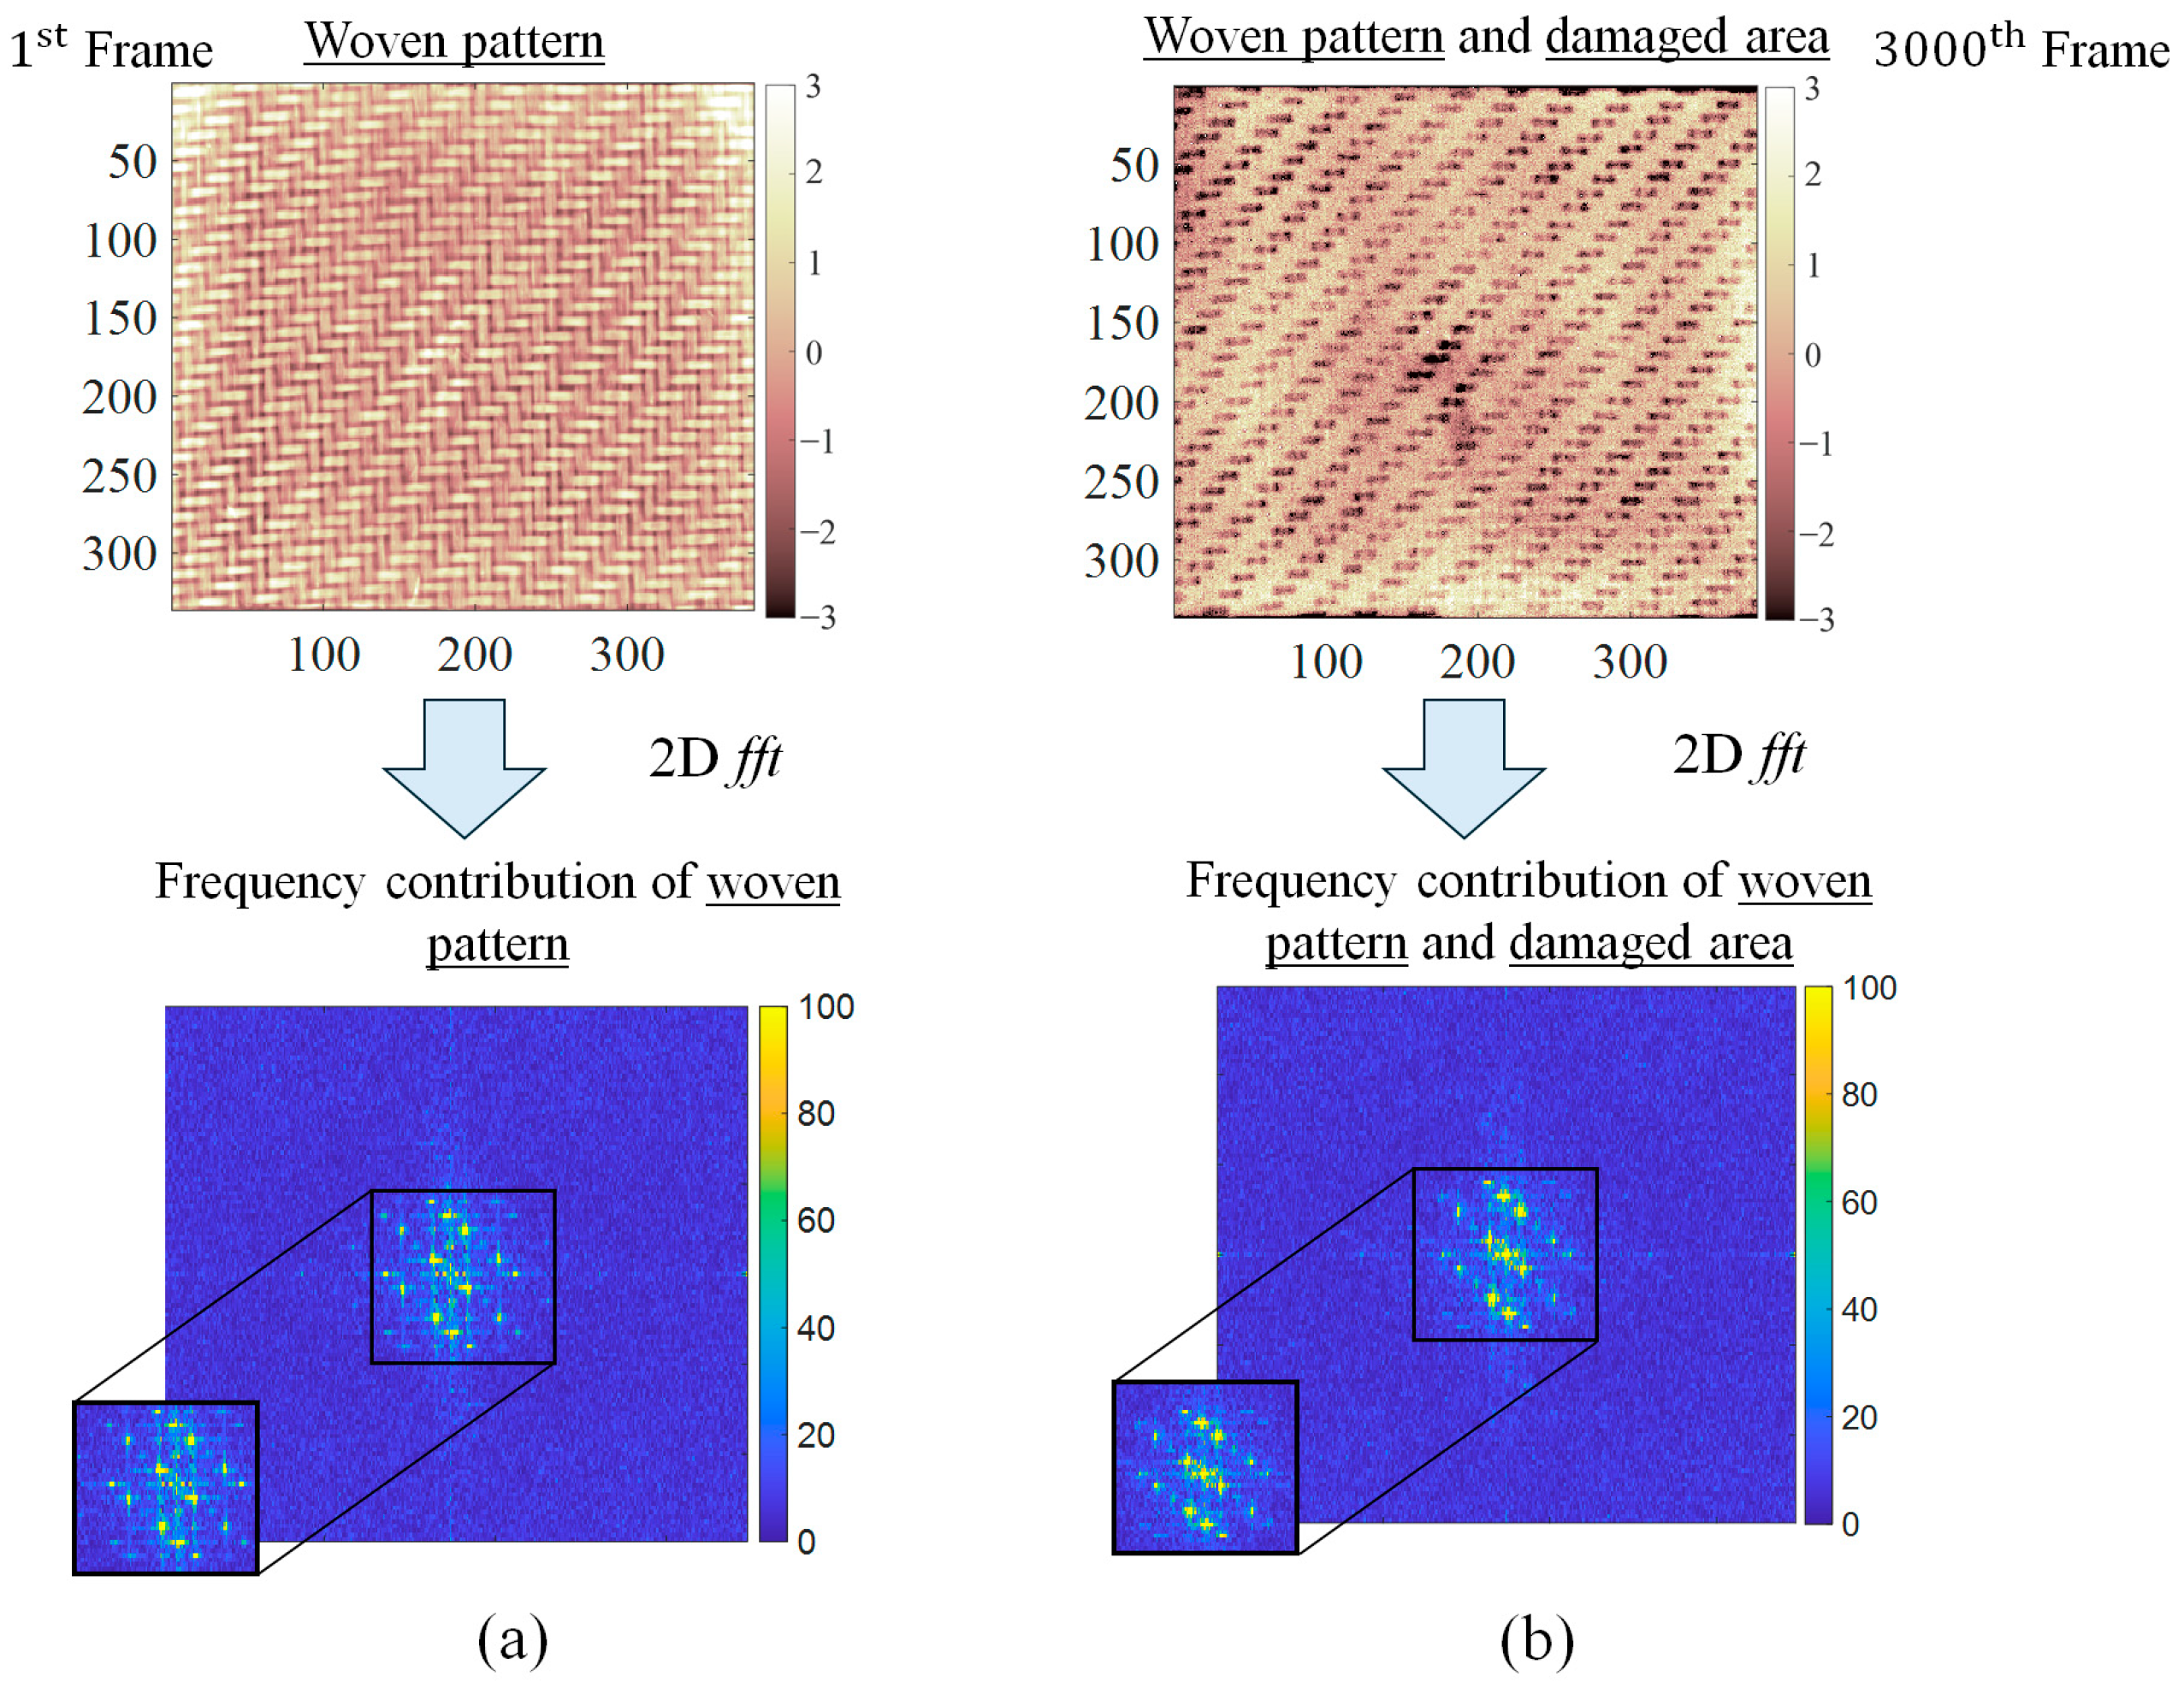
In addition to this spatial filter, i.e., the median, another one was considered to remove the periodical pattern and increase the detectability of the damage, i.e., the 2D fft filter. In this regard, two frames were considered, the first frame (Figure 2a) and one of the last frames (in this case, as an example the 3000th, Figure 2b) of the processed sequence, since they present the contribution of the woven pattern as well as both the woven pattern and the damaged area, respectively. In Figure 2, the amplitude maps obtained by applying the 2D fft are shown for both considered frames. These maps report the magnitude of the amplitude signal distributed for the different spatial signal components. The same scale, ranging between 0 and 100 of the signal intensity, was used to compare the results of the two considered frames.
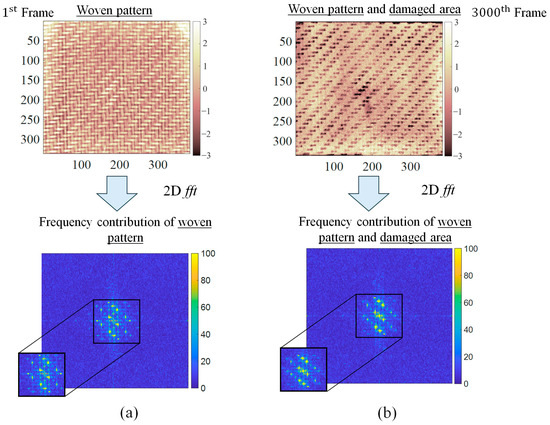
Figure 2.
The amplitude maps were obtained by applying the 2 D fft at the (a) 1st and (b) 3000th frames of the processed sequence containing information about the woven pattern and the damaged area, respectively.
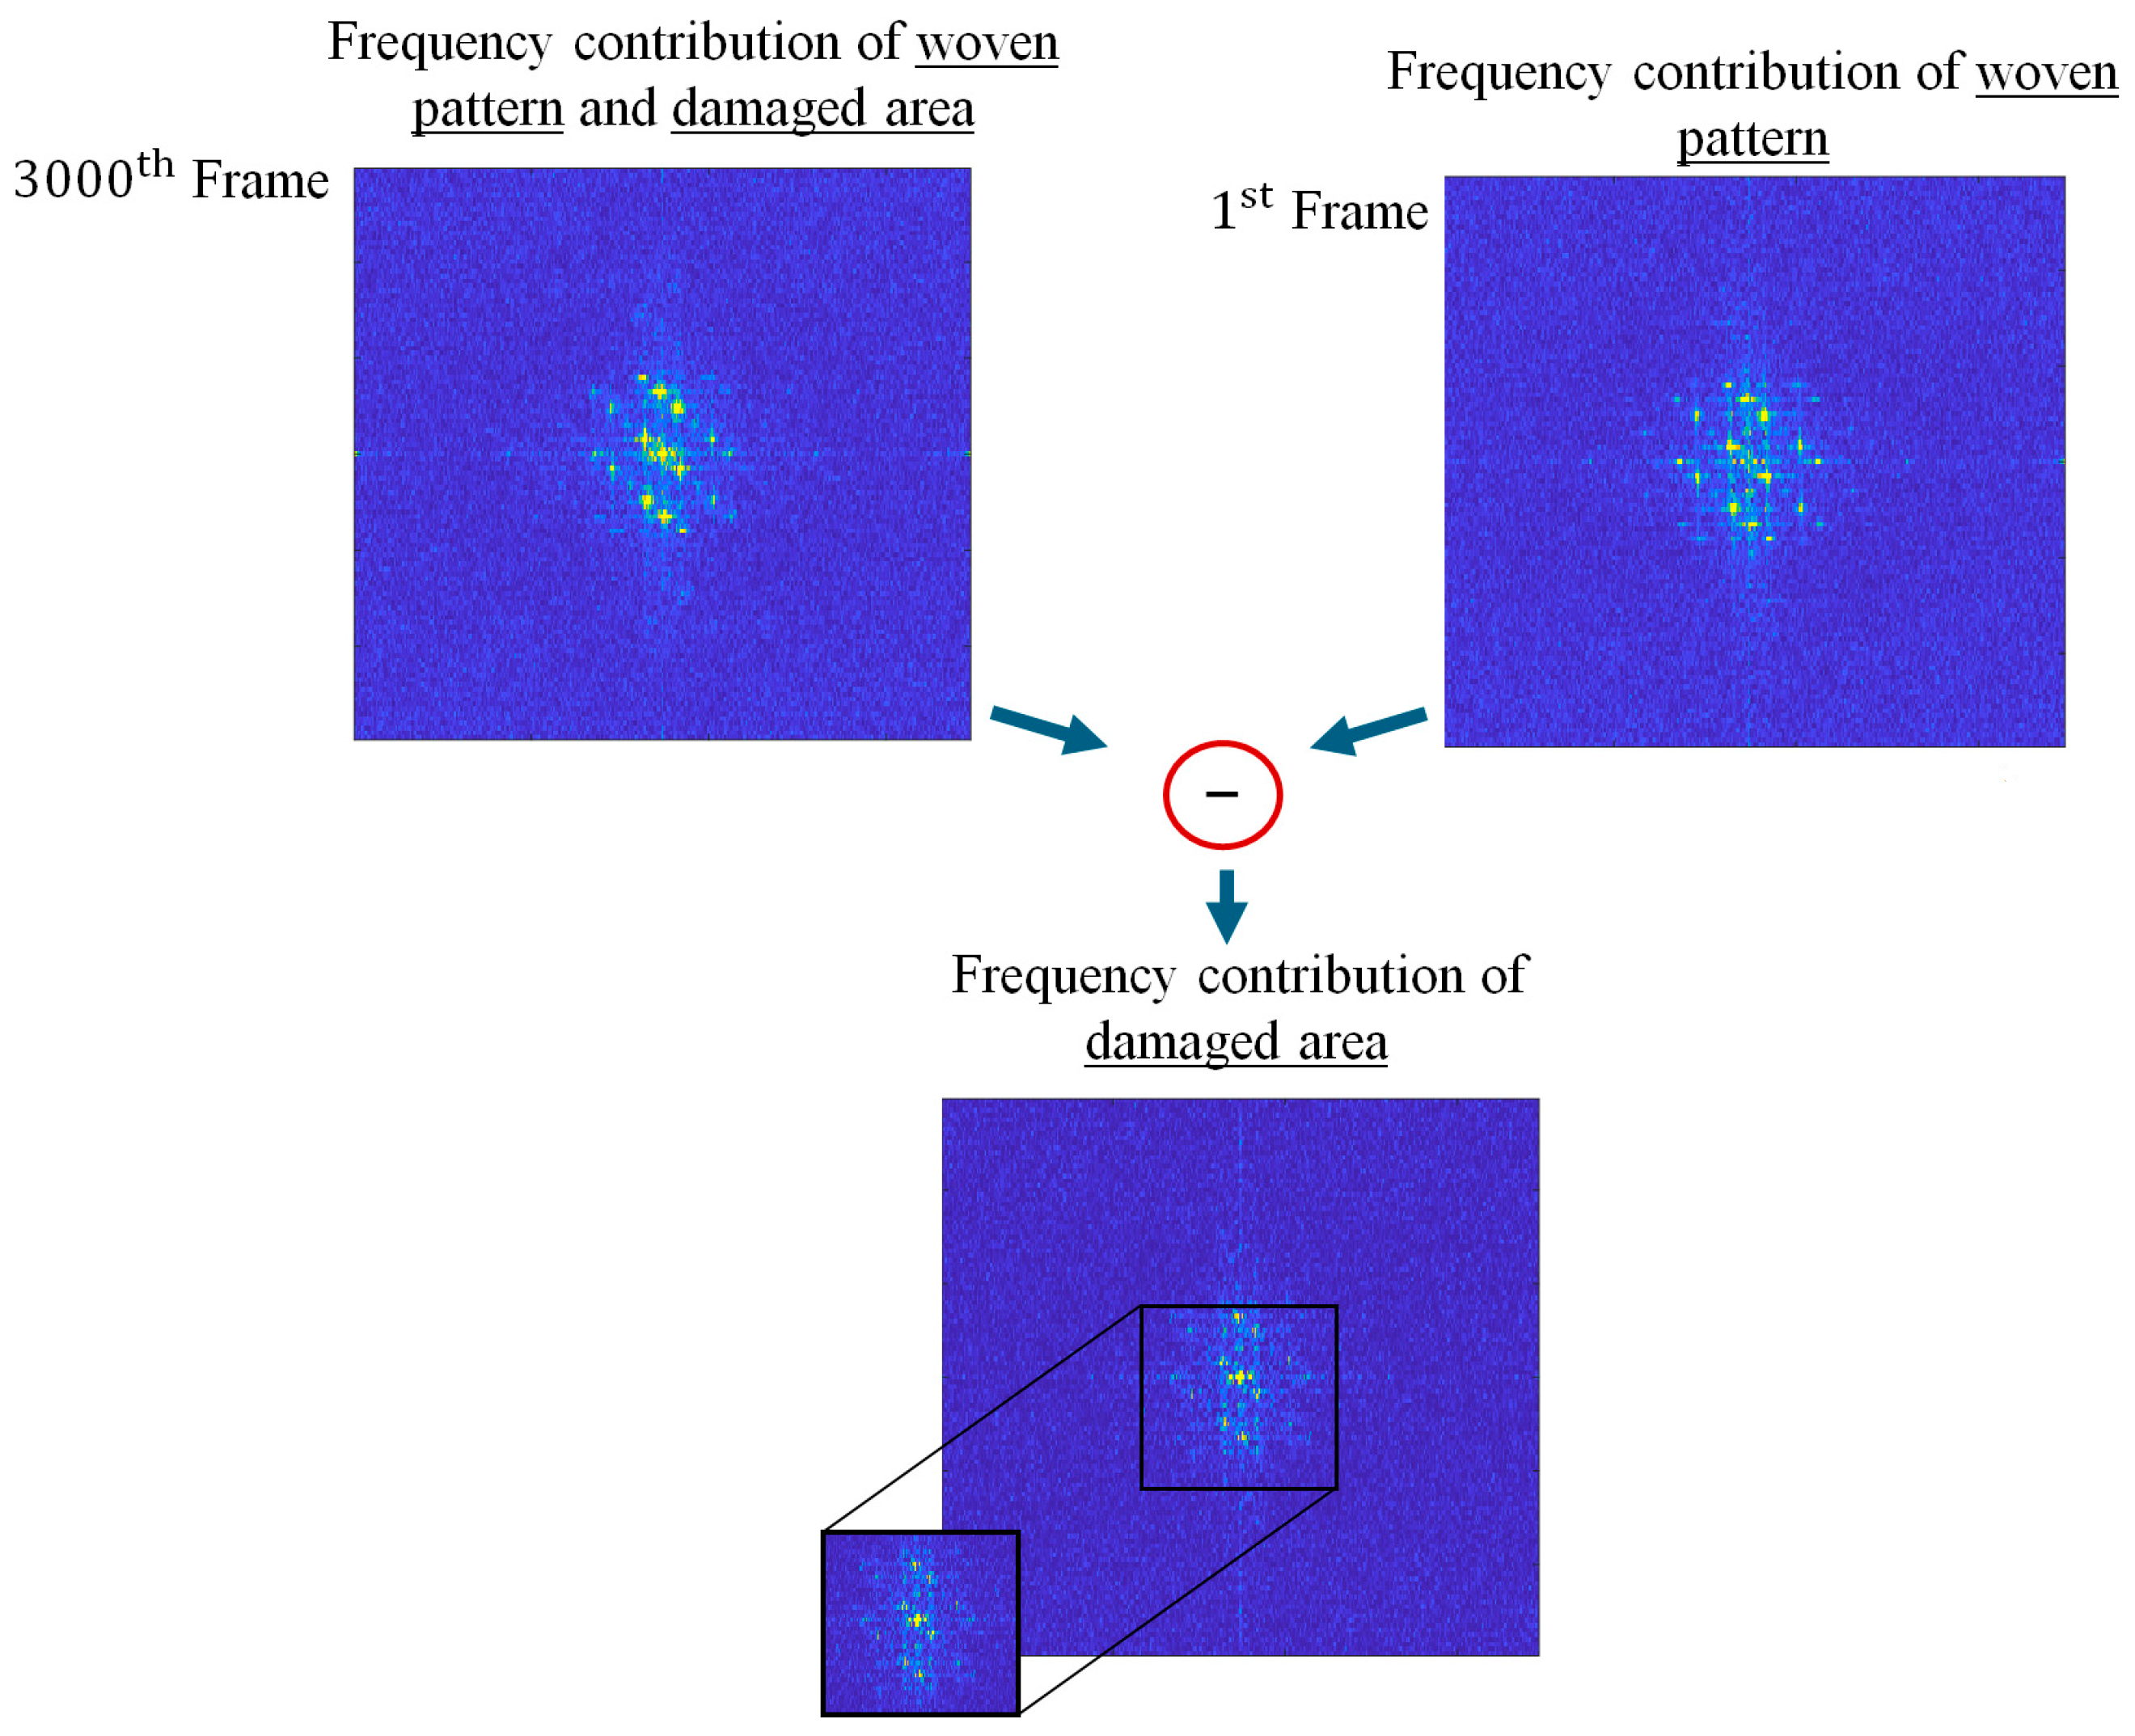
The analyses using the 2D fft show that the main difference between the two amplitude maps occurs at low frequencies, and that the damaged area is probably characterized by low frequency contributions. To better localize the frequencies of the damaged area, subtraction between the two amplitude images in the domain of frequencies was performed, as shown in Figure 3.

Figure 3.
Subtraction in the frequency domain to isolate the component corresponding to the damaged area.
The final map confirms that the damage contribution is placed only in correspondence with low frequencies. Therefore, a simple and feasible way to consider only this component is to create a binary mask that excludes all frequencies due to the periodical pattern, as shown in Figure 4. It is important to highlight that this kind of mask was applied to all the frames in the sequence. In Figure 4, the damaged area appears with a higher contrast with respect to the unfiltered map and presents a “cross shape” at the center of the specimen.
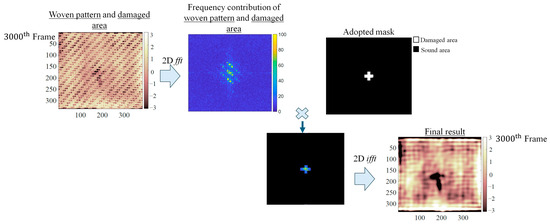
Figure 4.
The adopted procedure to remove the periodical pattern by means of a 2D fft filter.
In order to evaluate how these two processing approaches described above can increase the detectability of the damaged area, a quantitative parameter must be defined. In this case, the contrast-to-noise ratio (CNR) was evaluated, as shown in Equation (3).
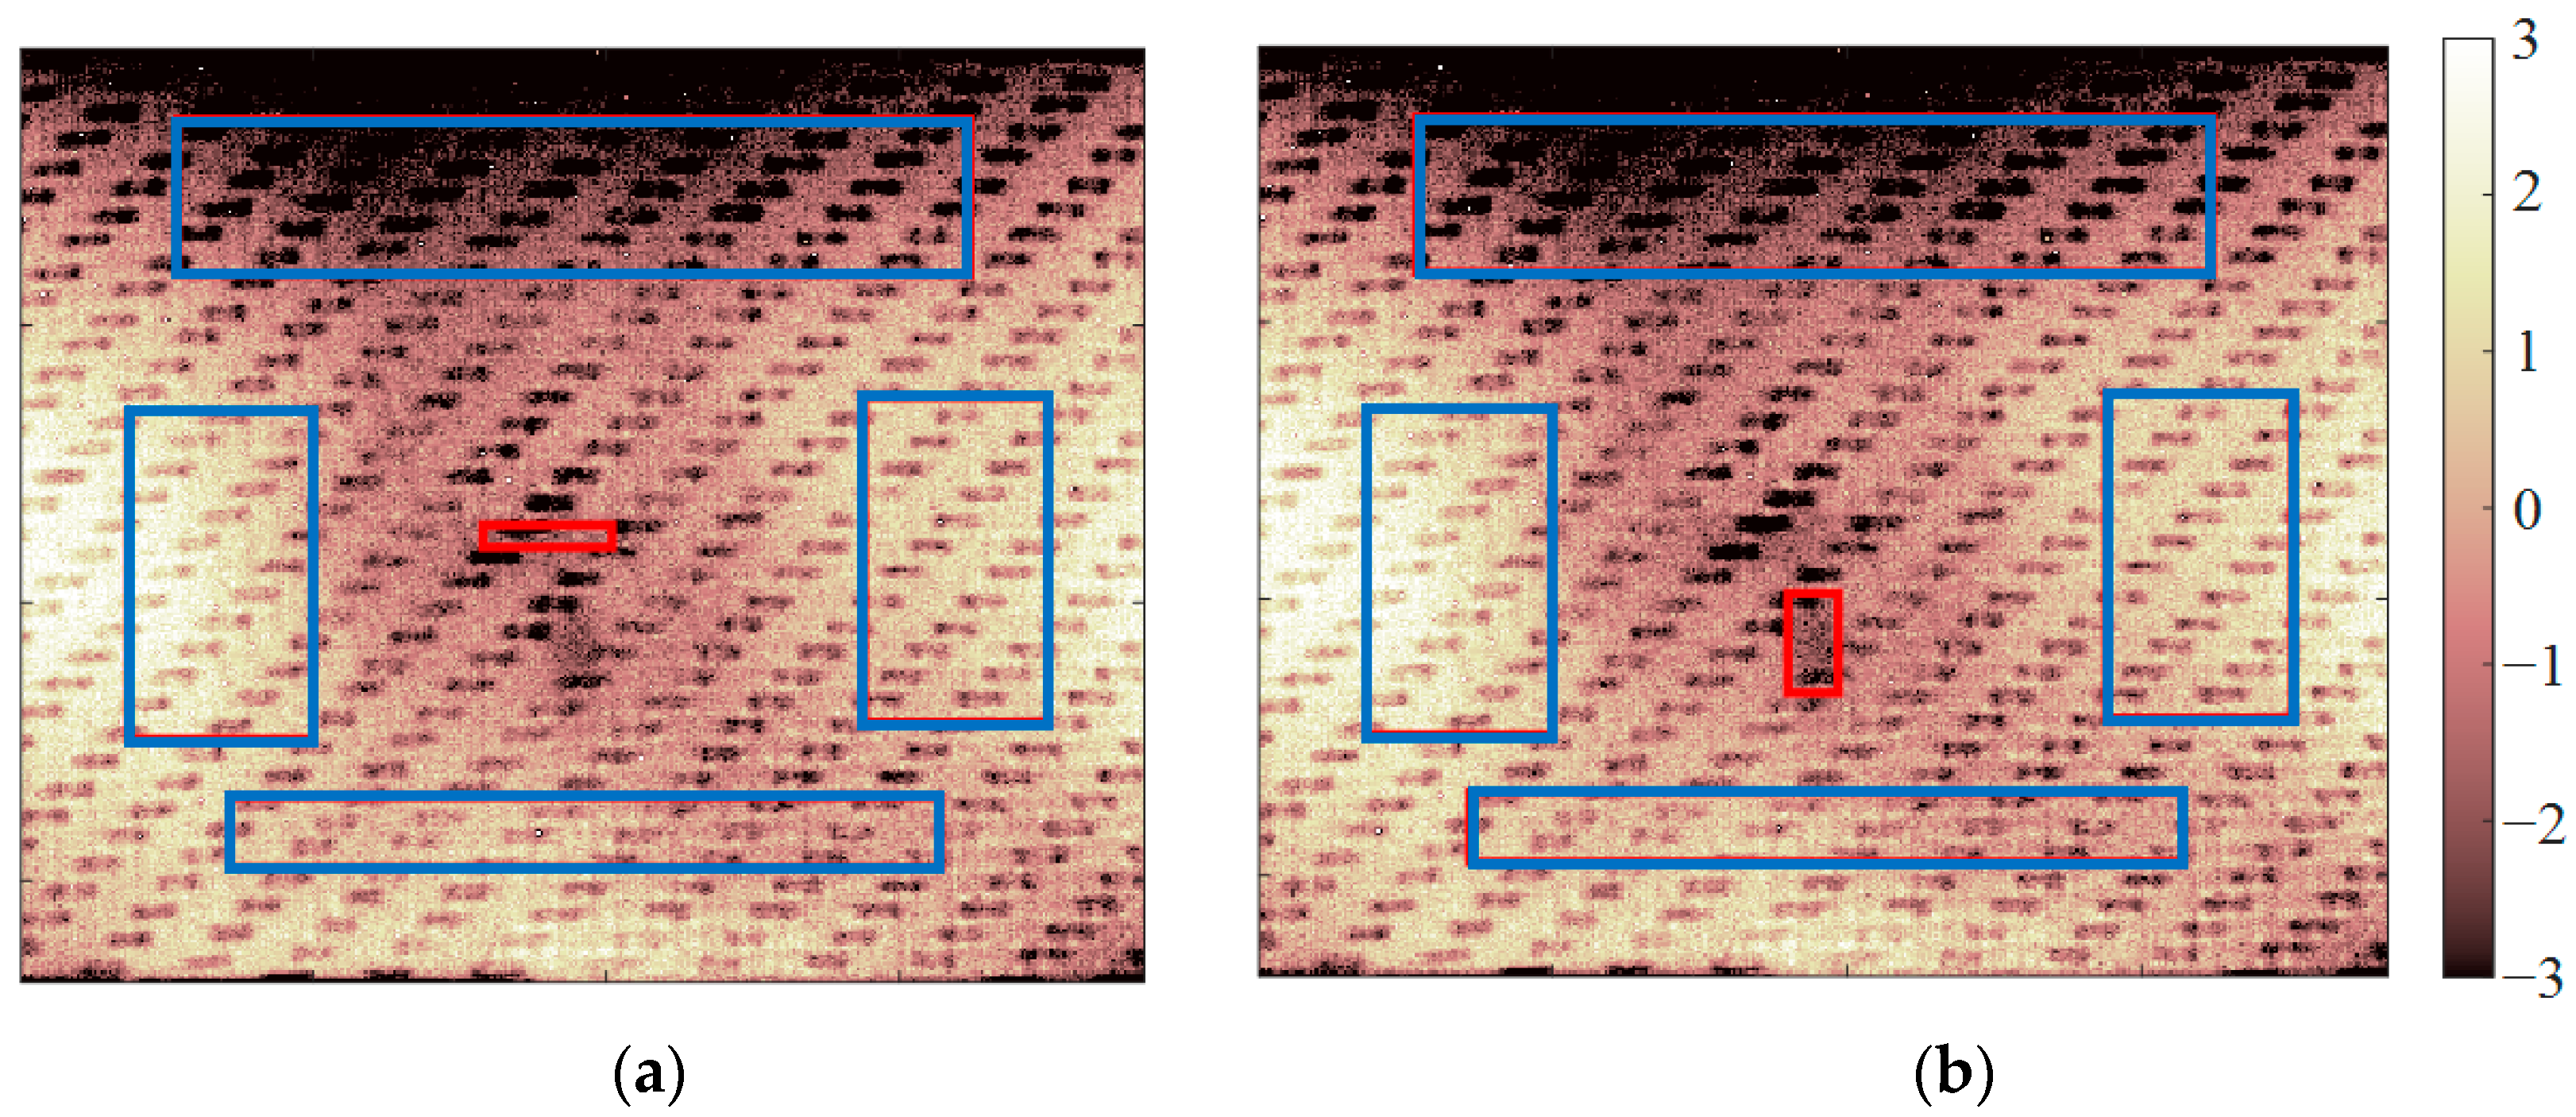
where is the mean value in correspondence of the four sound areas. After that, this mean value was subtracted from each frame of the investigated sequence (). σ(sound) is the standard deviation in correspondence of the four sound areas. Figure 5a,b shows the sound (blue rectangular boxes) and defective areas (red rectangular boxes) considered for the upper and lower parts of the damaged area, respectively.
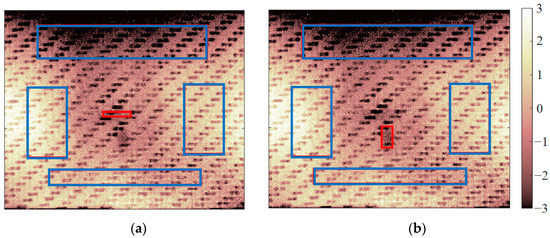
Figure 5.
The four sound regions (blue boxes) and defective areas (red boxes) in correspondence with the upper (a) and lower (b) part of the damaged area, are considered for evaluating the contrast-to-noise ratio (CNR).
It is important to highlight that a threshold value must be defined on the CNR, since it allows us to establish if a pixel belongs to a sound or damaged area. This value cannot be known a priori because it strictly depends on the specific application; therefore, an expert operator defines the threshold with the help of a visual analysis carried out on the thermal sequence. In this work, the threshold value was fixed to 2. In this regard, in Figure 6, the flowchart of the proposed procedure to achieve the quantitative results is shown. In this case, the raw sequence for the PPc impacted with 9 kg was processed with the two filters mentioned above and then normalized with respect to the four sound areas. Moreover, to further remove the noise contributions, the threshold value ±2 was applied to all the pixels of the sequences. By doing so, all the pixels that did not overcome the threshold were placed to 0 both for the CNR and index values, respectively. In all the other cases, the maximum and/or minimum CNR values with the corresponding index value were considered. In this way, four final maps that represent the minimum and maximum CNR values with the relative indices were obtained. The results are illustrated and critically discussed in the following section.
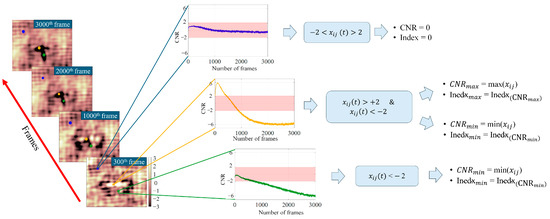
Figure 6.
The adopted procedure for obtaining quantitative results.
5. Results
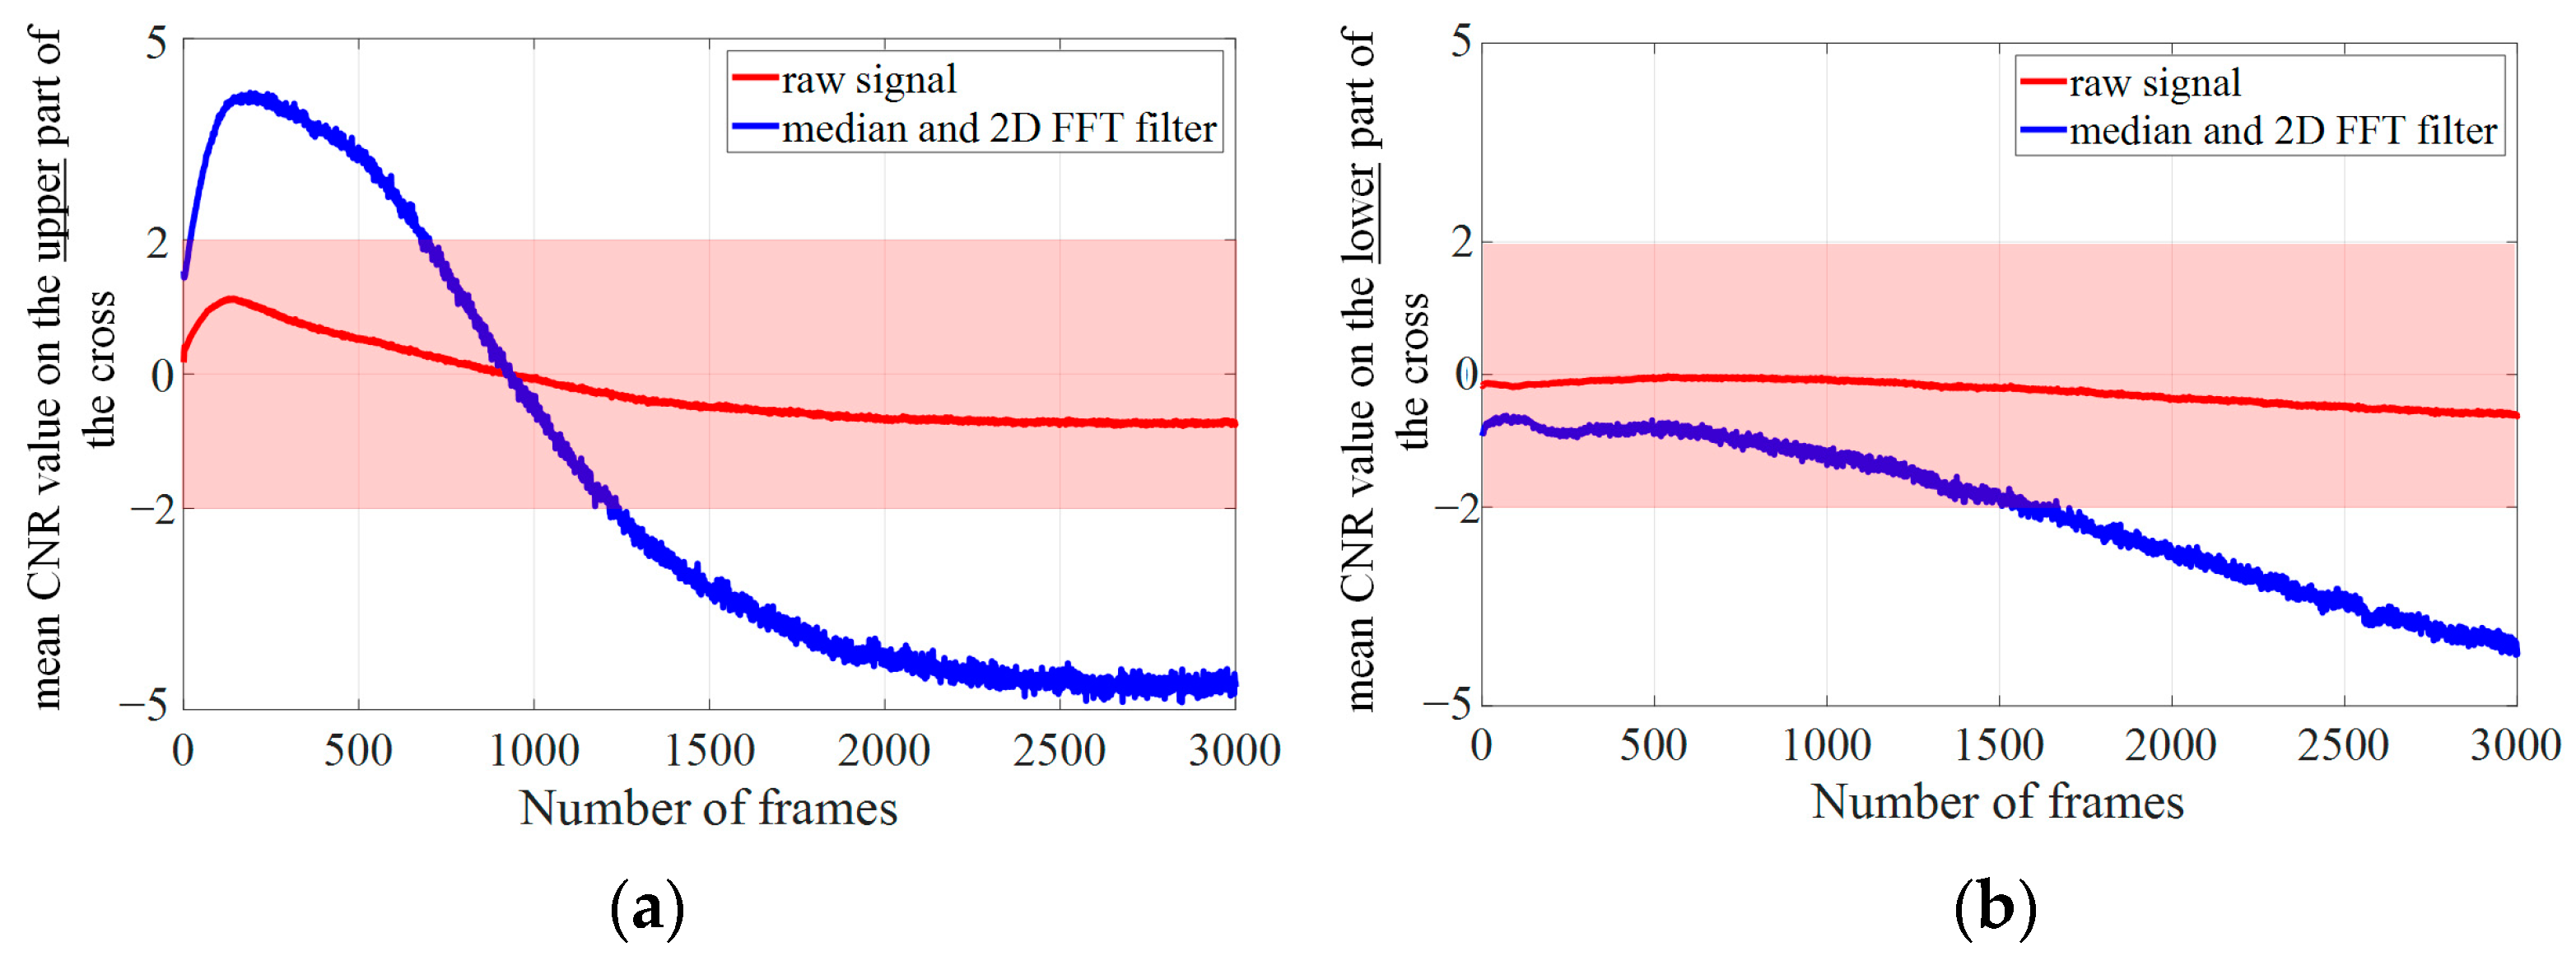
As an example, the CNR curves as a function of the number of frames for the PPc specimen impacted with 9 kg, corresponding to the upper and lower parts of the “cross-shaped” damaged area are shown in Figure 7a,b.

Figure 7.
The mean value of the CNR in correspondence with the upper (a) and lower (b) parts of the damaged area for the raw thermal and processed sequence, respectively.
The red and blue curves were obtained considering the raw thermal sequence and the processed sequence (median and 2D fft filter), respectively. Focusing on the red curve, the upper part of the cross shape could not be detected, since this curve never overcomes the threshold value (±2). On the contrary, the blue curve always has CNR values considerably higher with respect to the red one.
By observing the blue curve, which had a decrescent trend as a function of the number of frames, three different behaviors can be detected. At the beginning of the cooling phase, the upper part of the cross shape is detectable with positive CNR values, so this damage probably belongs to superficial areas of the specimen. Then, in the range between ~800 and ~1300 frames, the CNR values go below the threshold value of +2, making the detection of the damage very hard. After that, the blue curve further decreases overcoming the threshold value of −2, making the detection of the damage visible again, but with negative CNR values. The change in the sign of the CNR was probably due to the presence of different areas within the specimen. Specifically, the damaged area characterized by a negative value of the CNR belongs to deeper damage. Therefore, the upper part of the cross shape has both superficial and deeper damage.
Similar considerations can be achieved by observing Figure 7b, which represents CNR values as a function of the number of frames for the lower part of the damaged area. As can be seen, both the red and blue curves always have negative CNR values. In particular, the red curve never overcomes the threshold value of −2. Instead, with the proposed approach, the lower part of the cross shape is detectable just after ~1500 frames, as reported by the blue curve.
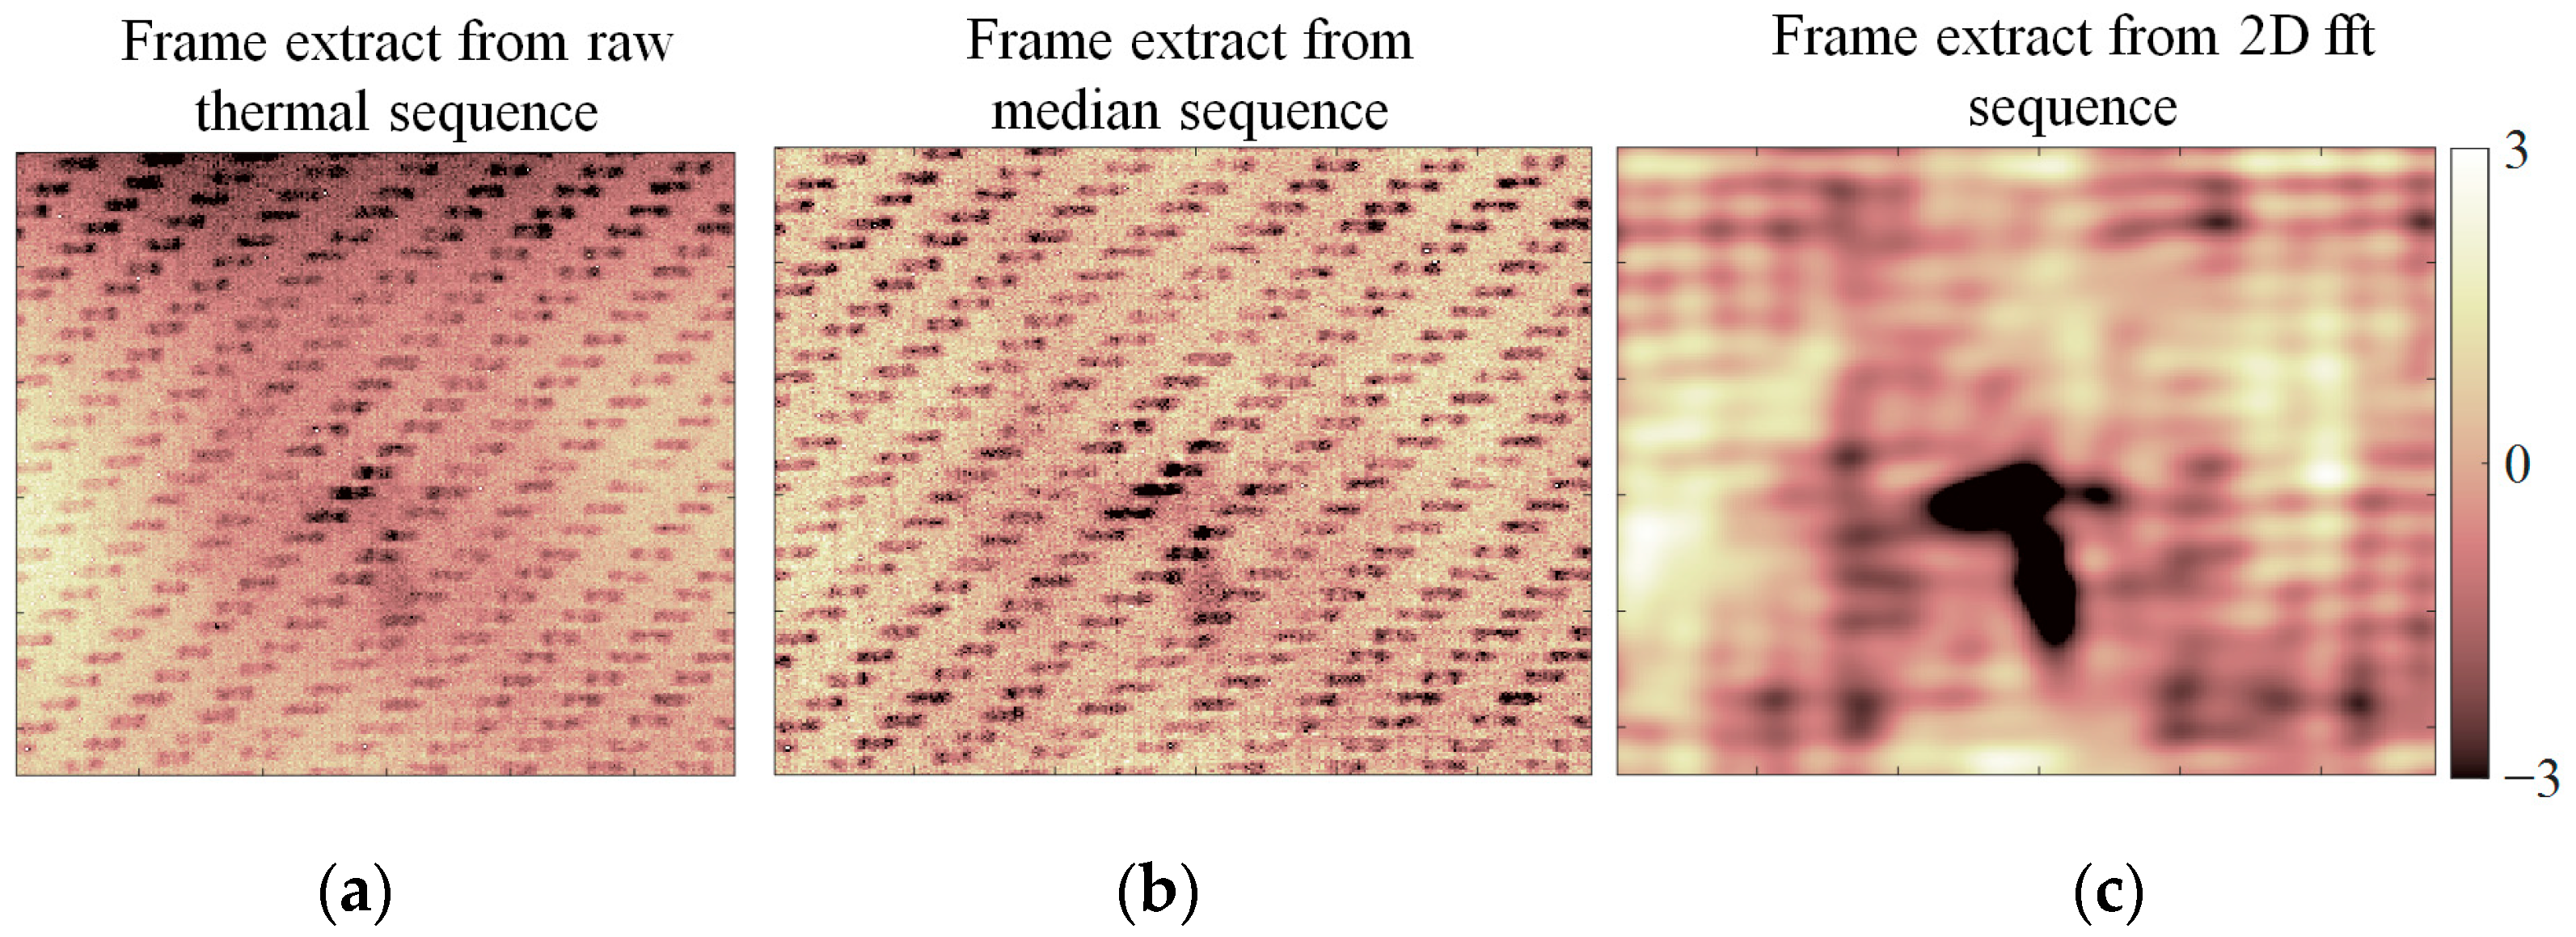
As an example, in Figure 8, the 3000th frame extract from each of the three abovementioned sequences is considered. This frame has been chosen in accordance with Figure 7a,b, in which there are good values of the CNR, both for the upper and lower parts of the cross shape of the damaged area, respectively.
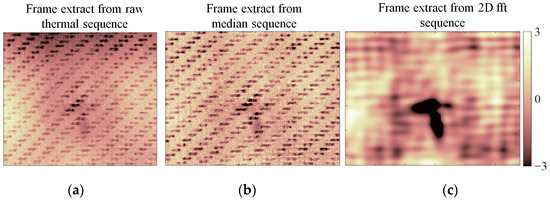
Figure 8.
From the left to the right: (a) the frame extracted from the raw thermal sequence; (b) the same frame after the application of the median filter; and (c) the same frame after the application of the two filters, i.e., median and 2D fft filters, respectively.
As expected, by observing the frame extracted from the raw thermal sequence (Figure 8a), it is difficult to detect the damaged area, since the woven pattern hides it. However, it is important to highlight that an effect, due to the contribution of the fibers, still exists, due to the adopted mask not being able to completely remove them. This is because it is not possible to create a mask that isolates only the frequency of the damaged area, since both the woven pattern and the damage share some frequency contributions.
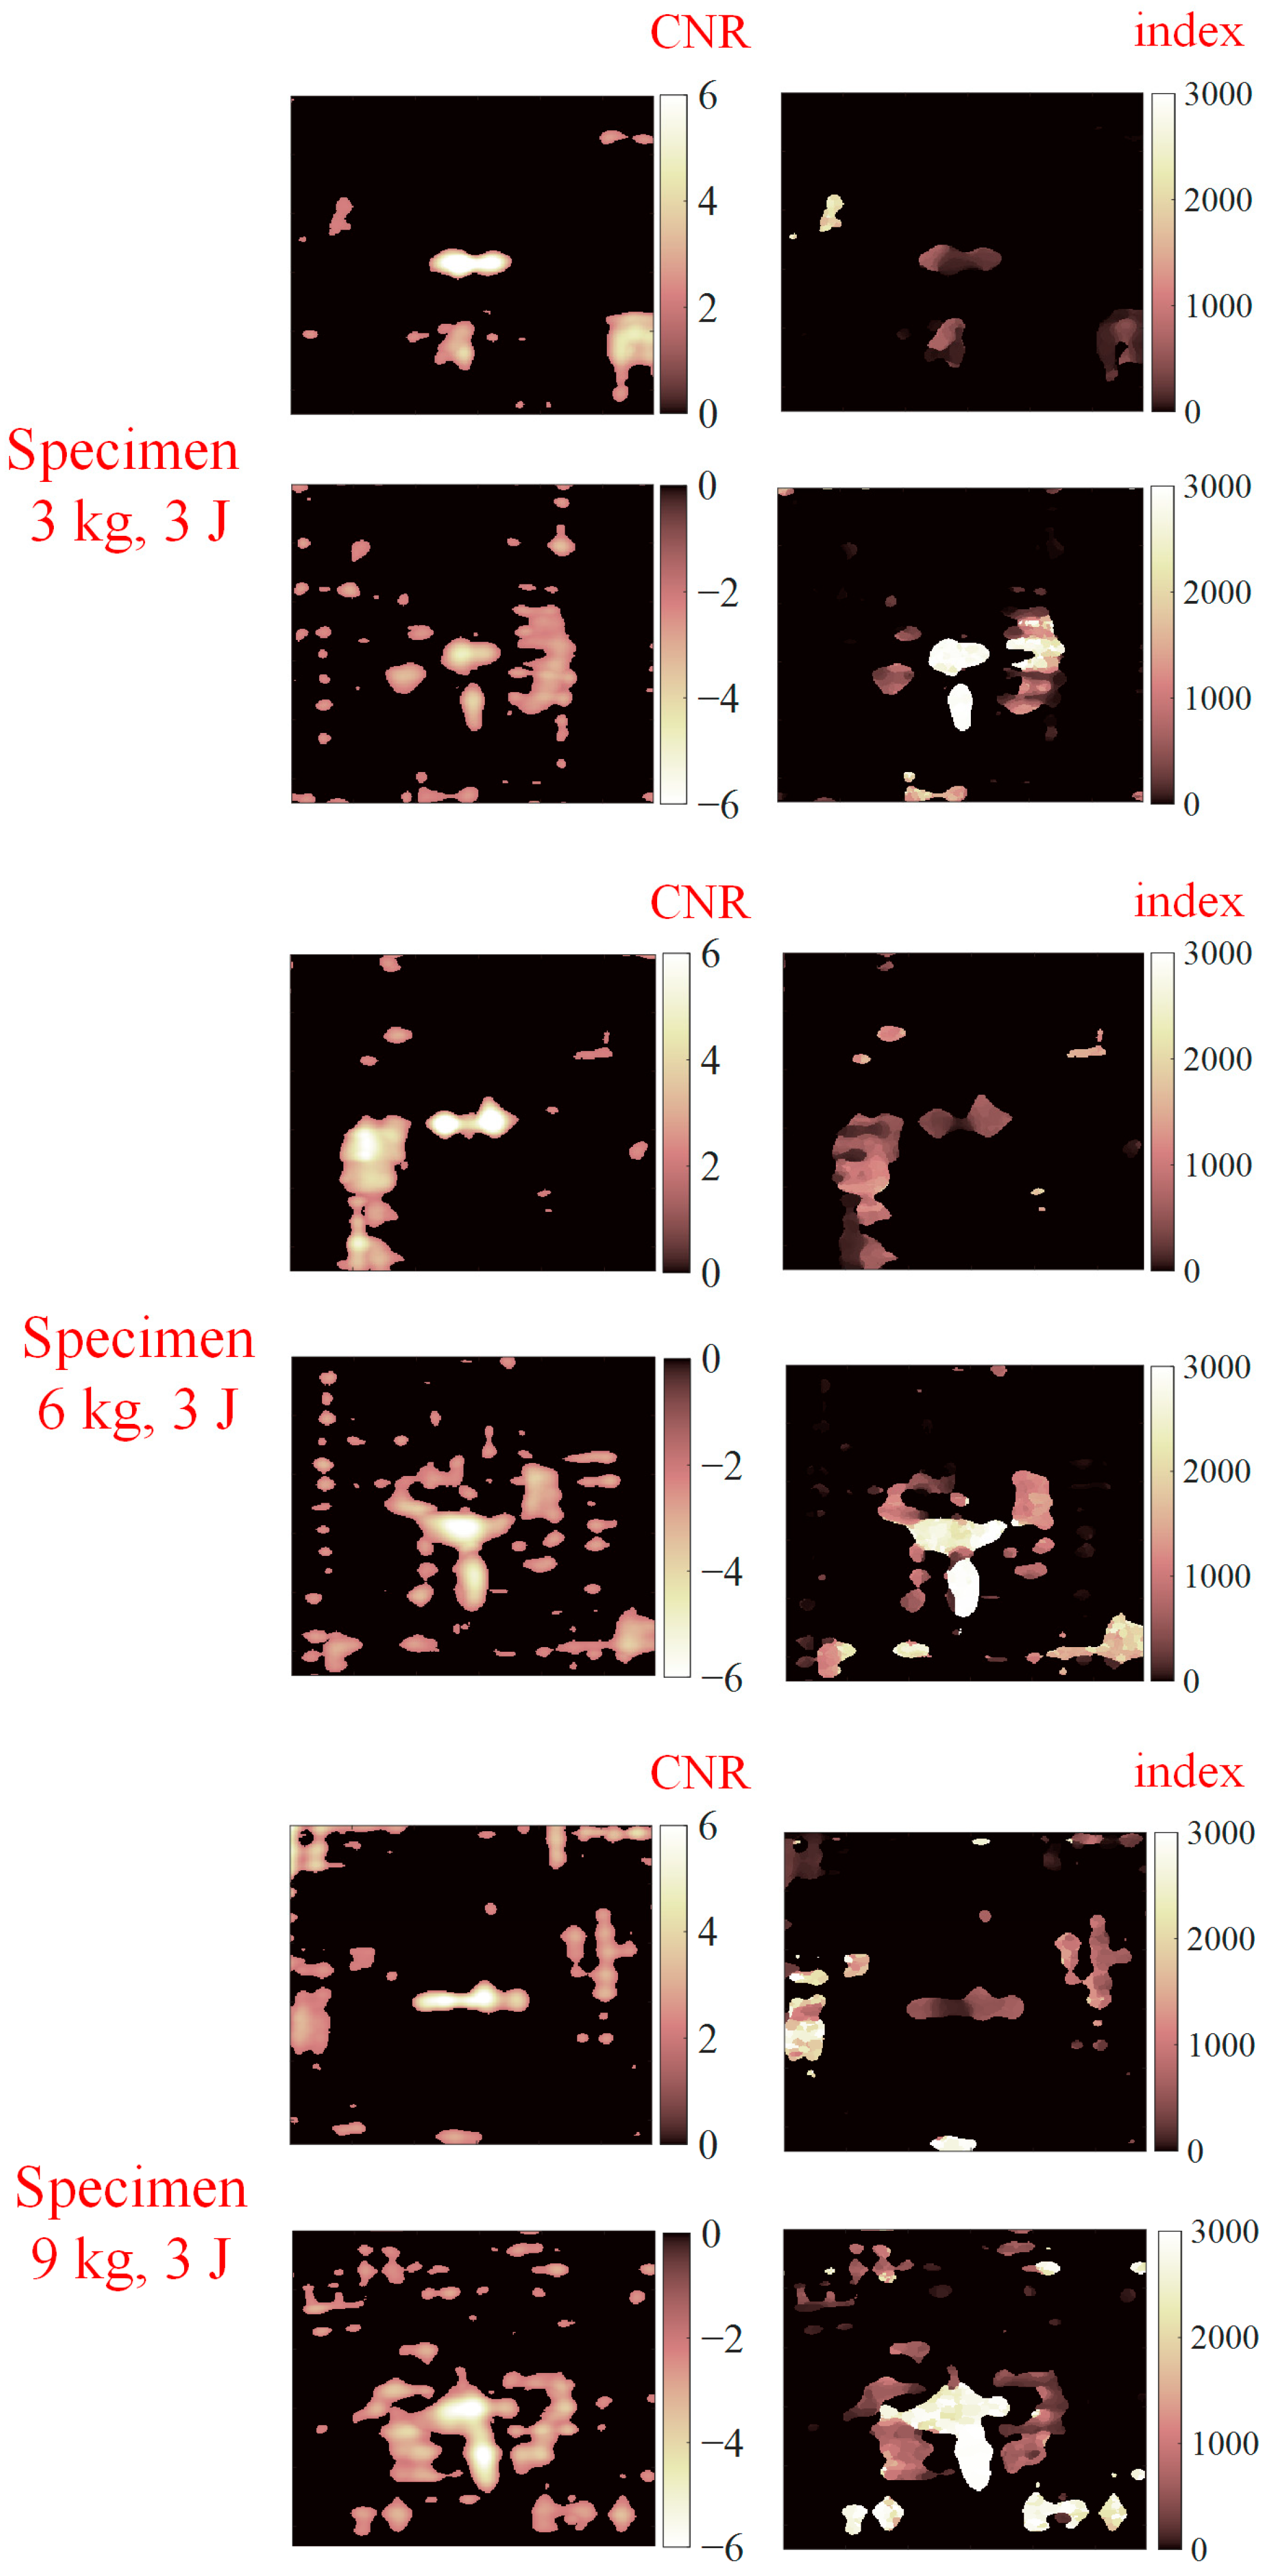
To summarize the obtained results and obtain an estimation of the depth and extension of the damaged area, the procedure proposed in Section 4 was applied to all the investigated specimens. As previously stated, this procedure consists of obtaining the minimum and maximum values, with their respective indices, for each pixel of the processed sequence.
Figure 9 shows the final maps that are divided into two columns. On the left are the positive and negative CNR values, and on the right are the corresponding index maps. By observing the positive CNR maps, the upper part of the “cross-shaped” damaged area is visible for all the investigated specimens, and the correspondent index map classifies this damage as superficial, since it arises around the 1000th frame. Only the specimen impacted with 3 kg shows the typical “cross-shaped” damaged area. Instead, on the specimen impacted with 6 kg, there is clearly visible larger damaged area that also involves areas far from the center of the specimen.
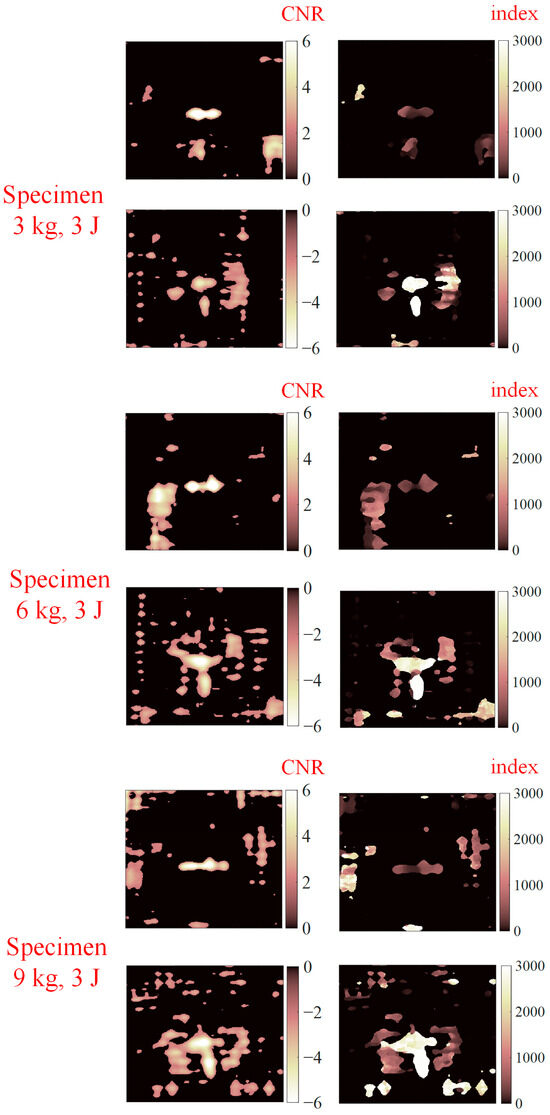
Figure 9.
Qualitative results for estimating the depth of the damaged area in all the investigated specimens.
Focusing on the negative CNR value, the upper and lower parts of the “cross shape” are visible in all the specimens, and these damages seem to be deeper since they appear around the 3000th frames. Moreover, a damaged large area appears for each specimen just around the “cross shape”.
The last analysis we performed was the estimation of the extension of the damaged area. In this regard, a rectangular box of 122 × 100 pixels was considered for each obtained CNR value map. As an example, in Figure 10, the chosen ROI, red rectangular box, for the negative CNR value for the specimen impacted with 9 kg is represented. The area inside this box is binarized between 0 and 1, representing the sound and damaged areas, respectively. In particular, all the values that overcame the threshold −2 are identified as damaged areas. The same procedure is extended to the negative maps of CNR. In Table 2 and Table 3, the obtained results are expressed as a percentage of the whole investigated area.
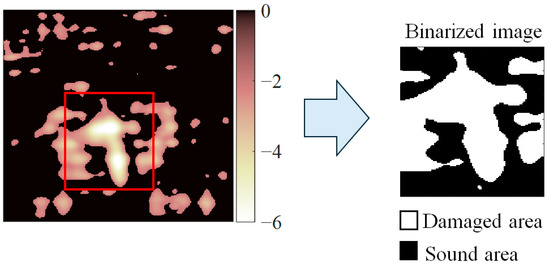
Figure 10.
Inside the red rectangular box, the percentage of the damaged area has been calculated.
Table 2.
Percentage of damaged and sound areas, assessed from the positive CNR maps, for all three investigated specimens.
Table 3.
Percentage of damaged and sound areas, assessed from the negative CNR maps, for all three investigated specimens.
The extension of the damaged area increases as a function of the mass. In particular, a mass of 3 kg does not seem to significantly damage the specimen when evaluating both the positive and negative CNR values. The superficially damaged area notably increases in correspondence with 6 kg without affecting the deeper damage. Instead, different considerations can be made for the test with 9 kg, which abruptly increases both the superficial and deeper damages. Therefore, the mass of the impactor affects the extension of the damaged area.
It is important to underline that more tests are needed to be performed in order to have more information about the damaged areas and obtain robust results by applying statistical approaches. In this regard, other replications will be carried out using similar specimens subjected to the same impact damage. Moreover, other non-destructive techniques will be used, such as Computed Tomography, to assess the damaged area and provide a reference to validate the proposed procedure.
6. Conclusions
In this work, hybrid woven specimens with flax and basalt fibers used as reinforcement in a polypropylene matrix with the addition of a coupling agent subjected to different drop masses (3–6–9 kg) but the same energy level of 3 J were investigated. To increase the detectability of the damaged area and obtain qualitative and quantitative information about the extension and the depth of the damaged area, a suitable procedure was proposed and developed. This procedure is based on the application of two spatial filters, i.e., median and 2D fft, to remove the influence of non-homogeneous heating and the effect of the periodical pattern, respectively. From these analyses, the following conclusions arise:
- The proposed approach increases significantly the signal-to-noise ratio and the capability to detect and characterize the damaged area;
- All the investigated specimens showed both superficial and deeper damage;
- The effect of the momentum is significant in terms of the extension of the damaged area.
It is important to highlight that the efficiency in evaluating the damaged area with the proposed procedure can be only assessed by comparing it with another well-established NDT, such as x-rays or tomography.
Further tests will be carried out on other specimens tested with different impact energy to validate the proposed approach.
Author Contributions
Conceptualization, T.M., D.P. and U.G.; methodology, T.M. and D.P.; data curation, T.M. and C.S.; writing—original draft preparation, T.M. and C.S.; writing—review and editing, D.P., F.S. and U.G.; supervision, U.G. and F.S. All authors have read and agreed to the published version of the manuscript.
Funding
This research received no external funding.
Institutional Review Board Statement
Not applicable.
Informed Consent Statement
Not applicable.
Data Availability Statement
Dataset available on request from the authors.
Acknowledgments
The authors would like to thank DES S.r.l. for the support during the experimental activity performed within the “National Operational Program 2014–2020, PhD programs for sustainability and innovation-related subjects”, Ministerial Decree n. 1061. Part of the work has been Financed by the European Union-NextGenerationEU (National Sustainable Mobility Center CN00000023, Italian Ministry of University and Research Decree n. 1033-17/06/2022, Spoke 11-Innovative Materials and Lightweighting). The opinions expressed are those of the authors only and should not be considered as representative of the European Union or the European Commission’s official position. Neither the European Union nor the European Commission can be held responsible for them.
Conflicts of Interest
The authors declare no conflicts of interest.
References
- Sarasini, F.; Tirillò, J.; Sergi, C.; Seghini, M.C.; Cozzarini, L.; Graupner, N. Effect of Basalt Fibre Hybridisation and Sizing Removal on Mechanical and Thermal Properties of Hemp Fibre Reinforced HDPE Composites. Compos. Struct. 2018, 188, 394–406. [Google Scholar] [CrossRef]
- Fiore, V.; Scalici, T.; Di Bella, G.; Valenza, A. A Review on Basalt Fibre and Its Composites. Compos. B Eng. 2015, 74, 74–94. [Google Scholar] [CrossRef]
- Sarasini, F.; Tirillò, J.; Ferrante, L.; Sergi, C.; Russo, P.; Simeoli, G.; Cimino, F.; Ricciardi, M.R.; Antonucci, V. Quasi-Static and Low-Velocity Impact Behavior of Intraply Hybrid Flax/Basalt Composites. Fibers 2019, 7, 26. [Google Scholar] [CrossRef]
- Saleem, A.; Medina, L.; Skrifvars, M.; Berglin, L. Hybrid Polymer Composites of Bio-Based Bast Fibers with Glass, Carbon and Basalt Fibers for Automotive Applications—A Review. Molecules 2020, 25, 4933. [Google Scholar] [CrossRef] [PubMed]
- Vescovini, A.; Cruz, J.A.; Ma, D.; Colombo, C.; Salerno, A.; Bianchi, O.; Amico, S.C.; Manes, A. Experimental Investigation on Low-Velocity Impact Behavior of Glass, Kevlar, and Hybrid Composites with an Elastomeric Polyurethane Matrix. Compos. Part C Open Access 2024, 13, 100426. [Google Scholar] [CrossRef]
- Sergi, C.; Tirillò, J.; Iacovacci, C.; Sarasini, F. Influence of Reprocessing Cycles on the Morphological, Thermal and Mechanical Properties of Flax/Basalt Hybrid Polypropylene Composites. Sustain. Mater. Technol. 2023, 36, e00648. [Google Scholar] [CrossRef]
- Boccardi, S.; Boffa, N.D.; Carlomagno, G.M.; Del Core, G.; Meola, C.; Monaco, E.; Russo, P.; Simeoli, G. Lock-In Thermography and Ultrasonic Testing of Impacted Basalt Fibers Reinforced Thermoplastic Matrix Composites. Appl. Sci. 2019, 9, 3025. [Google Scholar] [CrossRef]
- Huang, J.; Wei, Q.; Zhuo, L.; Zhu, J.; Li, C.; Wang, Z. Detection and Quantification of Artificial Delaminations in CFRP Composites Using Ultrasonic Thermography. Infrared Phys. Technol. 2023, 130, 104579. [Google Scholar] [CrossRef]
- Maierhofer, C.; Röllig, M.; Krankenhagen, R.; Myrach, P. Comparison of Quantitative Defect Characterization Using Pulse-Phase and Lock-in Thermography. Appl. Opt. 2016, 55, D76. [Google Scholar] [CrossRef]
- Breitenstein, O.; Warta, W.; Langenkamp, M. Lock-in Thermography, 2nd ed.; Springer: Berlin/Heidelberg, Germany, 2010; pp. 7–59. [Google Scholar]
- Delanthabettu, S.; Menaka, M.; Venkatraman, B.; Raj, B. Defect Depth Quantification Using Lock-in Thermography. Quant. Infrared Thermogr. J. 2015, 12, 37–52. [Google Scholar] [CrossRef]
- Salazar, A.; Sagarduy-Marcos, D.; Rodríguez-Aseguinolaza, J.; Mendioroz, A.; Celorrio, R. Characterization of Semi-Infinite Delaminations Using Lock-in Thermography: Theory and Numerical Experiments. NDT E Int. 2023, 138, 102883. [Google Scholar] [CrossRef]
- Maldague, X.P.V. Nondestructive Evaluation of Materials by Infrared Thermography; Springer: London, UK, 1993; pp. 265–450. [Google Scholar]
- He, Y.; Deng, B.; Wang, H.; Cheng, L.; Zhou, K.; Cai, S.; Ciampa, F. Infrared Machine Vision and Infrared Thermography with Deep Learning: A Review. Infrared Phys. Technol. 2021, 116, 103754. [Google Scholar] [CrossRef]
- Mulaveesala, R.; Tuli, S. Theory of Frequency Modulated Thermal Wave Imaging for Nondestructive Subsurface Defect Detection. Appl. Phys. Lett. 2006, 89, 191913. [Google Scholar] [CrossRef]
- Banda, S.S.; Ghali, V.S.; Vesala, G.T.; Mulaveesala, R. Non-Linear Frequency Modulated Thermal Wave Imaging for Subsurface Analysis. Infrared Phys. Technol. 2024, 138, 105248. [Google Scholar] [CrossRef]
- Evans, E.E.; Brooks, R.A.; Liu, J.; Hall, Z.E.C.; Liu, H.; Lowe, T.J.E.; Withers, P.J.; Kinloch, A.J.; Dear, J.P. Comparison of X-Ray Computed Tomography and Ultrasonic C-Scan Techniques and Numerical Modelling of Impact Damage in a CFRP Composite Laminate. Appl. Compos. Mater. 2024, 31, 249–264. [Google Scholar] [CrossRef]
- Almond, D.P.; Pickering, S.G. An Analytical Study of the Pulsed Thermography Defect Detection Limit. J. Appl. Phys. 2012, 111, 093510. [Google Scholar] [CrossRef]
- Chatterjee, K.; Tuli, S.; Pickering, S.G.; Almond, D.P. A Comparison of the Pulsed, Lock-in and Frequency Modulated Thermography Nondestructive Evaluation Techniques. NDT E Int. 2011, 44, 655–667. [Google Scholar] [CrossRef]
- Palumbo, D.; Galietti, U. Damage Investigation in Composite Materials by Means of New Thermal Data Processing Procedures. Strain 2016, 52, 276–285. [Google Scholar] [CrossRef]
- Almond, D.P.; Angioni, S.L.; Pickering, S.G. Long Pulse Excitation Thermographic Non-Destructive Evaluation. NDT E Int. 2017, 87, 7–14. [Google Scholar] [CrossRef]
- Matarrese, T.; Palumbo, D.; Galietti, U. Comparison in the Transient Regime of Four Lock-in Thermography Algorithms by Means of Synthetic and Experimental Data on CFRP. NDT E Int. 2023, 139, 102925. [Google Scholar] [CrossRef]
- Pickering, S.; Almond, D. Matched Excitation Energy Comparison of the Pulse and Lock-in Thermography NDE Techniques. NDT E Int. 2008, 41, 501–509. [Google Scholar] [CrossRef]
- Pitarresi, G. Lock-In Signal Post-Processing Techniques in Infra-Red Thermography for Materials Structural Evaluation. Exp. Mech. 2015, 55, 667–680. [Google Scholar] [CrossRef]
- D’Accardi, E.; Palumbo, D.; Galietti, U. A Comparison among Different Ways to Investigate Composite Materials with Lock-In Thermography: The Multi-Frequency Approach. Materials 2021, 14, 2525. [Google Scholar] [CrossRef] [PubMed]
- Wu, D.; Busse, C. Lock-in Thermography for Nondestructive Evaluation of Materials. Rev. Gév. Therm. 1998, 37, 693–703. [Google Scholar]
- Zhang, H.; Sfarra, S.; Sarasini, F.; Santulli, C.; Fernandes, H.; Avdelidis, N.P.; Ibarra-Castanedo, C.; Maldague, X.P.V. Thermographic Non-Destructive Evaluation for Natural Fiber-Reinforced Composite Laminates. Appl. Sci. 2018, 8, 240. [Google Scholar] [CrossRef]
- Pawar, S.S.; Peters, K. Through-the-Thickness Identification of Impact Damage in Composite Laminates through Pulsed Phase Thermography. Meas. Sci. Technol. 2013, 24, 5601. [Google Scholar] [CrossRef]
- Poelman, G.; Hedayatrasa, S.; Van Paepegem, W.; Kersemans, M. Enhanced Thermographic Inspection of Woven Fabric Composites by k-Space Filtering. Compos. Part B Eng. 2023, 252, 110508. [Google Scholar] [CrossRef]
- Morelli, D.; Marani, R.; D’Accardi, E.; Palumbo, D.; Galietti, U.; D’Orazio, T. A Convolution Residual Network for Heating-Invariant Defect Segmentation in Composite Materials Inspected by Lock-in Thermography. IEEE Trans. Instrum. Meas. 2021, 70, 2515214. [Google Scholar] [CrossRef]
- Matarrese, T.; Marani, R.; Palumbo, D.; D’Orazio, T.; Galietti, U. Influence of Lock-in Thermography Set-up Parameters on the Capability of a Temporal Convolutional Neural Network to Characterize Defects in a CFRP. Opt. Lasers Eng. 2024, 182, 108455. [Google Scholar] [CrossRef]


Disclaimer/Publisher’s Note: The statements, opinions and data contained in all publications are solely those of the individual author(s) and contributor(s) and not of MDPI and/or the editor(s). MDPI and/or the editor(s) disclaim responsibility for any injury to people or property resulting from any ideas, methods, instructions or products referred to in the content. |
© 2025 by the authors. Licensee MDPI, Basel, Switzerland. This article is an open access article distributed under the terms and conditions of the Creative Commons Attribution (CC BY) license (https://creativecommons.org/licenses/by/4.0/).