Proceeding Paper

Small Launchers Design and Cost Balance Improvements †

by
Rubén González-González
*,
Andrés García-Pérez
and
Gustavo Alonso Rodrigo
Instituto Universitario de Microgravedad Ignacio Da Riva, Universidad Politécnica de Madrid, 28040 Madrid, Spain
*
Author to whom correspondence should be addressed.
Presented at the 14th EASN International Conference on “Innovation in Aviation & Space towards sustainability today & tomorrow”, Thessaloniki, Greece, 8–11 October 2024.
Eng. Proc. 2025, 90(1), 98; https://doi.org/10.3390/engproc2025090098
Published: 17 April 2025

Abstract

:
The improvement of the design of space launchers, with a consequent reduction in development costs, has not been achieved to the same extent as in the case of satellite designs, even when applying similar Concurrent Engineering processes and MBSE methodologies. The aim of this paper is to introduce the current research at “Universidad Politécnica de Madrid” onto increasing the design efficiency of small space launchers, which is in the preliminary conceptual phases. A new approach is developed based on physical models’ integration in a simulator using a MBSE framework to find an optimal balance between costs and design weights.

1. Introduction

An analysis of the state of the art of research on space launchers design allows us to identify three main challenges in the optimal conceptual design of space launchers in the micro and nanosatellite market segment:
  • Multidisciplinary Design Optimization methods are focused mainly on weight optimization, with modeling and cost analyses being viewed as subordinate to the weight or analyses focused purely on business aspects.
  • Model and Simulation methods are focused on reproducing subsystems’ performance, but they are not linked to the system requirements and architecture definition process.
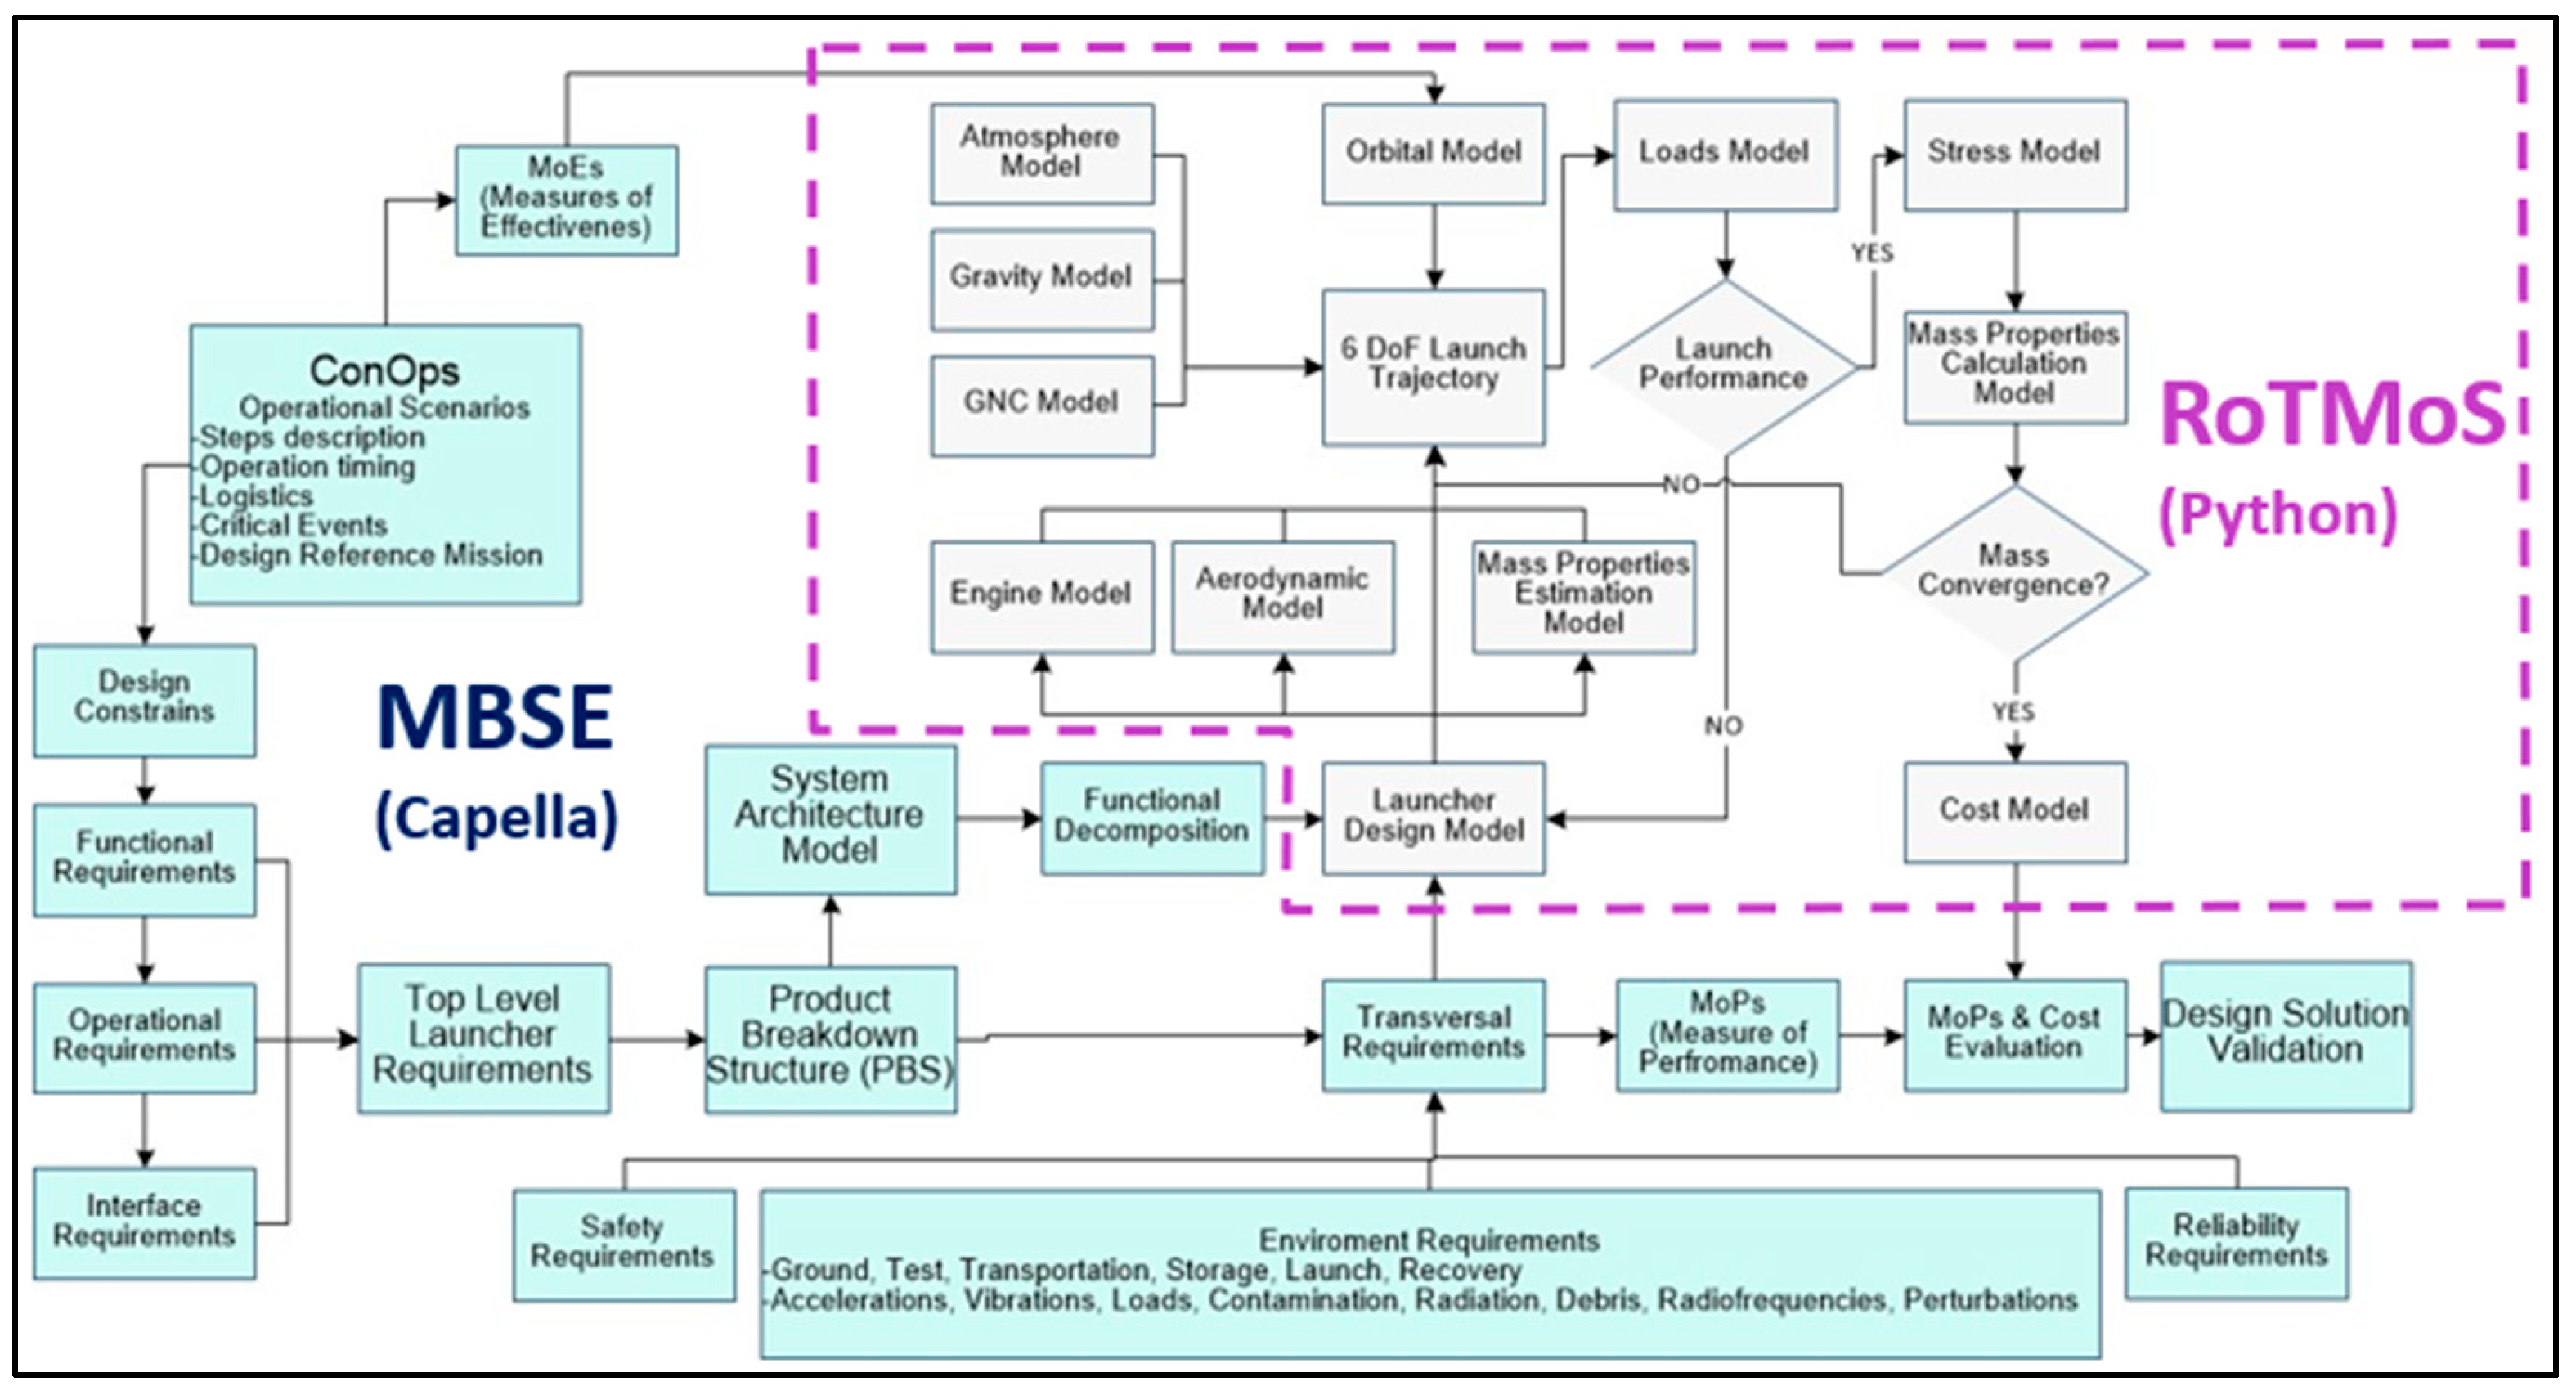
  • Model-Based Systems Engineering (MBSE) methods allow us to define functional architectures by designating functions to each subsystem and defining the interfaces between functions, as well as between the system and the environment. However, they do not consider the fact that the design of space launchers is based more on physics simulation analysis than on functional decomposition.
Our research at “Universidad Politécnica de Madrid” is based in the integration of multidisciplinary simulations and cost estimation models in a MBSE framework identifying the key design drivers in each subsystem. The main objective is to demonstrate the existence of the optimal balance between weight and cost optimization theories.
For this purpose, a Space Launcher preliminary design simulator tool (RoTMoS—Rocket and Trajectory Modular Simulator) is being developed, covering the main disciplines involved in the preliminary design of space launchers. This will enable an experimental design to analyze the parameters’ sensitivity levels to weight and cost results. The simulator modules will be integrated into the MBSE tool (Eclipse CapellaTM) by means of a mission use case (UPM-Sat Program) for the construction of the optimized space launcher system architecture and functionalities. The overall framework of MBSE&S and RoTMoS is described in Figure 1.

2. Introduction to the Space Launch Price Estimation

The Space Industry business environment has changed significantly over the last decade, becoming extremely competitive. In the past, all successful developments were driven by the Space Agencies and public funding within historical aerospace companies. Today, hundreds of small companies compete globally to attract investors to develop their first small space launcher.
Deep dive research has been performed focusing on the space launchers market to build a database with more than 560 launchers, including retired, canceled, dormant, and development projects, including their variants, from around the world. The main difficulties found during the data collection were as follows:
  • To identify the price data sources. The prices are not usually published but commented on by the manufacturer in different media sources. Any research must handle this kind of data carefully, assuming that discrepancies and inconsistencies can be found. The prices must be updated considering the cost inflation from the year of publication.
  • To establish the difference between price and cost. Generally, all sources and publications use the wording of cost when they refer to the Price per Flight. However, most of the existing launcher manufacturers are funded by government space agencies, which means that no Development Cost Amortization (DCA) is applied. This means that the price can be considered in the same order of magnitude as the cost.
In the retired and operating space launchers market analysis, we can assume that the cost is equal to the price. However, for new developments, the DCA assumption must be specified for proper comparisons.
From the identified small launcher developments, only 58 show targeted launch prices. The price analysis of those launchers, compared with the actual launcher’s Launch Cost as a function of the Low Earth Orbit (LEO) maximum Payload Weight (see Figure 2), allows us to conclude the following:
  • The most promising projects (those that are already awarded with public funds) show target launch prices that are in line with operational launchers. This could mean a potential risk of a lack of competitiveness against already operating launchers.
  • Many of the projects are in the very early conceptual phases, with extremely optimistic launch prices, even below USD 1 million for payloads lighter than 400 kg. Some of these optimistic projects are even based on immature technologies, so they cannot be considered robust references for short- and medium-term development analyses.
  • A target price of 15 thousand USD/kg could be considered a realistic top-level requirement for a new generation of small and micro-launchers for LEO payloads lighter than 300 kg.
Figure 2. Space Launch cost analysis.
Engproc 90 00098 g002

3. RoTMoS Cost Estimation Models

3.1. Existing Cost Estimation Model Analysis

Most of the existing financial models in the space industry are based on cost estimation relationships (CERs) against independent variables, mainly calculated by statistical regression methods, which means that they can only be applied on similar vehicles or components.
Several cost estimation models and CER studies [1,2,3,4,5,6,7,8] are available, including the models used by the main space agencies. The main difficulty linked to the application of these models is the fact that they are usually based on historical missions and launchers based on a classical business approach, so they cannot be directly applied to the NewSpace environment and Small Launchers business.
From all the analyzed models, only the SOLSTICE method [1] fits with the RoTMoS subsystems’ weight breakdown granularity, as implemented in the Mass Properties Estimation module. However, the TRANSCOST method [2] flexibility, which applies factors to consider the Technical Development status, Team Experience, and Country productivity, is required to reach the research objectives. A hybrid model, extending SOLSTICE with TRANSCOST factors and considering each subsystem’s Technology Readiness Level (TRL), is proposed.

3.2. Cost Estimation Model Development

3.2.1. Launch Vehicle Development Cost (LVDC) Model

The LVDC is defined in Equation (1) as the sum of each subsystem’s development cost considering the parameters presented in Table 1.
L V D C = i = 0 n f 1 i f 3 i f 8 i a i M a s s i b i 12 T R L i + S T H n i n i L n ( p i ) L n ( 2 ) 1 + M & P a % S m C p
For engines, the TRANSCOST learning factor is defined in Equation (2) based on the mass of the engine and the number of manufactured engines per year, NYL.
p e n g i n e = L n M a s s e n g i n e 0.0146 n i N Y L 0.056 + 0.937

3.2.2. Cost per Flight Model

The Cost per Flight (CpF) is defined in Equation (3) as the total cost to launch a vehicle, including the Launch Vehicle Production Cost (LVPC) and the Launch Operations (Direct and Indirect) Costs (LDOC and LIOC).
C p F = L V P C + L D O C + L I O C
The LVPC model defined in Equation (4) follows the same approach as the LVDC method using the SOLSTICE method and adapted based on the TRANSCOST factors and the learning of the xth production unit:
LVPC = i = 0 n f 1 i f 3 i f 8 i a i M a s s i b i n i X L n ( p i ) L n ( 2 ) C p
The LDOC model defined in Equation (5) follows the TRANSCOST model without modifications, including ground operations for the vehicle launch preparation (GOPC), propellant and gases (PROC), flight and mission operations (FMOC), ground transportation and recovery (GTRC), fees, and insurances (FEIC) costs:
L D O C = G O P C + P R O C + F M O C + G T R C + F E I C
The LIOC model follows the TRANSCOST model without modifications, considering Program Administration and Systems Management, Marketing and Contracts management, Technical Support activities and Industrial Relations, Launch Site Infrastructure, and Maintenance costs.

3.2.3. Price per Flight Model

The Price per Flight (PpF) is defined in Equation (6) as the price that is charged to the customers. It includes the Cost per Flight (CpF) plus the Development Cost Amortization (DCA) plus the Launcher Company Profit (LCP).
P p F = C p F + D C A + L C P
The PpF can be compared to the available market prices of launch vehicles; however, one of the main uncertainties is the lack of information related to the multiple services that could be included under the LDOC concept, the selected nominal profit margin, and especially any amortization rates below the DCA.
The Development Cost Amortization is calculated in Equation (7) considering the LVDC and the amortization range of flights based on the target amortization years (NAY) and the expected Launch Rate per year (LR).
D C A = L V D C / ( N A Y L R )
The LCP is calculated as a percentage (usually 5–8%) of the CpF.

4. RoTMoS Cost Estimation Models Validation

SpaceX Falcon1 has been considered as the baseline for the Cost Estimation model validation and for the trade comparison presented in this analysis.
The Falcon1 development presents some specific characteristics that contributed to its success in reducing the prices per flight and can be properly considered in the model:
  • Highly skilled and experienced engineers were recruited from the space industry [9].
  • Existing technology was reused, like using the NASA FASTRAC engine [10,11,12] as the basis to develop the MERLIN engine, even using the same turbopump and suppliers [13].
  • In-house design and manufacturing were applied for most of the components, minimizing the subcontracting [13].
  • The design processes and management of requirements were simplified as part of the new Systems Engineering approach, unifying engineering models and implementing a rapid prototyping approach to reduce system design risks [14].
Based on the RoTMoS Simulation and Cost Estimation model, the Launch Vehicle Development Cost (LVDC) is estimated to be EUR 63.7 million, including the first launch vehicle manufacturing (EUR 7.6 million). If we consider the cost of the next three vehicles that SpaceX needed until the first orbital insertion success (EUR 19.8 million), the Falcon1 final Launch Vehicle Development Cost is estimated to be EUR 83.4 million.
SpaceX officially declared that the Falcon1 Development Cost was USD 83 million [13] in 2009 (the Vanderberg spaceport installation conditioning cost of USD 7 million is excluded). This means EUR 84.3 million in 2017 (the SOLSTICE model reference year) considering the inflation history and the average euro–dollar exchange rate. In conclusion, the RoTMoS Development Cost model gives a 1% deviation without any further calibration.
Considering a Gross Launch Weight of 27,240 kg carrying a payload of 180 kg (mission 5, RazakSAT) [13], launched from Omelek Island and the range facilities of the Ronald Reagan Ballistic Missile Defense Test Site (avoiding paying for public damage insurance), the Cost per Flight is estimated to be EUR 7.7 million. The average Production Unit cost is based on the 10th manufactured launcher (EUR 4.8 million). No Development Cost Amortization has been considered, following the SpaceX Falcon1 marketing strategy [9].
SpaceX declared that the final price for Falcon1 was USD 7 million. This means EUR 7.1 million in 2017. The proposed model gives a 7.8% deviation in the Price per Flight estimation without any further calibration.

5. Small Launchers RoTMoS Cost Estimation Trade

The aim of the presented trade analysis is to assess the impact on the Cost per Flight of reusability technology and the development cost for a European start-up company. The following scenarios have been analyzed using SpaceX Falcon1 as a baseline for comparison:
  • Scenario 1. SpaceX Falcon 1 as it was developed.
  • Scenario 2. SpaceX Falcon 1 as it was developed but introducing Falcon 9’s reusability concept.
  • Scenario 3. The Falcon 1 scenario 1 as it would be developed by a European start-up of senior aerospace engineers without experience in the launchers industry.
A breakdown of the Development Cost estimation breakdown for the three scenarios is presented in Table 2. The reusability technology application would mean a development cost increase of about +15% because of the Stage 1 landing system development. The Development Cost of a space launcher like Falcon 1 by a European start-up would be +70% higher, mainly because of the engine and avionics development and the team’s lack of experience.
Applying the same approach to the Cost and Price per Flight, the estimations results are presented in Table 3. The reusability technology application would mean a Cost per Flight saving of 14% because of the Stage 1 reusability (25% production cost) vs. a small increase (+5%) in the Direct Operational Costs due to the recovery cost. As SpaceX did not apply Development Cost Amortization to its Launch Price, no profit is assumed as part of their marketing strategy, so the Price and Cost per Flight are the same.
The Cost per Flight of a space launcher like Falcon1, developed by a European start-up, would be +26% higher, mainly because of the launcher production cost (+31%). The final Price per Flight would be +48% higher due to the need to consider the Development Cost Amortization and the Profit.

6. Small Launchers RoTMoS Cost Estimation Conclusions

The Launch Cost history analysis as a function of the Maximum Payload shows an improvement based on technological evolution. A target price of 15 thousand USD/kg could be considered a realistic top-level requirement for a new generation of small and micro-launchers for LEO payloads lighter than 300 kg.
The business case for space launchers’ reusability, based on the Development Cost and Launch Price estimation performed using RoTMoS, is not conclusive, and it is affected by several factors like the development team’s experience and the components’ TRL. The space launcher’s reusability shows a potential 14% Launch Cost saving but an increasing Development Cost of about +15%.
The RoTMoS analysis of the development cost of the Falcon 1 by a start-up in Europe, considering the full development of the required technologies and based on a team of experienced aerospace engineers, shows a 70% increase vs. SpaceX. This is translated, considering the need to amortize the development cost, into a Launch Price that is +48% higher.
In the context of developing space launchers, the amortization range of flights has become a critical factor for setting a competitive Price per Flight. A large number of flights per year reduces the Development Cost Amortization. However, this strategy will cause a lack of trust in potential investors if the number of expected launches per year is too high and not aligned with the market forecasts.
The Small Launchers 2021 Industry Survey [15] confirms that manufacturers are planning high launch frequencies (every two weeks or even daily), while there are not enough announced customers for even a monthly frequency [16].
An example of the criticality of Development Cost Amortization estimations can be found in the competitive Price per Flight offered by SpaceX with Falcon 1 (USD 7 million), based on Elon Musk’s marketing strategy of excluding the DCA in the PpF offer [9]. Today it is assumed, considering that the project was canceled after the second successful flight, that Falcon 1 was a technology demonstration platform [13], and its development costs could have been integrated into Falcon 9’s Development Amortization Cost.
As a consequence of the importance of the Development Cost Amortization demonstrated in the presented trade analysis, this study concludes that a competitive business case for small space launcher development could only be achieved if these costs are not charged in the final Price per Flight, as SpaceX did with Falcon1. This strategy can only be achieved with the support of public funding, so governmental support for small launcher technology development must be considered a critical success factor for any start-up.

Author Contributions

Conceptualization, methodology, software, validation, formal analysis and writing—original draft preparation, R.G.-G. Writing—review and editing, and supervision, A.G.-P. and G.A.R. All authors have read and agreed to the published version of the manuscript.

Funding

This research received no external funding.

Institutional Review Board Statement

Not applicable.

Informed Consent Statement

Not applicable.

Data Availability Statement

Data sharing is not applicable.

Conflicts of Interest

The authors declare no conflict of interest.

References

  1. Drenthe, N.T. Small Orbital Launch Systems, a Tentative Initial Cost Estimation. PhD Thesis, Delft University of Technology, Holland, 2016. [Google Scholar]
  2. Koelle, D.E. Handbook of Cost Engineering and Design of Space Transportation System, Revision 4b; TCS-TransCostSystems: Ottobrunn, Germany, 2000. [Google Scholar]
  3. Lee, H.; Olds, J.; Lee, H.; Olds, J. Integration of Cost Modeling and Business Simulation into Conceptual Launch Vehicle Design. In Proceedings of the Defense and Space Programs Conference and Exhibit—Critical Defense and Space Programs for the Future, Huntsville, AL, USA, 23–25 September 1997. [Google Scholar]
  4. McAfee, J.; Culver, G.; Naderi, M. NASA Air Force Cost Model (NAFCOM): Capabilities and Results. In Proceedings of the JANNAF 8th Modeling and Simulation Subcommittee Meeting, Huntsville, AL, USA, 5–9 December 2011. No. M11-1278. [Google Scholar]
  5. Qin, X.U. Launch Cost Analysis and Optimization Based on Analysis of Space System Characteristics. Trans. Jpn. Soc. Aeronaut. Space Sci. 2013, 62, 175–184. [Google Scholar]
  6. Stappert, S.; Wilken, J.; Calabuig, G.J.D.; Sippel, M. Evaluation of parametric cost estimation in the preliminary design phase of reusable launch vehicles. In Proceedings of the 9th Conference on Aeronautics and Space Sciences (EUCASS), Lille, France, 1–27 June 2022. [Google Scholar]
  7. Watson, M.D.; Neeley, J.R.; Blackburn, R.F. Launch Vehicle Production and Operations Cost Metrics. In Proceedings of the SpaceOps 2014 Conference, American Institute of Aeronautics and Astronautics, Pasadena, CA, USA, 5–9 May 2014. [Google Scholar]
  8. Zapata, E.; Rhodes, R.; Robinson, J.; Levack, D.; Donahue, B. Space Transportation System Life Cycle Cost Assessment and Control. In Proceedings of the 44th AIAA/ASME/SAE/ASEE Joint Propulsion Conference & Exhibit, Hartford, CT, USA, 21–23 July 2008. [Google Scholar]
  9. Vance, A. Elon Musk: Tesla, SpaceX, and the Quest for a Fantastic Future; HarperCollins: New York, NY, USA, 2015. [Google Scholar]
  10. Ballard, R.; Olive, T. Development status of the NASA MC-1 (Fastrac) engine. In Proceedings of the 36th AIAA/ASME/SAE/ASEE Joint Propulsion Conference and Exhibit, Huntsville, AL, USA, 16–19 July 2000; p. 3898. [Google Scholar]
  11. Christensen, E.; Nesman, T. Fastrac Rocket Engine Combustion Chamber Acoustic Cavities; NASA Marshall Space Flight Center: Huntsville, AL, USA, 1998. [Google Scholar]
  12. Dennis, J.H.; Sanders, T. NASA Fastrac engine gas generator component test program and results. In Proceedings of the 36th AIAA/ASME/SAE/ASEE Joint Propulsion Conference and Exhibit, Huntsville, AL, USA, 16–19 July 2000; p. 3401. [Google Scholar]
  13. Seedhouse, E. SpaceX: Making Commercial Spaceflight a Reality; Springer: Berlin/Heidelberg, Germany, 2013. [Google Scholar]
  14. Dreyer, L. System Engineering: A Traditional Discipline in a Non-Traditional Organization; SpaceX: Hawthorne, CA, USA, 2012. [Google Scholar]
  15. Kulu, E. Small Launchers-2021 Industry Survey and Market Analysis. In Proceedings of the 72nd International Aeronautical Congress, Dubai, United Arab Emirates, 25–29 October 2021. [Google Scholar]
  16. Niederstrasser, C. A Small Launch Per Month? 2022 Edition of the Annual Industry Survey. In Proceedings of the 36th Annual AIAA/USU Conference on Small Satellites, Salt Lake City, UT, USA, 6–11 August 2022. [Google Scholar]
Figure 1. RoTMoS and MBSE architecture.
Engproc 90 00098 g001
Table 1. SOLSTICE and TRANSCOST LVDC parameters.
FactorDescriptionValues
f1Technical Development correlation factor1.3–1.4 First-generation, new concept, new tech.
1.1–1.2 New design with some new technical/operational features.
0.9–1.1 Standard project, state of the art.
0.6–0.8 Design modification of existing systems.
0.3–0.5 Variation of an existing project.
f3Team Experience factor1.3–1.4 New team, no relevant direct company experience.
1.1–1.2 Partially new project activities for the team.
1.0 Company/Industry team with some related experience.
0.8–0.9 Team has carried out similar projects.
0.7–0.8 Team has extensive experience with this type of project.
f8Country Productivity correction factor1.0 USA (reference)
0.86 Europe
0.73 Spain
0.79 France
0.73 Germany
1.49 Russia
1.2 China
a,bSOLSTICE regression factors(see reference [1])
TRLTechnology Readiness Level1–9
STHSystems Test Hardware factor3.1 (Protoflight Model Approach according to SOLSTICE method)
nNumber of equal components
pLearning Factor0.85 for structure and 0.9 for systems, except Engine
M&Pa%Management & Product Assurance10%
SmSubcontracting decrease scaling factor2.85
CpProfit Retention factor0.97
Table 2. Falcon 1 Development Cost estimation results.
ElementLVDC 1
[Million EUR]
LVDC 2
[Million EUR]
LVDC 3
[Million EUR]
Fairing & Adapter7.07.09.9
Stage 2 Integration0.50.51.2
Stage 2 & Avionics17.117.130.9
Engine Stage 22.62.68.3
Stage 1 Integration0.80.82.0
Stage 125.232.926.9
Engine Stage 210.510.536.3
TOTAL DEV (1)63.771.6115.6
3 Additional Launchers (2)19.824.026.1
TOTAL (1+2)83.4 (ref)95.6 (+15%)141.8 (+70%)
Table 3. Falcon 1 Operational Cost estimation results.
ElementLVOC 1
[Million EUR]
LVOC 2
[Million EUR]
LVOC 3
[Million EUR]
Direct Operational Cost0.90.951.4
Indirect Operational Cost2.02.02.0
Launcher Production Cost4.83.66.3
COST PER FLIGHT7.76.69.7
Development Cost Amortization0.00.01.1
Nominal Profit0.00.00.5
PRICE PER FLIGHT7.7 (ref)6.6 (–14%)11.4 (+48%)
Cost per Max Payload (600 kg)0.01280.0110.019
Disclaimer/Publisher’s Note: The statements, opinions and data contained in all publications are solely those of the individual author(s) and contributor(s) and not of MDPI and/or the editor(s). MDPI and/or the editor(s) disclaim responsibility for any injury to people or property resulting from any ideas, methods, instructions or products referred to in the content.

