Proceeding Paper

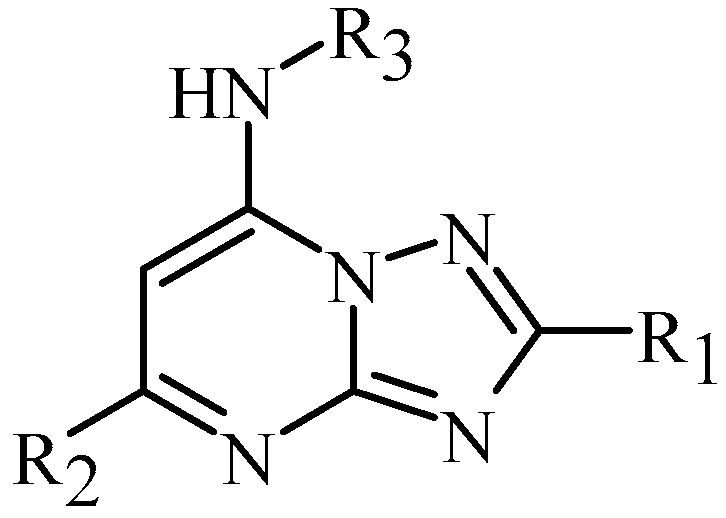
Modeling the Quantitative Structure–Activity Relationships of 1,2,4-Triazolo[1,5-a]pyrimidin-7-amine Analogs in the Inhibition of Plasmodium falciparum †

by
Inalegwu S. Apeh
1,2,
Thecla O. Ayoka
3,
Charles O. Nnadi
1,4,* and
Wilfred O. Obonga
1
1
Department of Pharmaceutical and Medicinal Chemistry, Faculty of Pharmaceutical Sciences, University of Nigeria, Nsukka 410001, Enugu, Nigeria
2
Department of Pharmacy, Benue State Hospitals Management Board, Otukpo 972261, Benue, Nigeria
3
Department of Science Laboratory Technology (Biochemistry Unit), Faculty of Physical Sciences, University of Nigeria, Nsukka 410001, Enugu, Nigeria
4
Department of Pharmaceutical Chemistry, Faculty of Pharmacy, Madonna University, Elele 512101, Rivers, Nigeria
*
Author to whom correspondence should be addressed.
Presented at The 5th International Electronic Conference on Applied Sciences: Part of the International Electronic Conference on Applied Sciences Series, Online, 4–6 December 2024. Available on https://sciforum.net/paper/view/20781.
Eng. Proc. 2025, 87(1), 52; https://doi.org/10.3390/engproc2025087052
Published: 21 April 2025

Abstract

:
Triazolopyrimidine and its analogs represent an important scaffold in medicinal chemistry research. The heterocycle of 1,2,4-triazolo[1,5-a] pyrimidine (1,2,4-TAP) serves as a bioisostere candidate for purine scaffolds, N-acetylated lysine, and carboxylic acid. This study modeled the quantitative structure–activity relationship (QSAR) of 125 congeners of 1,2,4-TAP from the ChEMBL database in the inhibition of Plasmodium falciparum using six machine learning algorithms. The most significant features among 306 molecular descriptors, including one molecular outlier, were selected using recursive feature elimination. A ratio of 20% was used to split the x- and y-matrices into 99 training and 24 test compounds. The regression models were built using machine learning sci-kit-learn algorithms (multiple linear regression (MLR), k-nearest neighbours (kNN), support vector regressor (SVR), random forest regressor (RFR) RIDGE regression, and LASSO). Model performance was evaluated using the coefficient of determination (R2), mean squared error (MSE), mean absolute error (MAE), root mean squared error (RMSE), p-values, F-statistic, and variance inflation factor (VIF). Five significant variables were considered in constructing the model (p < 0.05) with the following regression equation: pIC50 = 5.90 − 0.71npr1 − 1.52pmi3 + 0.88slogP − 0.57vsurf-CW2 + 1.11vsurf-W2. On five-fold cross-validation, three algorithms—kNN (MSE = 0.46, R2 = 0.54, MAE = 0.54, RMSE = 0.68), SVR (MSE = 0.33, R2 = 0.67, MAE = 0.46, RMSE = 0.57), and RFR (MSE = 0.43, R2 = 0.58, MAE = 0.51, RMSE = 0.66)—showed strong robustness, efficiency, and reliability in predicting the pIC50 of 1,2,4-triazolo[1,5-a]pyrimidine. The models provided useful data on the functionalities necessary for developing more potent 1,2,4-TAP analogs as anti-malarial agents.

1. Introduction

Malaria infection, caused by Plasmodium falciparum parasite, is continuously threatening the life of millions of people in sub-Saharan Africa who bear the largest burden of malaria globally [1]. Several measures such as chemotherapy, vaccine development and environmental (insecticide-treated mosquito nets and indoor residual spraying) interventions have been deployed to prevent or treat malaria—some of which have faced numerous challenges [2]. Sub-Saharan Africa, being the epicenter of malaria, is likely to be the nucleus of the emergence and spread of antimalarial drug resistance, malaria treatment failures, and recurrence (recrudescence or relapse) of malaria infection [3]. This calls for a clear need to adopt machine learning (ML) models to predict the antimalarial activity of compounds and optimize the available ones for better alternatives.
The quantitative structure–activity relationship (QSAR) represents a ligand-based approach to drug design based on regression modeling of features with interested endpoints [4,5]. The flexibility of the hybrid, in addition to its congenericity, provides the necessary hypothesis required to develop a robust, reliable, accurate, and efficient QSAR model that provides insights into the single-target mechanism of action, activity of untested congeners, and design of probably more potent molecules [6,7]. In this study, the congruency of the dataset was unknown; however, a significant range of potency, 4.0 ≤ pIC50 ≤ 8.0, of the endpoint data was used, representing 4.0 log units of the anti-malarial activity. The dataset comprises three chemical categories of triazolopyrimidines. The first category represents the chloro-, methyl- or ethyl-substituted triazolopyrimidines at position 5, which accounted for the least functional diversity in the dataset. The second group represents compounds with 31 different chemical substitutions at position 2 of the hybrid, while the largest congeners of compounds represent substituted phenyl at the 7-amino group of the hybrid.
Triazolopyrimidine represents an important scaffold in medicinal chemistry drug research, combining the dual functionality of triazoles and pyrimidines as well as the multiple isomeric potential [8]. Apart from its antiprotozoal activity potential, several other activities such as antibacterial, antihypertensive, anti-tuberculosis, antifungal, herbicidal, anti-inflammatory, and antitumor have also been attributed to this pharmacophore [9,10]. The majority of the triazolopyrimidines known today have been synthetically obtained [9]. However, essramycin isolated from Streptomyces species has remained one of the few existing naturally occurring 1,2,4-triazolo[1,5-a]pyrimidine (1,2,4-TAP) antibiotics, leaving semi-synthetic as the major source of antiplasmodial 1,2,4-TAP agents [11]. Importantly, the 1,2,4-TAP analogs are unique due to the presence of the heterocyclic ring as a bioisostere candidate of purine scaffolds, carboxylic acid, and N-acetylated lysine [8,12]. Against these backdrops, the study modeled the QSAR of 125 derivatives of 1,2,4-TAP using 306 molecular features. These features represent the different functionalities that provide necessary insights into the mechanism of antiplasmodial activity and guide synthetic chemistry in harnessing and deploying the predictive potential of machine learning-based modeling.

2. Methods

2.1. Computational Tools

Scikit-learn, pandas, numpy, matplotlib, and seaborn were the Python (v.3.9) libraries used.

2.2. Dataset

The dataset, obtained from the ChEMBL database, was made up of 125 molecules of the 1,2,4-TAP, with their corresponding endpoints (pIC50) values tested against P. falciparum [13]. The 306 molecular features of the compounds were obtained from the Padel 3.3.0 software representing both 2D and 3D descriptors [14]. The chemical dataset used for this study consisted of 125 1,2,4-TAP analogs substituted at positions 2, 5, and 7-NH2 (Figure 1).

2.3. Preparation of Dataset

The dataset consists of 124 molecules and 306 variables, with no duplicates or missing values. Exploratory data analysis was conducted to determine relationships among variables, and scatter plots were created to visualize trends. Outliers were removed, and the pIC50 column was designated as the target variable. The X-matrix was standardized using the StandardScaler function in Python (v.3.9) libraries [15].

2.4. Selecting Significant Variables

Recursive feature elimination (RFE) was employed to automatically eliminate insignificant molecular features. The linear regression function from Scikit-learn was utilized for the RFE process. To construct the model, the number of features was set to 11, following the condition that m is greater than n2, where m and n represent the numbers of molecules and features, respectively [7]. Features identified as ‘True’ were selected for inclusion. The Statsmodels library was then applied to generate the model statistics. Only features with p < 0.05 were deemed significant and retained for the model [15]. Additionally, the variance inflation factor (VIF) was calculated, and only features within the acceptable VIF range were included.

2.5. Data Split

The coordinate matrices were divided into training and test datasets of 99 and 25 molecules, respectively, based on a ratio of 80:20 [6,7]. Each of the datasets was represented as X-train and Y-train. The model was developed using the fit method on the training set, whereas the test set, consisting of 25 molecules, was utilized to validate the models. Hyper-parameters were optimized using the test dataset to identify the optimal configuration [7]. A random search method was employed for this purpose, as the hyper-parameters were continuous.

2.6. Residual Analysis of the Model

Residual analysis of the error terms was conducted to verify their adherence to a normal distribution. A histogram of the error terms was plotted for this purpose. Ensuring normal distribution is a fundamental assumption of multiple linear regression [7,15].

2.7. Building Regression Models

Six machine learning algorithms from the Scikit-learn library—multiple linear regression (MLR), k-nearest neighbors (kNN), support vector regressor (SVR), random forest regressor (RFR), RIDGE regression, and LASSO—were utilized to model the relationship between the actual and predicted pIC50 values of the molecules [7].

2.8. Evaluation of Model

Various evaluation parameters, including the explained variance ratio (R²), the mean squared deviation or error (MSE), the mean absolute deviation or error (MAE), and the root mean squared deviation or error (RMSE) were employed to evaluate the models’ performance. Additionally, p-values, the F-statistic, and the variance inflation factor (VIF) were utilized in the analysis [7].

3. Results and Discussion

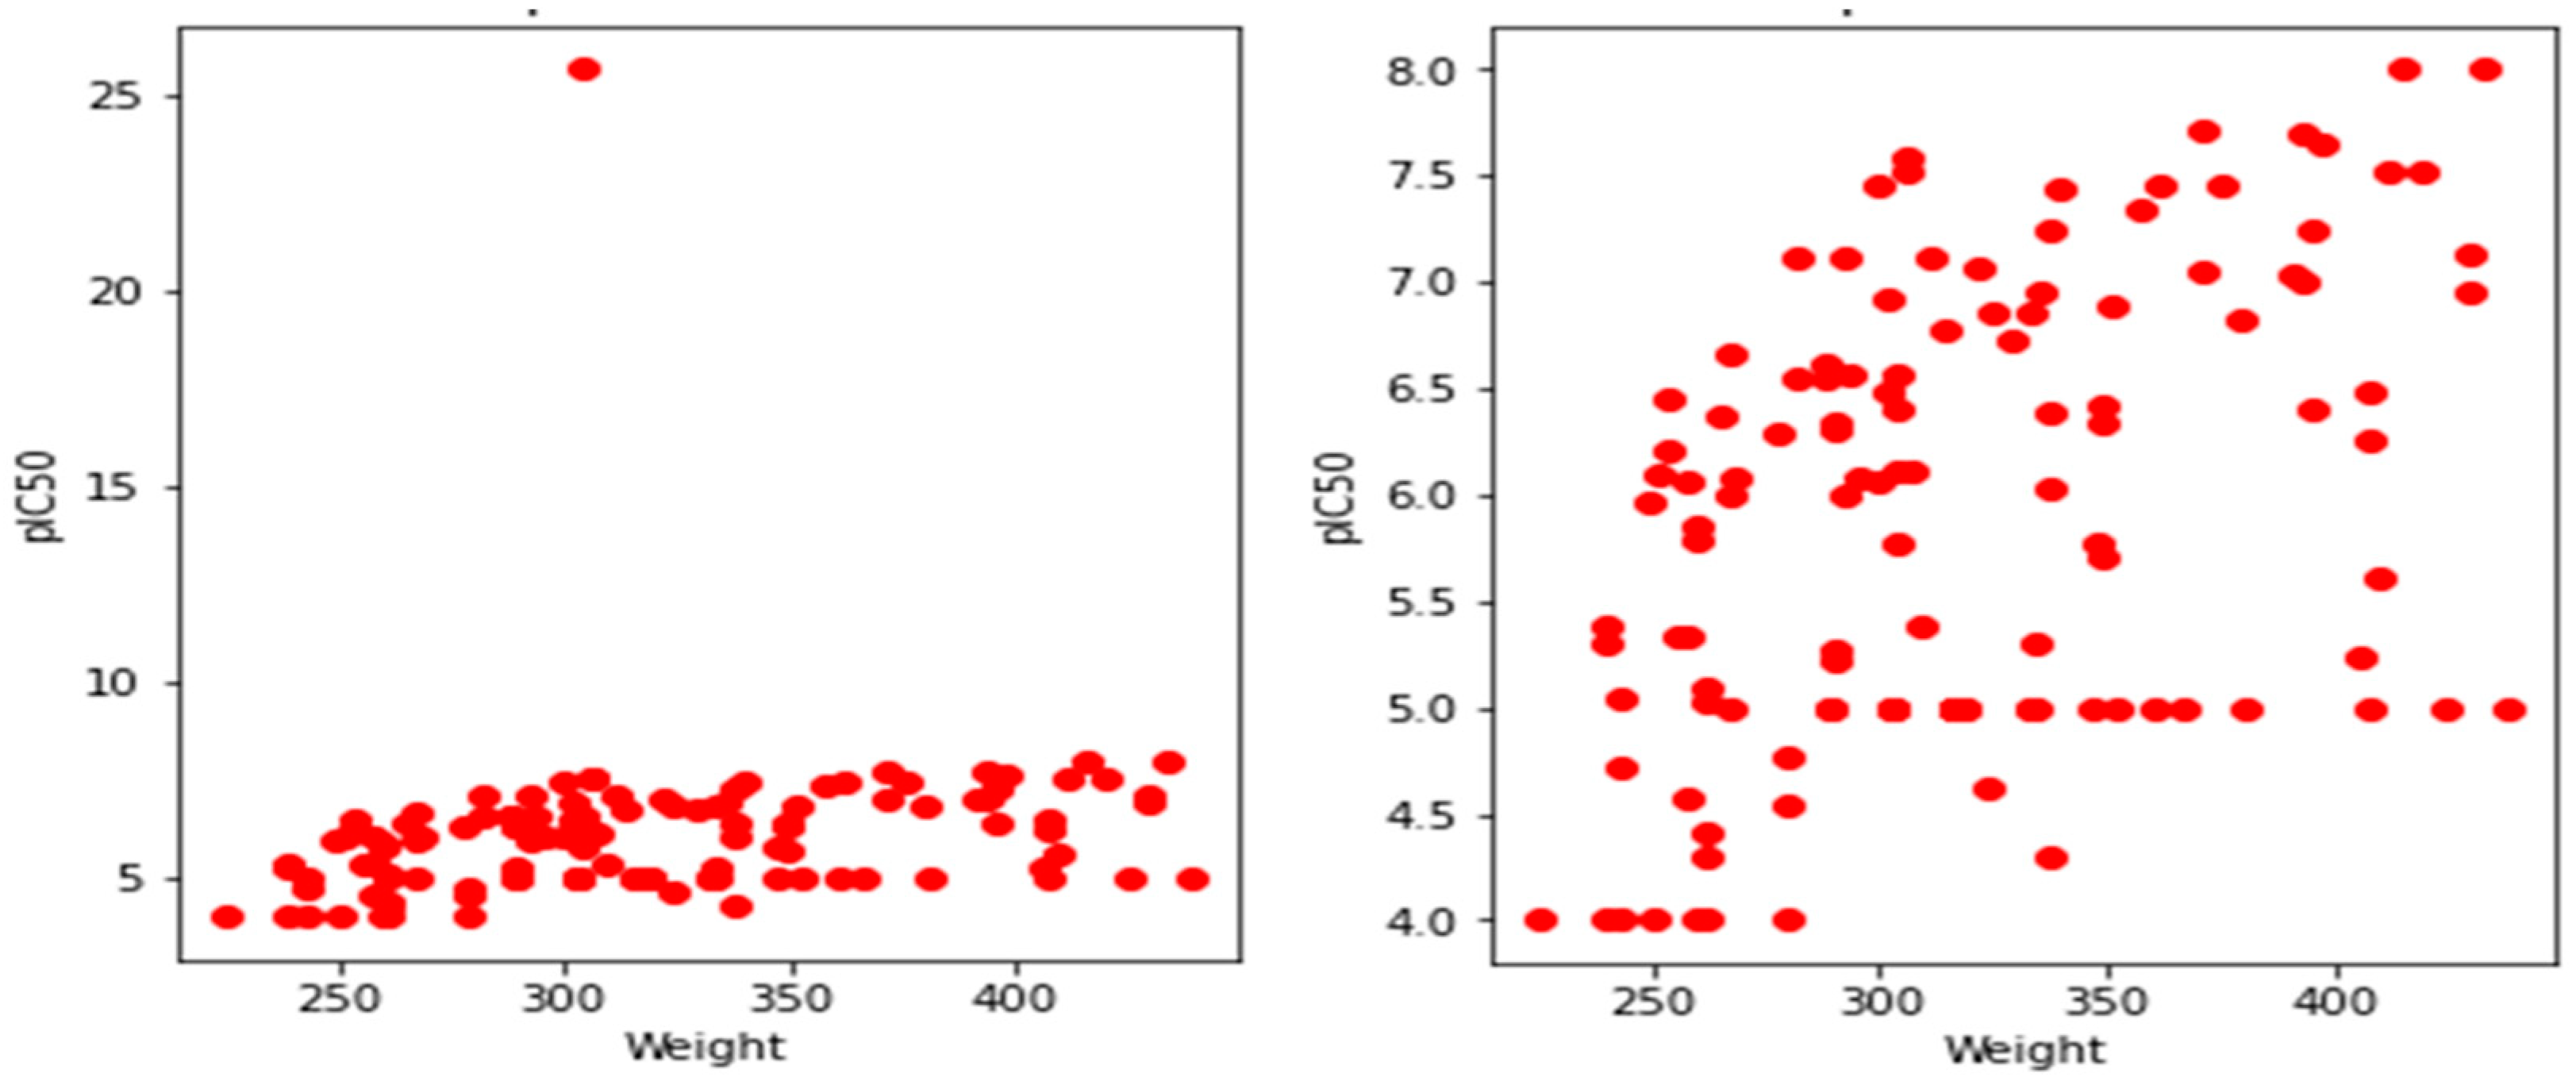
3.1. Exploratory Data Analysis

The scatter plots between the target variable (pIC50) and other variables (molecular features) to visualize the trends in the dataset showed constituency in the patterns between the target variable and other variables of the dataset (Figure 2). An outlier was detected and removed.

3.2. Feature Selection Using RFE

Following the RFE analysis, the number of significant variables selected for constructing the model was set to 11. The variables npr1, PEOE_VSA_FHYD, PEOE_VSA_FPNEG, PEOE_VSA_FPOL, PEOE_VSA_FPPOS, pmi3, Q_VSA_FNEG, Q_VSA_FPOS, slogP, vsurf_CW2 and vsurf_W2 were selected by RFE and are ranked ‘True’. They were, therefore, considered significant for the model. The Statsmodels function was subsequently utilized to examine the model statistics and provide their summary based on the selected variables using the RFE. Variables with p ˂ 0.05 were considered significant for the machine learning (ML) modeling of the QSAR. The significant variables were npr1, pmi3, slogP, vsurf_CW2 and vsurf_W2. The summary of the Statsmodel is represented in Table 1.

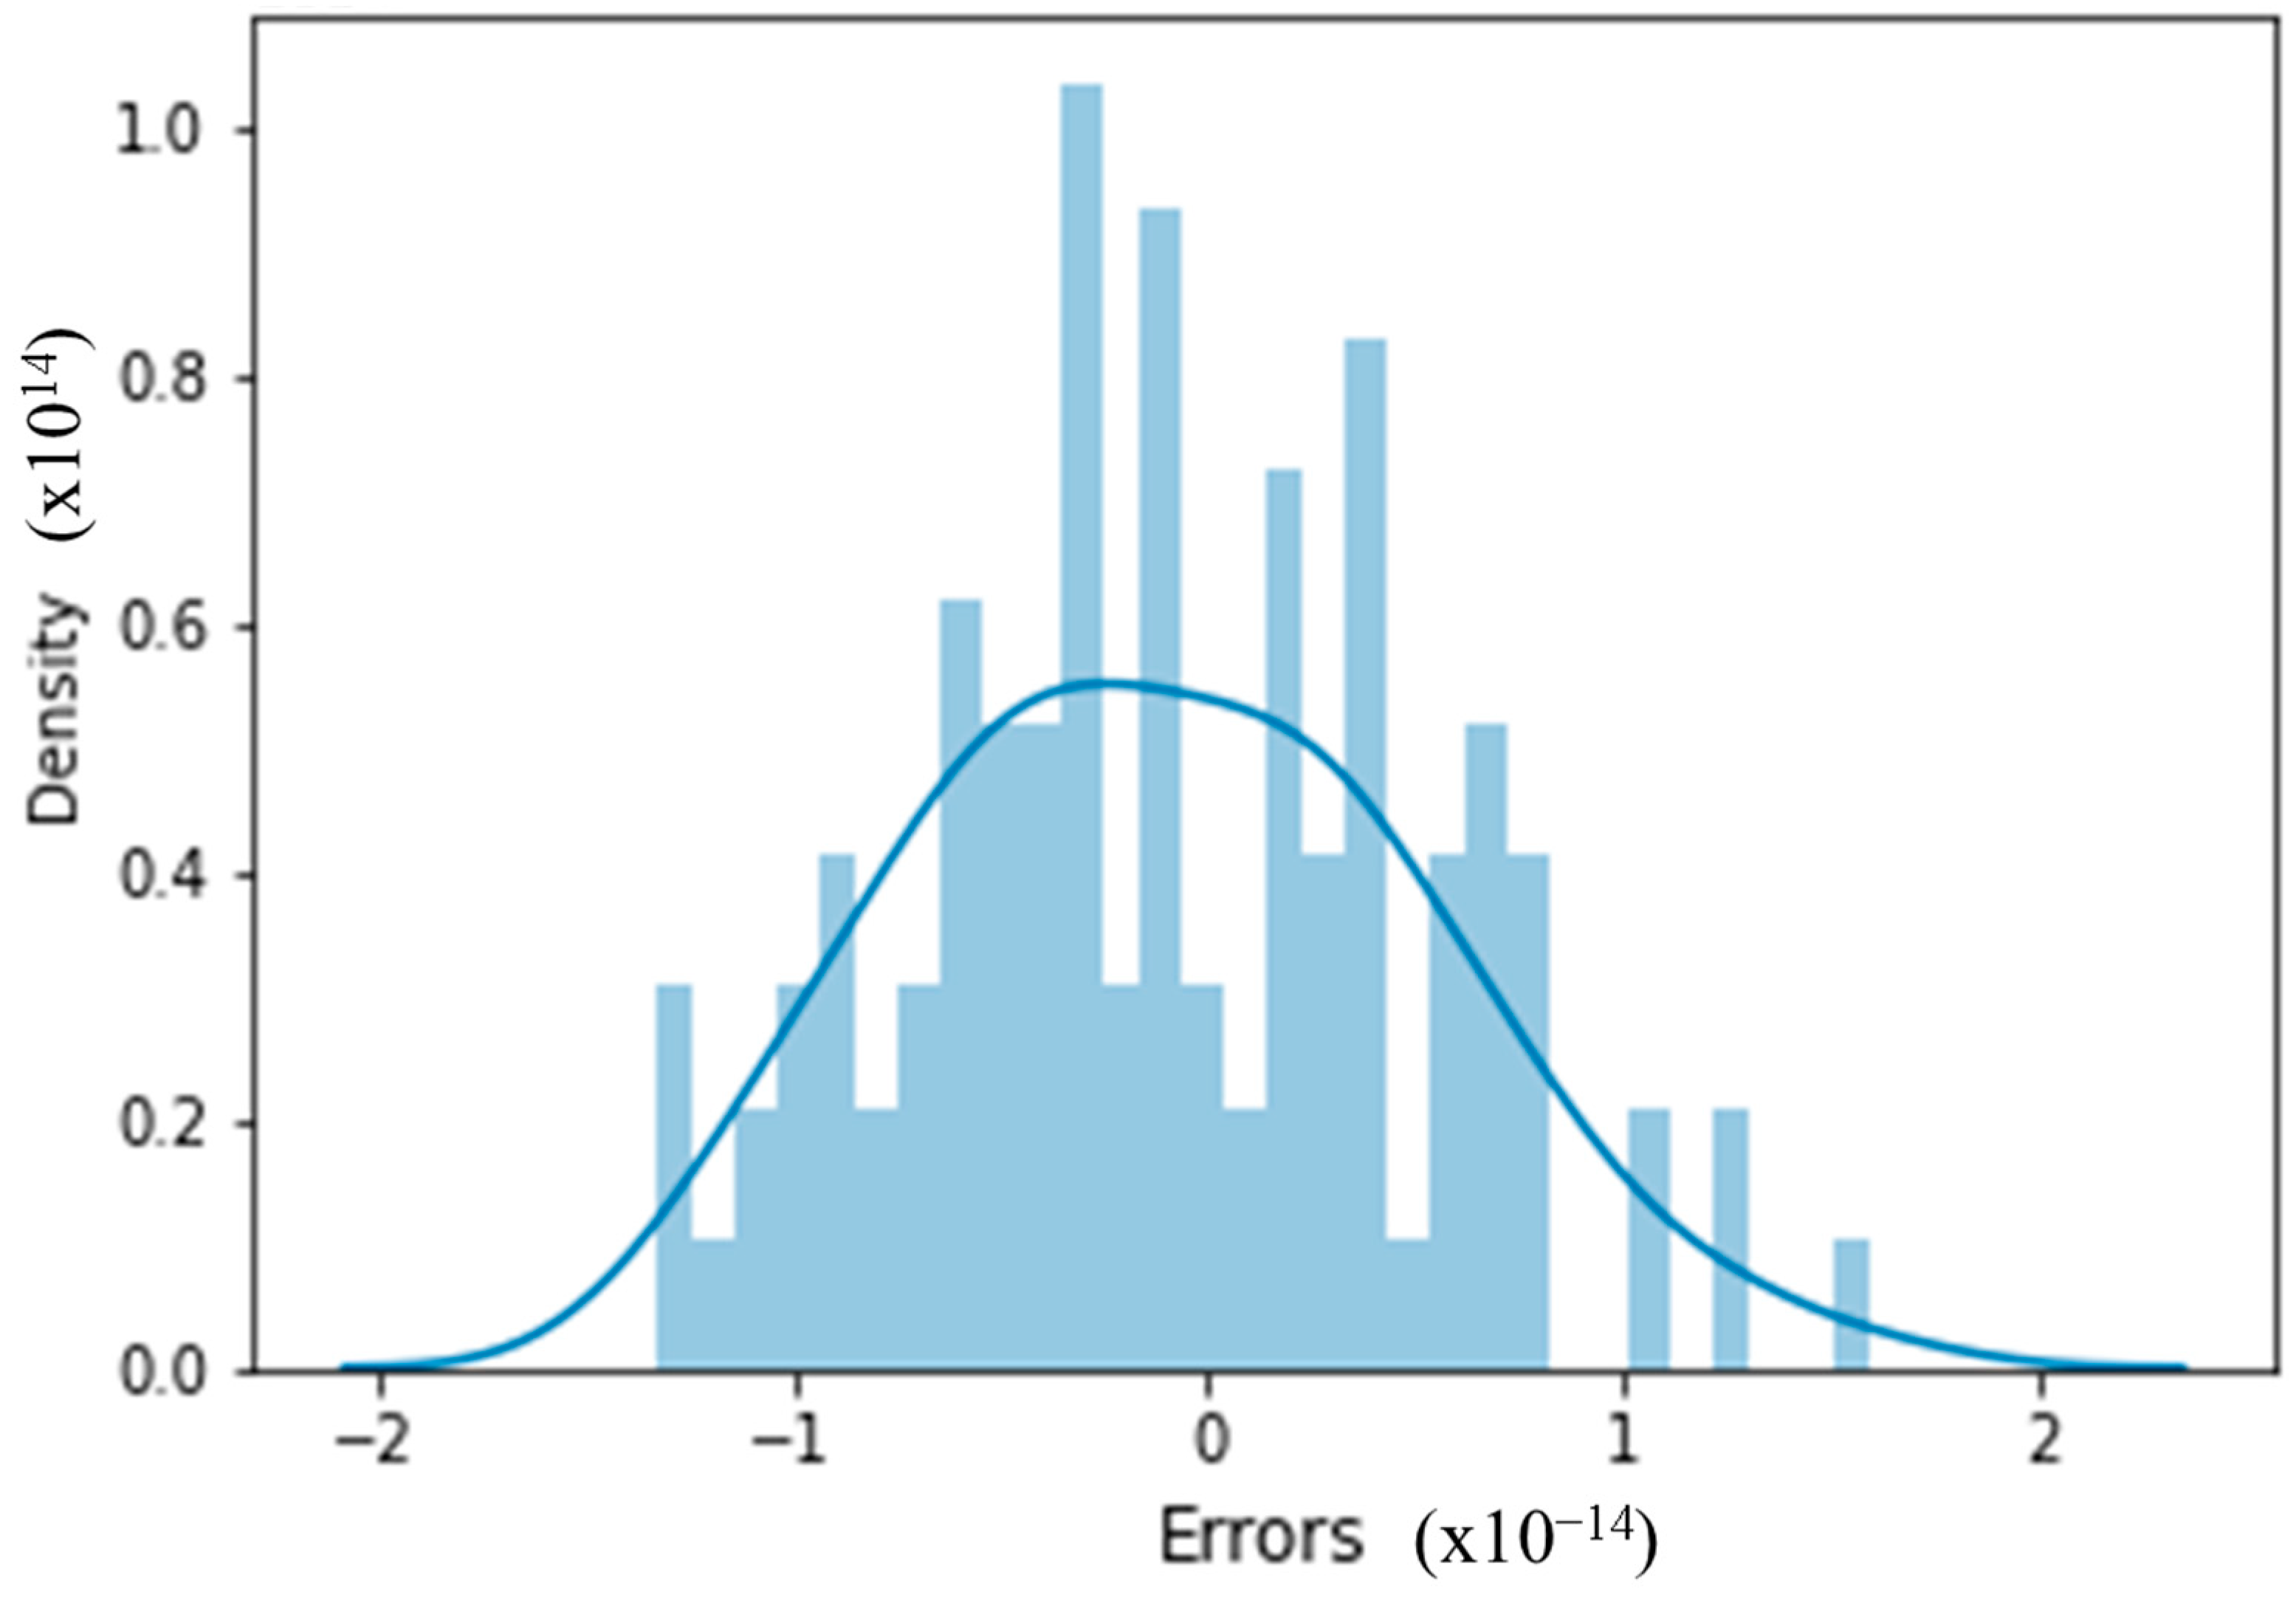
3.3. Model Residual Analysis

A histogram of the model’s error terms was plotted (Figure 3), revealing a normal distribution curve. Normal distribution is a key assumption of multiple linear regression. Given that the error terms follow a normal distribution, the model is suitable for making predictions on the test dataset.

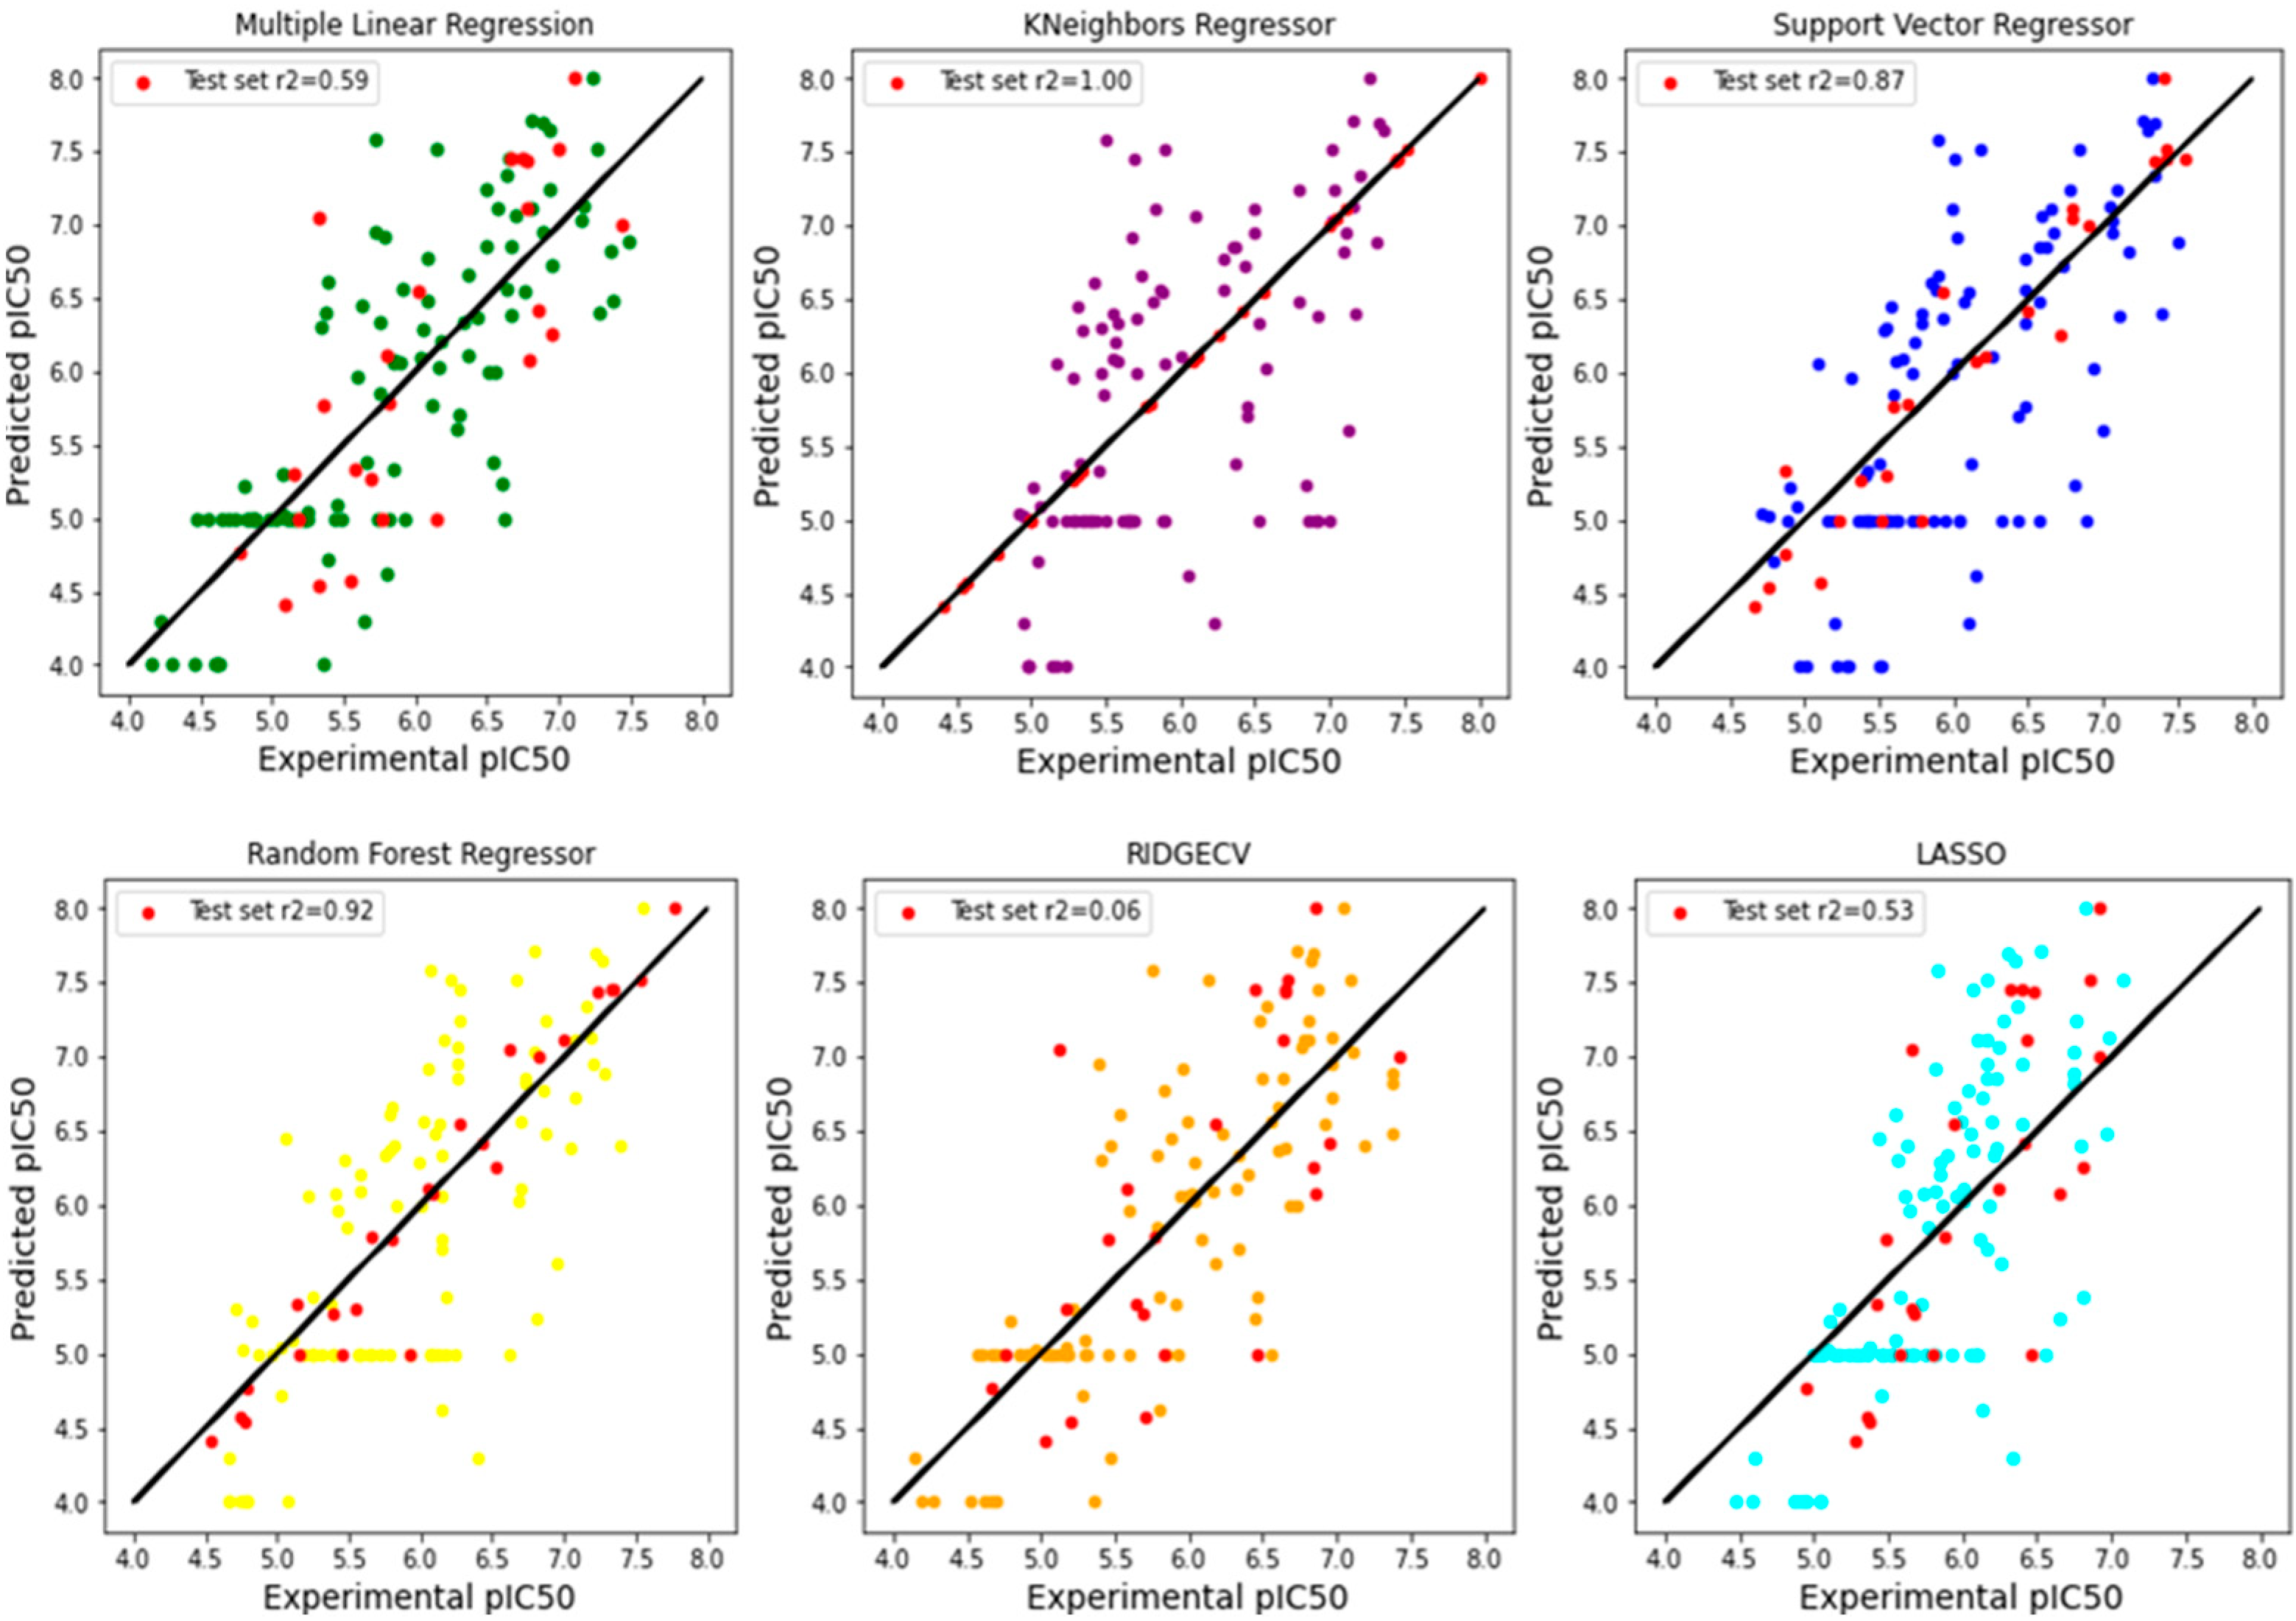
3.4. Building Models with ML Algorithms

ML-based algorithms were developed using the significant variables to predict the pIC50 test molecules. Table 1 presents the predicted pIC50 for the test compounds. To validate the accuracy of these predictions, the theoretical pIC50 was plotted against the experimental pIC50 for both datasets, utilizing various ML algorithms (Figure 4). The close alignment between the predicted and experimental pIC50 scores demonstrates the robustness and reliability of the machine learning models. The correlations between the predicted and experimental pIC50 are also illustrated in Figure 4. Additionally, the R² value highlights the degree to which the data align with the regression line and the effectiveness of the model fit. The regression equation is pIC50 = 5.90 − 0.71npr1 − 1.52pmi3 + 0.88slogP − 0.57vsurf-CW2 + 1.11vsurf-W2.

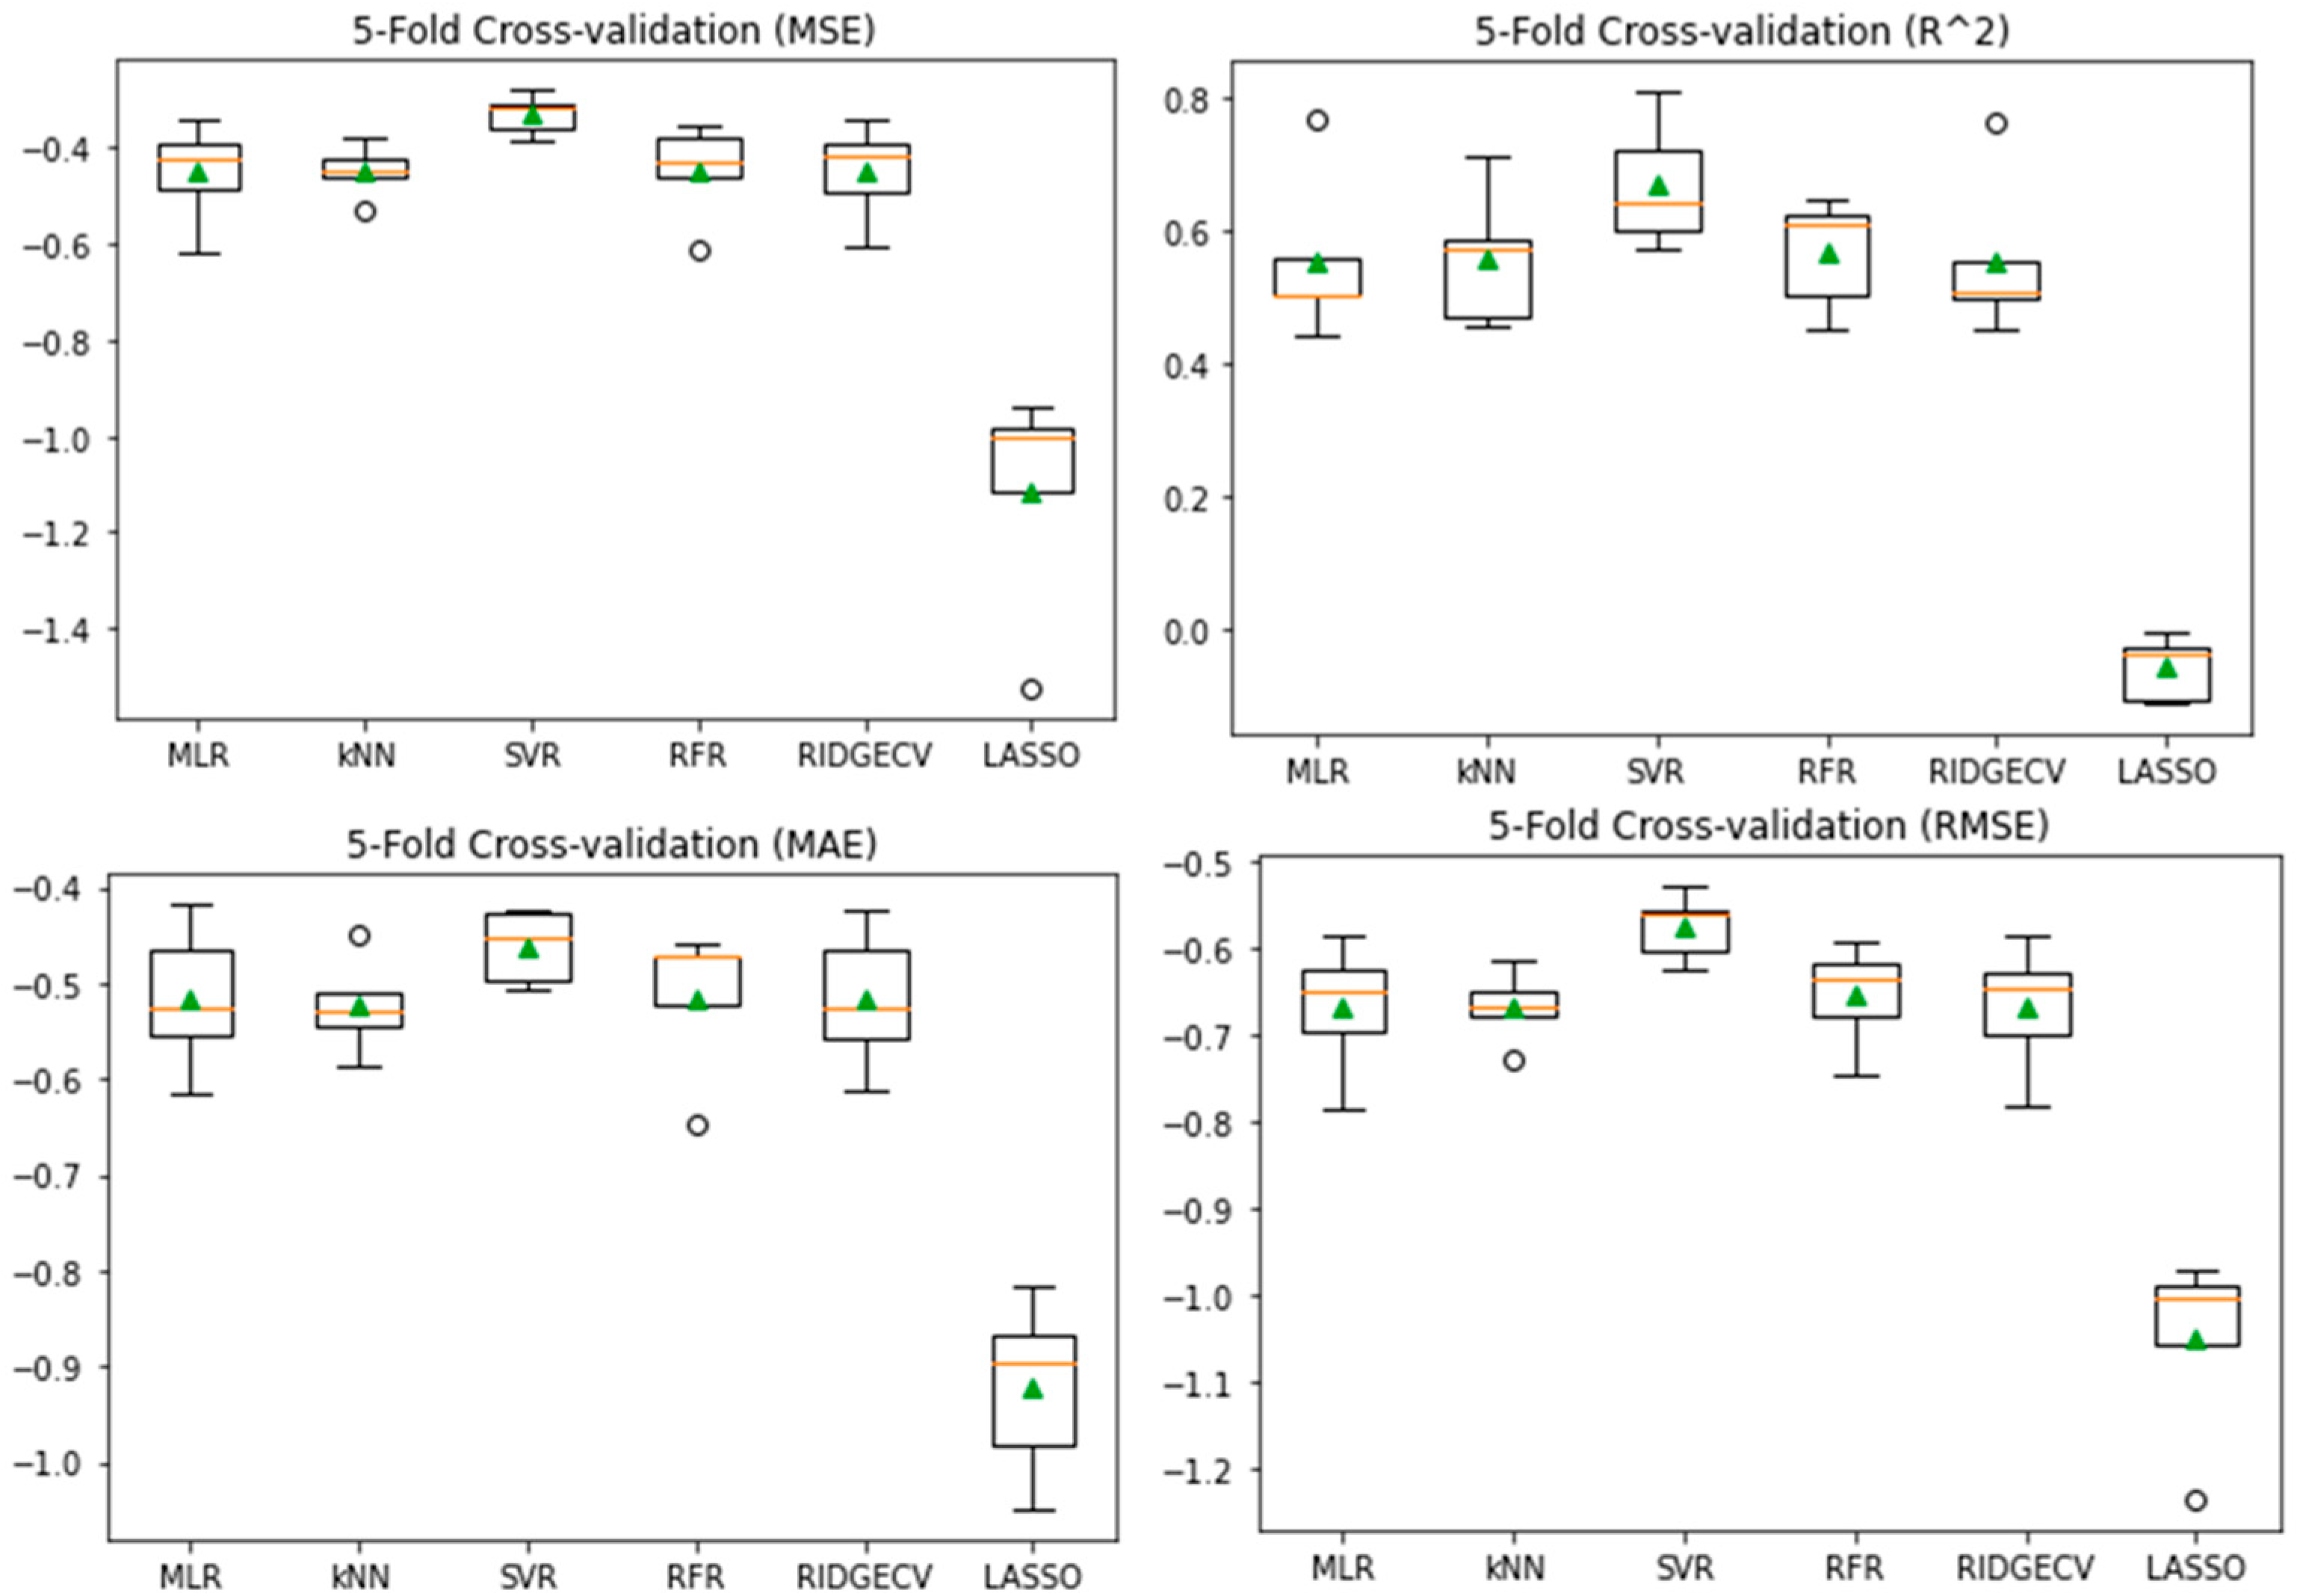
3.5. Model Evaluation and Comparison

The performance summary of the models is presented in Table 2. Five-fold cross-validation (five-fold CV) was performed to compute the performance metrics. The cross-validation scores for the models were visualized using a boxplot to facilitate a comparison of their performance (Figure 5). Each model’s performance metrics were represented as a box. Based on the five-fold cross-validation results, SVR demonstrated a better performance in comparison to the other models, with its median line consistently higher across all evaluated metrics (Figure 5).

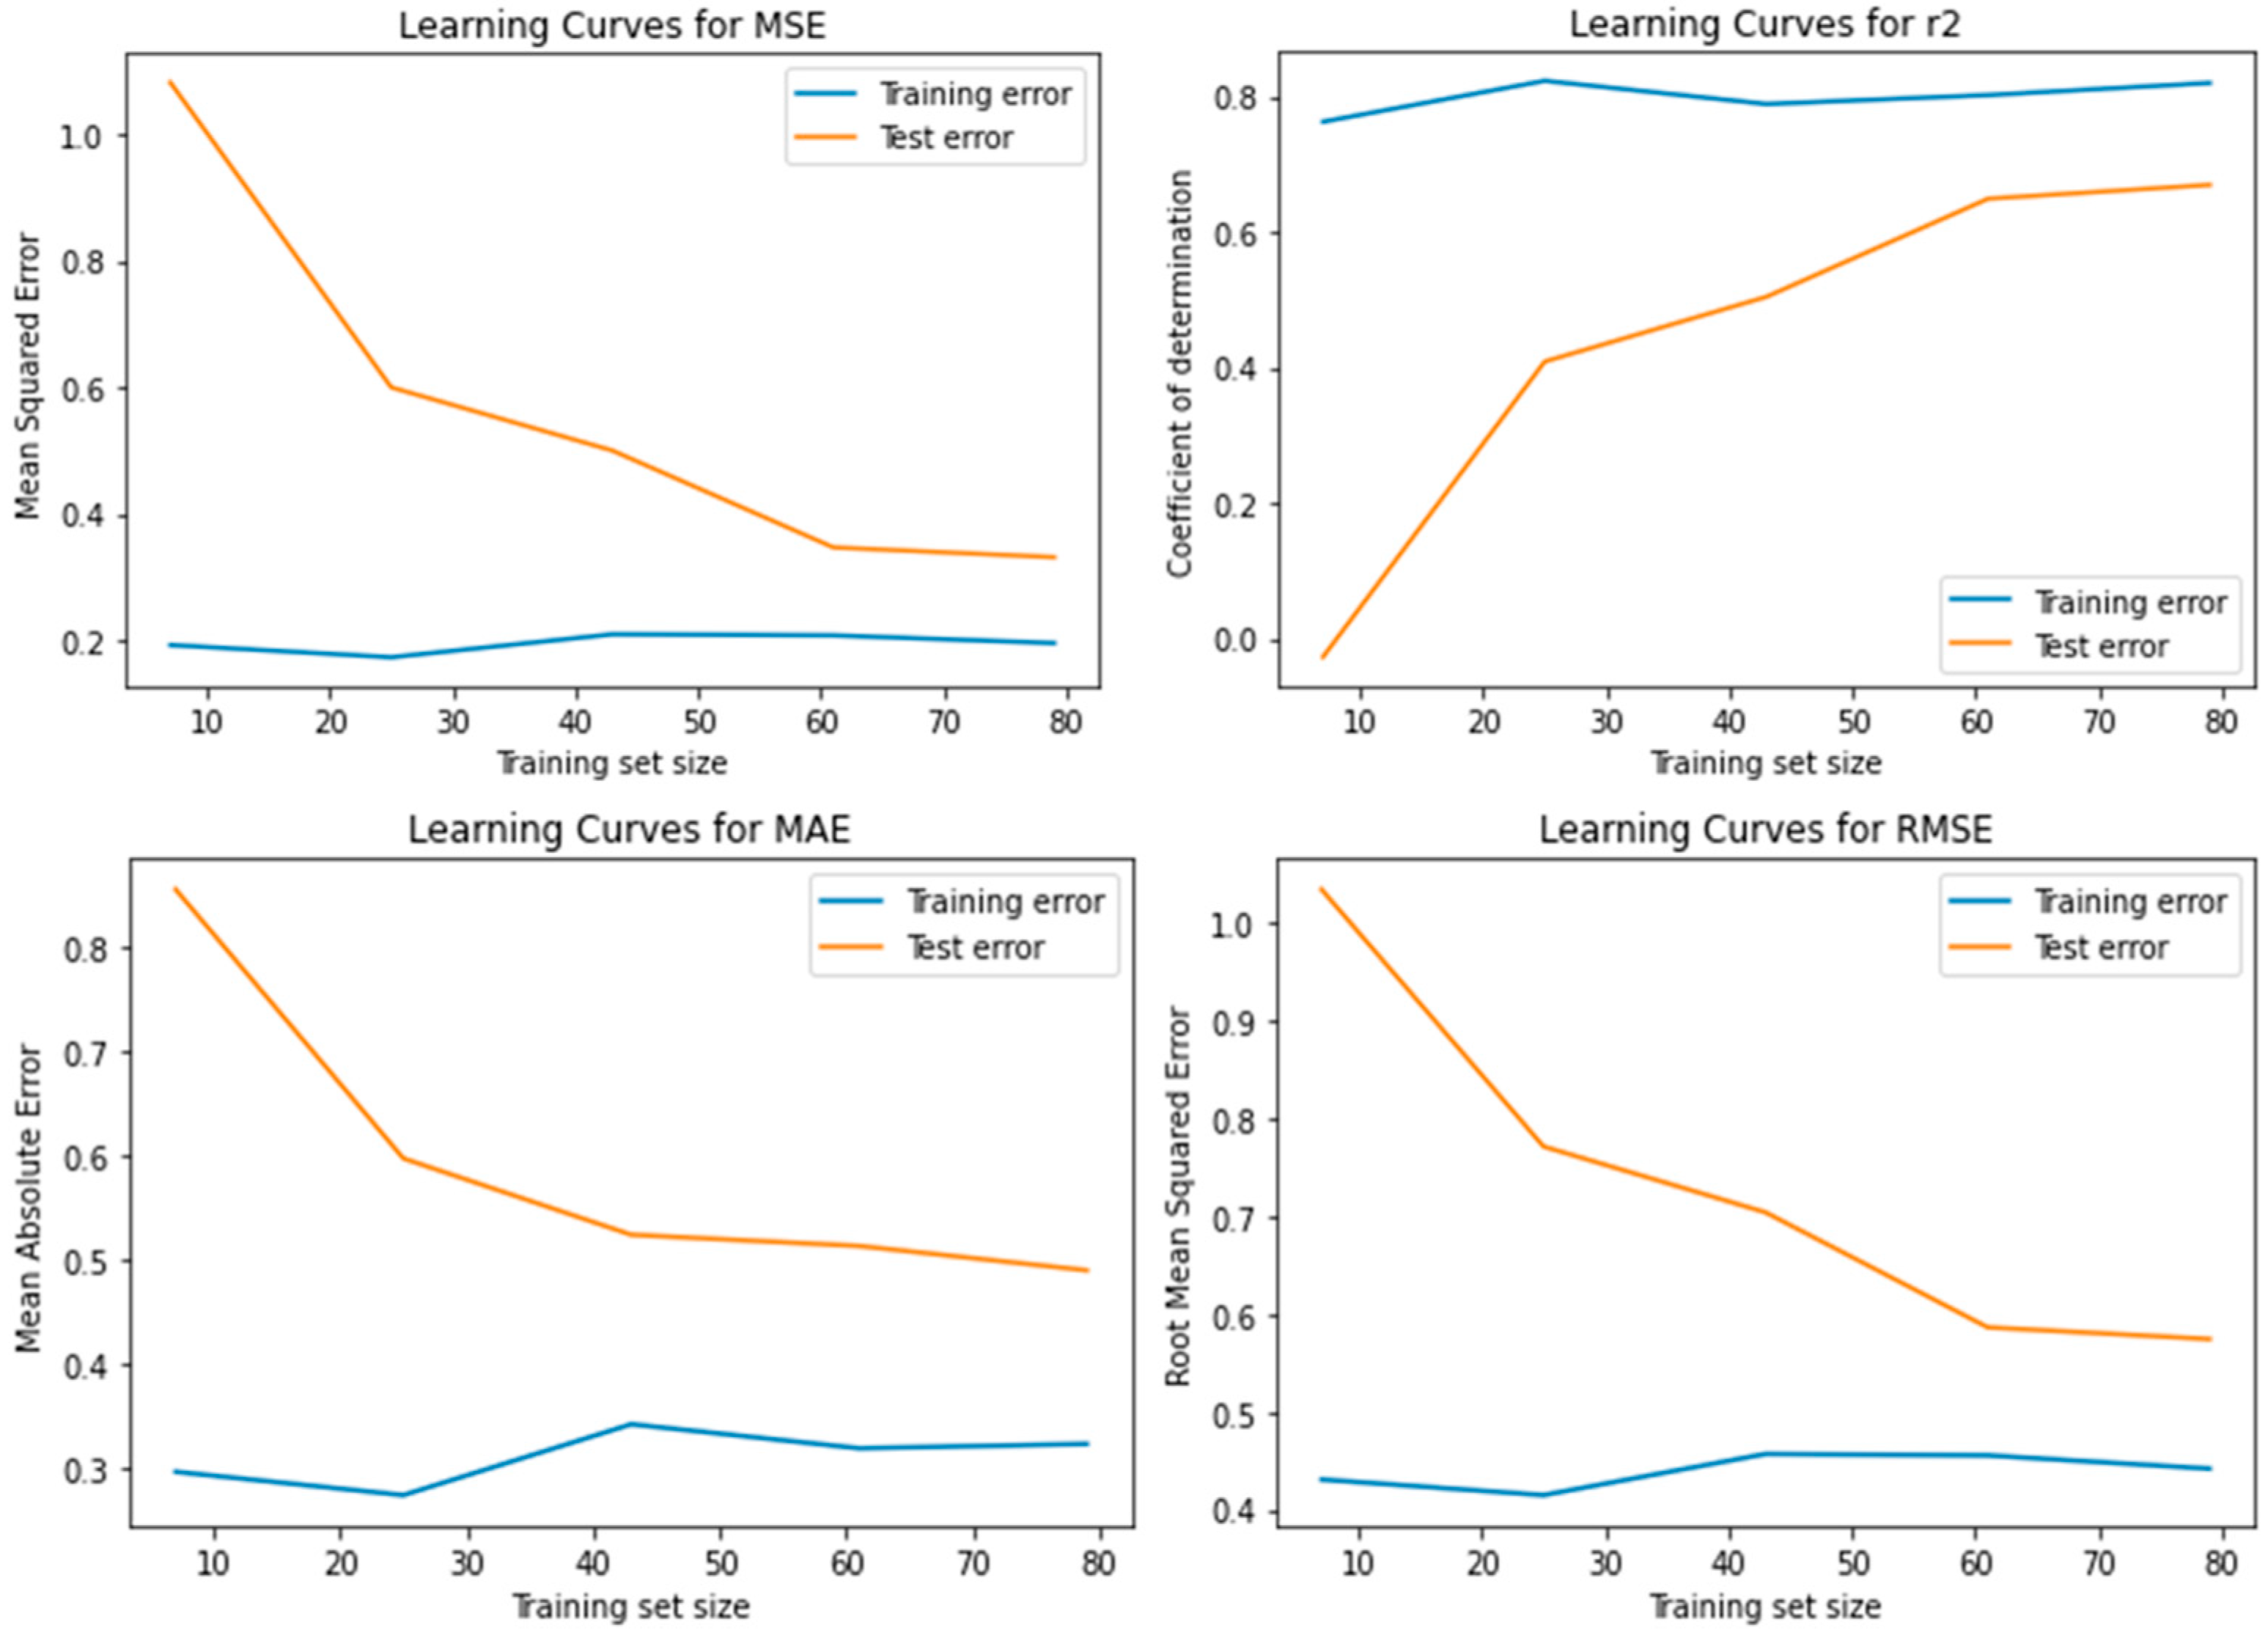
3.6. Learning Curves for Model Evaluation

The size of the training dataset is directly linked to the effectiveness of the learning algorithm. Given that the SVR algorithm achieved the best performance in the final test, its learning curves were analyzed (Figure 6). The line graphs illustrated the learning curves for SVR models trained using training sizes of 10, 20, 40, 60, 80, and 99 on the datasets. The training size corresponds to the size of the training dataset. The method of five-fold cross-validation was used. Figure 6 illustrates the variations in model performance and accuracy between the training and test datasets as the dataset size increased. The learning curve analysis revealed a consistent trend across all four metrics: as the volume of data grew, the model’s performance on the test dataset showed steady improvement.
The study evaluated QSAR models to predict the antimalarial activity of 125 congeners of 1,2,4-TAP against P. falciparum. Six machine learning algorithms were assessed for predictive accuracy, interpretability, and robustness. SVR was the best-performing model, while LASSO had the lowest predictive power.
SVR’s performance in various evaluation metrics (R2, MSE, and MAE) reveals complex, non-linear relationships in the structure–activity landscape of 1,2,4-TAP congeners against P. falciparum. Its ability to handle high-dimensional, non-linear data allows it to capture intricate dependencies and interactions. However, its time-consuming optimization process and higher computational demand may limit its effectiveness in large-scale QSAR datasets.
The study analyzed the performance of ensemble methods, distance-based algorithms, and LASSO in predicting antimalarial activity against P. falciparum. RFR, an ensemble method, performed well but not as effectively as SVR due to its reliance on multiple decision trees. kNN, a distance-based algorithm, struggled with diverse datasets and dispersed compound features, suggesting the need for more sophisticated pattern recognition methods. LASSO, with its regularization approach, had the lowest predictive accuracy and highest error values, suggesting that sparsity is desirable in some QSAR applications [7].
This study found that structural attributes like principal moment inertia ratio and capacity factor contribute to antimalarial activity. SVR, a non-linear modeling algorithm, is effective for QSAR modeling of 1,2,4-TAP derivatives in antimalarial applications. Future QSAR studies should prioritize algorithms like SVR for structurally diverse and complex datasets. Moreover, more relevant molecular descriptors and 1,2,4-TAP derivatives are being explored to build a more robust model and validate such models for more efficient regression tools.

4. Conclusions

The present study showed that four two-dimensional and one three-dimensional molecular features of 1,2,4-TAP contributed most significantly to their antiplasmodial activity with a predictive regression (SVR) equation of pIC50 = 5.90 − 0.71npr1 − 1.52pmi3 + 0.88slogP − 0.57vsurf-CW2 + 1.11vsurf-W2. This provides insights for understanding a single-target mechanism of antiplasmodial activity of 1,2,4-TAP analogs and further provides possible functional modifications to obtain more potent agents against P. falciparum malaria infection.

Author Contributions

Conceptualization, C.O.N.; methodology, C.O.N. and T.O.A.; software, T.O.A.; validation, I.S.A. and C.O.N.; formal analysis, T.O.A.; investigation, W.O.O.; resources, I.S.A.; data curation, I.S.A.; writing—original draft preparation, T.O.A.; writing—review and editing, T.O.A. and C.O.N.; visualization, T.O.A. and W.O.O.; supervision, C.O.N. and W.O.O. All authors have read and agreed to the published version of the manuscript.

Funding

This research received no external funding.

Institutional Review Board Statement

Not applicable.

Informed Consent Statement

Not applicable.

Data Availability Statement

The original contributions presented in this study are included in the article. Further inquiries can be directed to the corresponding author(s).

Conflicts of Interest

The authors declare no conflicts of interest.

References

  1. Ikerionwu, C.; Ugwuishiwu, C.; Okpala, I.; James, I.; Okoronkwo, M.; Nnadi, C.O.; Orji, U.; Ebem, D.; Ike, A. Application of machine and deep learning algorithms in optical microscopic detection of Plasmodium: A malaria diagnostic tool for the future. Photodiagn. Photodyn. Ther. 2022, 40, 103198. [Google Scholar] [CrossRef]
  2. Oguike, E.O.; Ugwuishiwu, C.H.; Asogwa, C.N.; Nnadi, C.O.L.; Obonga, W.O.; Attama, A.A. Systematic review on the application of machine learning to quantitative structure-activity relationship modelling against Plasmodium falciparum. Molec. Divers 2022, 26, 3447–3462. [Google Scholar] [CrossRef]
  3. Ikwuka, C.E.; Asogwa, C.M.; Ikwuka, O.J.; Ogbonna, J.E.; Onah, C.E.; Ohama, C.C.; Nnadi, C.O. Insights into the in-vivo antiplasmodial activity of trisdimethylamino pyrimidine derivative in Plasmodium berghei Infected Mouse Model. J. Pharm. Res. Int. 2022, 34, 33–40. [Google Scholar] [CrossRef]
  4. Matlhodi, T.; Makatsela, L.P.; Dongola, T.H.; Simelane, M.B.C.; Shonhai, A.; Gumede, N.J.; Mokoena, F. Auto QSAR-based active learning docking for hit identification of potential inhibitors of Plasmodium falciparum Hsp90 as antimalarial agents. PLoS ONE 2024, 19, e0308969. [Google Scholar] [CrossRef] [PubMed]
  5. Ojha, P.K.; Kumar, V.; Roy, J.; Roy, K. Recent advances in quantitative structure-activity relationship models of antimalarial drugs. Exp. Opin. Drug Discov. 2021, 16, 659–695. [Google Scholar] [CrossRef]
  6. Ayoka, T.O.; Uchegbu, U.J.; Alabuike, C.C.; Nnadi, C.O. Efficient classification and regression models for the QSAR of chloroquine analogues against chloroquine-sensitive and chloroquine-resistant. Lett. Appl. NanoBioSci. 2024, 13, 90. [Google Scholar] [CrossRef]
  7. Umoette, K.S.; Nnadi, C.O.; Obonga, W.O. A robust regression-based modelling to predict the antiplasmodial activity of thiazolyl–pyrimidine hybrid derivatives against Plasmodium falciparum. Chem. Proc. 2023, 14, 52. [Google Scholar] [CrossRef]
  8. Hibot, A.; Oumessaoud, A.; Hafid, A.; Khouili, M.; Pujol, M.D. Different synthetic methods for the preparation of triazolopyrimidines and their biological profile. ChemSelect 2023, 8, e202301654. [Google Scholar] [CrossRef]
  9. Abdelkhalek, A.S.; Attia, M.S.; Kamal, M.A. Triazolopyrimidine derivatives: An updated review on recent advances in synthesis, biological activities and drug delivery aspects. Curr. Med. Chem. 2024, 31, 1896–1919. [Google Scholar] [CrossRef] [PubMed]
  10. Tee, E.H.; Karoli, T.; Ramu, S.; Huang, J.X.; Butler, M.S.; Cooper, M.A. Synthesis of essramycin and comparison of its antibacterial activity. J. Nat. Prod. 2010, 73, 1940–1942. [Google Scholar] [CrossRef] [PubMed]
  11. Oukoloff, K.; Lucero, B.; Francisco, K.R.; Brunden, K.R.; Ballatore, C. 1,2,4-Triazolo[1,5-a]pyrimidines in drug design. Eur. J. Med. Chem. 2019, 165, 332–346. [Google Scholar] [CrossRef] [PubMed]
  12. Trianaa, M.A.H.; Huynhb, M.H.; Garavitoa, M.F.; Foxc, B.A.; Bzikc, D.J.; Carruthers, V.B.; Lofflerd, M.; Zimmermanna, B.H. Biochemical and molecular characterization of the pyrimidine biosynthetic enzyme dihydroorotate dehydrogenase from Toxoplasma gondii. Mol. Biochem. Parasit. 2012, 184, 71–81. [Google Scholar] [CrossRef] [PubMed]
  13. Gaulton, A.; Bellis, L.J.; Bento, A.P.; Chambers, J.; Davies, M.; Hersey, A.; Light, Y.; McGlinchey, S.; Michalovich, D.; Al-Lazikani, B.; et al. ChEMBL: A large-scale bioactivity database for drug discovery. Nucleic Acids Res. 2012, 40, D1100–D1107. [Google Scholar] [CrossRef] [PubMed]
  14. Yap, C.W. PaDEL-descriptor: An open-source software to calculate molecular descriptors and fingerprints. J. Comput. Chem. 2011, 32, 1466–1474. [Google Scholar] [CrossRef] [PubMed]
  15. Sydow, D.; Morger, A.; Driller, M.; Volkamer, A. TeachOpenCADD: A teaching platform for computer-aided drug design using open-source packages and data. J. Cheminform. 2019, 11, 29. [Google Scholar] [CrossRef] [PubMed]
Figure 1. Chemical structure of 1,2,4-TAP template.
Engproc 87 00052 g001
Figure 2. Scatter plots to visualize the relationship between the target variable and weight variable before (left panel) and after (right panel) removal of the outlier.
Engproc 87 00052 g002
Figure 3. Normal distribution curve of error terms.
Engproc 87 00052 g003
Figure 4. Correlation of the predicted and experimental pIC50 values. (red color represents the test set compounds while other colors represent the training set compounds).
Engproc 87 00052 g004
Figure 5. Boxplots of five-fold cross-validation scores to compare the performance of the ML algorithms.
Engproc 87 00052 g005
Figure 6. Learning curves of SVR models trained on the dataset using the training sizes of 10, 20, 40, 60, 80, and 99.
Engproc 87 00052 g006
Table 1. Selected significant features following RFE.
FeaturesCoeffSEtp > |t|[0.025–0.975]
constant5.89640.06098.5220.0005.7786.015
npr1 *−0.71460.085−8.3600.000−0.884−0.545
pmi3 *−1.52100.281−5.4070.000−2.078−0.964
SlogP **0.87520.0949.3490.0000.6901.061
vsurf_CW2 *−0.57330.204−2.8080.006−0.978−0.169
vsurf_W2 *1.11200.3123.5700.0010.4951.729
npr1 (normalized principal moment inertia ratio 1), PEOE_VSA_FHYD (fractional hydrophobic van der Waals surface area), PEOE_VSA_FPNEG (fractional polar negative van der Waals surface area), PEOE_VSA_FPOL (fractional polar van der Waals surface area), PEOE_VSA_FPPOS (fractional polar positive van der Waals surface area), pmi3 (principal moment inertia ratio 3), Q_VSA_FNEG (fractional negative van der Waals surface area), Q_VSA_FPOS (fractional positive van der Waals surface area), SlogP (log octanol/water partition coefficient), vsurf_CW2 (capacity factor at −0.5), and vsurf_W2 (hydrophilic volume at −0.5), ** 2D and * 3D molecular features.
Table 2. Summary of the performance of the models.
ML ModelsMLRkNNSVRRFRRIDGECVLASSO
Test MSE0.480.00.120.070.620.56
five-fold CV0.45 ± 0.100.46 ± 0.070.33 ± 0.040.43 ± 0.070.45 ± 0.090.62 ± 0.12
Test R20.591.00.870.920.060.53
five-fold CV0.56 ± 0.110.54 ± 0.100.67 ± 0.090.58 ± 0.050.56 ± 0.110.40 ± 0.11
Test MAE0.580.00.270.190.660.62
five-fold CV0.52 ± 0.070.54 ± 0.040.46 ± 0.040.51 ± 0.060.52 ± 0.070.64 ± 0.10
Test RMSE0.690.00.340.270.780.75
five-fold CV0.67 ± 0.070.68 ± 0.050.57 ± 0.030.66 ± 0.050.67 ± 0.070.79 ± 0.08
Disclaimer/Publisher’s Note: The statements, opinions and data contained in all publications are solely those of the individual author(s) and contributor(s) and not of MDPI and/or the editor(s). MDPI and/or the editor(s) disclaim responsibility for any injury to people or property resulting from any ideas, methods, instructions or products referred to in the content.

