Proceeding Paper

Effect of Adhesive Thickness on Fatigue Disbonding Through a Cohesive Zone Modelling Approach †

MaSTeR Lab, Department of Industrial Engineering, University of Bologna, Via Fontanelle 40, 47121 Forlì, FC, Italy
*
Author to whom correspondence should be addressed.
Presented at the 14th EASN International Conference on “Innovation in Aviation & Space towards sustainability today & tomorrow”, Thessaloniki, Greece, 8–11 October 2024.
Eng. Proc. 2025, 90(1), 65; https://doi.org/10.3390/engproc2025090065
Published: 18 March 2025

Abstract

:
Adhesively bonded joints are crucial to the aeronautical industry, contributing to weight reduction and more sustainable flights. However, certifying these joints is still a topic of debate due to the lack of reliable inspection methods to determine their strength. Additionally, prediction models for crack growth under fatigue loading are still being developed. This manuscript describes the implementation and validation of a cohesive zone model to evaluate high cycle fatigue disbonding under mode I opening. This model was integrated into the commercial finite element analysis software Abaqus using user-defined subroutines, specifically a UMAT. The experimental data from the literature on the effect of adhesive thickness during fatigue loading of a double cantilever beam were used for model validation. Three modelling techniques were explored, including substitution of the adhesive with the cohesive zone (2D and 3D) and the addition of a cohesive layer in the mid-plane of the adhesive (2D only). The results have confirmed that the model is effective in accurately predicting fatigue crack growth in all the simulated cases. Additionally, it has been shown that the adhesive’s thickness has an impact on the simulation results, particularly with thicker bondlines and low strain energy release rates.

1. Introduction

The aerospace industry is currently looking for more environmentally friendly flights with the development of “green aircraft”, which aims to reduce emissions to reach carbon neutrality. Programmes such as Clean Aviation, funded by the European Union, bring together industry and research centers to transform aviation into a sustainable and climate-neutral industry, aiming to demonstrate technological innovations by 2030 and reduce emissions by 30% by 2050 [1].
Reducing the environmental impact of aircraft involves using lightweight, high-strength, and stiff structures. Modern aircraft manufacturers have increased the use of composite materials (i.e., carbon fiber-reinforced plastics—CFRP) in primary structures, as seen in Airbus A350 XWB or Boeing’s 787 Dreamliner, where the use of composite materials covers more than 50% of their main frames. This choice of materials has allowed them to reduce fuel consumption and extend fatigue life with reduced weight compared to typical metal alloys used in the aeronautical sector.
The use of composite materials in aeronautical structures has opened the discussion of the use of adhesives as the main joining method. Traditional techniques, such as riveting, require making holes in the structures and this could damage the fibers and cause premature damage. Also, holes lead to stress concentration spots, which lead to thicker structures, and thus heavier ones [2], whereas adhesives mitigate stress concentration zones and uniformly distribute the load across the bonded interface.
Adhesives also present disadvantages, since there is no reliable inspection technology to determine bond strength, which may be affected by manufacturing defects, i.e., bubbles/contamination [3]. In addition, prediction models for crack growth under fatigue are still under development. These two factors lead to certification issues with aviation authorities and have become an important research topic.
The literature has shown the successful implementation of Cohesive Zone Models (CZMs) for the simulation of adhesively bonded joints under fatigue loading within commercial finite element analysis (FEA) software [4,5,6]. This paper shows the successful implementation of CZM for the simulation of high cycle fatigue (HCF) with Abaqus software focusing on different modelling techniques for the adhesive thickness, based on the experimental results presented by Zavatta [7], Pascoe et al. [8] on pure mode I opening.

2. Cohesive Zone Models (CZMs)

CZMs simulate interfacial fracture and can capture the initiation and propagation of a crack assuming that this takes place at a specified region between two fictitious surfaces called the cohesive zone. CZMs estimate the deterioration of the material (or damage of the material) based on the surfaces’ relative displacement resulting in a reduced traction strength. This behavior is described by a constitutive law; in the case of this manuscript, the bilinear traction–separation law is used. As seen in Figure 1a, there is a linear elastic zone where no damage is accumulated, and after reaching the maximum traction ( τ 0 ) at the onset displacement ( δ 0 ), a damage zone [9]. Once the region reaches the propagation displacement ( δ f ) or the residual traction strength reaches zero, the crack propagates and the energy needed to achieve the propagation of the crack is described by the fracture toughness ( G C ), and it is the area under the curve of the traction separation law. Both the onset and propagation displacements are calculated in Equation (1), where K n is the Normal Stiffness of the cohesive model (in the order of 10 5 ) and the subindex I indicates Mode I opening.
δ 0 = τ I 0 K n ; δ f = 2 G I C K n δ 3 0

2.1. Numerical Implementation of Cohesive Zone Models for Quasi-Static Loading

The scope of this paper is to analyze disbonding under pure Mode I opening; therefore, the formulation of the cohesive zone will consider only this type of loading.
The implementation is based on the work presented by Turon et al. [10], starting with the determination of the total displacement jump λ , which is equal to the displacement, normal to the direction of crack growth λ = δ 3 , where the MacAuley bracket is used to consider only tensile displacements (sub-index 3 indicates the direction normal to the crack plane). At each time step (i), the damage threshold, i.e., the point at which damage starts to accumulate, is computed as follows:
r i 1 = δ 3 0 δ 3 f δ 3 0 d s t a t i c i 1 ( δ 3 f δ 3 0 )
Note that it is calculated at i 1 because it is based on the damage obtained in the previous time increment. This value is compared with the current displacement jump λ to check if the region is further damaged or in the linear elastic region. If the current displacement jump is greater than the damage threshold defined in Equation (2), the damage parameter is specified in Equation (3); otherwise, the damage threshold and the damage parameter remain unchanged.
d s t a t i c i = δ 3 f ( r i δ 3 0 ) λ ( δ 3 f δ 3 0 )

2.2. Numerical Implementation of Cohesive Zone Models for Fatigue Loading

The implementation of CZMs in the case of fatigue loading considers the total damage as the combination of the fatigue and quasi-static loading contributions since the damage mechanisms are different. The total damage is then computed as:
d = d s t a t i c + d f a t i g u e
where damage contribution due to fatigue is computed as:
d f a t i g u e i = d f a t i g u e i 1 + d N i 1 Δ N i 1
where Δ N is the cycle jump, i.e., the number of cycles simulated, and d / N is damage growth rate. The damage growth rate can be linked with the crack growth rate (a variable that can be calculated with experimental testing) as follows:
d N = d a d a N
where a d is the damaged length and a N is the crack growth rate. Experimentally, the crack growth rate is computed in one dimension using Paris’ Law (Equation (7)). Thus, from this point on, the expression will be adjusted to one dimension, in terms of crack length (a).
a N = C Δ G G I c m if G t h < G m a x < G c 0 otherwise
where C and m are material constants, related to the load ratio and thickness, and G t h is the strain energy release rate threshold, which is the limit where no crack growth is observed. Δ G is the cyclic variation of the strain energy release rate, which can be calculated as the area under the traction–separation law between the minimum and maximum displacement ( λ ), as seen in Figure 1b.
Mathematically, the strain energy release rate can be calculated as:
G = λ m i n λ m a x τ ( δ ) d δ
The cyclic variation of the strain energy release rate can be expressed in terms of the load ratio (R),
Δ G = ( 1 R 2 ) G m a x
The maximum strain energy release rate ( G m a x ) can be calculated with the following expression, as often done in literature [10,11,12]:
G m a x = τ I 0 2 δ 3 0 + ( δ 3 f λ ) 2 δ 3 f δ 3 0
Instead, to reduce the variation of the maximum strain release rate during fatigue loading, its value will be calculated using the midpoint rule, as suggested by Kawashita and Hallett [13].
G m a x i = G m a x i 1 + τ I d a m i + τ I d a m i 1 2 λ i λ i 1
where τ 1 d a m is the residual interfacial strength, computed as:
τ 1 d a m = K n ( 1 d ) λ
Finally, d a d represents a material property relating damage and the damaged length, and it is defined by the following equation:
d a d = 1 l c z δ 3 f ( 1 d i ) + d i δ 3 0 2 δ 3 f δ 3 0
where l c z is the length of the cohesive zone and is computed as:
l c z = 9 π 32 E 3 G I C τ I 0 2
where E 3 is the Young’s modulus of the material.

Cycle Jump Strategy

Simulating every fatigue cycle (load–unload) of a specimen is extremely expensive in terms of computational power. A cycle jump strategy to simulate high cycle fatigue was implemented, which means that for Δ N cycles, the effect of stiffness degradation is extrapolated assuming that there is no change in the load ratio. This cycle jump is defined as:
Δ N = Δ d m a x d N
where Δ d m a x , is the accuracy related to the fatigue damage calculation. This Δ N can then be used in Equation (5).

3. Methods

As anticipated in Section 1, the implementation and validation of the CZMs described in Section 2 will be performed. Experimental data for validation of the numerical model are taken from Zavatta [7], Pascoe et al. [8]. The Double Cantilever Beam (DCB) specimens were made up of two 2024-T3 aluminum arms with 270 mm length, 6 mm thickness and 25 mm width, bonded together with an epoxy film adhesive, FM94K.03AD, with varying thicknesses.
Some specimens were selected for the CZM validation, looking for different displacement ratios and thicknesses, and their characteristics are summarized in Table 1. All specimens had an initial crack length ( a 0 ) of 50 mm.
As already stated, the cohesive zone is a thin region where disbonding crack propagation takes place and different modelling techniques in the FEA software can be considered [14]. In the case of this paper, three techniques were tested to check the behavior of the implemented fatigue CZM (see Figure 2): 2D modelling considering the adhesive as the cohesive zone; 2D modelling considering the cohesive zone as a thin region in the mid-plane of the adhesive; 3D modelling considering the adhesive as the cohesive zone. Despite the fact that the second technique is not commonly seen in the literature, it is included to check whether the varying adhesive thickness affects the simulation results.
The analyses were set as an Abaqus Standard/Implicit for all methods, simulating 375,000 fatigue cycles. Meshing was performed for each case as follows:
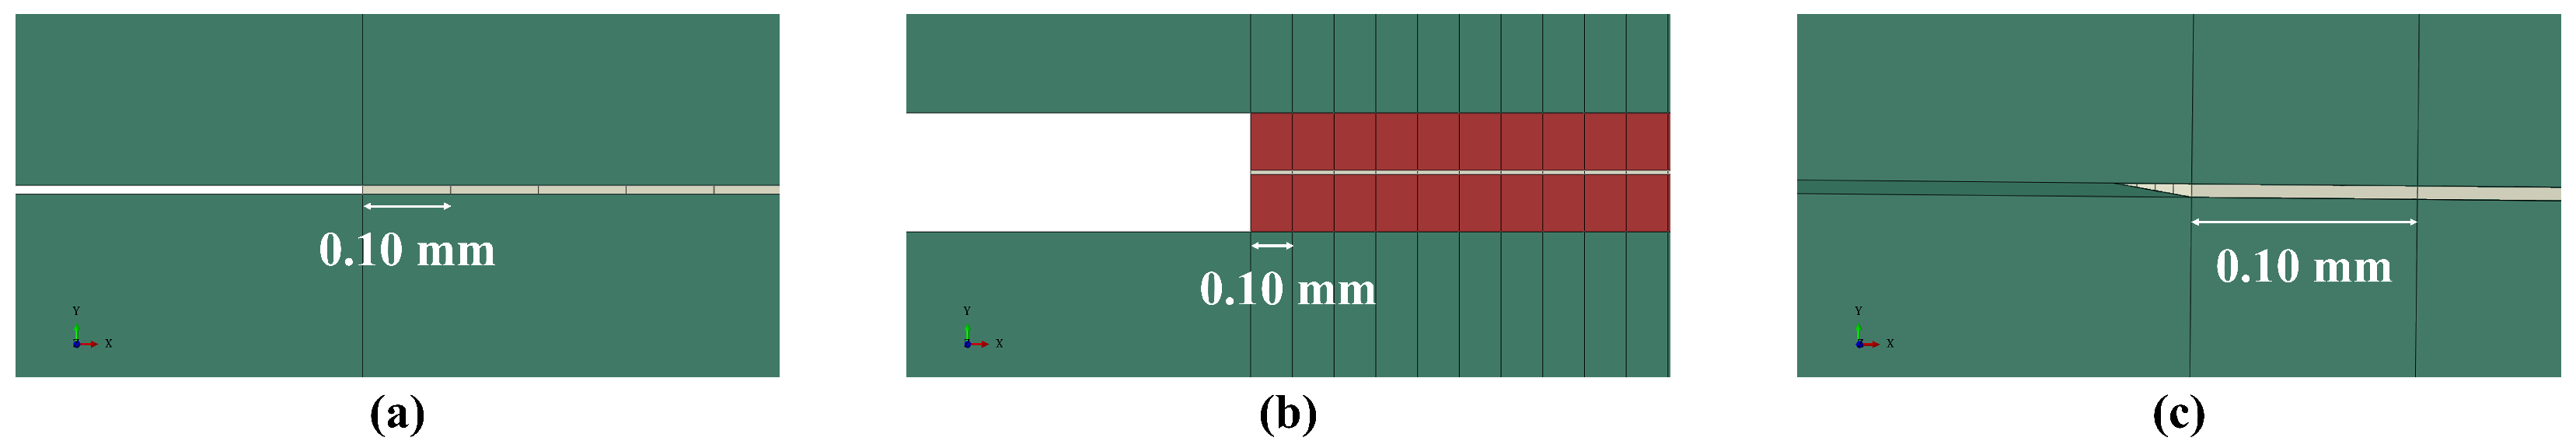
  • Figure 2a—CPE4 elements of 1.00 mm length for the aluminum arms and COH2D4 elements of 0.10 mm length for the cohesive zone;
  • Figure 2b—CPE4 elements of 1.00 mm length for the aluminum arms, CPE4 elements of 0.10 mm length for the adhesive and COH2D4 elements of 0.10 mm length for the cohesive zone;
  • Figure 2c—SC8R elements of 1.00 mm length with a refinement of 0.10 mm on the crack growth zone for the aluminum arms and COH3D8 elements of 0.10 mm length for the cohesive zone.
It can be noted that the lengths of the elements are reduced on the cohesive zone for accuracy reasons (i.e., capture crack growth with more accuracy). Table 2 summarizes the cohesive zone properties.
Specific material behavior models can be implemented through user-defined subroutines. In this manuscript, a UMAT was chosen to define the mechanical constitutive behavior of a material [15], specifically the adhesive within the cohesive zone. A UMAT performs calculations at each integration point, provides time-step and strain-related variables as output, and requires as input the stress tensor and the Jacobian matrix from the constitutive model. Based on the constitutive equation of the bilinear traction–separation law, the reactions for mode I loading only can be defined as:
τ j = D i j δ j = 1 d δ i j K j δ j + d δ i j K n δ 3 j δ 3
where D i j is the stiffness matrix. As stated previously, only tensile displacements in the normal direction to the crack plane cause damage.
Finally, the tangent stiffness matrix (or Jacobian) can be defined as:
D i j t a n = D i j K n d λ δ 3 j = 1 d δ i j K j + d K n δ 3 j δ 3 K n δ f δ 0 δ f δ 0 1 λ δ 3 j
The calculation of the damage (d) is performed following the model described in Section 2.

4. Results

The results from the different simulation configurations and specimens were compared with the experimental results presented by Pascoe et al. [8]. In Figure 3, the disbonding at the beginning (a) and at the end (b) of the fatigue loading is represented by the distribution of the damage (SDV1) in the cohesive zone. When the damage is >0, a damaged zone (also known as the process zone) is formed, which is larger in Figure 3a due to the higher crack growth rates at the beginning of the fatigue loading (N = 0). When the damage is 1, the element is fully damaged, which leads to the deletion in the subsequent increment.
Traditional methods were considered to present the results of the fatigue tests; the crack growth rates against the normalized cyclic variation of the strain energy release rate for all specimens are presented in Figure 4. The Paris’ Law curve was obtained based on the experimental tests and the coefficients of the curve were used as inputs; they are summarized in Table 1. All fittings had an R 2 > 0.90 , indicating a high correlation between the fitting function and the experimental data.
As seen in the previous figure, all simulated cases with the different modelling techniques show good agreement with the experimental tests, indicating that the CZM was successfully implemented for high cycle fatigue. The first observation is that the simulated results tend to diverge from the Paris’ Law curve with high crack propagation rates (about 0.01 mm/cycle), but this is described by the stable tearing crack growth region commonly seen during the initiation of crack propagation in fatigue, where no experimental data were available [16].
The second observation is that modelling the adhesive thickness does have an effect on the results. At low strain energy release rates, crack growth shows an oscillatory behavior (better seen in specimen G-010-II, the thickest of all, at rates below 10 4 ), not only due to the proximity to the threshold region where there is no crack propagation, but also due to the model’s sensitivity to small displacements. Furthermore, the modelled thickness changes the stress/strain distribution within the cohesive zone, which in this case is in contact with the adhesive and not the aluminum arms. To mitigate these effects, a finer mesh could improve the accuracy at low crack growth rates.
To conclude, the crack length against the number of fatigue cycles was plotted for all specimens in Figure 5. Again, all simulated cases with the different modelling techniques show good agreement with the experimental tests. Small differences may be corrected by a better calibration of the cohesive zone length (Equation (6)), which affects the damage growth rate. For specimen H-004-I, the difference is noticeable, since at the established displacement, the specimen during the experimental testing was not yet pre-cracked; thus, the specimen was loaded before the start of fatigue crack growth to remove the effect of the resin-rich area at the tip of the delamination. The thickness effect under fatigue conditions with simulations is not analyzed since, as explained by Pascoe et al. [8], the effect is captured in the Paris’ Law parameters from the experimental tests, and these parameters are input to the cohesive model.

5. Conclusions

This study successfully implemented Turon’s cohesive zone model into a user-defined subroutine in Abaqus to simulate fatigue disbonding under pure Mode I opening.
Three modelling techniques were simulated, and all showed results consistent with the experimental test data. The 2D case with the adhesive acting as the cohesive zone was found to be the most efficient in terms of computational resources due to its simplicity. In the 2D case, modelling the adhesive and the cohesive zone in the mid-plane affects the stress/strain distribution in the cohesive zone due to the added thickness and has a greater influence at small crack growth rates (<10−4) and with thicker bondlines. The 3D case provides more insight into the crack growth rate, crack length, and crack front shape, as it allows the out-of-plane direction to be analyzed and, in the case of mixed-mode opening, this modelling technique is preferred over the 2D model. It is recommended to analyze the effect of modelling the bondline thickness in the 3D case with mixed-mode opening.

Author Contributions

J.B.: Conceptualization, methodology, software, validation, formal analysis, investigation, data curation, writing—original draft preparation, writing—review and editing; M.P.F.: Methodology, visualization, writing—review and editing; E.T.: Methodology, supervision, project administration, funding acquisition, writing—review and editing. All authors have read and agreed to the published version of the manuscript.

Funding

Financed by the European Union—NextGenerationEU through the Italian Ministry of University and Research under PNRR—Mission 4 Component 1, Investment 4.1 “Extension of the number of PhD programmes and innovative PhD programmes for Public Administration and cultural heritage” and Investment 3.4 “Advanced university education and skills—Support to PhD programmes for digital and environmental transition”. This manuscript reflects only the authors’ views and opinions; neither the European Union nor the European Commission can be considered responsible for them.

Data Availability Statement

The data presented in this article are not readily available because they are part of an ongoing study.

Conflicts of Interest

The authors declare no conflicts of interest.

References

  1. Clean Aviation Joint Undertaking. Who we are | Clean Aviation. Clean Aviation Joint Undertaking: Brussels, Belgium. Available online: https://www.clean-aviation.eu/about-us/who-we-are (accessed on 29 July 2024).
  2. Kupski, J.; Teixeira de Freitas, S. Design of adhesively bonded lap joints with laminated CFRP adherends: Review, challenges and new opportunities for aerospace structures. Compos. Struct. 2021, 268, 113923. [Google Scholar] [CrossRef]
  3. Pascoe, J.A. Characterisation of Fatigue Crack Growth in Adhesive Bonds. Ph.D. Thesis, TU Delft, Delft, The Netherlands, 2016. [Google Scholar]
  4. Tserpes, K.; Floros, I. Fatigue crack growth simulation in adhesively bonded composite joints. Fatigue Fract. Eng. Mater. Struct. 2019, 42, 1430–1440. [Google Scholar] [CrossRef]
  5. Rocha, A.V.M.; Akhavan-Safar, A.; Carbas, R.; Marques, E.A.S.; Goyal, R.; El-zein, M.; da Silva, L.F.M. Numerical analysis of mixed-mode fatigue crack growth of adhesive joints using CZM. Theor. Appl. Fract. Mech. 2020, 106, 102493. [Google Scholar] [CrossRef]
  6. Khoramishad, H.; Crocombe, A.D.; Katnam, K.B.; Ashcroft, I.A. Predicting fatigue damage in adhesively bonded joints using a cohesive zone model. Int. J. Fatigue 2010, 32, 1146–1158. [Google Scholar] [CrossRef]
  7. Zavatta, N. Crack growth in adhesively bonded joints under quasi-static and fatigue loading. Doctoral Thesis, Alma Mater Studiorum-Università di Bologna, Bologna, Italy, 2020. [Google Scholar] [CrossRef]
  8. Pascoe, J.A.; Zavatta, N.; Troiani, E.; Alderliesten, R.C. The effect of bond-line thickness on fatigue crack growth rate in adhesively bonded joints. Eng. Fract. Mech. 2020, 229, 106959. [Google Scholar] [CrossRef]
  9. Geubelle, P.H.; Baylor, J.S. Impact-induced delamination of composites: A 2D simulation. Compos. Part B Eng. 1998, 29, 589–602. [Google Scholar] [CrossRef]
  10. Turon, A.; Costa, J.; Camanho, P.P.; Dávila, C.G. Simulation of delamination in composites under high-cycle fatigue. Compos. Part A Appl. Sci. Manuf. 2007, 38, 2270–2282. [Google Scholar] [CrossRef]
  11. Pirondi, A.; Moroni, F. Improvement of a Cohesive Zone Model for Fatigue Delamination Rate Simulation. Materials 2019, 12, 181. [Google Scholar] [CrossRef] [PubMed]
  12. Harper, P.W.; Hallett, S.R. Cohesive zone length in numerical simulations of composite delamination. Eng. Fract. Mech. 2008, 75, 4774–4792. [Google Scholar] [CrossRef]
  13. Kawashita, L.F.; Hallett, S.R. A crack tip tracking algorithm for cohesive interface element analysis of fatigue delamination propagation in composite materials. Int. J. Solids Struct. 2012, 49, 2898–2913. [Google Scholar] [CrossRef]
  14. Li, G.; Li, C. Assessment of debond simulation and cohesive zone length in a bonded composite joint. Compos. Part B Eng. 2015, 69, 359–368. [Google Scholar] [CrossRef]
  15. Dassault Systèmes SE. Abaqus User Subroutines Guide; Dassault Systèmes: Vélizy-Villacoublay, France, 2024. [Google Scholar]
  16. Schijve, J. Fatigue of Structures and Materials; Springer Science & Business Media: Berlin/Heidelberg, Germany, 2009. [Google Scholar]
Figure 1. Bilinear traction separation constitutive law with the visual representation of the fracture toughness G C (a); visual representation of the cyclic variation of the strain energy release rate ( Δ G ) (b), where δ 0 is the onset displacement, δ f is the propagation displacement, τ 0 is the traction strength.
Engproc 90 00065 g001
Figure 2. Modelling approaches to the cohesive zone: 2D model with cohesive zone replacing the adhesive (a); 2D model with cohesive zone located along the mid-plane of the adhesive (b); 3D model with cohesive zone replacing the adhesive (c). In green are the aluminum arms, in red the adhesive, and in grey the cohesive zone.
Engproc 90 00065 g002
Figure 3. Damage distribution on the adhesive layer of G-002-II specimen before cyclic loading N = 0 (a) and after fatigue cyclic loading N = 375,000 (b).
Engproc 90 00065 g003
Figure 4. Crack growth rate as a function of normalized cyclic variation of the strain energy release rate. Results divided by specimen name and by the different testing configurations.
Engproc 90 00065 g004
Figure 5. Crack length as a function of the number of fatigue cycles. Results divided by specimen name and by the different testing configurations.
Engproc 90 00065 g005
Table 1. Summary of the modified Paris’ Law parameters, fatigue load conditions and adhesive thickness of different simulated specimens.
SpecimenAdhesive
Thickness [ml
Displacement
Ratio (R)
CmMaximum
Displacement [ml
G-002-II0.2750.291.47756.33224.083
G-010-II0.2850.0360.581334.95452.893
H-002-II0.1950.0360.41855.11446.27
H-003-II0.1350.292.41026.82365.13
H-004-I0.2450.6172.420210.36492.3275
Table 2. Mechanical/cohesive properties of adhesive FM94K (taken from Zavatta [7]).
PropertiesSymbolValueUnits
Young’s ModulusE3000MPa
Normal Stiffness K n 5 × 10 5 N/mm3
Tangential Stiffness K t 1 × 10 5 N/mm3
Cohesive Strength (Mode I) τ I 0 50MPa
Fracture Toughness (Mode I) G I C 1.70 N/mm
Disclaimer/Publisher’s Note: The statements, opinions and data contained in all publications are solely those of the individual author(s) and contributor(s) and not of MDPI and/or the editor(s). MDPI and/or the editor(s) disclaim responsibility for any injury to people or property resulting from any ideas, methods, instructions or products referred to in the content.

