Abstract
In response to the increasingly severe energy consumption problem and to promote energy saving and emission reduction, this study aims to design and apply an energy management system platform based on artificial intelligence (AI) technology. The system adopts sensor technology and data acquisition equipment to monitor various types of energy consumption in buildings in real time, efficiently process and predict these data through machine learning algorithms, and finally visualize the results. The system is functionally complete, completing the process from data collection to visualization, the cloud platform’s construction, and finally a full energy management platform. Various machine learning methods are applied to energy management by predicting the chilled water energy meter return temperature of the central air-conditioning system and comparing its performance. Among the various types of regression algorithms, the mean-square error (MSE) of decision tree regression is 0.36, the MSE of support vector regression (SVR) is 0.09, the MSE of K-nearest neighbor (KNN) regression is 0.57, and the MSE of extreme gradient boosting (XGBoost) regression is 0.32. The SVR, the XGBoost regression, and the decision tree regression perform better in various indices.
1. Introduction
With China’s booming economy and accelerating industrialization, the problem of energy consumption has become serious, especially with increasing resource scarcity and the realization of sustainable development. Recently, China has formulated energy management policies to promote high-quality energy development and achieve the “dual-carbon” goal. Enterprises are actively responding to the policies to promote and implement energy management programs.
The application of energy management and energy-saving strategies in intelligent buildings is of great significance with great potential. Efficient use of energy and energy saving and emission reduction in intelligent buildings can be achieved through the reasonable selection and application of sensor technology, data acquisition, monitoring systems, big data analysis, and prediction technology, as well as automated control and optimization technology [1]. Therefore, machine learning analysis based on sensor data was used in this study to develop a screen display energy management platform. There has been related research before; Deep Mind previously developed a set of new materials for sensors used in a dynamic monitoring system for Google, Baidu Cloud, and Alibaba Cloud. To carry out the “cloud” water test, energy management is required [2]. However, problems such as high prices and complex technology emerge, which limits its wide application in small and medium-sized enterprises. The developed system optimizes energy usage and enables real-time monitoring and predictive alerts, thus improving the overall efficiency and reliability of the system using machine learning.
2. Energy Management Platform
2.1. System Architecture
The system architecture was designed to have well-defined functions and components including sensors and a cloud platform for data analysis and visualization (Figure 1). The sensors are responsible for data acquisition and transmission, the cloud platform establishes a cloud database, the data on the cloud platform are analyzed and processed by machine learning, and visualization and intelligent adjustment are carried out according to the analysis results.
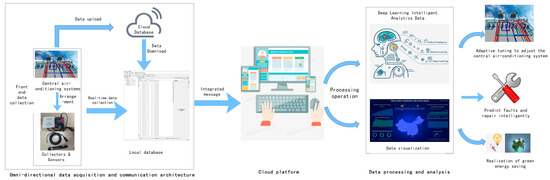
Figure 1.
System architecture diagram.
2.1.1. Data Acquisition and Transmission
After the sensors are reasonably arranged, they upload the acquired data to the cloud server of the sensor company. For analysis, the data from the cloud server are cyclically imported into a comma-separated value (CSV) file through the application programming interface (API). If the target company provides the CSV file directly, the acquisition phase can be skipped.
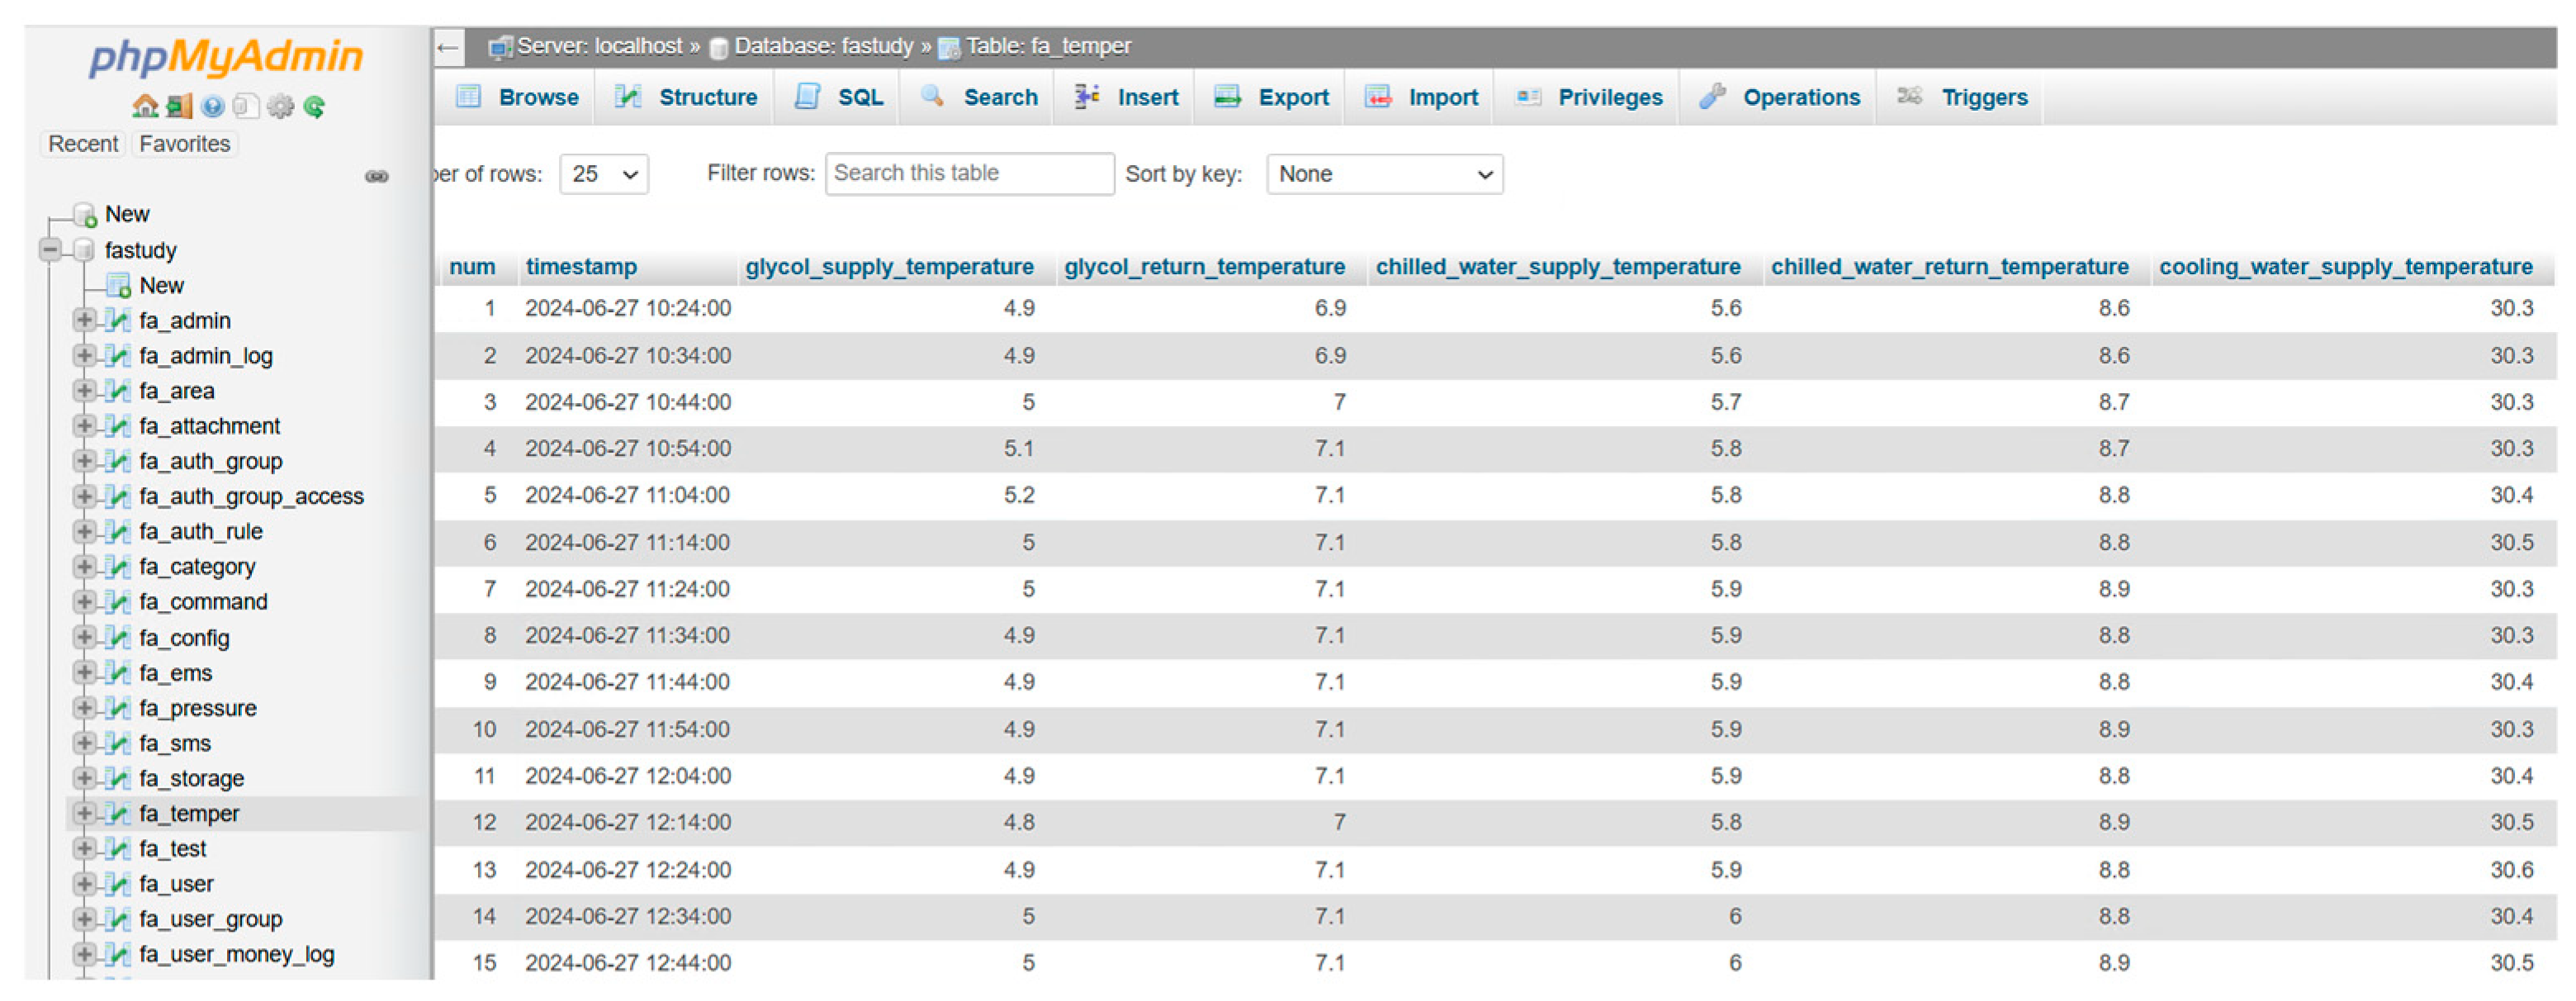
For data storage and secondary development, the data in the CSV file are uploaded to the cloud platform database. The format of the data table is similar to the CSV file, but useless features are removed to retain variables required for data analysis. A new index column is added as a primary key self-increment. To avoid importing the same data repeatedly, a timestamp variable is chosen as the unique key. To realize periodic automatic data updates, i.e., when the sensor collects new data or the company provides an updated CSV file, data are imported into the cloud database into a loop in a customized dormant time for periodic automatic data updates. The results of uploading data to the cloud database are shown in Figure 2.
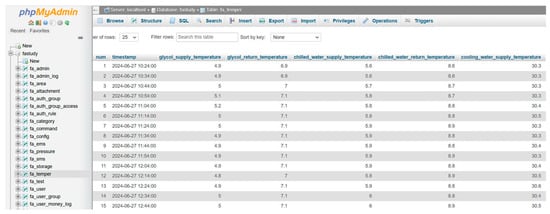
Figure 2.
Cloud database data (partial).
2.1.2. Cloud Platform
A customized backend management system was designed using the lightweight FastAdmin 0.2.21 in this study. FastAdmin is first deployed on the server and connected to a specific data table in the database to access the backend data. Then, cloud services are used for security configuration and visualization interface load generated by Pycharm into FastAdmin to access remotely the platform built by FastAdmin for backend data monitoring and large-screen visualization display. The steps of server deployment and cloud platform construction are as follows.
- Server deployment FastAdmin
Before starting the deployment, the server environment must meet the requirements for running FastAdmin. PHP version 7.39 and MySQL 5.6 or higher were installed as the appropriate Apache server.
- 2.
- FastAdmin
The FastAdmin framework is uploaded to the server to extract the specified directory. The initial deployment is completed by pointing to FastAdmin’s entry file through the web server configuration. Then, the database connection is configured in the FastAdmin configuration file.
- 3.
- Cloud Services Security Group Rule Addition
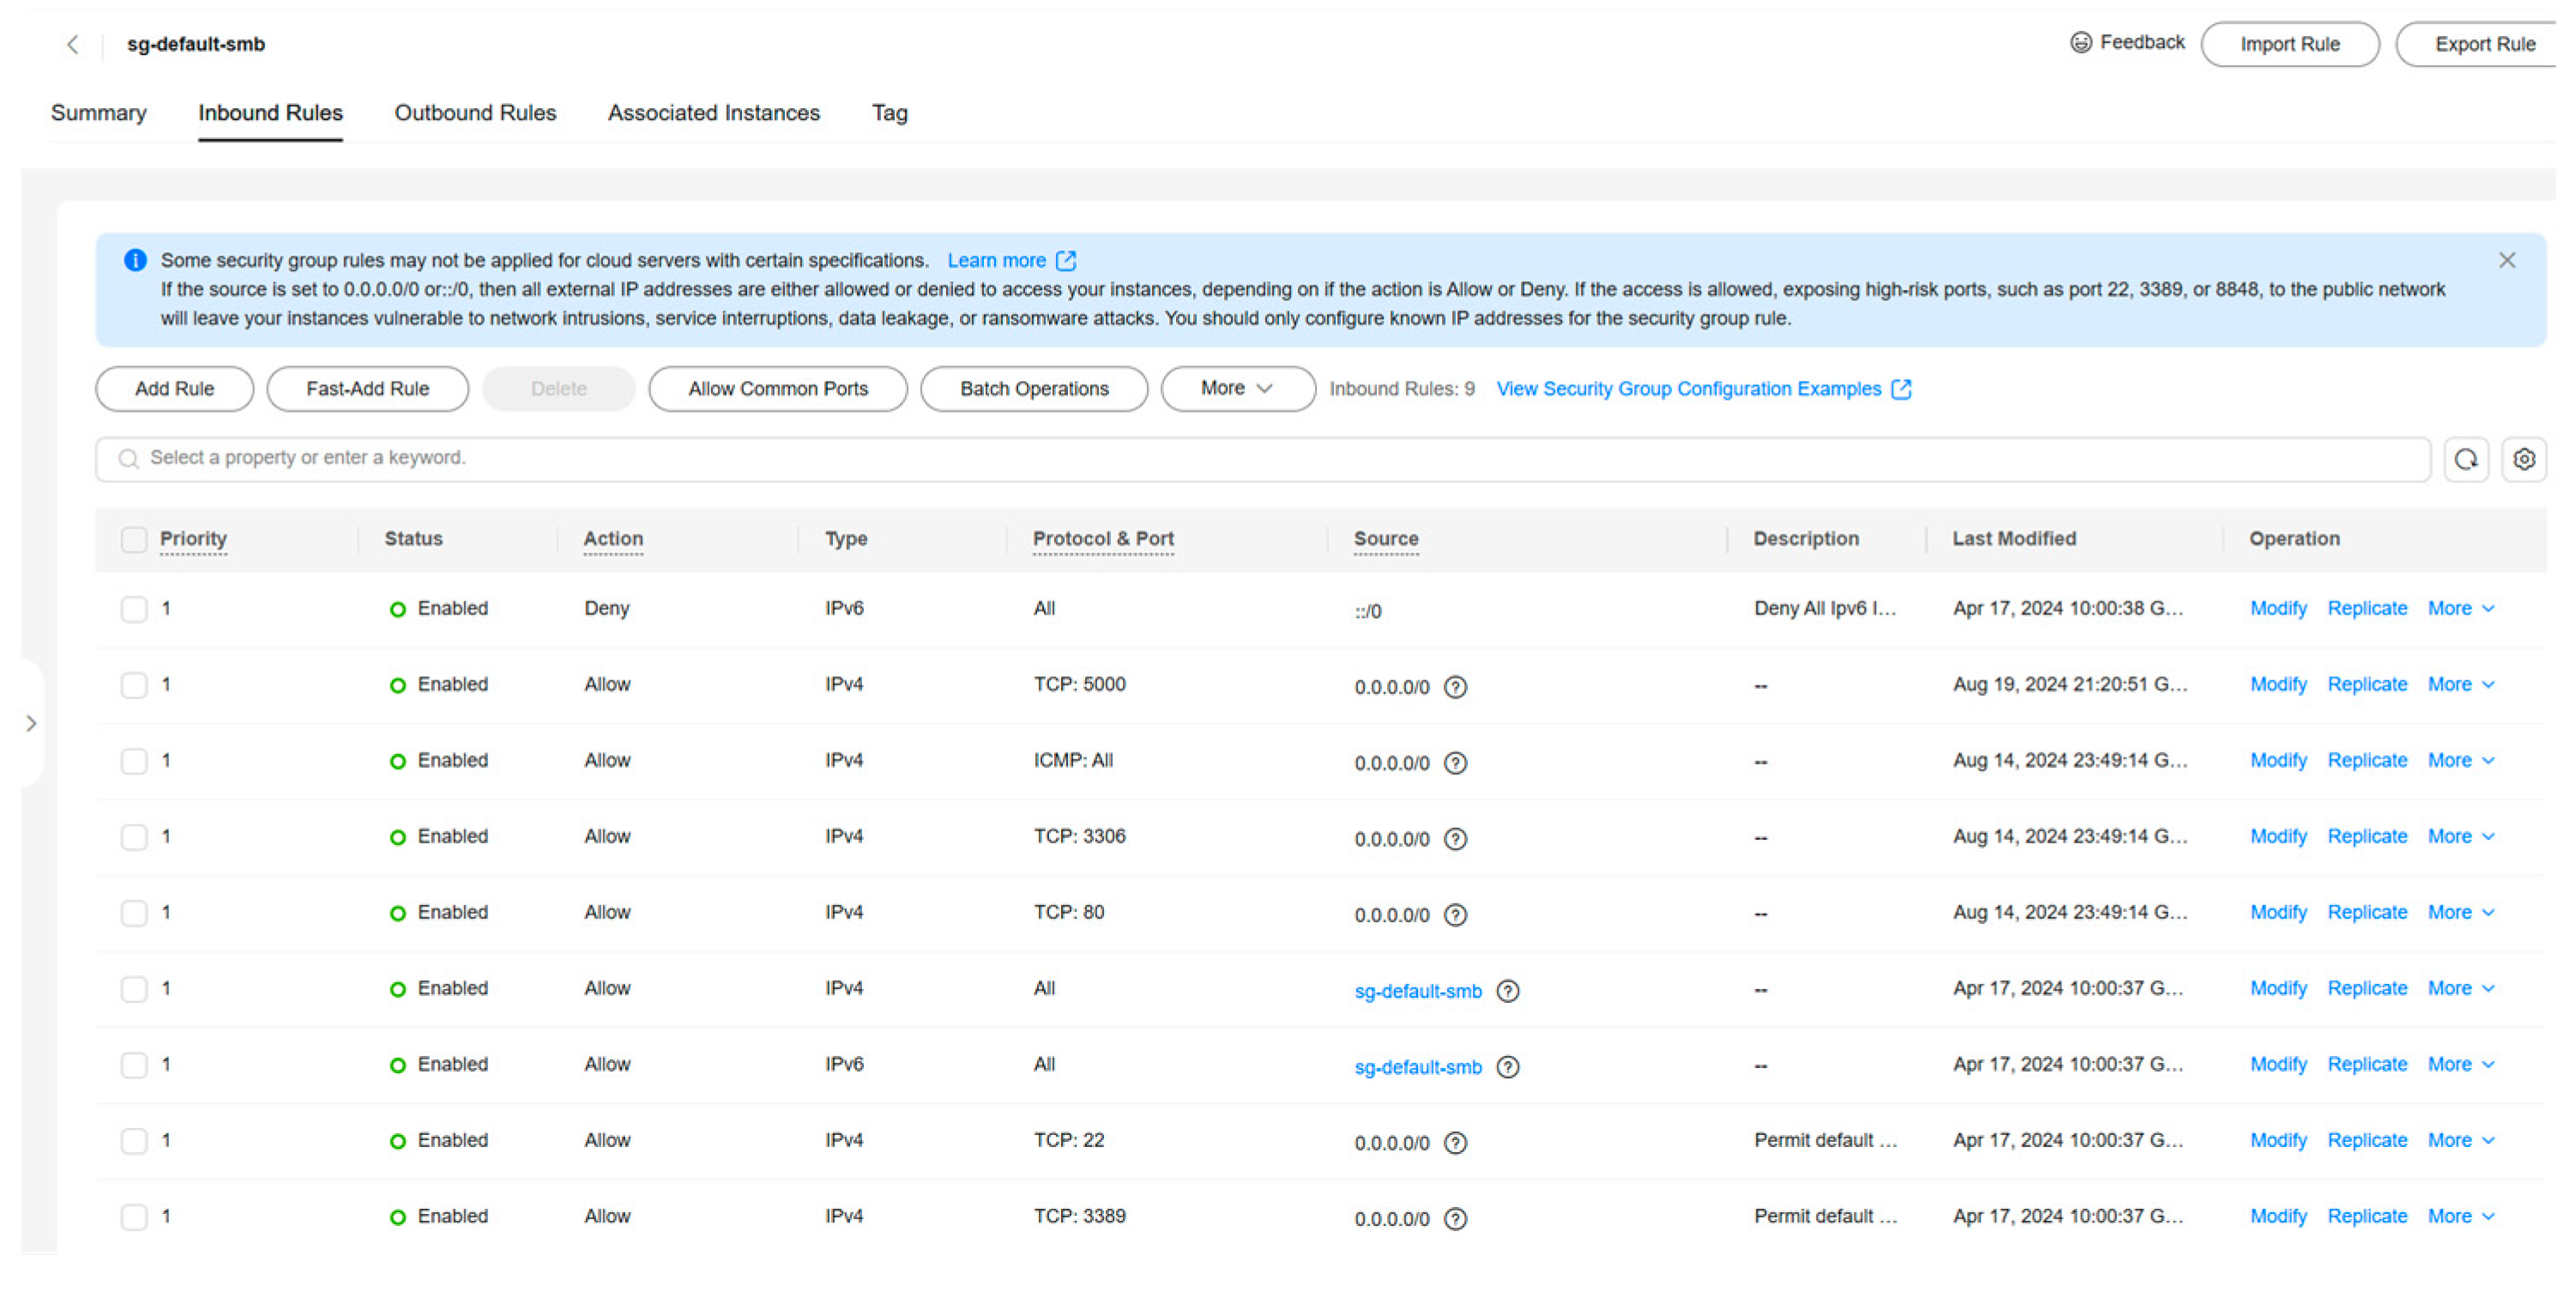
In the Cloud Services console, the security group management is executed to add rules for remote access to databases and web services. This involves opening specific ports, such as port 3306 for MySQL, port 80 for web services, and port 5000 for Pycharm-generated files, and allowing external access to those ports. The added results are shown in Figure 3.
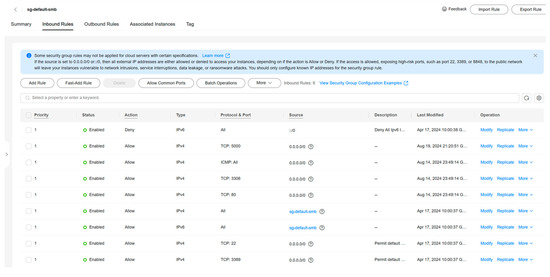
Figure 3.
Cloud service control security group.
- 4.
- Cloud Platform Access and Testing
After the configuration is completed, the accessibility of the database and web services is tested through a remote connection to ensure that the rules are in effect. A browser is used to access the cloud platform by entering the public IP address of the server at http://82.157.20.251:8080/tebao.php (accessed on 8 October 2024). The server’s public IP address must be properly configured and accessible via the Internet. The Cloud Platform URL login screen is shown in Figure 4.

Figure 4.
Logging in to cloud platform.
2.1.3. Data Modeling and Analysis
Modeling and analysis of data begin with data preprocessing, followed by data analysis, then evaluation of the results, and finally a cycle of updating.
- Data export and preprocessing
First, the data tables in the cloud server database are exported in CSV format. The exported data are preprocessed, including steps such as cleaning, removing irrelevant features, and dealing with missing values to ensure the quality and consistency of the data.
- 2.
- Data analysis
The data were analyzed using machine learning regression algorithms, including decision tree regression, support vector regression (SVR), k-nearest neighbor (KNN), and extreme gradient boosting (XGboost) regression algorithms. These algorithms were used for regression prediction of chilled water energy meter return temperatures.
- 3.
- Result Evaluation and Alarm
The prediction results are evaluated. If the predicted value exceeds the reasonable range of temperature difference between the chilled water supply temperature and the measured temperature, the buzzer sounds an alarm. The alarm data are exported in CSV format and imported into the database of the cloud server.
- 4.
- Large-screen display
The data export and import operation is operated continuously at a self-scheduled time to ensure that the data is up to date. Whenever the sensor collects new data or the company provides an updated CSV file, the system automatically imports and analyzes the data to keep it up to date.
2.1.4. Large-Screen Display
In the development of the method, the Pyecharts library was used for data visualization and display, and the generation of a variety of data charts was accomplished using the rich graphical components provided by Pyecharts. These charts display complex datasets and integrate and display different types of data intuitively. To achieve dynamic effects and enhance user interactivity, the map module in Pyecharts was used to add geolocation data. The charts present the analysis result of data and make the whole data system more interactive and intuitive for subsequent system optimization and improvement. In addition, the light weight and flexibility of the Pyecharts library enables rapid chart customization and data updates, ensuring that the visualization content is consistent with the actual data (Figure 5).
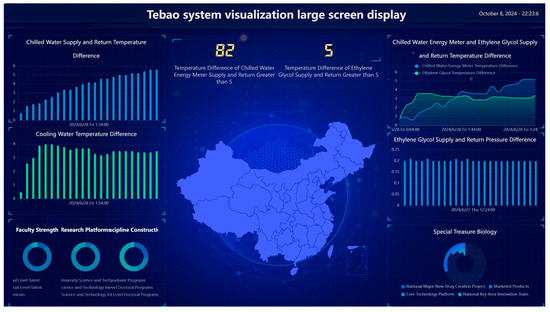
Figure 5.
Large-screen display.
In the chart content display, multiple sections are designed for different data dimensions. On the left of the display, the line graph of the temperature difference between the chilled water supply and return water is shown for monitoring the operation status of the chilled water system in real time. Below the line graph, the trend of temperature difference between the supply and return water of chilled water is shown to evaluate the efficiency of the chilled water system. Then, relevant information from Fuzhou University is displayed to provide scientific data support. On the right, the chilled water energy meter and the temperature difference are shown for the glycol supply and return water, which are particularly important in the operation of chilled water and glycol systems. Below the chilled water energy meter, the differential pressure change of the glycol supply and return water is shown. Then, the product development data of Tebao Bio are displayed.
All the charts and graphs are represented intuitively so that the information can be easily understood at a glance. In addition, in the center of the big screen, a map containing the main distribution cities of the company is displayed, and each city is marked with white dots so that users can quickly understand the company’s layout across the country.
3. Algorithm
Zhao et al. used machine learning models such as the BP neural network and random forest to predict the total energy consumption of air conditioners and proved that the BP neural network was better than the other models in predicting the total energy consumption of air conditioners [3]. Zeng et al. used a deep neural network to establish the operation energy efficiency model of two different types of chiller units. The outlet cooling water temperature model was also used with the chiller unit energy efficiency model. They optimized the operation parameters of the cold source system and the combination of chiller units and cooling towers and proved that the model saved energy by up to 19.6% in summer [4]. Therefore, we focused on the chilled water energy meter supply and return water temperature difference values for centralized air-conditioning systems, where the temperature difference was controlled to be within 5 °C to ensure that the system efficiently absorbed heat from the room while maintaining the economy and efficiency of the system.
3.1. Sources and Characteristics of Data
The temperature dataset provided by a company in Xiamen, China, contained 18 attributes, all of which included continuous variables. Out of these, 17 attributes were used as features of the predicted attribute and the chilled water energy meter return temperature.
3.2. Data Preprocessing
Before using the algorithm, all the data were preprocessed by scaling the values of the features to a specified range of [0,1]. The temperature dataset was split into the training and test data. Since the data were recorded every ten minutes, we selected a specific time for the training set, and the data after that time were used as the test data.
3.3. Modeling Algorithms
Different machine learning algorithms were used to predict the chilled water energy meter return temperatures of the central air-conditioning system and compare their performance metrics. The algorithms included decision tree regression, SVR, KNN regression, and XGBoost regression.
3.3.1. Decision Tree
The decision tree algorithm is a supervised learning method for predicting continuous numerical variables [5]. It splits the data into smaller subsets in a series of problems until specific conditions are met, such as reaching a leaf node or the variance of the data in a region being small enough. At each node, the algorithm selects a feature and a corresponding threshold to segment the data. The goal of feature selection is to find a feature based on which a segmentation minimizes the variance of the target variable in the subset. Commonly used segmentation criteria include minimized MSE or variances. Starting from the root node, the decision tree grows recursively by repeating feature selection and data segmentation until each leaf node contains data points that satisfy the stopping conditions. There are four stopping conditions for decision tree regression, the first being that the preset maximum tree depth is reached; the second is that the number of samples in the node is below a certain threshold; the third is that the variance of the target variable is below a certain threshold; and lastly, the fourth condition is that further segmentation does not significantly reduce the prediction error of the node. At a leaf node, the decision tree uses the average of the target values of all samples in that node as the predicted value. Decision tree regression typically uses the MSE as the loss function to measure the average of the squares of the differences between the predicted and actual values.
There are five main parameters of the decision tree regression algorithm. ‘Max_depth’ is used to limit the maximum depth of the tree to prevent the tree from becoming too complex and the maximum from being too large. Otherwise, it is prone to overfitting. ‘Criterion’ is used for the evaluation criteria of the feature attributes. ‘Splitter’ is used for the selection criterion of the feature dividing points and for assigning the values to ‘best’ and ‘random’. ‘Min_samples_leaf’ specifies the minimum number of samples that the leaf node must have. If the number of samples in the leaf node is less than this threshold, the node is not split anymore. ‘Min_samples_split’ specifies the minimum number of samples that the node needs before it splits. If the number of samples in the node is less than the threshold, the split is not continued. For the decision tree regression algorithm, the values of the criterion are MSE or MAE (1) and (2).
where m is the number of samples, is the actual value of the i-th sample, and is the predicted value of the i-th sample.
3.3.2. SVR
SVR is a type of support vector machine based which inherits the core concepts of SVM for classification and applies them to continuous-valued prediction problems [6]. The principle of SVR is to fit the data by minimizing the prediction error while maintaining a boundary (interval) such that the majority of the data points fall within this boundary. In SVR, the dataset is prepared in a feature matrix, and a target vector is preset according to the characteristics of the dataset after an interval band is defined with a spacing of 2ϵ. ϵ is a preset tolerance bias for determining the range of prediction error without computing loss. No loss is computed for the samples that fall within the interval bands, and loss is computed only if the data points fall outside the interval bands. The support vectors only affect its functional model. SVR tries to fit the data by finding a kernel function such that most of the data points fall within the interval band and minimizing the prediction error for data points outside the interval.
SVR uses an epsilon-insensitive loss function, which is given by
where is the actual value of the -th sample, is the predicted value of the i-th sample, and ϵ is the tolerance bias.
SVR is optimized to minimize the model complexity and prediction error, and the mathematical expression is
The constraints are
where and are the relaxation variables, ω is the weight vector of features, and C is the regularization parameter.
The algorithm improves the performance of the model by tuning , C, and kernel function selection. Larger ϵ values increase the bias but decrease the variance, while smaller ϵ values reduce bias but increase the variance. The parameter C presents the complexity of the model. Larger C values improve the fit of the model to the training data, thus reducing bias, but might overfit and increase variance. Smaller C values make the model simple by reducing the fit to the training data, thus increasing the bias but reducing the variance. The main kernel functions available are linear kernel, polynomial kernel, and radial basis function kernel (RBF).
To find the best combination of parameters, parameter optimization was performed using grid search combined with cross-validation. Grid search is a hyper-parameter optimization method to systematically traverse multiple combinations of hyper-parameters and find the best hyper-parameter settings through cross-validation to improve the performance of the model. The candidate values for each parameter used in this study were the candidate values of C of 0.1, 1, 10, and 100; the values of 0.1, 0.2, 0.5, and 1; and kernel types of ‘rbf’, ‘linear’, and ‘poly’.
By setting the parameter cv = 5, i.e., fivefold cross-validation, the performance of each set of hyper-parameter combinations was evaluated. By iterating the parameter combinations of these three parameters, the optimal parameter combination was obtained as {: 100, : 0.2, kernel: ‘linear’}.
3.3.3. KNN
KNN regression is a proximity-based regression method, which belongs to the category of nonparametric statistical methods [7]. An unknown target value is predicted by the average of its K-nearest neighbors (closest in distance in the feature space) or other weighted averages. The main parameter that affects the effectiveness of this model is the K_neighbors (K values), which determines the number of nearest neighbors used for prediction. Smaller K values cause the model to be sensitive to noise, while larger K values result in the model being too smooth to capture local variations in the data. Therefore, the method of calculating the distance impacts the effectiveness of the model. The main distance metrics include Euclidean distance (8) and Manhattan distance (9). At the same time, different distance metrics have different sensitivities to the data structure and different effects on improving the model performance.
3.3.4. XGBoost
XGBoost regression is an integrated learning algorithm based on gradient-boosting decision trees that are widely used in various prediction problems [8,9]. It minimizes an objective function by combining a loss function and a regularization term by incrementally adding new weak learners (usually decision trees). The regularization term includes the complexity of the tree, either as a sum of the number of leaf nodes of the tree or as a sum of the squares of the number of leaf nodes and the output values on the leaf nodes, to prevent overfitting. The algorithm optimizes the objective function using a second-order Taylor expansion, which approximates the loss function more accurately while allowing the user to customize the loss function as long as these functions have first- and second-order derivatives. The formula for training the loss function is as follows.
where θ is the model parameters, n is the total number of training samples, is the actual value of the -th sample, is the predicted value of the -th sample, and l is the loss of a single sample.
The regularization term is
where T is the number of leaf nodes, and w is the output value on the leaf node. γ and λ are the regularization parameters.
Therefore, the objective function is given by
where θ is the model parameters, n is the total number of training samples, is the actual value of the -th sample, is the predicted value of the -th sample, l is the loss of a single sample, Ω is the regularization term, T is the number of trees, and is the -th tree.
In gradient boosting, XGBoost computes the gradient and second-order partial derivatives to the loss function as a means of constructing a new tree. The gradient g and the second-order partial derivative h are given by
where denotes the th gradient of the individual features, and denotes the th of the second-order partial derivatives of the individual features.
In constructing a decision tree, XGBoost searches for the optimal split point to select the minimization objective function. When searching for the optimal splitting point, the gain from splitting is calculated, and its gain calculation takes into account the amount of reduction in the loss function and the amount of increase in the regularization term. Therefore, the fit of the model is improved to the training data while controlling the complexity of the model, thus avoiding overfitting.
There are four main parameters of the XGBoost algorithm. ‘n_estimators’ denotes the number of iterations, i.e., the number of constructed trees; ‘max_depth’ denotes the maximum depth of the tree, which is used to control the complexity of the model to prevent overfitting; ‘learning_rate’ denotes the step size, which is used to prevent overfitting; and ‘gamma’ denotes the minimum loss reduction required for the node splitting. The larger the value, the more conservative the model is.
4. Results and Discussion
We used MSE, a metric commonly used in regression tasks, to measure model performance. MSE is the average of the squares of the difference between the calculated predicted and actual values. It reflects the magnitude of the prediction error (15).
The three evaluation metrics obtained after the training and testing of each machine learning algorithm are shown in Table 1. The SVR algorithm showed the smallest MSE, only 0.09, indicating that the error between the predicted and actual values of SVR was very small, and the prediction effect was the best. The MSEs of the decision tree and XGBoost were relatively small, and the effect of these two algorithms was similar. The KNN regression algorithm showed a poorer effect than the other three algorithms. In general, SVR performed best in terms of metrics, while decision tree and XGBoost regression were inferior to SVR, but still with satisfactory results. SVR processed nonlinear relationships through the kernel technique, mapping the data into a high-dimensional space for linear regression, which is an SVR’s advantage for complex nonlinear problems.

Table 1.
Performance metrics of regression algorithms.
5. Conclusions
We developed and compared AI algorithms to predict energy consumption data and automate the generation and execution of energy-saving strategies. The algorithms were used to monitor various types of energy consumption in buildings in real time and efficiently process and predict data to accurately identify energy wastage and allocate resources for energy saving and emission reduction. At present, the construction of the platform model has been completed. Managers can carry out energy management through remote control, which ensures flexibility, efficiency, and convenience and provides a new technical means for energy management. In addition, the model enabled real-time data transmission for the real-time processing of energy data and an efficient energy management system. Using the algorithms, the model made energy predictions and alarms accurately and displayed data and results so that managers could regulate energy according to them. Due to the variety of energy usage, the model is currently applicable to the central air-conditioning system. Therefore, it is mandated to test the models for other energy systems. In addition, more data are required to improve the model and its performance. The model’s functionality needs to be improved in terms of intelligent data acquisition and analysis, and diverse types of energy management. The model can be improved by using smart sensors and IoT devices for real-time monitoring and iteratively updating smart algorithms.
Author Contributions
Conceptualization, Q.Z.; methodology, X.B.; software, C.L.; validation, S.X. and H.X.; resources, Y.L.; data curation, Q.Z.; writing—original draft preparation, H.L.; writing—review and editing, X.B.; visualization, J.C.; supervision, Z.-J.L.; funding acquisition, Y.L. All authors have read and agreed to the published version of the manuscript.
Funding
This research was supported the Fujian Province Natural Science Foundation of China under Grant No. 2024J08236.
Institutional Review Board Statement
The Institutional Review Board Statement is currently unavailable.
Informed Consent Statement
Informed consent was obtained from all the subjects involved in this study.
Data Availability Statement
Data are available upon reasonable request. Please contact the corresponding author.
Acknowledgments
This research was supported by Fuzhou University and Tebao Company.
Conflicts of Interest
The Xiamen Amoytop Biotech Co. Ltd. and Tebao Company employs Qunshan Zhou, ensuring there are no conflicts of interest. The remaining authors declare that the research was conducted in the absence of any commercial or financial relationships that could be construed as a potential conflict of interest.
References
- Zhang, X. Research on the application of energy management and energy saving strategies in intelligent buildings. Intell. Build. Smart City 2024, 9, 117–119. [Google Scholar] [CrossRef]
- Yang, S.; Yang, D. Application of Artificial Intelligence in Smart Buildings. Intell. Build. Smart City 2020, 3, 30–33. [Google Scholar] [CrossRef]
- Zhao, Y. Research on Prediction and Optimization of Air-Conditioning Energy Consumption in a Campus Building Based on Big Data Analysis and Machine Learning; Taiyuan University of Technology: Taiyuan, China, 2023. [Google Scholar] [CrossRef]
- Zeng, W.; Yang, W.; Yan, B.; Ye, H.; Zhang, W.; Zhang, K. Research on optimal operation of chiller based on intelligent algorithm. Low Temp. Supercond. 2023, 51, 66–73. [Google Scholar] [CrossRef]
- Modhugu; Reddy, V.; Ponnusamy, S. Comparative Analysis of Machine Learning Algorithms for Liver Disease Prediction: SVM, Logistic Regression, and Decision Tree. Asian J. Res. Comput. Sci. 2024, 17, 188–201. [Google Scholar] [CrossRef]
- Tanveer, M.; Rajani, T.; Rastogi, R.; Shao, Y.H.; Ganaie, M.A. A comprehensive review on twin support vector machines. Ann. Oper. Res. 2024, 339, 1223–1268. [Google Scholar] [CrossRef]
- Xu, L.; Lin, J.; Yang, Y.; Zhao, Z.; Shi, X.; Ge, G.; Qian, J.; Shi, C.; Li, G.; Wang, S.; et al. Ultrahigh thermal stability and piezoelectricity of lead-free KNN-based texture piezoceramics. Nat. Commun. 2024, 15, 9018. [Google Scholar] [CrossRef] [PubMed]
- Patel, S.K.; Wekalao, J.; Mandela, N.; Al-Zahrani, F.A. Design of encoded graphene-gold metasurface-based circular ring and square sensors for brain tumor detection and optimization using the XGBoost algorithm. Diam. Relat. Mater. 2024, 148, 111439. [Google Scholar] [CrossRef]
- Ramraj, S.; Uzir, N.; Sunil, R.; Banerjee, S. Experimenting XGBoost algorithm for the prediction and classification of different datasets. Int. J. Control Theory Appl. 2016, 9, 651–662. [Google Scholar]


Disclaimer/Publisher’s Note: The statements, opinions and data contained in all publications are solely those of the individual author(s) and contributor(s) and not of MDPI and/or the editor(s). MDPI and/or the editor(s) disclaim responsibility for any injury to people or property resulting from any ideas, methods, instructions or products referred to in the content. |
© 2025 by the authors. Licensee MDPI, Basel, Switzerland. This article is an open access article distributed under the terms and conditions of the Creative Commons Attribution (CC BY) license (https://creativecommons.org/licenses/by/4.0/).