Abstract
We applied processing technology to detect and diagnose liver tumors in patients. The cancer imaging archive (TCIA) was used as it contains images of patients diagnosed with liver tumors by medical experts. These images were analyzed to detect and segment liver tumors using advanced segmentation techniques. Following segmentation, the images were converted into binary images for the automatic detection of the liver’s shape. The tumors within the liver were then localized and measured. By employing these image segmentation techniques, we accurately determined the size of the tumors. The application of medical image processing techniques significantly aids medical experts in identifying liver tumors more efficiently.
1. Introduction
Liver disease, particularly liver tumors, has become a significant global health concern [1]. According to the World Health Organization (WHO), liver cancer is the most common cancer in the world and is the main cause of death. In 2023, 745,000 patients died of liver cancer worldwide [2]; hepatic cell carcinoma (HCC) accounts for about 80% of all primary liver cancers and most patients with chronic liver disease have HCC. The incidence of liver tumors has increased due to various factors, including viral infections such as hepatitis B and C, excessive alcohol consumption, and metabolic disorders such as non-alcoholic fatty liver disease (NAFLD). Liver tumors are classified into benign and malignant types, with hepatocellular carcinoma (HCC) being the most common primary malignant tumor [3].
Early detection and accurate diagnosis of liver tumors are crucial for effective treatment and improved patient outcomes. However, traditional diagnostic methods, such as ultrasound, computed tomography (CT scans), and magnetic resonance imaging (MRI), often require extensive expertise and are time-consuming. This is why advanced image processing techniques are required to streamline and enhance the diagnostic process. By leveraging the capabilities of medical image processing, specifically with segmentation methods, liver tumors are automatically detected and measured with high precision. This technological advancement supports medical experts in making fast and accurate diagnoses and contributes to better treatment planning and monitoring of liver tumor progression.
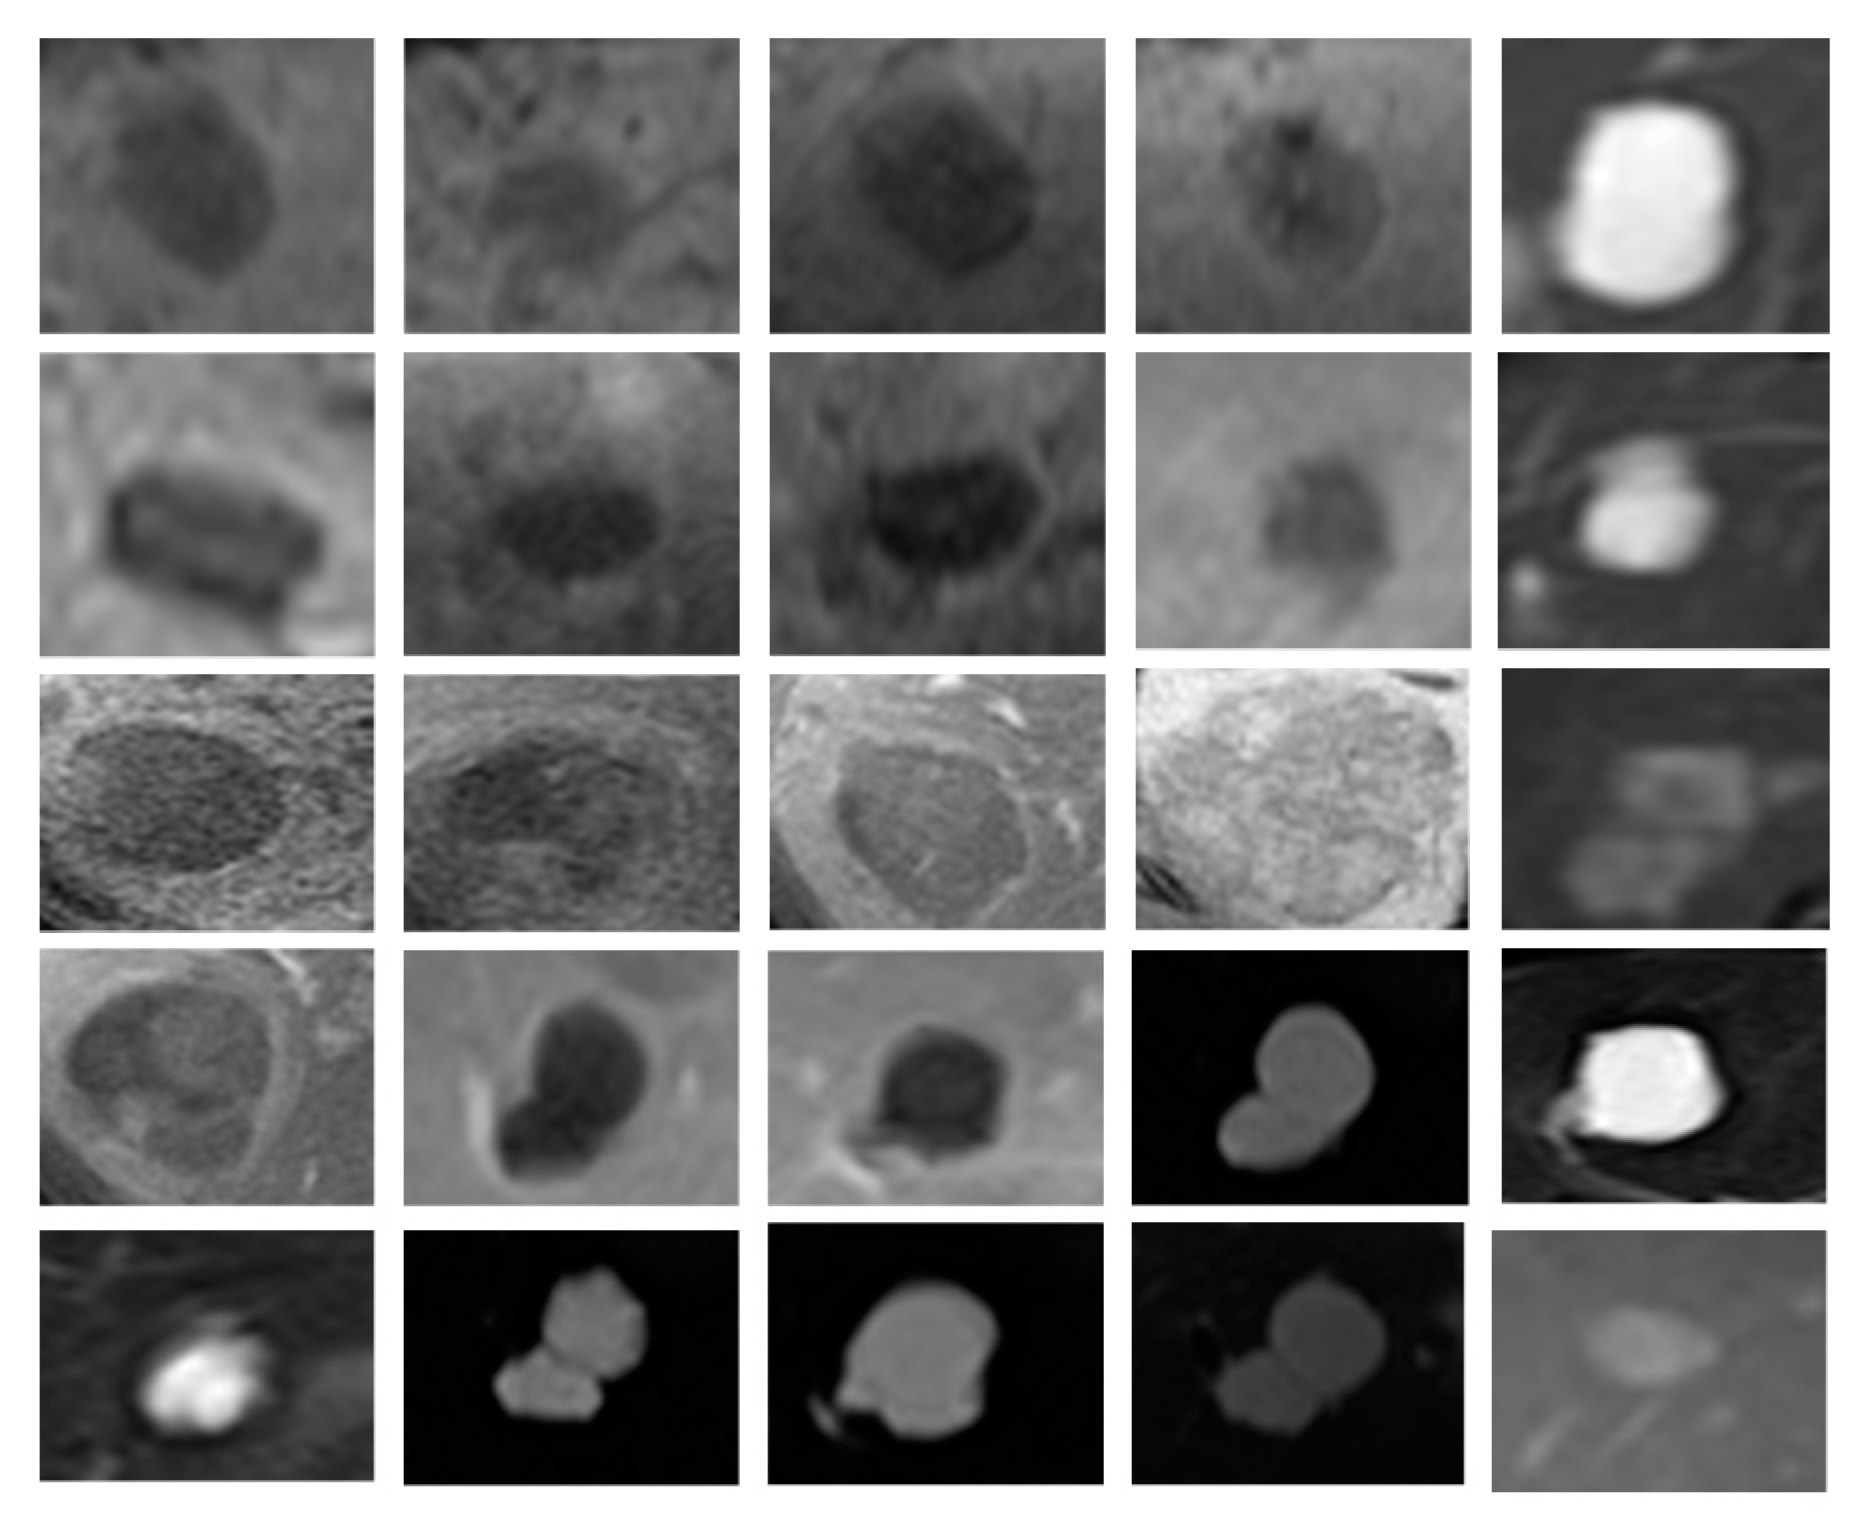
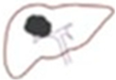
In this study, we explored the application of image processing technology in diagnosing liver tumors (Figure 1), utilizing a dataset from the cancer imaging archive (TCIA). Using segmentation techniques, we improved the detection, localization, and measurement of liver tumors, ultimately aiding in the fight against liver disease.

Figure 1.
Images of tumors in TCIA.
2. Methodology
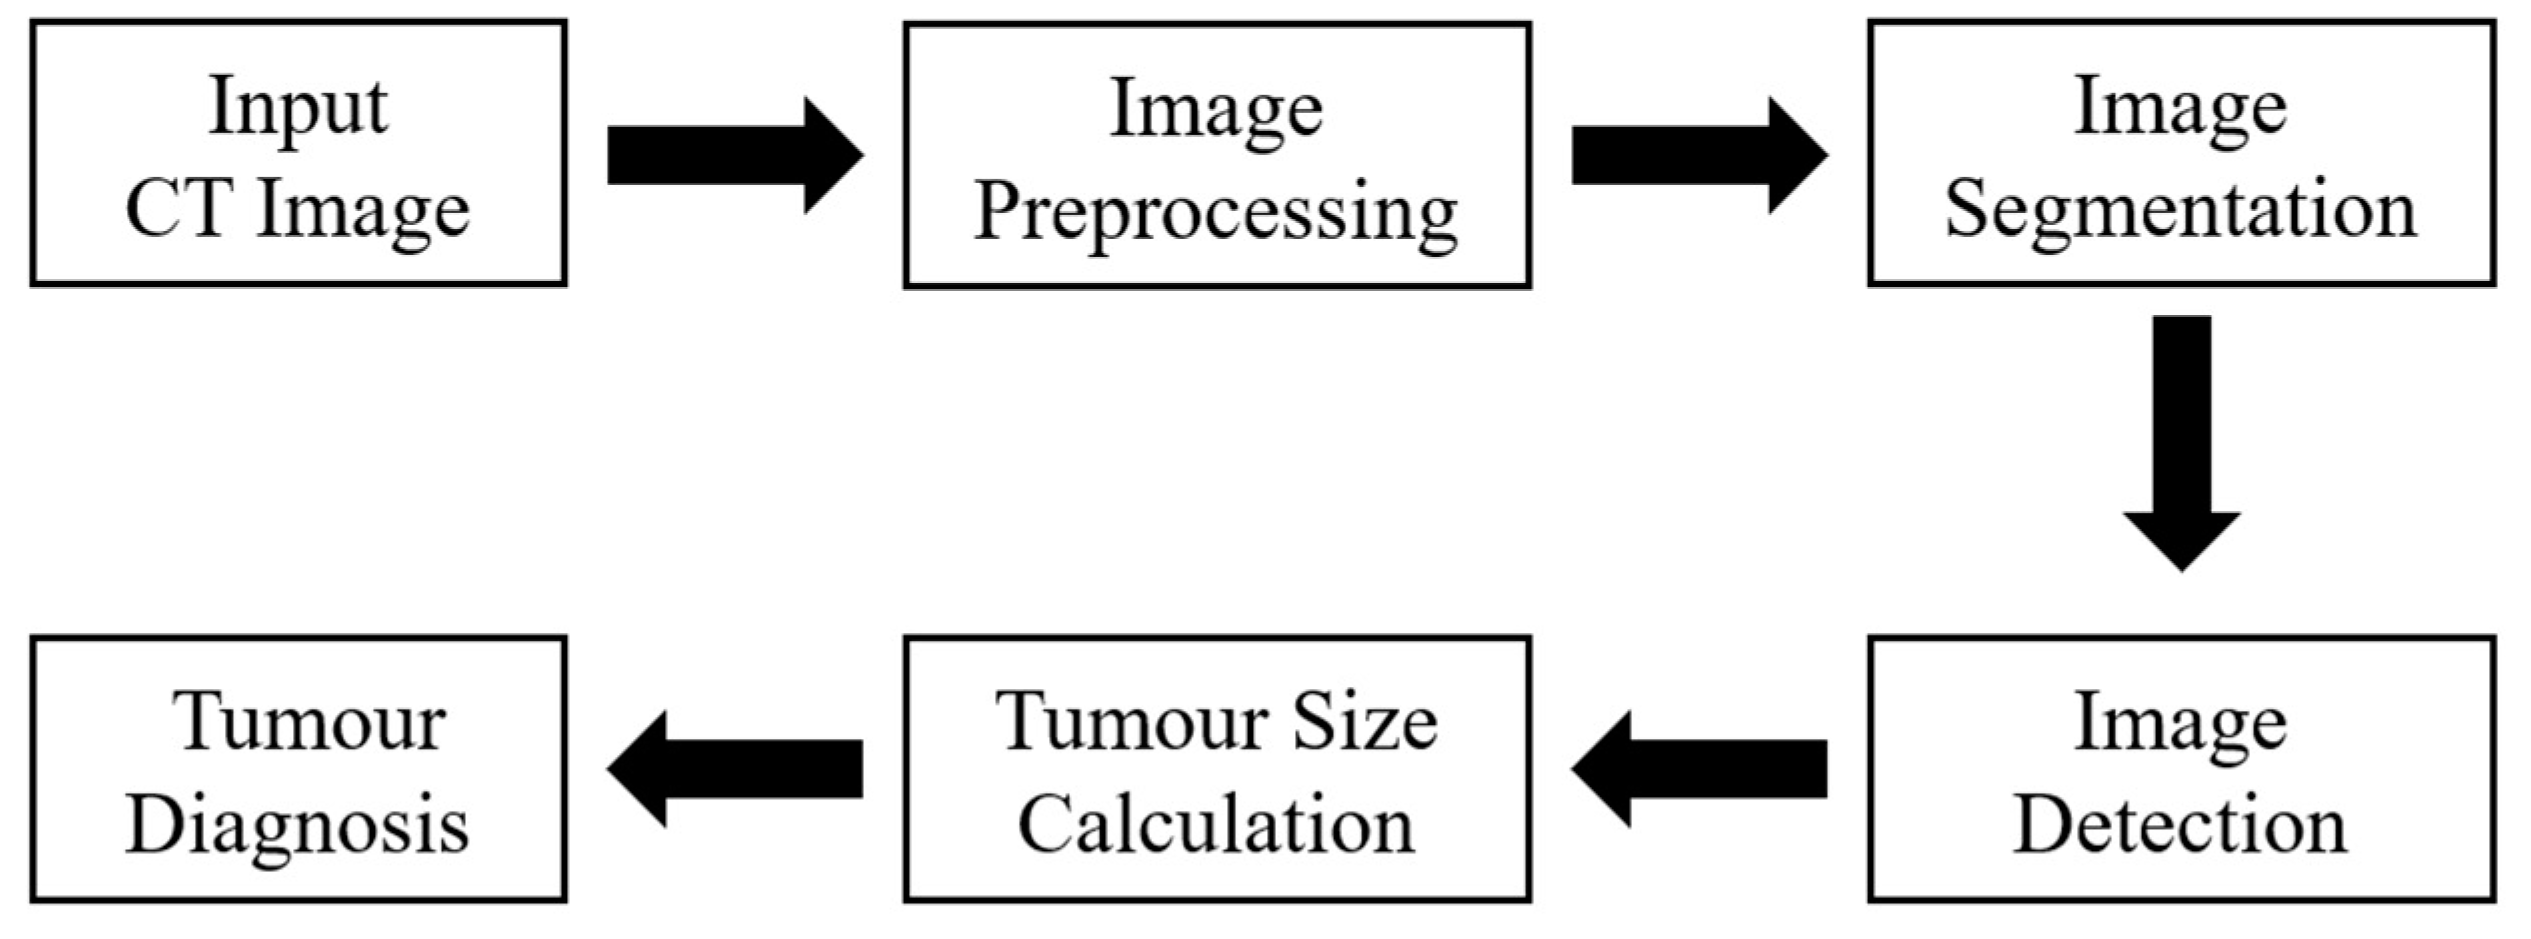
TCIA includes the information of patients diagnosed with liver tumors. This dataset includes a rich collection of CT and MRI scans, providing a variety of imaging modalities for a comprehensive analysis. Each image is annotated by medical professionals, ensuring a high level of accuracy in identifying and classifying liver tumors for subsequent image processing, outlined in Figure 2.

Figure 2.
Image processing for liver tumor detection and diagnosis.
To prepare the data for analysis and enhance image quality and consistency across the dataset, preprocessing techniques such as image normalization and Gaussian smoothing were applied in this study. We addressed challenges such as variability in tumor appearance and image noise. By employing robust segmentation techniques and expert annotations, the accuracy and reliability of liver tumor detection were improved. The performance of the system was evaluated using metrics such as accuracy, sensitivity, and specificity, ensuring that the final diagnosis is both reliable and clinically relevant.
2.1. Image Dataset
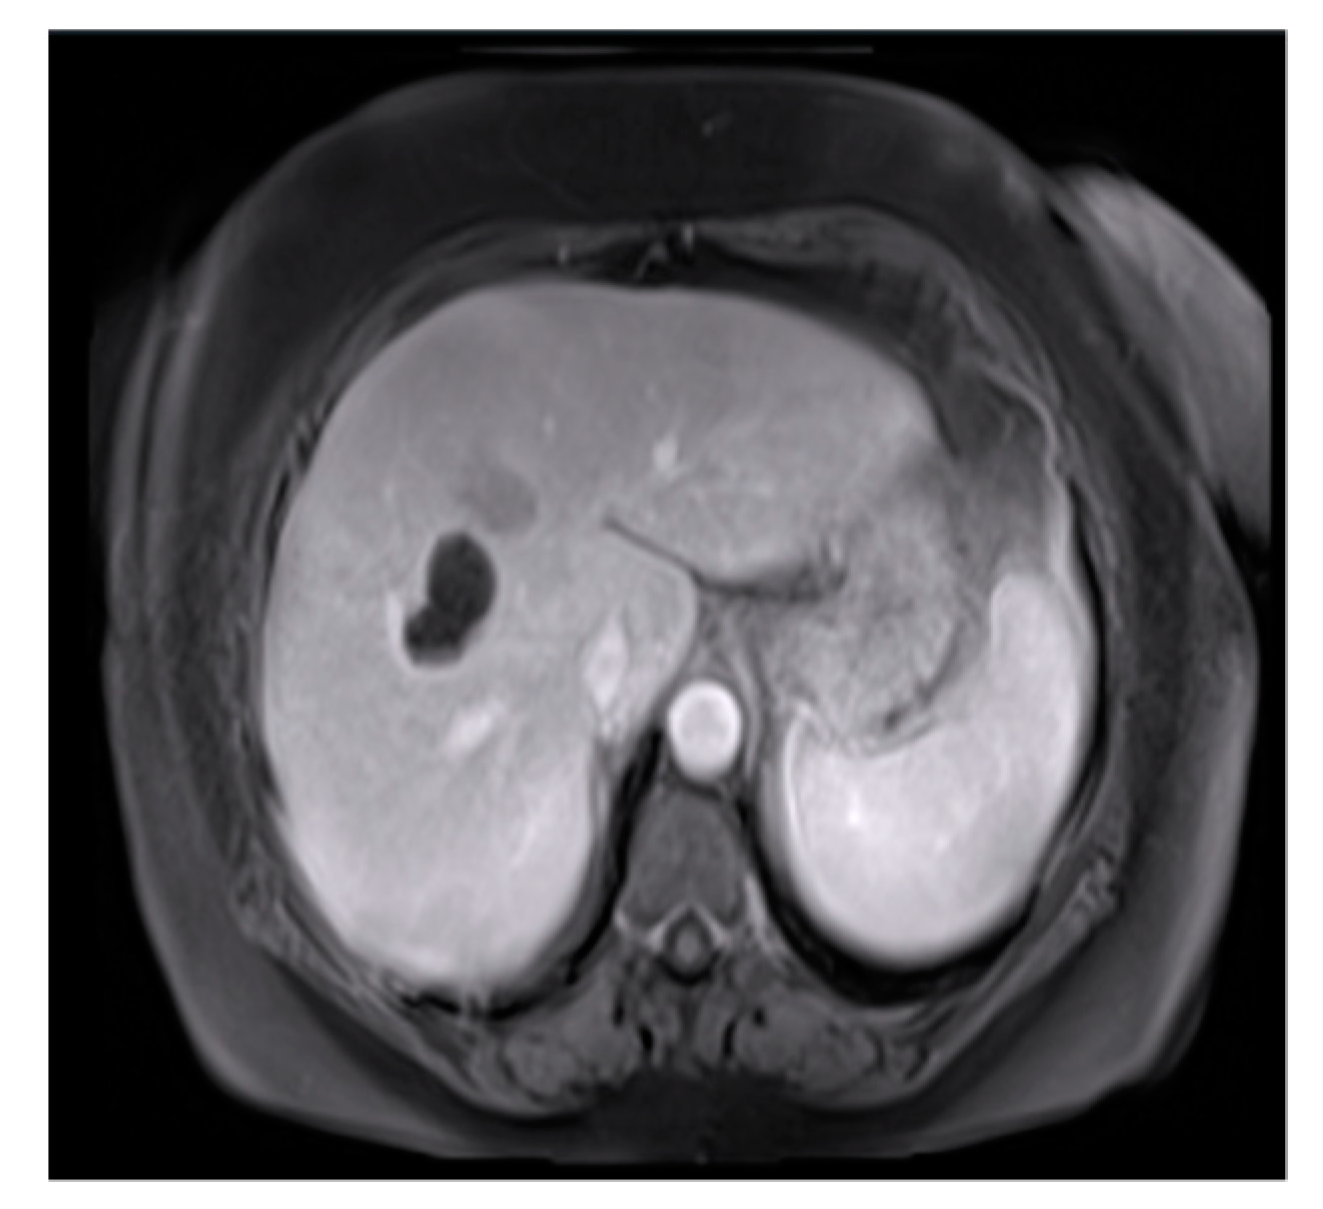
The dataset utilized in this study was the cancer genome atlas liver hepatocellular carcinoma (TCGA-LIHC) data [4]. We related cancer phenotypes to genotypes by providing clinical images of TCGA [5]. Clinical, genetic, and pathological data were obtained from the Genomic Data Commons (GDC) data portal, while the radiological data were collected from TCIA. The original image size was 256 × 256 pixels and extracted to conduct preliminary testing and analysis (Figure 3). Figure 3 showcases the practical application of the processing techniques on the dataset [6].
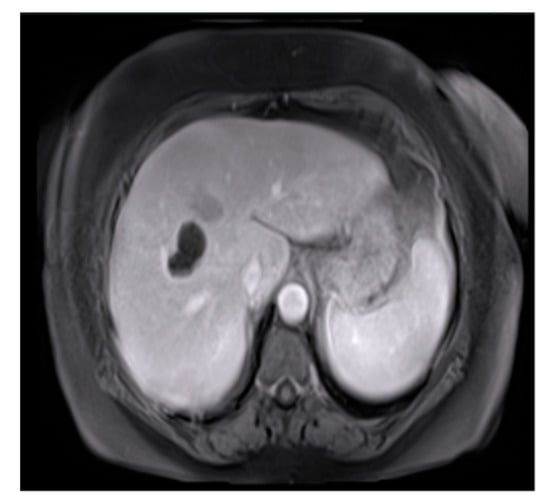
Figure 3.
Original image.
2.2. Image Preprocessing
Image preprocessing is essential in ensuring the quality and accuracy of image analysis, particularly in medical image processing. First, image quality is improved by removing or minimizing noise and artifacts, making images clearer and easier to analyze. Image preprocessing is conducted to identify important details effectively. Additionally, images are preprocessed and normalized under different conditions, making the data more consistent and easier to compare.
We used different techniques to enhance image quality. Since CT images are grayscale, we applied noise removal techniques using the median filter to reduce noise and smooth the image while preserving edge details. Gaussian filter smoothing is then applied with a sigma value of 0.25 to reduce noise and create a smoother surface. The sharpen function was used to sharpen the image after Gaussian smoothing, with defined parameters for radius and amount of sharpening. Brightness was adjusted to modify the brightness of the sharpened image, with the gamma parameter set to 0.75, and adjust the brightness accordingly. Finally, artifacts such as rings (artificial rings) or streaks (artificial stripes) were detected and corrected to ensure the image was accurate and efficient for subsequent processing and analysis. The grayscale conversion was performed to reduce unnecessary information and focus on the light intensity of the image. This is crucial for CT images, where variations in light and dark represent the density of different tissues, particularly tumors. In image preprocessing, we combined the results of different methods logically for the next steps.
2.3. Image Segmentation and Detection
2.3.1. Structural Location of Liver
In image segmentation, we highlighted the liver in the image to easily and automatically identify it in CT scans [7]. CT images include many parts of the human body [8], so we used an image segmentation model in MATLAB (version R2024a). The process automatically proceeded to the image segmentation stage, applying the specific region of interest (ROI) function. The K-means clustering technique algorithm was used. The ROI function was used to blur, highlight, and apply a brightness threshold, where pixels with high values were considered a part of the ROIs. After identifying the liver, the image was converted to a binary image, as shown in Figure 4.
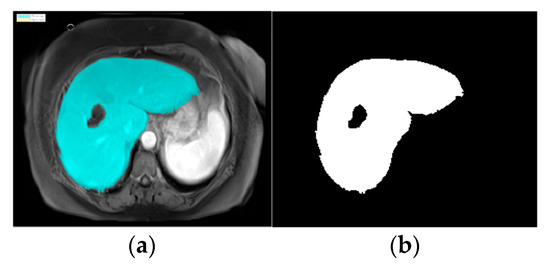
Figure 4.
Images of parts of liver and tumors in liver: (a) ROI masking and (b) liver structure in binary code.
The watershed algorithm treats the image as a topographic surface, where pixel intensities represent the height of the surface. It identifies the boundaries of the liver by stimulating the flow of water, filling up the low-intensity regions (background) while keeping the high-intensity regions (liver) separate. After applying the watershed, the identified liver region was converted to a binary image, as shown in Figure 5. This segmentation process made it easier to locate the liver and subsequently focuses on detecting any abnormalities or tumors.
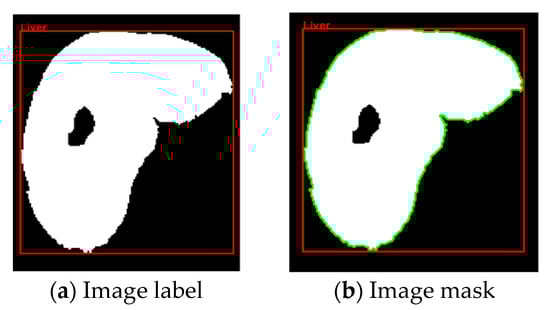
Figure 5.
Labeled and masked image automatically labeled and contoured.
2.3.2. Liver Image Recognition
After the liver image was converted into a binary image, we used a technique to help the doctor conveniently determine the structure of the liver during the medical examination, allowing for a more specific analysis of tumor detection [9]. In the data presented, we selected information from a patient with a large tumor. In image segmentation, the image was automatically labeled and masked to obtain information on the labeled object in the binary image shown in Figure 5. In the labeling and contouring process, several objects were removed, and the pixel threshold was adjusted. The information of the labeled object was determined based on the boundaries in the label, utilizing metrics such as bounding box, area, and perimeter. Identifying and locating the structure of the liver enabled accurate tumor detection in the liver using binary images.
2.3.3. Detecting Liver Tumors
We calculated the size of the tumor by using the bwconncomp function to determine the coordinates and location of the tumor from the binary values of the tumor to calculate the size of the tumor.
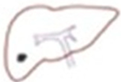
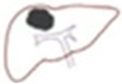
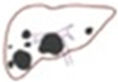
The surface of the image was calculated only in the area with the outline. We applied images of a patient with multiple tumors (Figure 6). When there were multiple tumors, the location of the pixel with index 1 appeared at different locations on the surface of the binary image.
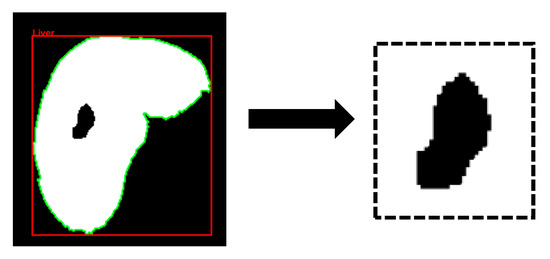
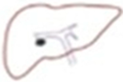
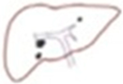
Figure 6.
Tumor images detected as binary.
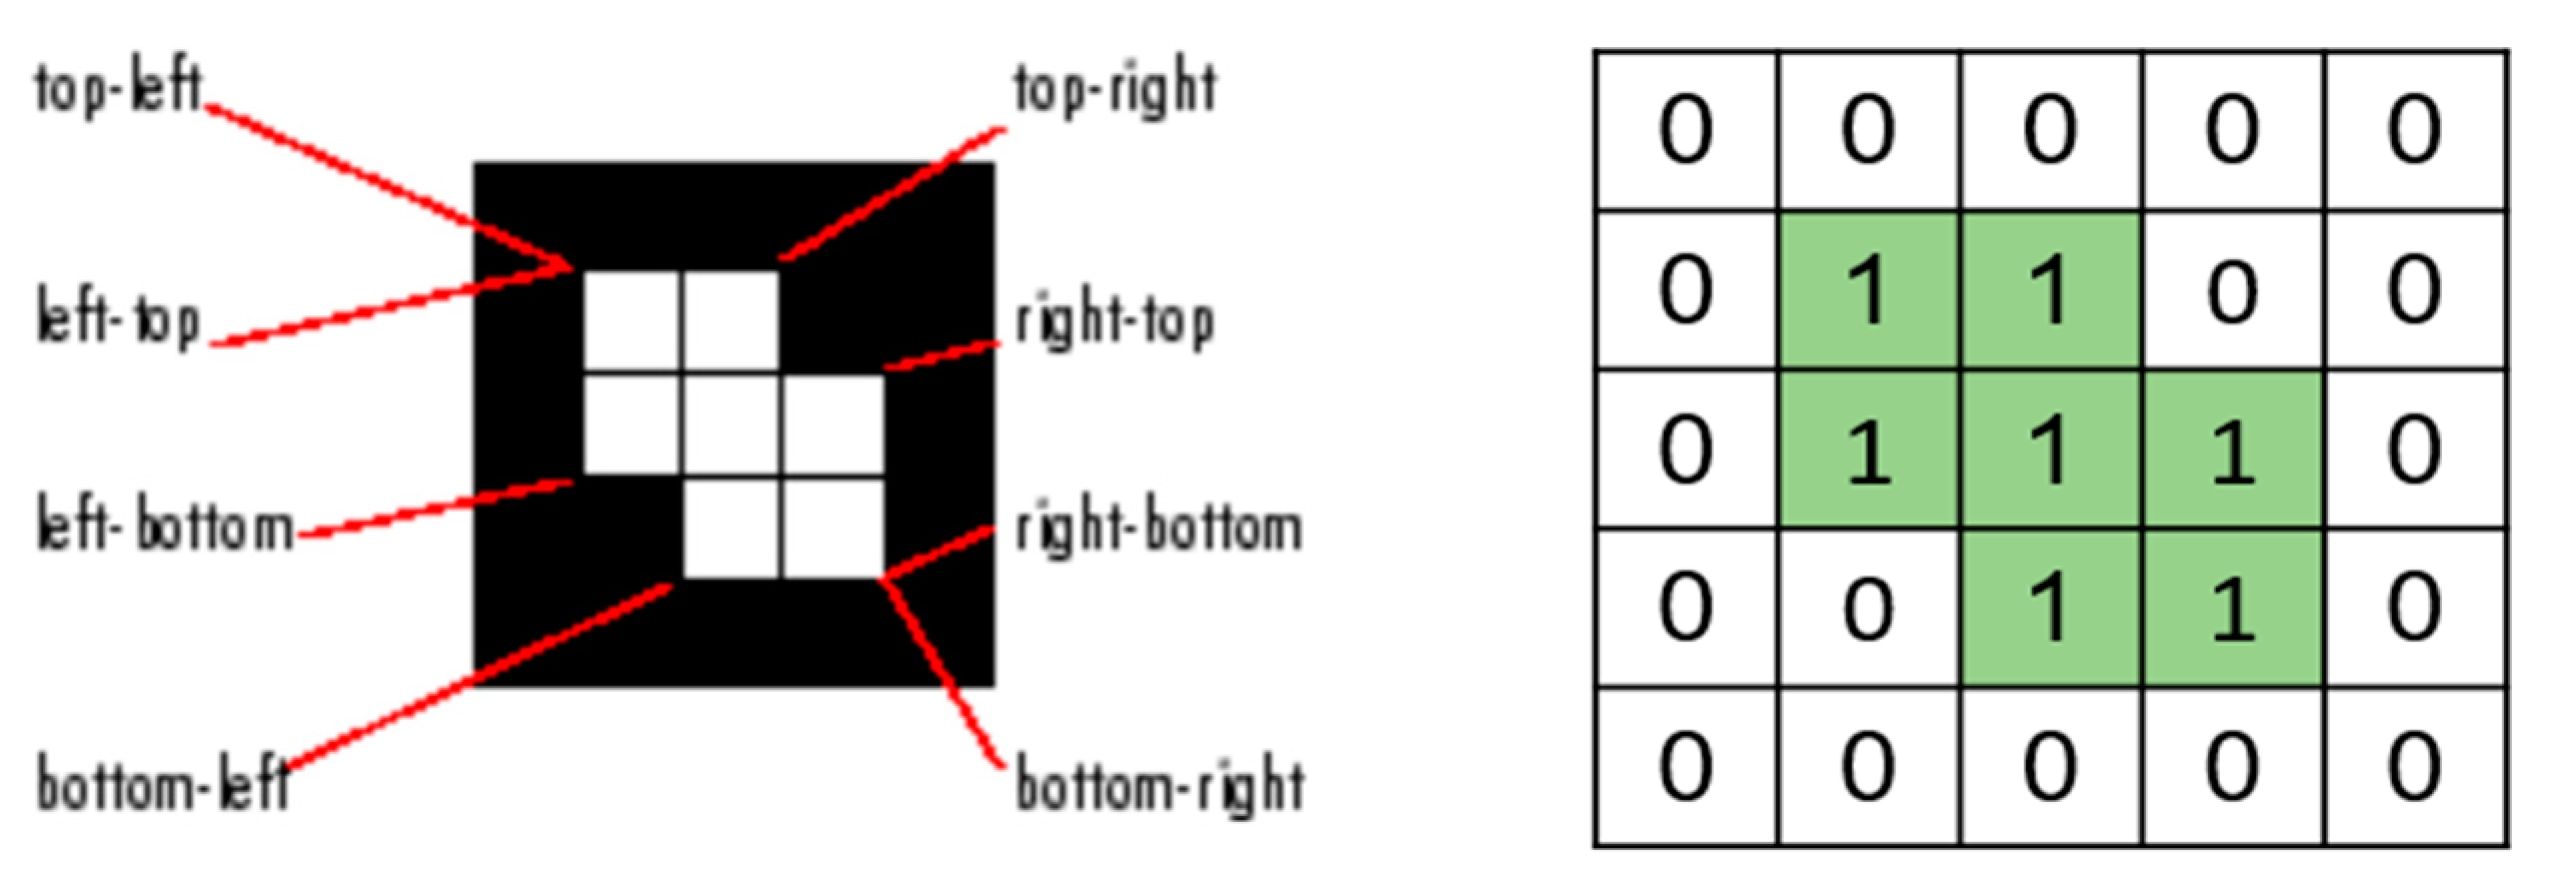
In these cases, it is essential to accurately identify and separate each tumor as an independent connected component. This was carried out by using two-dimensional connectivity to define how pixels were connected to their neighboring pixels (Figure 7). There are two primary types of connectivity: 4-connectivity and 8-connectivity. In 4-connectivity, pixels are connected if they share edges either horizontally or vertically. In 8-connectivity, pixels are connected if they share edges or corners, meaning connections are made diagonally, horizontally, or vertically. In the case of multiple tumors, 8-connectivity is particularly useful because it allows the function to detect each tumor, even if they are positioned in different parts of the image or have irregular shapes. Each connected group of pixels is treated as a separate object, enabling the algorithm to measure the area and other properties of each tumor independently. This approach is crucial to comprehensively analyze the patient’s condition, and the size, shape, and location of each tumor must be considered for accurate diagnosis and treatment planning.
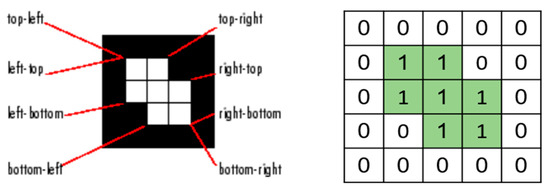
Figure 7.
Two-dimensional connectivity.
In this study, we combined advanced image processing techniques with detailed clinical data to improve the accuracy of tumor detection and size estimation. By converting pixel-based measurements from medical imaging scans into real-world dimensions, we precisely determined the physical size of the tumor. The number of pixels representing the tumor in the image was multiplied by the pixel spacing (in millimeters) to compute the actual size of the tumor. This approach is particularly useful in identifying and measuring tumors that may not be easily detectable through traditional methods.
Tumor Size (mm) = Number of pixels × Pixel size (mm/pixel)
This method ensures a high level of precision, especially when tumors have irregular shapes or when multiple tumors are present in the same image. By accurately calculating the size of each tumor, we obtained essential information from medical professionals that aids not only in diagnosis but also in long-term patient monitoring and treatment planning. In particular, early detection of tumor size was significantly enhanced and allowed for timely intervention before the tumor progressed to a more advanced stage.
2.4. Diagnosing Liver Tumors
The stages of HCC range from stage I (1) to stage IV (4). The diagnosis of the tumor’s stage is based on several factors: the extent (size) of the tumor (T), the spread to nearby lymph nodes (N), and the spread (metastasis) to distant sites (M). In this prediction, we diagnosed the grade of the tumor based on the calculated size of the tumor (T) and the number of tumors present in the liver, as outlined in Table 1.

Table 1.
International Cancer Control (UICC) liver staging system [10].
Table 2 provides comprehensive criteria for categorizing tumors into stages T1 to T4 and the classification of HCC. This classification is based on three key factors: the number of tumors, the size of the largest tumor, and the presence of vascular or bile duct invasion. The tumor stage is determined by evaluating how many of these criteria are met, with the cancer being classified into the corresponding stage accordingly. To ensure an objective diagnosis of the tumor stage, we accurately calculated the tumor size, along with data provided by tumor diagnosis experts. This combination of quantitative measurement and expert assessment allows for a reliable staging process for guiding treatment decisions.
Table 2.
Liver tumor T-stage classification.
- T1: All three criteria are fulfilled, indicating a solitary tumor smaller than 2 cm with no vascular or bile duct invasion.
- T2: Either a single tumor larger than 2 cm (4/5 inch) that has grown into blood vessels, or more than one tumor but none larger than 5 cm (about 2 inches) across (T2).
- T3: More than one tumor, with at least one tumor larger than 5 cm across (T3).
- T4: None of the criteria are fulfilled, suggesting multiple tumors or more advanced cases, including larger tumors and potential vascular invasion.
3. Results and Discussion
The results of this study demonstrate the effectiveness of image preprocessing, segmentation, and tumor detection techniques in analyzing HCC using the TCGA-LIHC dataset. The image preprocessing significantly improved the quality of CT images by removing noise and smoothing surfaces, allowing clearer observation of critical details such as the liver and surrounding tissues. We incorporated Gaussian smoothing in noise reduction while preserving essential structural details and enhancing the visibility of the liver and potential tumors.
Following the application of the watershed algorithm, we successfully segmented the liver region and converted it into a binary image (Figure 4), facilitating precise tumor detection and recognition shown in Figure 5. The implementation of 8-connectivity during segmentation further ensured the accurate identification of multiple tumors, including those with complex shapes. This approach enables the effective differentiation of tumors from surrounding tissues, leading to reliable tumor size estimations.
In tumor diagnosis, both the size of each tumor within the liver and the number of tumors detected are critical. We selected a case of a patient diagnosed with HCC and applied image processing techniques from the dataset to determine the actual tumor size, which was larger than 2 cm. Tumor diagnosis necessitates consideration of various factors associated with the tumor’s stages. We emphasize specific characteristics, including the T stage, as indicated in Table 2; the liver condition assessment (Table 1); and the tumor size calculation index based on pixel measurements. This methodology allows for an objective prediction of the tumor’s status. Moreover, accurately predicting the patient’s liver condition significantly reduces the time required by clinicians, while the application of image processing techniques enhances the efficiency of tumor identification and diagnosis.
4. Conclusions
The application of special medical image processing techniques in detecting tumors in the liver contributes to the detection and analysis of tumors in the human liver. Accurately calculating the size of the tumor provides important information for early diagnosis and effective treatment planning. By combining image processing techniques with clinical data, we developed a reliable method to assist medical professionals in the diagnosis and treatment of liver disease. The results of the analysis of the extent of the tumor and concluding treatment help reduce time and enable highly effective tumor diagnosis.
Author Contributions
Conceptualization, V.-K.N. and C.-A.C.; methodology, V.-K.N.; software, V.-K.N.; validation, V.-K.N., C.-Y.H. and B.-Y.L.; formal analysis, V.-K.N.; investigation, V.-K.N.; resources, C.-A.C.; data curation, V.-K.N.; writing—original draft preparation, V.-K.N.; writing—review and editing, C.-A.C., C.-Y.H. and B.-Y.L.; visualization, V.-K.N.; supervision, C.-A.C.; project administration, C.-A.C.; funding acquisition, C.-A.C. All authors have read and agreed to the published version of the manuscript.
Funding
This work was supported, in part, by the National Science and Technology Council (NSTC), Taiwan, under grant number 113-2221-E-131-026.
Institutional Review Board Statement
Not applicable.
Informed Consent Statement
This research did not involve direct interaction with humans or animals. The data utilized in this study were obtained from publicly available datasets, including TCIA and TCGA-LIHC, which are fully anonymized and adhere to ethical guidelines. Therefore, ethical review and approval were not required.
Data Availability Statement
Open data source at [5].
Conflicts of Interest
The authors declare no conflicts of interest.
References
- Younossi, Z.M.; Wong, G.; Anstee, Q.M.; Henry, L. The Global Burden of Liver Disease. Clin. Gastroenterol. Hepatol. 2023, 21, 1978–1991. [Google Scholar] [CrossRef] [PubMed]
- National Cancer Control Institute. Cancer Facts and Figures 2010; National Cancer Center: Goyang, Republic of Korea, 2011. [Google Scholar]
- Stewart, B.W.; Wild, C.P. World Cancer Report 2014; WHO: Geneva, Switzerland, 2014. [Google Scholar]
- Murakami, T.; Tsurusaki, M. Hypervascular Benign and Malignant Liver Tumors That Require Differentiation from Hepatocellular Carcinoma: Key Points of Imaging Diagnosis. Liver Cancer 2014, 3, 85–96. [Google Scholar] [CrossRef] [PubMed]
- Erickson, B.J.; Kirk, S.; Lee, Y.; Bathe, O.; Kearns, M.; Gerdes, C.; Rieger-Christ, K.; Lemmerman, J. The Cancer Genome Atlas Liver Hepatocellular Carcinoma Collection (TCGA-LIHC) (Version 5) [Data set]. The Cancer Imaging Archive. 2016. Available online: https://www.cancerimagingarchive.net/collection/tcga-lihc/ (accessed on 11 February 2025).
- Hasegawa, R.; Iwamoto, Y.; Han, X.; Lin, L.; Hu, H.; Cai, X.; Chen, Y.-W. Automatic Detection and Segmentation of Liver Tumors in Multi-phase CT Images by Phase Attention Mask R-CNN. In Proceedings of the 2021 IEEE International Conference on Consumer Electronics (ICCE), Las Vegas, NV, USA, 10–12 January 2021; pp. 1–5. [Google Scholar] [CrossRef]
- Bhusnurmath, R.A.; Betageri, S. Automated Liver Tumor Segmentation: Integrating Spatial Filtering and Intensity Thresholding Techniques. In Proceedings of the 2024 Second International Conference on Advances in Information Technology (ICAIT), Chikkamagaluru, Karnataka, India, 24–27 July 2024; pp. 1–5. [Google Scholar] [CrossRef]
- Li, X.; Chen, H.; Qi, X.; Dou, Q.; Fu, C.-W.; Heng, P.-A. H-DenseUNet: Hybrid Densely Connected UNet for Liver and Tumor Segmentation From CT Volumes. IEEE Trans. Med. Imaging 2018, 37, 2663–2674. [Google Scholar] [CrossRef] [PubMed]
- Nadkarni, N.S.; Borkar, S. Detection of Lung Cancer in CT Images Using Image Processing. In Proceedings of the 2019 3rd International Conference on Trends in Electronics and Informatics (ICOEI), Tirunelveli, India, 23–25 April 2019; pp. 863–866. [Google Scholar] [CrossRef]
- Liver Cancer Early Detection, Diagnosis, and Staging. Available online: https://www.cancer.org/cancer/types/liver-cancer/detection-diagnosis-staging/staging.html (accessed on 11 February 2025).


Disclaimer/Publisher’s Note: The statements, opinions and data contained in all publications are solely those of the individual author(s) and contributor(s) and not of MDPI and/or the editor(s). MDPI and/or the editor(s) disclaim responsibility for any injury to people or property resulting from any ideas, methods, instructions or products referred to in the content. |
© 2025 by the authors. Licensee MDPI, Basel, Switzerland. This article is an open access article distributed under the terms and conditions of the Creative Commons Attribution (CC BY) license (https://creativecommons.org/licenses/by/4.0/).