Abstract
The EU’s demand for numerous mineral raw materials is growing intensively, while the security of their supplies (mostly form outside the EU) is often at high risk. This is especially the case for critical raw materials (CRMs). Poland is now and may be in the future the most important supplier of numerous mineral raw materials to other EU countries. This is especially the case for coking coal, copper, silver and elemental sulfur. This article briefly evaluates the current and future possibilities for the supply of these raw materials from Poland to the EU market.
1. Introduction
The European Commission in 2011 defined, for the first time, the minerals of the highest importance for the European Union (EU), which were called critical raw materials (CRMs). These are mineral raw materials for which undistorted, diversified, and affordable supplies should be ensured for the EU’s manufacturing industry, being identified on the basis of two parameters, namely economic importance (EI) and risk of supply disruption (SR) [1]. This list of CRMs is published every three years, with the first one being published in 2011 (with 14CRMs), and the most recent one was published in 2020 (with 30 CRMs). The raw materials that were most recently identified as being critical for the EU met the following criteria: a minimum threshold value of 2.8 points for the EI index, and a minimum threshold value of 1.0 point for the SR parameter [2].
Poland is an EU member which is relatively rich in numerous mineral raw materials, with many of them being recognized as key raw materials for the Polish economy [3]. Poland can also be a crucial link in a supply chain of several raw materials, including critical raw materials, for the sustainable development of the European Union, as—in some cases—the minerals obtained by the Polish mining industry play an important role in ensuring the community’s mineral security. This applies in particular to coking coal, copper and silver and elemental sulfur, as Poland is a significant exporter of these raw materials to the EU [4].
This article aims to briefly assess the current and possible future role of Poland in the supply chain of numerous mineral raw materials important for the EU (including CRMs), focusing mostly on the abovementioned Polish raw material exports, i.e., coking coal, copper (together with silver, being a very important by-product of the process of copper production in Poland), and elemental sulfur.
2. Methodological Approach
This paper analyzes the resources base, production and international trends of selected raw materials which play a significant role in European Union supply chains. Four raw materials were selected for analyses: coking coal, copper, silver and sulfur.
The source materials for the analyses indicated above are relatively extensive. As regards the size of the resource base and extraction of minerals from deposits, the data were obtained from the yearbooks of the Balance of Mineral Resources Deposits in Poland (editions 2011–2019) [5] and the MIDAS database [6]. Both sources were developed by the Polish Geological Institute—National Research Institute (PGI-NRI). Production and trade data on minerals in terms of value and volume came from the Central Statistical Office (CSO) [7]. The CSO presents data related to domestic production and trade of minerals and related products in Poland, in accordance with the Polish Classification of Goods and Services (PKWiU) (production data) and Polish Combined Nomenclature (PCN) (international trade data). Official data are sometimes supplemented with data coming directly from mining enterprises, including their stock exchange reports, industry reports, as well as companies’ development policies (e.g., for Jastrzębska Spółka Węglowa S.A.—JSW, and KGHM Polska Miedź S.A—KGHM). To illustrate the position of Poland on the international (European) stage in the case of the selected minerals (coking coal, copper, silver, and sulfur), the data of Eurostat PRODCOM [8], World Mineral Production [9], and World Mining Data [10] were used.
3. Results of Analysis and Discussion
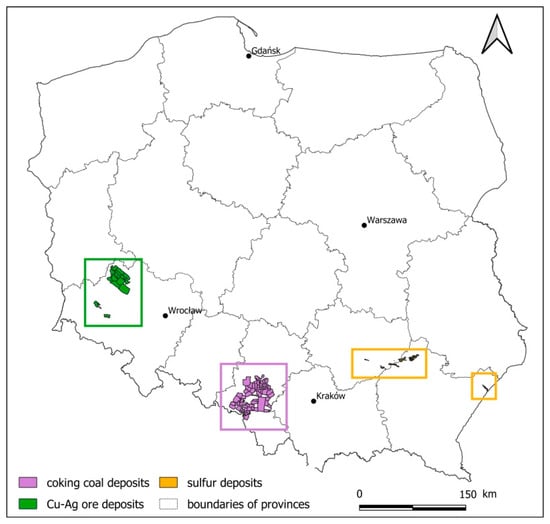
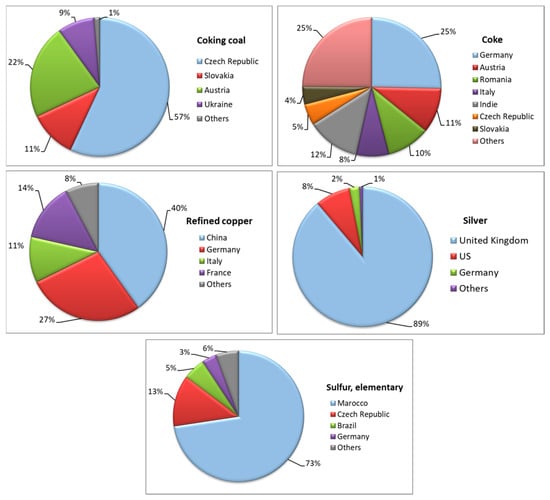
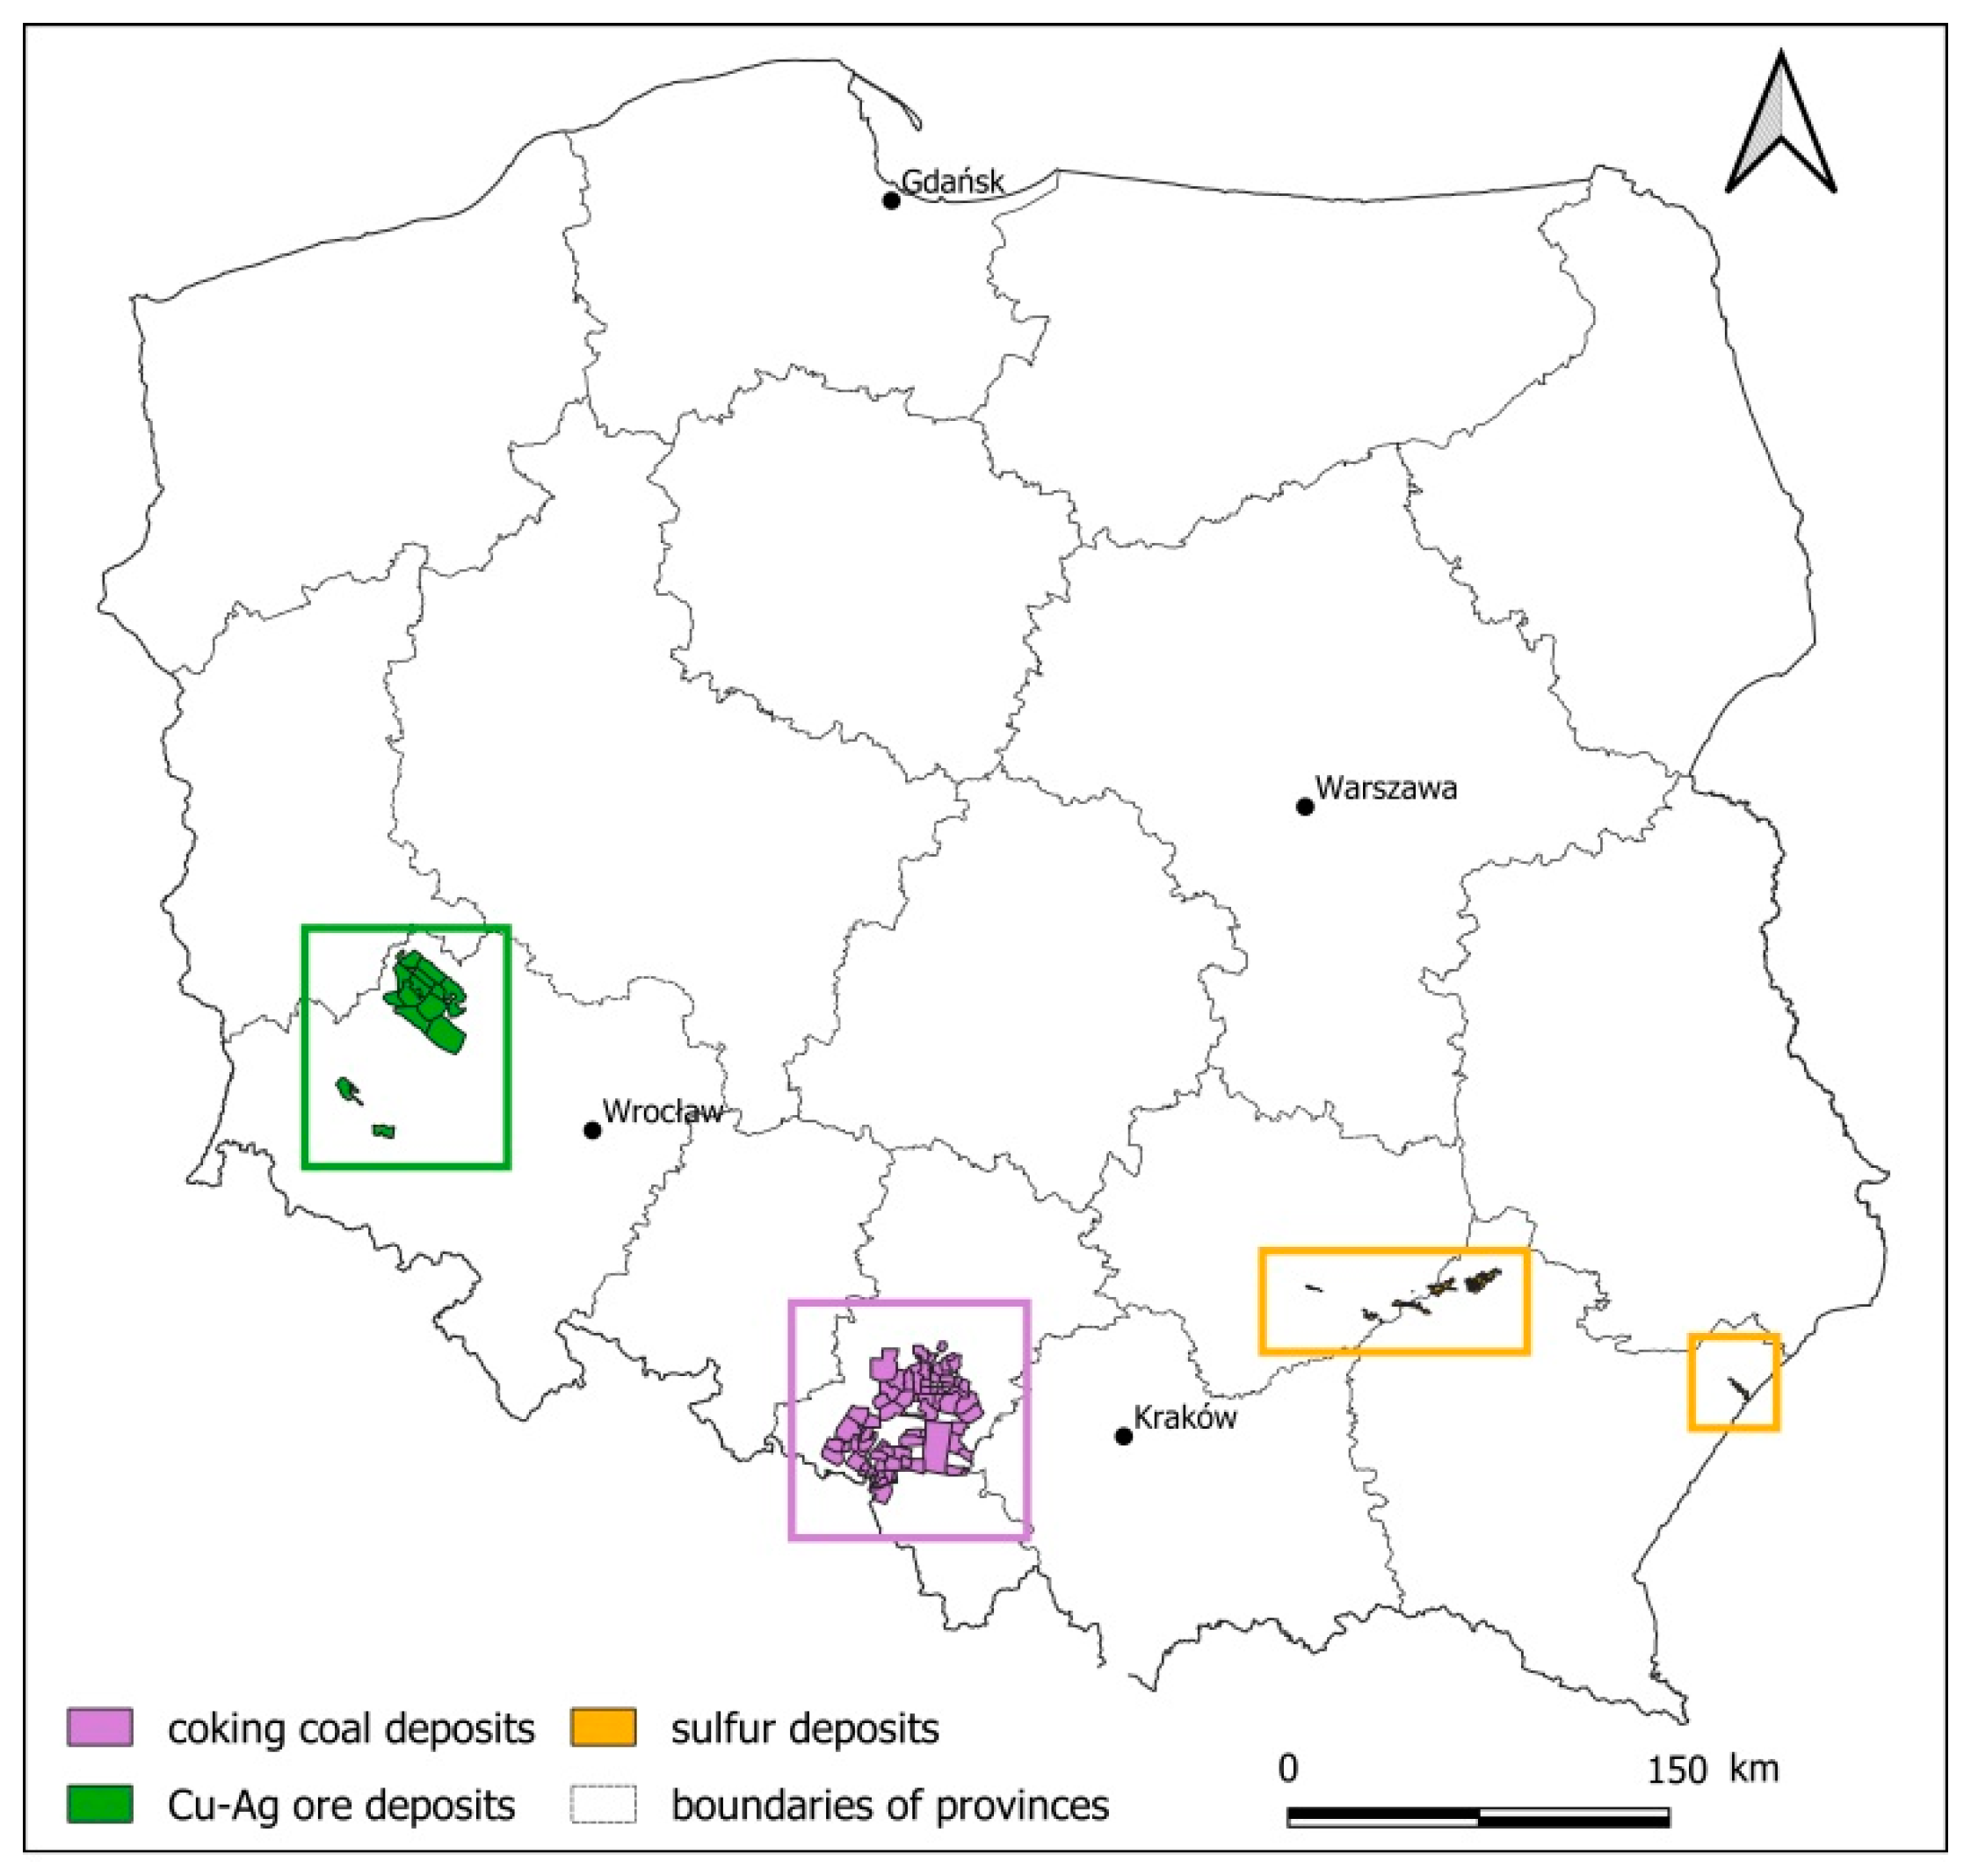
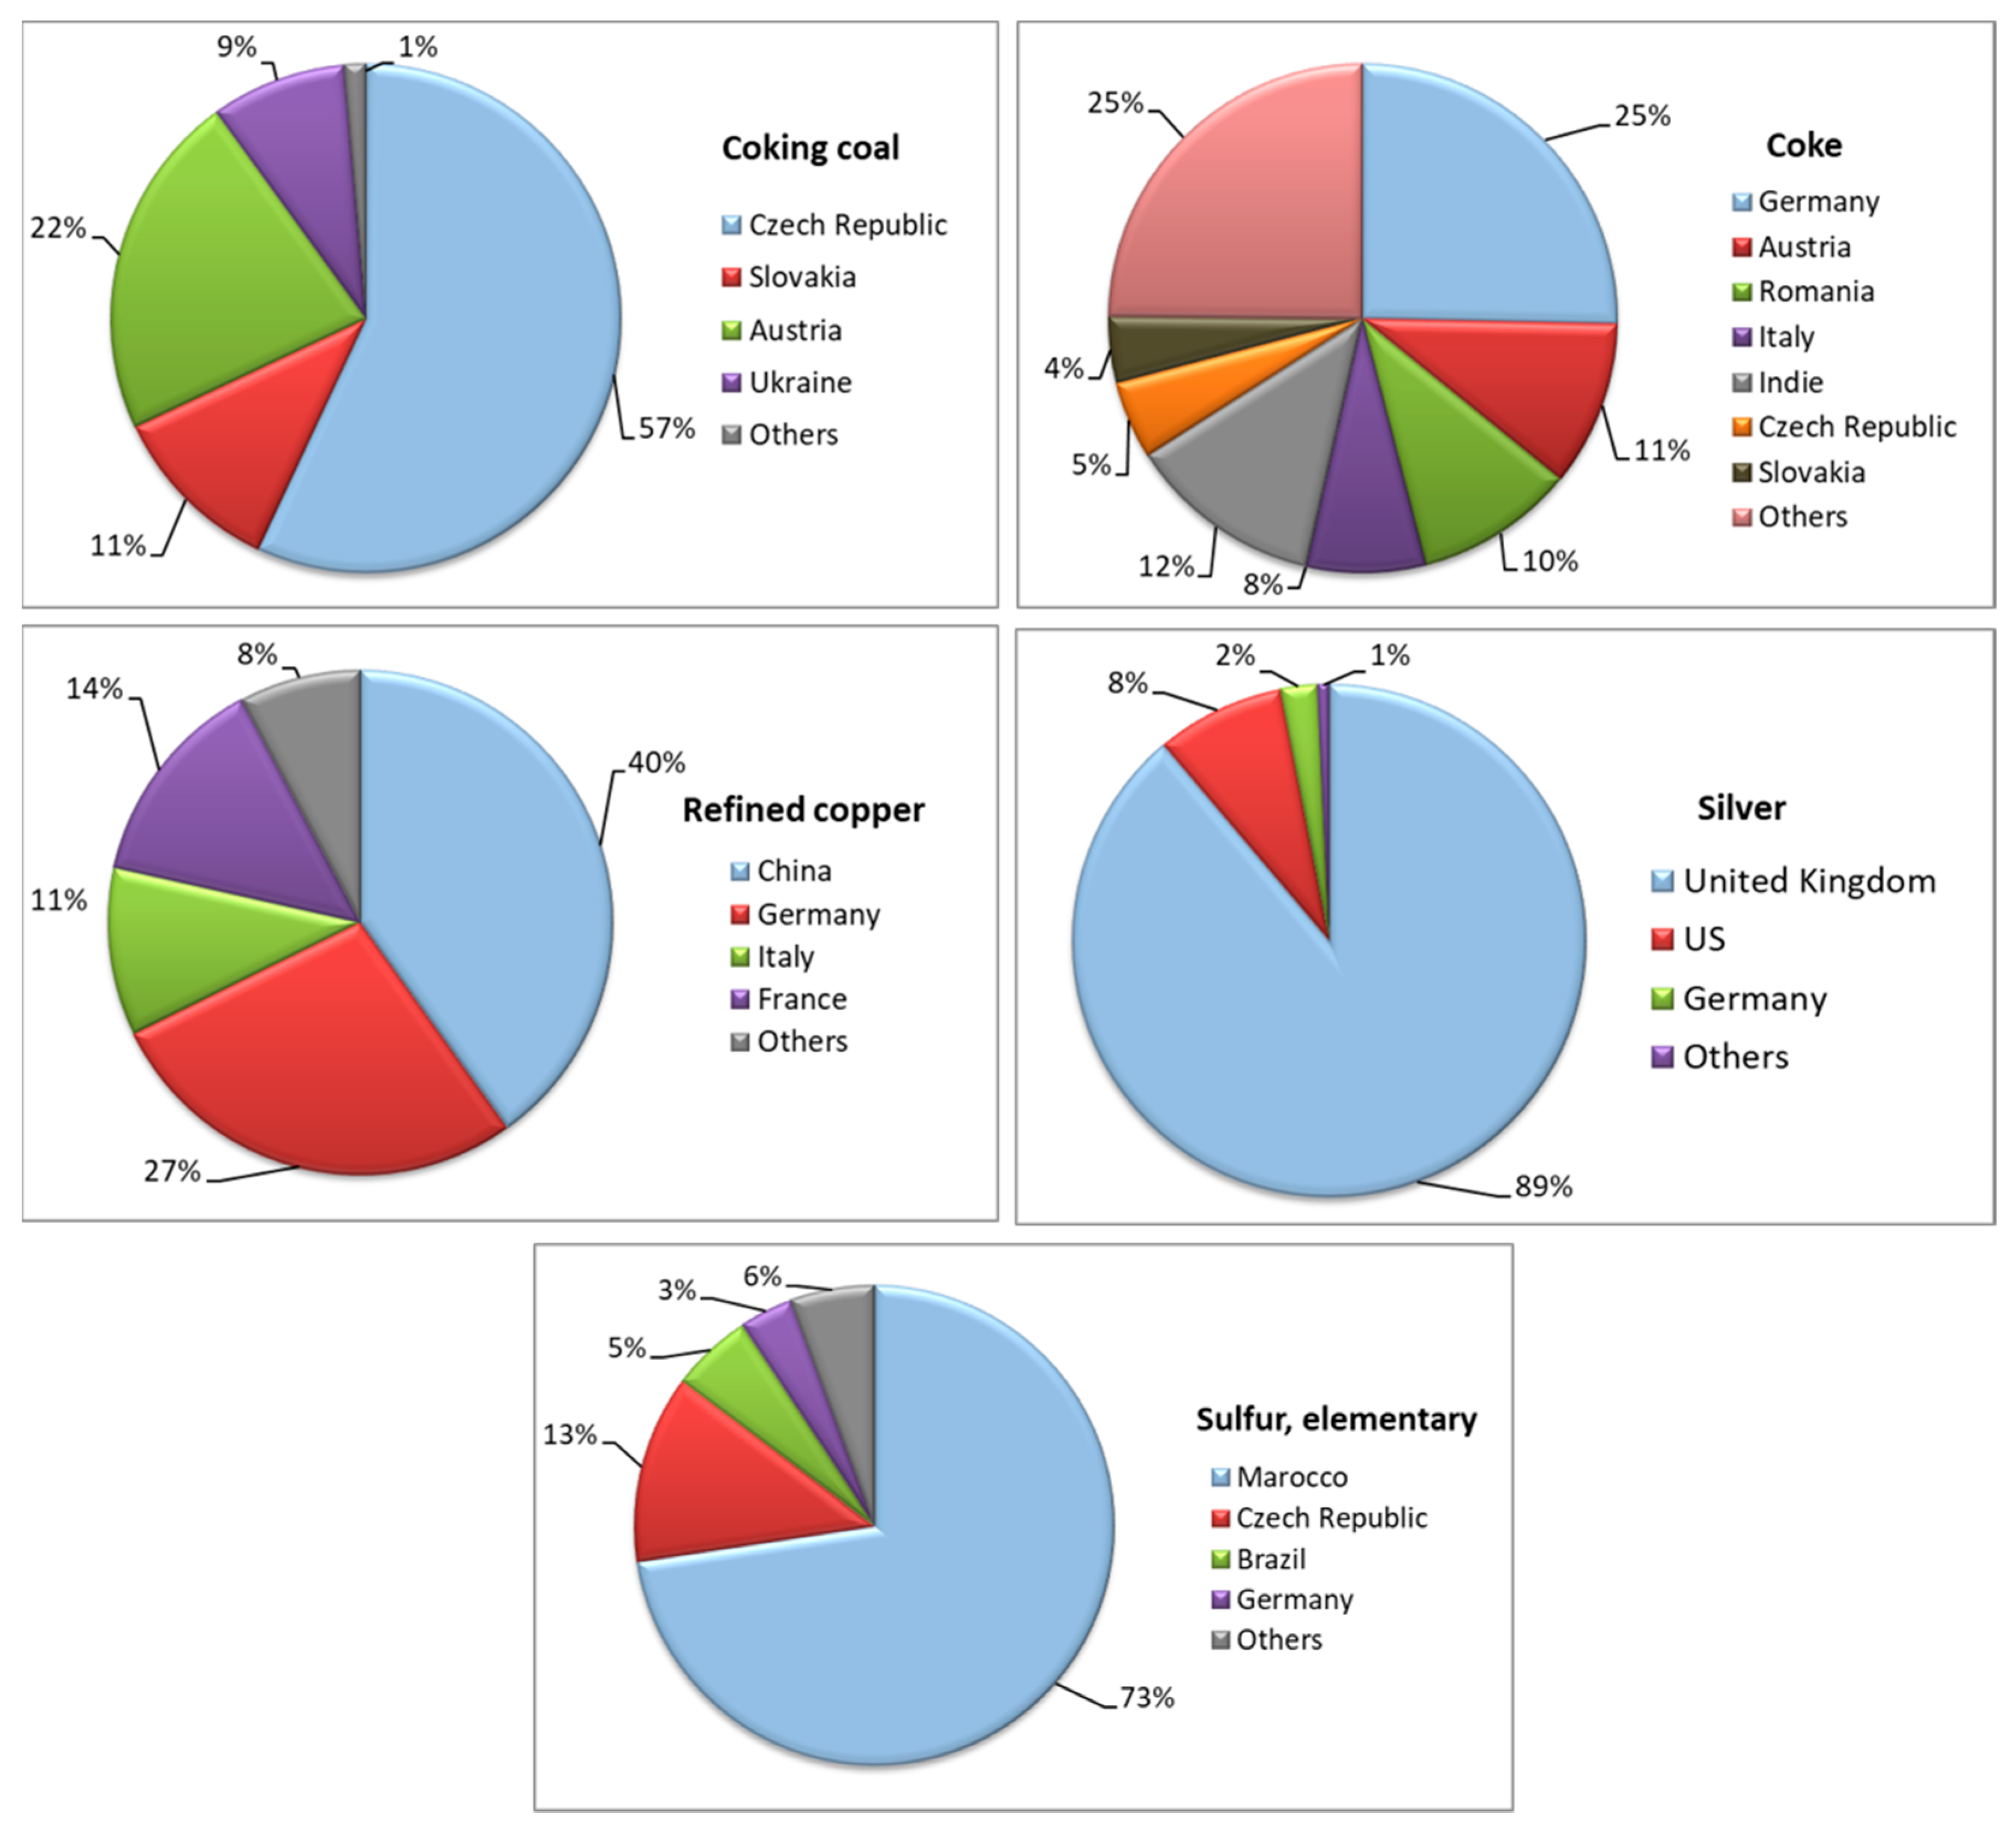
In 2020, the European Commission confirmed the status of coking coal as a critical raw material on the list of 30 critical raw materials for which the risk of supply shortages and its effects on the economy are higher than in the case of other materials [2,11]. For years, Poland has remained the largest producer of high-quality coking coal in the European Union. The recognized domestic resource base is estimated at ca. 21 billion tons in deposits located mainly in southern Poland—within the Upper Silesian Coal Basin (Figure 1). The average annual output of coking coal recently stabilized at almost 12 million tons [5] (Table 1). The output of coking coal in Poland constituted more than 56% of the total production in the EU countries in 2010–2018 (on average), while it constituted as much as 80% in 2018 (Table 1). In 2018, only one-third of domestic production was exported, mainly to other European countries [7] (Figure 2). Nevertheless, it should also be mentioned that Poland is the leading European and one of the leading world producers and exporters of coke (with its production based on domestic coking coal), which is used—at the pig iron production stage—in steelworks belonging to international steel producers. Regular coking coal deliveries are directed mainly to the Czech Republic, Slovakia and Austria, while supplies of coke are mainly directed to Germany, Austria, Romania and Italy [7] (Figure 2).

Figure 1.
Overall location of mineral deposits for the production of analyzed mineral raw materials (based on [15]).

Table 1.
Production of analyzed mineral raw materials in the EU countries in the years 2009–2018 [7,8,9,10].

Figure 2.
Export structure of analyzed mineral raw materials in 2018 (based on [7]).
As the largest in Europe and one of the largest in the world, deposits of polymetallic Cu-Ag ores are located in south-western Poland within the so-called Fore-Sudetic Monocline [12] (Figure 1). As a result, Poland holds the largest anticipated economic copper and silver resources in Europe, being estimated at 34 million tons of copper and 103,000 tons of silver [5]. Rudna Mine (belonging to KGHM Polska Miedź) is the biggest copper and silver ore mine in Europe and one of the biggest underground copper mines in the world.
European supplies of copper ore concentrates, as well as of refined copper, are dominated by the Polish production (Table 1). In recent decades, the Polish production has accounted for nearly 50% of the total copper ore concentrates production and for more than 20% of the total refined copper production in the EU (Table 1). Poland is also one of the world’s leading exporters of refined copper, but this export tendency has been clearly declining in recent decades due to growing domestic copper consumption. The main items of trade were cathodes, copper rods and wires [7,13]. The most important directions of exports in 2018 were China and Germany (Figure 2).
Within the EU, Poland is also the clear leader in terms of refined silver production, strictly associated with the process of refined copper production from silver-rich copper ores. The stable volume of refined silver production (Table 1) enabled Poland to maintain its position as the undisputed leading European silver supplier in the analyzed period, with its average share of EU production exceeding 67% [7,13]. Almost all of the production of Polish-refined silver is exported, with regular deliveries directed mostly to the United Kingdom, but also to the US and Germany (Figure 2).
Some of the world’s largest native sulfur deposits are located near Tarnobrzeg in south-eastern Poland (Figure 1). The total recognized deposits of elemental sulfur in Poland amount to ca. 494 million tons [7]. Moreover, the Polish Osiek mine is currently the only elemental sulfur producer in the world using a native sulfur deposit with the underground Frasch smelting method [11,14]. Poland’s share of the EU’s total elemental sulfur production amounted to about 17% in recent years, and it is still the leading European producer (Table 1) and exporter of elemental sulfur from primary sources, namely deposits. Still over 50% of the Polish elemental sulfur production is exported, with regular deliveries directed mostly to Morocco, but also to the Czech Republic, Brazil and Germany (Figure 2).
4. Concluding Remarks
Poland, in numerous cases, is a crucial link in a supply chain of several mineral raw materials (including some critical raw materials) for the sustainable development of the European Union. In some cases, the minerals produced in Poland play an important role in ensuring the community’s mineral security. This applies in particular to coking coal (and its derivative product, coke), copper, silver and elemental sulfur.
Due to the intensive extraction of good-quality minerals, Poland is a significant exporter of these raw materials to the EU and some non-European countries. Exports account for 20–30% of the Polish production of coking coal (in the case of its derivative—coke—this reaches 60–70%), 30–40% of that of refined copper, >50% of that elemental sulfur and >90% of the Polish production of refined silver. Only for copper does this share have a declining trend, due to growing domestic consumption.
The Polish recognized resource base of minerals appropriate for the production of the analyzed mineral raw materials enables Poland to maintain its significant production for at least the next 30 years or even more, assuming that this production will continue to be competitive with other global producers of these raw materials.
Author Contributions
Conceptualization, methodology, investigation, writing—original draft preparation, K.G., A.K.-N. and J.K.; writing—review and editing, K.G., A.K.-N. All authors have read and agreed to the published version of the manuscript.
Funding
Preparation of this paper has been supported by the Polish National Agency for Academic Exchange under Grant No PPI/APM/2019/1/00079/U/001.
Institutional Review Board Statement
Not applicable.
Informed Consent Statement
Not applicable.
Data Availability Statement
Not applicable.
Conflicts of Interest
The authors declare no conflict of interest.
References
- European Commission. Critical Raw Materials Resilience: Charting a Path towards Greater Security and Sustainability. Communication from the Commission to the European Parliament, the Council, the European Economic and Social Committee and the Committee of the Regions, COM(2020) 474 Final; Eur. Com.: Brussels, Belgium, 2020. [Google Scholar]
- European Commission. Study on the EU’s List of Critical Raw Materials—Final Report; Eur. Com.: Brussels, Belgium, 2020. [Google Scholar]
- Galos, K.; Lewicka, E.; Burkowicz, A.; Guzik, K.; Kot-Niewiadomska, A.; Kamyk, J.; Szlugaj, J. Approach to identification and classification of the key, strategic and critical minerals important for the mineral security of Poland. Resour. Policy 2021, 70, 101900. [Google Scholar] [CrossRef]
- Kot-Niewiadomska, A.; Galos, K.; Kamyk, J. Safeguarding of Key Minerals Deposits as a Basis of Sustainable Development of Polish Economy. Resources 2021, 10, 48. [Google Scholar] [CrossRef]
- Szuflicki, M.; Malon, A.; Tymiński, M. The Balance of Mineral Resources Deposits in Poland, Editions 2011–2019; In Polish with English Online Version; The Polish Geological Institute—National Research Institute: Warsaw, Poland, 2011–2019. Available online: http://geoportal.pgi.gov.pl/surowce (accessed on 20 June 2021).
- MIDAS Database [MIDAS Database]. Available online: http://geoportal.pgi.gov.pl/portal/page/portal/midas (accessed on 20 June 2021).
- Production-Imports-Exports. Statistical Data for the Years 2000–2018; The Central Statistical Office: Warsaw, Poland, 2019.
- PRODCOM Database. Available online: https://ec.europa.eu/eurostat/web/prodcom/data/database (accessed on 20 June 2021).
- World Mineral Production. British Geological Survey. Available online: https://www2.bgs.ac.uk/mineralsUK/statistics/worldStatistics.html (accessed on 20 June 2021).
- World Mining Data. Available online: https://www.world-mining-data.info/ (accessed on 20 June 2021).
- European Commission. Study on the EU’s List of Critical Raw Materials (2020). Critical Raw Materials Factsheets; Eur. Com.: Brussels, Belgium, 2020. [Google Scholar]
- Oszczepalski, S.; Speczik, S.; Zieliński, K.; Chmielewski, A. The Kupferschiefer Deposits and Prospects in SW Poland: Past, Present and Future. Minerals 2019, 9, 592. [Google Scholar] [CrossRef] [Green Version]
- Galos, K.; Burkowicz, A.; Czerw, H.; Figarska-Warchoł, B.; Gałaś, A.; Guzik, K.; Kamyk, J.; Kot-Niewiadomska, A.; Lewicka, E.; Szlugaj, J. Determining the Trade Flows of Key and Strategic Raw Materials for the Polish Economy; Mineral and Energy Economy Research Institute PAS: Poland, Kraków, 2020. unpublished. (In Polish) [Google Scholar]
- Sermet, E.; Nieć, M. Not Mining Sterilization of Explored Mineral Resources. The Example of Native Sulfur Deposits in Poland Case History. Resources 2021, 10, 30. [Google Scholar] [CrossRef]
- Central Geological Database. Available online: http://baza.pgi.gov.pl/ (accessed on 20 June 2021).
Publisher’s Note: MDPI stays neutral with regard to jurisdictional claims in published maps and institutional affiliations. |
© 2021 by the authors. Licensee MDPI, Basel, Switzerland. This article is an open access article distributed under the terms and conditions of the Creative Commons Attribution (CC BY) license (https://creativecommons.org/licenses/by/4.0/).


