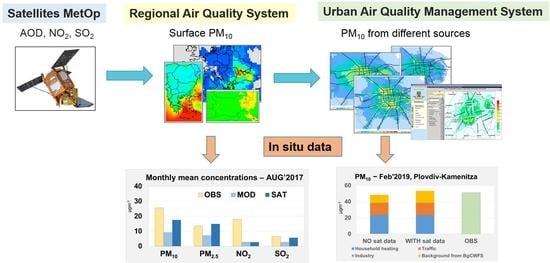
Use of Satellite Data for Air Pollution Modeling in Bulgaria
Abstract
:1. Introduction
2. Materials and Methods
2.1. Satellite Data for AOD, NO2, and SO2
2.2. The Bulgarian Chemical Weather Forecast System (BgCWFS)
2.3. AOD Calculation in BgCWFS
2.4. Assimilation of Satellite-Retrieved Data in BgCWFS
2.5. Local Air Quality Management System (LAQMS)
- Meteorological pre-processor modules,
- Emission modules,
- Dispersion modules, and
- Post-processing modules and interface for AQ experts (expert module).
2.6. Simulations and Evaluation of the Models’ Performance
3. Results
3.1. BgCWFS_mod vs. BgCWFS_sat
3.2. Comparison of BgCWFS Results to Surface Observations
3.3. BgCWFS-LAQMS Results for Plovdiv
4. Discussion
Supplementary Materials
Author Contributions
Funding
Data Availability Statement
Acknowledgments
Conflicts of Interest
Appendix A
| Statistics | Formula | Range | Perfect Score |
| Mean bias error (MBE) (µgm−3) | −∞ to +∞ | 0 positive value: model is on average higher than the observations | |
| Root mean square error (RMSE) (µgm−3) | 0 to +∞ | 0 | |
| Correlation coefficient (r) | −1 to 1 | 1 | |
| Fractional gross error (FGE) | 0 to 2 | 0 | |
| Normalized mean bias (NMB) | % | ||
| Mean model and mean observed (µgm−3) |
References
- European Environment Agency. Air Quality in Europe—2020 Report; EEA Technical Report No 09/2020; ISSN 1977-8449. Luxembourg, 2020. Available online: https://www.eea.europa.eu/publications/air-quality-in-europe-2020-report (accessed on 31 August 2021).
- WHO. Air Quality Guidelines; Global Update 2005; World Health Organization Press: Geneva, Switzerland, 2006. [Google Scholar]
- European Environment Agency. Bulgaria—Air Pollution Country Fact Sheet. Available online: https://www.eea.europa.eu/themes/air/country-fact-sheets/2020-country-fact-sheets/bulgaria (accessed on 23 August 2021).
- Sicard, P.; Agathokleous, E.; De Marco, A.; Paoletti, E.; Calatayud, V. Urban population exposure to air pollution in Europe over the last decades. Environ. Sci. Eur. 2021, 33, 1–12. [Google Scholar] [CrossRef]
- Diao, M.; Holloway, T.; Choi, S.; O’Neill, S.M.; Al-Hamdan, M.Z.; Van Donkelaar, A.; Martin, R.V.; Jin, X.; Fiore, A.; Henze, D.K.; et al. Methods, availability, and applications of PM2.5 exposure estimates derived from ground measurements, satellite, and atmospheric models. J. Air Waste Manag. Assoc. 2019, 69, 1391–1414. [Google Scholar] [CrossRef]
- Hammer, M.S.; van Donkelaar, A.; Martin, R.V.; McDuffie, E.E.; Lyapustin, A.; Sayer, A.M.; Hsu, N.C.; Levy, R.C.; Garay, M.J.; Kalashnikova, O.V.; et al. Effects of COVID-19 lockdowns on fine particulate matter concentrations. Sci. Adv. 2021, 7, eabg7670. [Google Scholar] [CrossRef]
- Duncan, B.N.; Prados, A.; Lamsal, L.N.; Liu, Y.; Streets, D.G.; Gupta, P.; Hilsenrath, E.; Kahn, R.A.; Nielsen, J.E.; Beyersdorf, A.J.; et al. Satellite data of atmospheric pollution for U.S. air quality applications: Examples of applications, summary of data end-user resources, answers to FAQs, and common mistakes to avoid. Atmos. Environ. 2014, 94, 647–662. [Google Scholar] [CrossRef] [Green Version]
- Streets, D.G.; Canty, T.; Carmichael, G.R.; De Foy, B.; Dickerson, R.R.; Duncan, B.N.; Edwards, D.P.; Haynes, J.A.; Henze, D.K.; Houyoux, M.R.; et al. Emissions estimation from satellite retrievals: A review of current capability. Atmos. Environ. 2013, 77, 1011–1042. [Google Scholar] [CrossRef] [Green Version]
- Fioletov, V.E.; McLinden, C.A.; Krotkov, N.; Li, C.; Joiner, J.; Theys, N.; Carn, S.; Moran, M.D. A global catalogue of large SO2 sources and emissions derived from the Ozone Monitoring Instrument. Atmos. Chem. Phys. Discuss. 2016, 16, 11497–11519. [Google Scholar] [CrossRef] [Green Version]
- Ialongo, I.; Fioletov, V.; McLinden, C.; Jåfs, M.; Krotkov, N.; Li, C.; Tamminen, J. Application of satellite-based sulfur dioxide observations to support the cleantech sector: Detecting emission reduction from copper smelters. Environ. Technol. Innov. 2018, 12, 172–179. [Google Scholar] [CrossRef]
- Andersson, E.; Kahnert, M.; Devasthale, A. Methodology for evaluating lateral boundary conditions in the regional chemical transport model MATCH (v5.5.0) using combined satellite and ground-based observations. Geosci. Model Dev. 2015, 8, 3747–3763. [Google Scholar] [CrossRef] [Green Version]
- Kumar, R.; Monache, L.D.; Bresch, J.; Saide, P.E.; Tang, Y.; Liu, Z.; Da Silva, A.M.; Alessandrini, S.; Pfister, G.; Edwards, D.; et al. Toward Improving Short-Term Predictions of Fine Particulate Matter Over the United States Via Assimilation of Satellite Aerosol Optical Depth Retrievals. J. Geophys. Res. Atmos. 2019, 124, 2753–2773. [Google Scholar] [CrossRef]
- Tang, Y.; Pagowski, M.; Chai, T.; Pan, L.; Lee, P.; Baker, B.; Kumar, R.; Monache, L.D.; Tong, D.; Kim, H.-C. A case study of aerosol data assimilation with the Community Multi-scale Air Quality Model over the contiguous United States using 3D-Var and optimal interpolation methods. Geosci. Model Dev. 2017, 10, 4743–4758. [Google Scholar] [CrossRef] [Green Version]
- McHenry, J.N.; Vukovich, J.M.; Hsu, N.C. Development and implementation of a remote-sensing and in situ data-assimilating version of CMAQ for operational PM2.5 forecasting. Part 1: MODIS aerosol optical depth (AOD) data-assimilation design and testing. J. Air Waste Manag. Assoc. 2015, 65, 1395–1412. [Google Scholar] [CrossRef] [Green Version]
- Stein, O.; Flemming, J.; Inness, A.; Kaiser, J.W.; Schultz, M.G. Global reactive gases forecasts and reanalysis in the MACC project. J. Integr. Environ. Sci. 2012, 9, 57–70. [Google Scholar] [CrossRef] [Green Version]
- Sandu, A.; Chai, T. Chemical Data Assimilation—An Overview. Atmosphere 2011, 2, 426–463. [Google Scholar] [CrossRef] [Green Version]
- Zhang, Y.; Vijayaraghavan, K.; Wen, X.-Y.; Snell, H.E.; Jacobson, M.Z. Probing into regional ozone and particulate matter pollution in the United States: 1. A 1 year CMAQ simulation and evaluation using surface and satellite data. J. Geophys. Res. Space Phys. 2009, 114, 22304. [Google Scholar] [CrossRef] [Green Version]
- Huijnen, V.; Eskes, H.J.; Poupkou, A.; Elbern, H.; Boersma, K.; Foret, G.; Sofiev, M.; Valdebenito, A.; Flemming, J.; Stein, O.; et al. Comparison of OMI NO2 tropospheric columns with an ensemble of global and European regional air quality models. Atmos. Chem. Phys. Discuss. 2010, 10, 3273–3296. [Google Scholar] [CrossRef] [Green Version]
- Zhao, A.; Li, Z.; Zhang, Y.; Li, D. Merging MODIS and Ground-Based Fine Mode Fraction of Aerosols Based on the Geostatistical Data Fusion Method. Atmosphere 2017, 8, 117. [Google Scholar] [CrossRef] [Green Version]
- Sorek-Hamer, M.; Just, A.; Kloog, I. Satellite remote sensing in epidemiological studies. Curr. Opin. Pediatr. 2016, 28, 228–234. [Google Scholar] [CrossRef] [PubMed] [Green Version]
- Stafoggia, M.; Schwartz, J.; Badaloni, C.; Bellander, T.; Alessandrini, E.; Cattani, G.; Donato, F.D.; Gaeta, A.; Leone, G.; Lyapustin, A.; et al. Estimation of daily PM10 concentrations in Italy (2006–2012) using finely resolved satellite data, land use variables and meteorology. Environ. Int. 2017, 99, 234–244. [Google Scholar] [CrossRef]
- Liu, Y. Applying Satellite Remote Sensing Data in PM2.5 Exposure Assessment and Health Effects Research; Air & Waste Management AssociationL: Pittsburgh, PA, USA, 2014; pp. 6–10. [Google Scholar]
- Fishman, J.; Bowman, K.W.; Burrows, J.P.; Richter, A.; Chance, K.V.; Edwards, D.P.; Martin, R.V.; Morris, G.A.; Pierce, R.B.; Ziemke, J.R.; et al. Remote Sensing of Tropospheric Pollution from Space. Bull. Am. Meteorol. Soc. 2008, 89, 805–822. [Google Scholar] [CrossRef] [Green Version]
- Park, R.S.; Song, C.H.; Han, K.M.; Park, M.E.; Lee, S.-S.; Kim, S.-B.; Shimizu, A. A study on the aerosol optical properties over East Asia using a combination of CMAQ-simulated aerosol optical properties and remote-sensing data via a data assimilation technique. Atmos. Chem. Phys. 2011, 11, 12275–12296. [Google Scholar] [CrossRef] [Green Version]
- Benedetti, A.; Morcrette, J.-J.; Boucher, O.; Dethof, A.; Engelen, R.J.; Fisher, M.; Flentjes, H.; Huneeus, N.; Jones, L.; Kaiser, J.W.; et al. the GEMS-AER team. Aerosol analysis and forecast in the ECMWF Integrated Forecast System. Part II: Data assimilation. J. Geophys. Res. 2009, 114, D13205. [Google Scholar] [CrossRef] [Green Version]
- Colarco, P.; Da Silva, A.; Chin, M.; Diehl, T. Online simulations of global aerosol distributions in the NASA GEOS-4 model and comparisons to satellite and ground-based aerosol optical depth. J. Geophys. Res. Space Phys. 2010, 115, 14207. [Google Scholar] [CrossRef] [Green Version]
- Wang, H.; Shi, G.; Tian, M.; Zhang, L.; Chen, Y.; Yang, F.; Cao, X. Aerosol optical properties and chemical composition apportionment in Sichuan Basin, China. Sci. Total Environ. 2017, 577, 245–257. [Google Scholar] [CrossRef]
- Bocquet, M.; Elbern, H.; Eskes, H.; Hirtl, M.; Žabkar, R.; Carmichael, G.R.; Flemming, J.; Inness, A.; Pagowski, M.; Pérez Camaño, J.L.; et al. Data assimilation in atmospheric chemistry models: Current status and future prospects for coupled chemistry meteorology models. Atmos. Chem. Phys. 2015, 15, 5325–5358. [Google Scholar] [CrossRef] [Green Version]
- Lee, D.; Byun, D.W.; Kim, H.; Ngan, F.; Kim, S.; Lee, C.; Cho, C. Improved CMAQ predictions of particulate matter utilizing the satellite-derived aerosol optical depth. Atmos. Environ. 2011, 45, 3730–3741. [Google Scholar] [CrossRef]
- Tang, Y.; Chai, T.; Pan, L.; Lee, P.; Tong, D.; Kim, H.; Chen, W. Using optimal interpolation to assimilate surface measurements and satellite AOD for ozone and PM2.5: A case study for July 2011. J. Air Waste Manag. Assoc. 2015, 65, 1206–1216. [Google Scholar] [CrossRef] [Green Version]
- Chai, T.; Kim, H.; Pan, L.; Lee, P.; Tong, D. Impact of Moderate Resolution Imaging Spectroradiometer Aerosol Optical Depth and AirNow PM 2.5 assimilation on Community Multi-scale Air Quality aerosol predictions over the contiguous United States. J. Geophys. Res. Atmos. 2017, 122, 5399–5415. [Google Scholar] [CrossRef]
- Benedetti, A.; Di Giuseppe, F.; Jones, L.; Peuch, V.-H.; Rémy, S.; Zhang, X. The value of satellite observations in the analysis and short-range prediction of Asian dust. Atmos. Chem. Phys. Discuss. 2019, 19, 987–998. [Google Scholar] [CrossRef] [Green Version]
- Syrakov, D.; Etropolska, I.; Prodanova, M.; Ganev, K.; Miloshev, N.; Slavov, K. Operational Pollution Forecast for the Re-gion of Bulgaria. AIP Conf. Proc. 2012, 1487, 88–94. [Google Scholar] [CrossRef]
- Syrakov, D.; Prodanova, M.; Slavov, K.; Etropolska, I.; Ganev, K.; Miloshev, N.; Ljubenov, T. Bulgarian System for Air Pollution Forecast. J. Intern. Sci. Publ. Ecol. Saf. 2013, 7, 325–334, ISSN: 1313-2563. [Google Scholar]
- Syrakov, D.; Prodanova, M.; Etropolska, I.; Slavov, K.; Ganev, K.; Miloshev, N.; Ljubenov, T. A Multy-Domain Operational Chemical Weather Forecast System. In LSSC; Lirkov, I., Margenov, S., Wasniewski, J., Eds.; LNCS 8353; Springer: Berlin/Heidelberg, Germany, 2014; pp. 413–420. [Google Scholar] [CrossRef]
- Syrakov, D.; Prodanova, M.; Georgieva, E.; Etropolska, I.; Slavov, K. Simulation of European air quality by WRF–CMAQ models using AQMEII-2 infrastructure. J. Comput. Appl. Math. 2016, 293, 232–245. [Google Scholar] [CrossRef]
- Gadzhev, G.; Ganev, K.; Syrakov, D.; Miloshev, N.; Prodanova, M. Contribution of biogenic emissions to the atmospheric composition of the Balkan Region and Bulgaria. Int. J. Environ. Pollut. 2012, 50, 130–139. [Google Scholar] [CrossRef]
- Georgieva, E.; Syrakov, D.; Prodanova, M.; Etropolska, I.; Slavov, K. Evaluating the performance of WRF-CMAQ air quality modelling system in Bulgaria by means of the DELTA tool. Int. J. Environ. Pollut. 2015, 57, 272. [Google Scholar] [CrossRef]
- Atanassov, D. Validation of the Eulerian pollution transport model PolTran on the Kincaid data set. Int. J. Environ. Pollut. 2003, 20, 105. [Google Scholar] [CrossRef]
- Atanassov, D.; Spassova, S.; Grancharova, D.; Krastev, S.; Yankova, T.; Nikolov, L.; Chakarova, M.; Krasteva, P.; Genov, N.; Stamenov, J.; et al. Air Pollution Monitoring and Modeling System of the Town of Plovdiv (phase I). J. Environ. Prot. Ecol. 2006, 7, 260–268. [Google Scholar]
- Dimitrova, M.; Nedkov, R.; Syrakov, D.; Georgieva, E.; Gochev, D.; Trenchev, P.; Veleva, B.; Atanassov, D.; Spassova, T.; Batchvarova, E. Identification of optimal satellite data for use in the air quality modeling system BgCWFS. In Proceedings of the Fifteenth International Scientific Conference Space, Ecology, Safety 2019, SES 2019, Sofia, Bulgaria, 6–8 November 2019; Print ISSN 2603-3313. pp. 253–260. Available online: http://www.space.bas.bg/SES/archive/SES%202019_DOKLADI/4_Ecology/8_Dimitrova.pdf (accessed on 31 August 2021).
- EO Portal of EUMETSAT. Available online: https://eoportal.eumetsat.int (accessed on 12 July 2021).
- Temis Absorbing Aerosol Index. Available online: https://www.temis.nl/airpollution/absaai/ (accessed on 12 July 2021).
- Skamarock, W.C.; Klemp, J.B.; Dudhia, J.; Gill, D.O.; Barker, D.M.; Wang, W.; Powers, J.G. A Description of the Advanced Research WRF Version 3, NCAR; Tech. Rep. TN-4751STR.; NCAR: Boulder, CO, USA, 2008. [Google Scholar]
- Byun, D.; Schere, K.L. Review of the Governing Equations, Computational Algorithms, and Other Components of the Models-3 Community Multiscale Air Quality (CMAQ) Modeling System. Appl. Mech. Rev. 2006, 59, 51–77. [Google Scholar] [CrossRef]
- Houyoux, M.R.; Vukovich, J.M.; Coats, C.J., Jr.; Wheeler, N.J.M.; Kasibhatla, P.S. Emission inventory development and pro-cessing for the Seasonal Model for Regional Air Quality (SMRAQ) project. J. Geophys. Res. 2000, 105, 9079–9090. [Google Scholar] [CrossRef]
- Kuenen, J.J.P.; Visschedijk, A.J.H.; Jozwicka, M.; van der Gon, H.A.C.D. TNO-MACC_II emission inventory; a multi-year (2003–2009) consistent high-resolution European emission inventory for air quality modelling. Atmos. Chem. Phys. Discuss. 2014, 14, 10963–10976. [Google Scholar] [CrossRef] [Green Version]
- NCEP Meteorological Data. Available online: https://www.cpc.ncep.noaa.gov/products/wesley/fast_downloading_grib.html (accessed on 12 July 2021).
- Syrakov, D.; Prodanova, M.; Georgieva, E. Effects of Satellite Data Assimilation in Air Quality Modelling in Bulgaria. In Environmental Protection and Disaster Risks; EnviroRISK 2020. Studies in Systems, Decision and Control; Dobrinkova, N., Gadzhev, G., Eds.; Springer: Cham, Switzerland, 2021; Volume 361, pp. 3–18. [Google Scholar] [CrossRef]
- Bulgarian Chemical Weather Forecasts (BgCWFS). Available online: http://info.meteo.bg/cw2.1 (accessed on 12 July 2021).
- Syrakov, D.; Prodanova, M.; Georgieva, E.; Dimitrova, M.; Spassova, T.; Atanassov, D.; Veleva, B.; Nedkov, R. Aerosol optical depth calculations using the Bulgarian Chemical Weather Forecast System. Bulg. J. Meteorol. Hydrol. 2019, 23, 31–46, online ISSN 2535-0595. Available online: http://meteorology.meteo.bg/global-change/files/2019/BJMH_2019_V23_N2/BJMH_23_2_3.pdf (accessed on 31 August 2021).
- Curci, G. FlexAOD: A Chemistry-transport Model Post-processing Tool for A Flexible Calculation of Aerosol Optical Prop-erties. In Proceedings of the 9th International Symposium on Tropospheric Profiling, L’Aquila, Italy, 3–7 September 2012. ISBN/EAN: 978-90-815839-4-7. [Google Scholar]
- Curci, G.; Hogrefe, C.; Bianconi, R.; Im, U.; Balzarini, A.; Baró, R.; Brunner, D.; Forkel, R.; Giordano, L.; Hirtl, M.; et al. Uncertainties of simulated aerosol optical properties induced by assumptions on aerosol physical and chemical properties: An AQMEII-2 perspective. Atmos. Environ. 2015, 115, 541–552. [Google Scholar] [CrossRef]
- López-Aparicio, S.; Guevara, M.; Thunis, P.; Cuvelier, K.; Tarrasón, L. Assessment of discrepancies between bottom-up and regional emission inventories in Norwegian urban areas. Atmos. Environ. 2017, 154, 285–296. [Google Scholar] [CrossRef]
- Guevara, M.; Tena, C.; Porquet, M.; Jorba, O.; García-Pando, C.P. HERMESv3, a stand-alone multi-scale atmospheric emission modelling framework—Part 2: The bottom–up module. Geosci. Model Dev. 2020, 13, 873–903. [Google Scholar] [CrossRef] [Green Version]
- AUSTAL2000. Available online: http://www.austal2000.de (accessed on 12 July 2021).
- LAQMS and BgCWFS Examples of Output. Available online: http://meteorology.meteo.bg/siduaq/index.html (accessed on 12 July 2021).
- FIRMS-Fire Information for Resource Management System at NASA. Available online: https://firms.modaps.eosdis.nasa.gov/map/ (accessed on 23 August 2021).
- European Environment Agency, Download of Air Quality Data at Regulatory Stations. Available online: https://discomap.eea.europa.eu/map/fme/AirQualityExport.htm (accessed on 12 July 2021).
- Krotkov, N.A.; McLinden, C.A.; Li, C.; Lamsal, L.N.; Celarier, E.A.; Marchenko, S.V.; Swartz, W.H.; Bucsela, E.J.; Joiner, J.; Duncan, B.N.; et al. Aura OMI observations of regional SO2 and NO2 pollution changes from 2005 to 2015. Atmos. Chem. Phys. 2016, 16, 4605–4629. [Google Scholar] [CrossRef] [Green Version]
- Schaub, D.A.; Boersma, K.; Kaiser, J.; Weiss, A.K.; Folini, D.; Eskes, H.J.; Buchmann, B. Comparison of GOME tropospheric NO2 columns with NO2 profiles deduced from ground-based in situ measurements. Atmos. Chem. Phys. Discuss. 2006, 6, 3211–3229. [Google Scholar] [CrossRef] [Green Version]
- Kim, H.C.; Lee, P.; Judd, L.; Pan, L.; Lefer, B. OMI NO2 column densities over North American urban cities: The effect of satellite footprint resolution. Geosci. Model Dev. 2016, 9, 1111–1123. [Google Scholar] [CrossRef] [Green Version]
- Itahashi, S.; Uno, I.; Irie, H.; Kurokawa, J.-I.; Ohara, T. Regional modeling of tropospheric NO2 vertical column density over East Asia during the period 2000–2010: Comparison with multisatellite observations. Atmos. Chem. Phys. Discuss. 2014, 14, 3623–3635. [Google Scholar] [CrossRef] [Green Version]
- Inness, A.; Baier, F.; Benedetti, A.; Bouarar, I.; Chabrillat, S.; Clark, H.; Clerbaux, C.; Coheur, P.; Engelen, R.J.; Errera, Q.; et al. The MACC reanalysis: An 8 yr data set of atmospheric composition. Atmos. Chem. Phys. Discuss. 2013, 13, 4073–4109. [Google Scholar] [CrossRef] [Green Version]


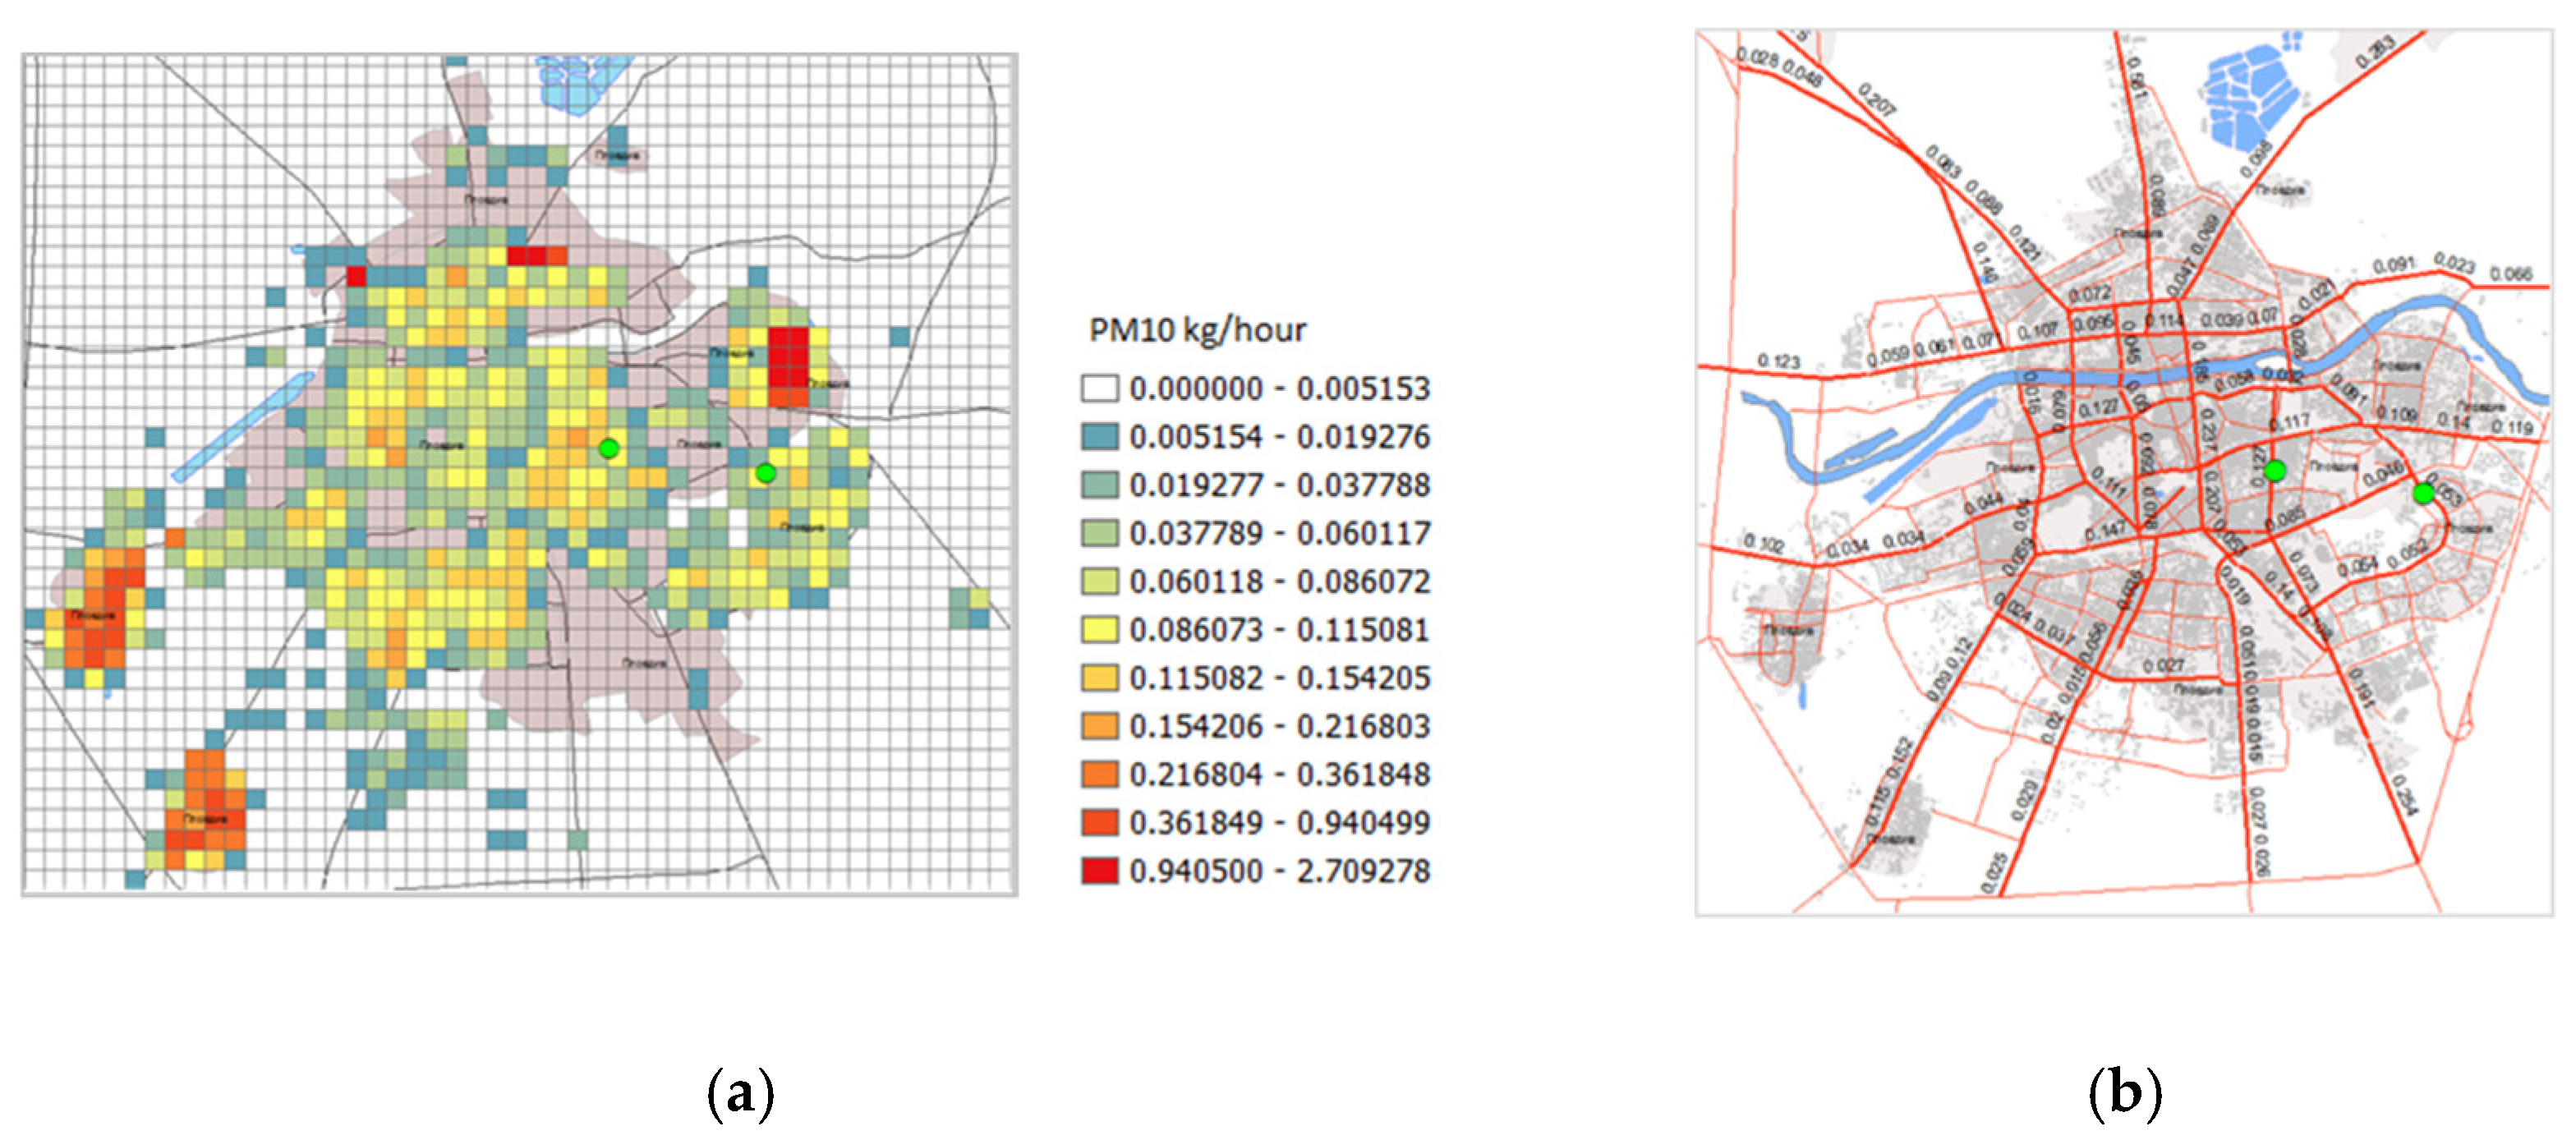

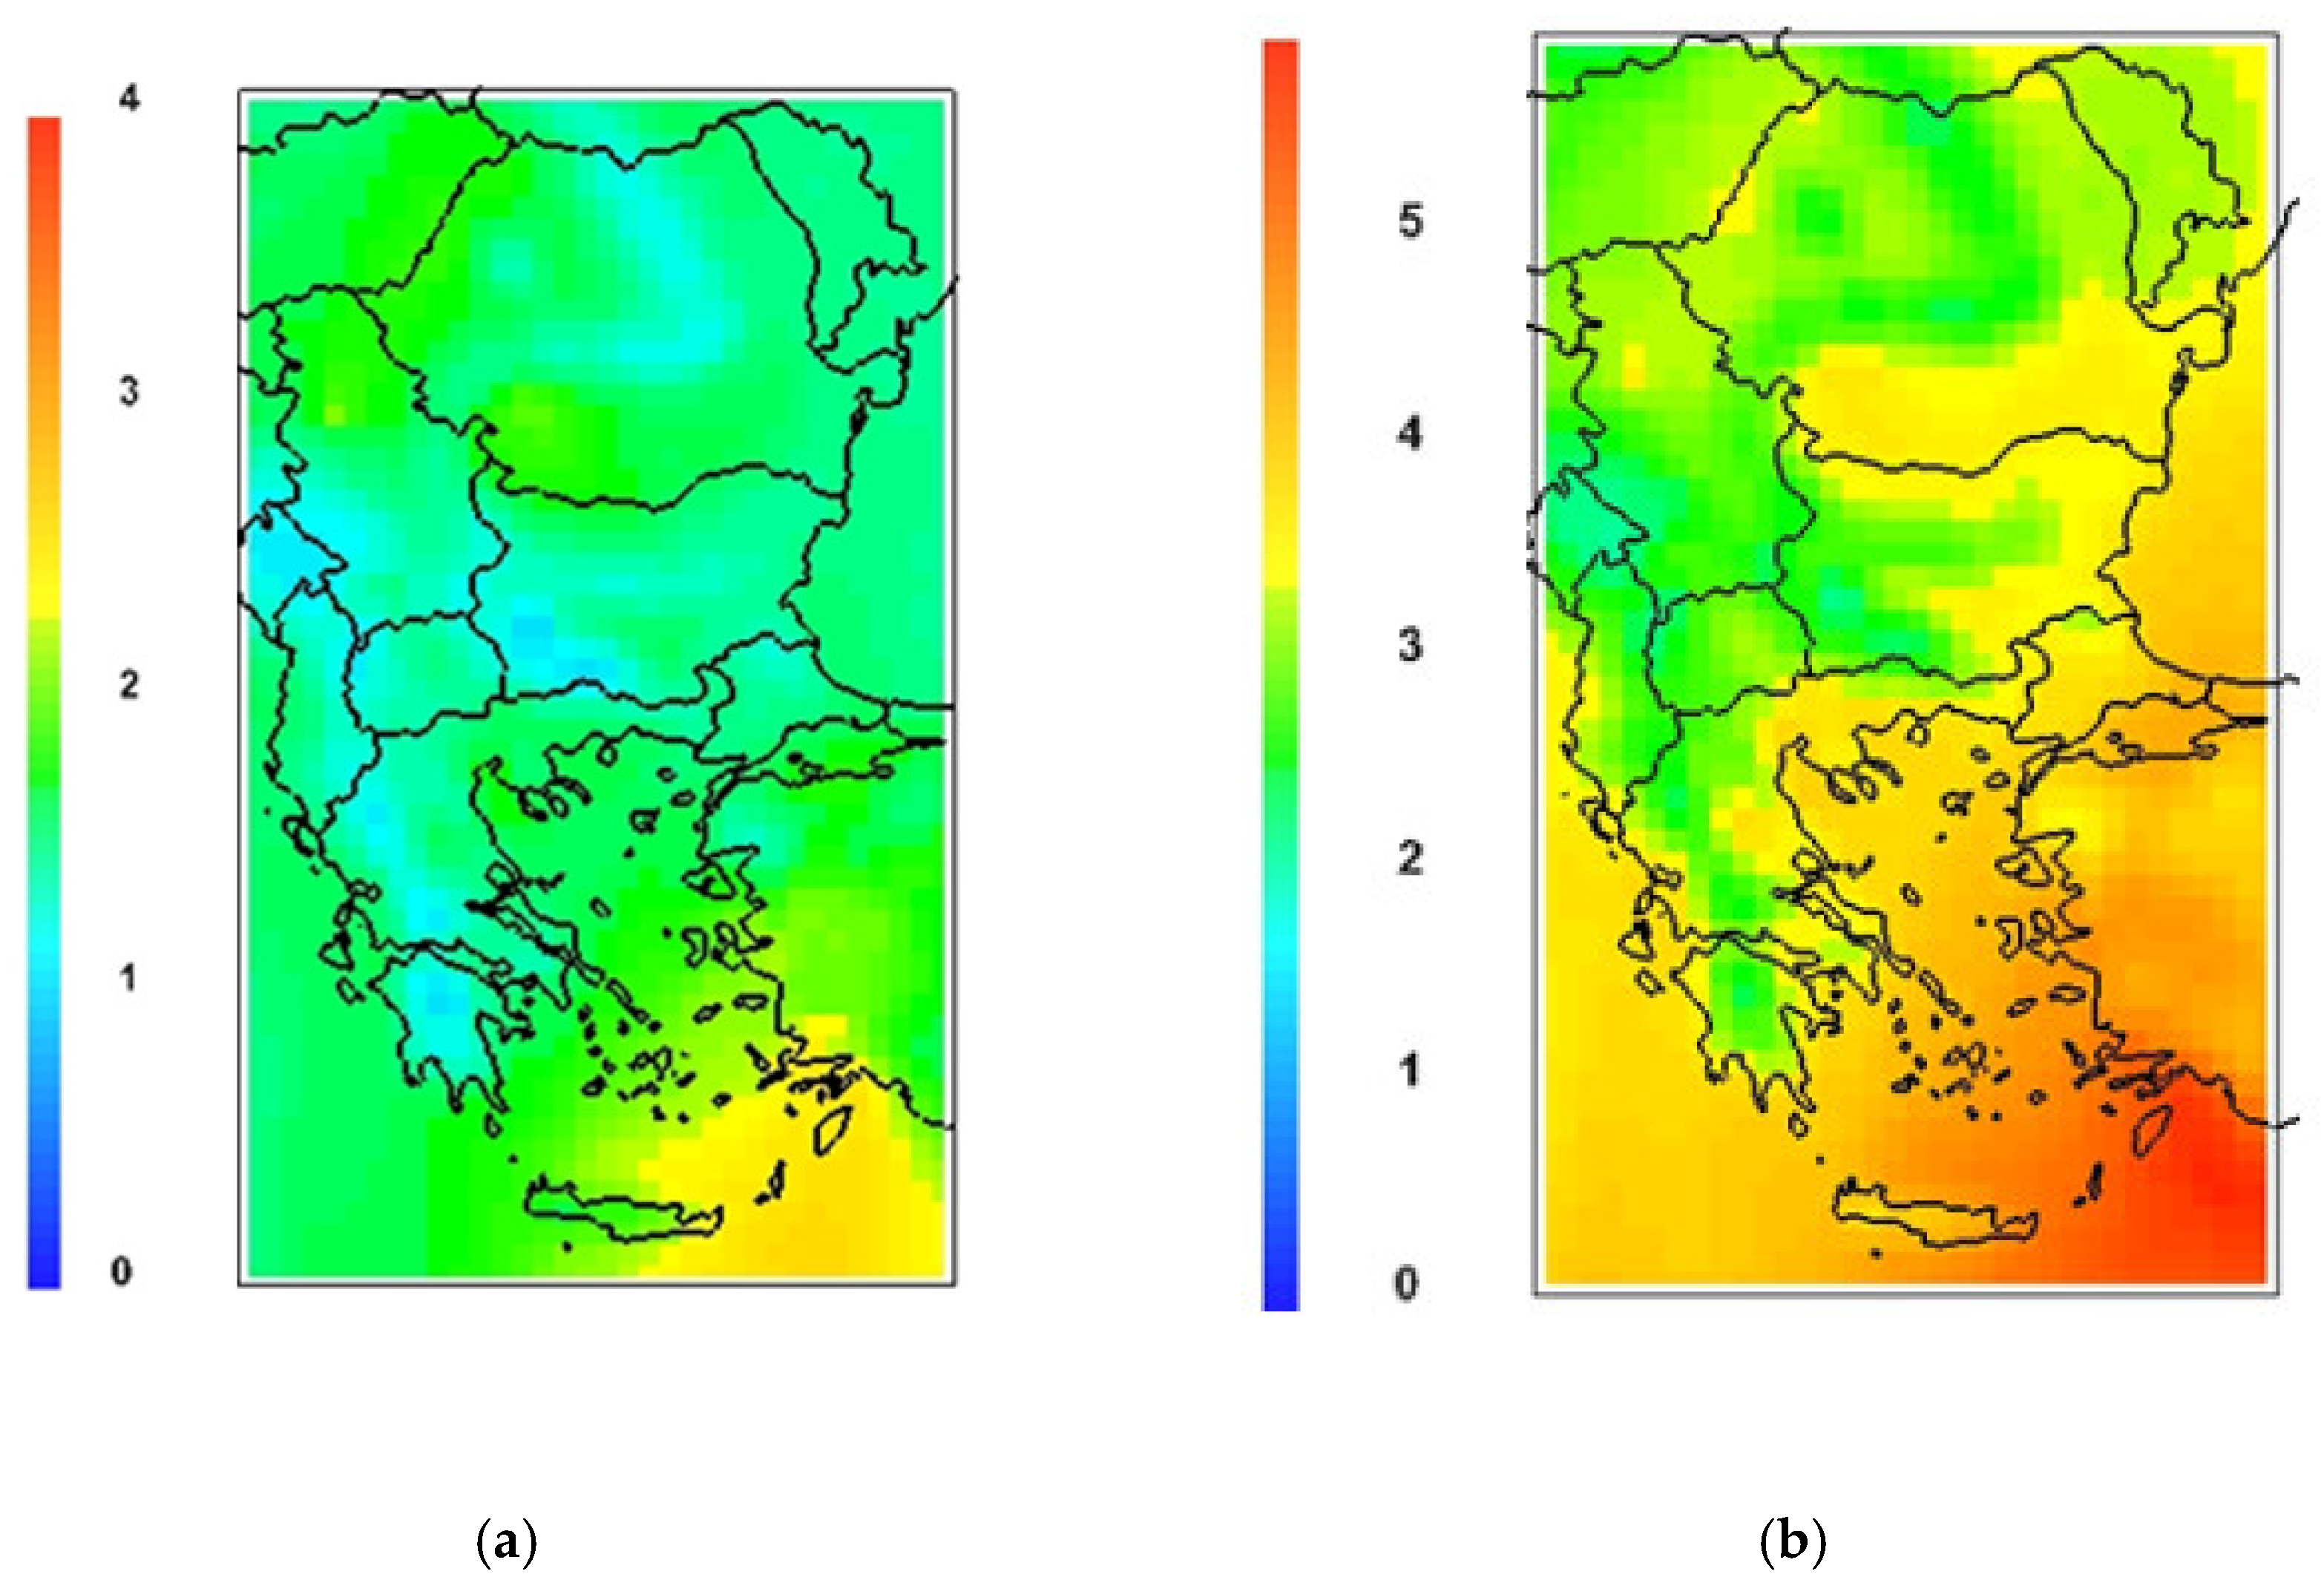

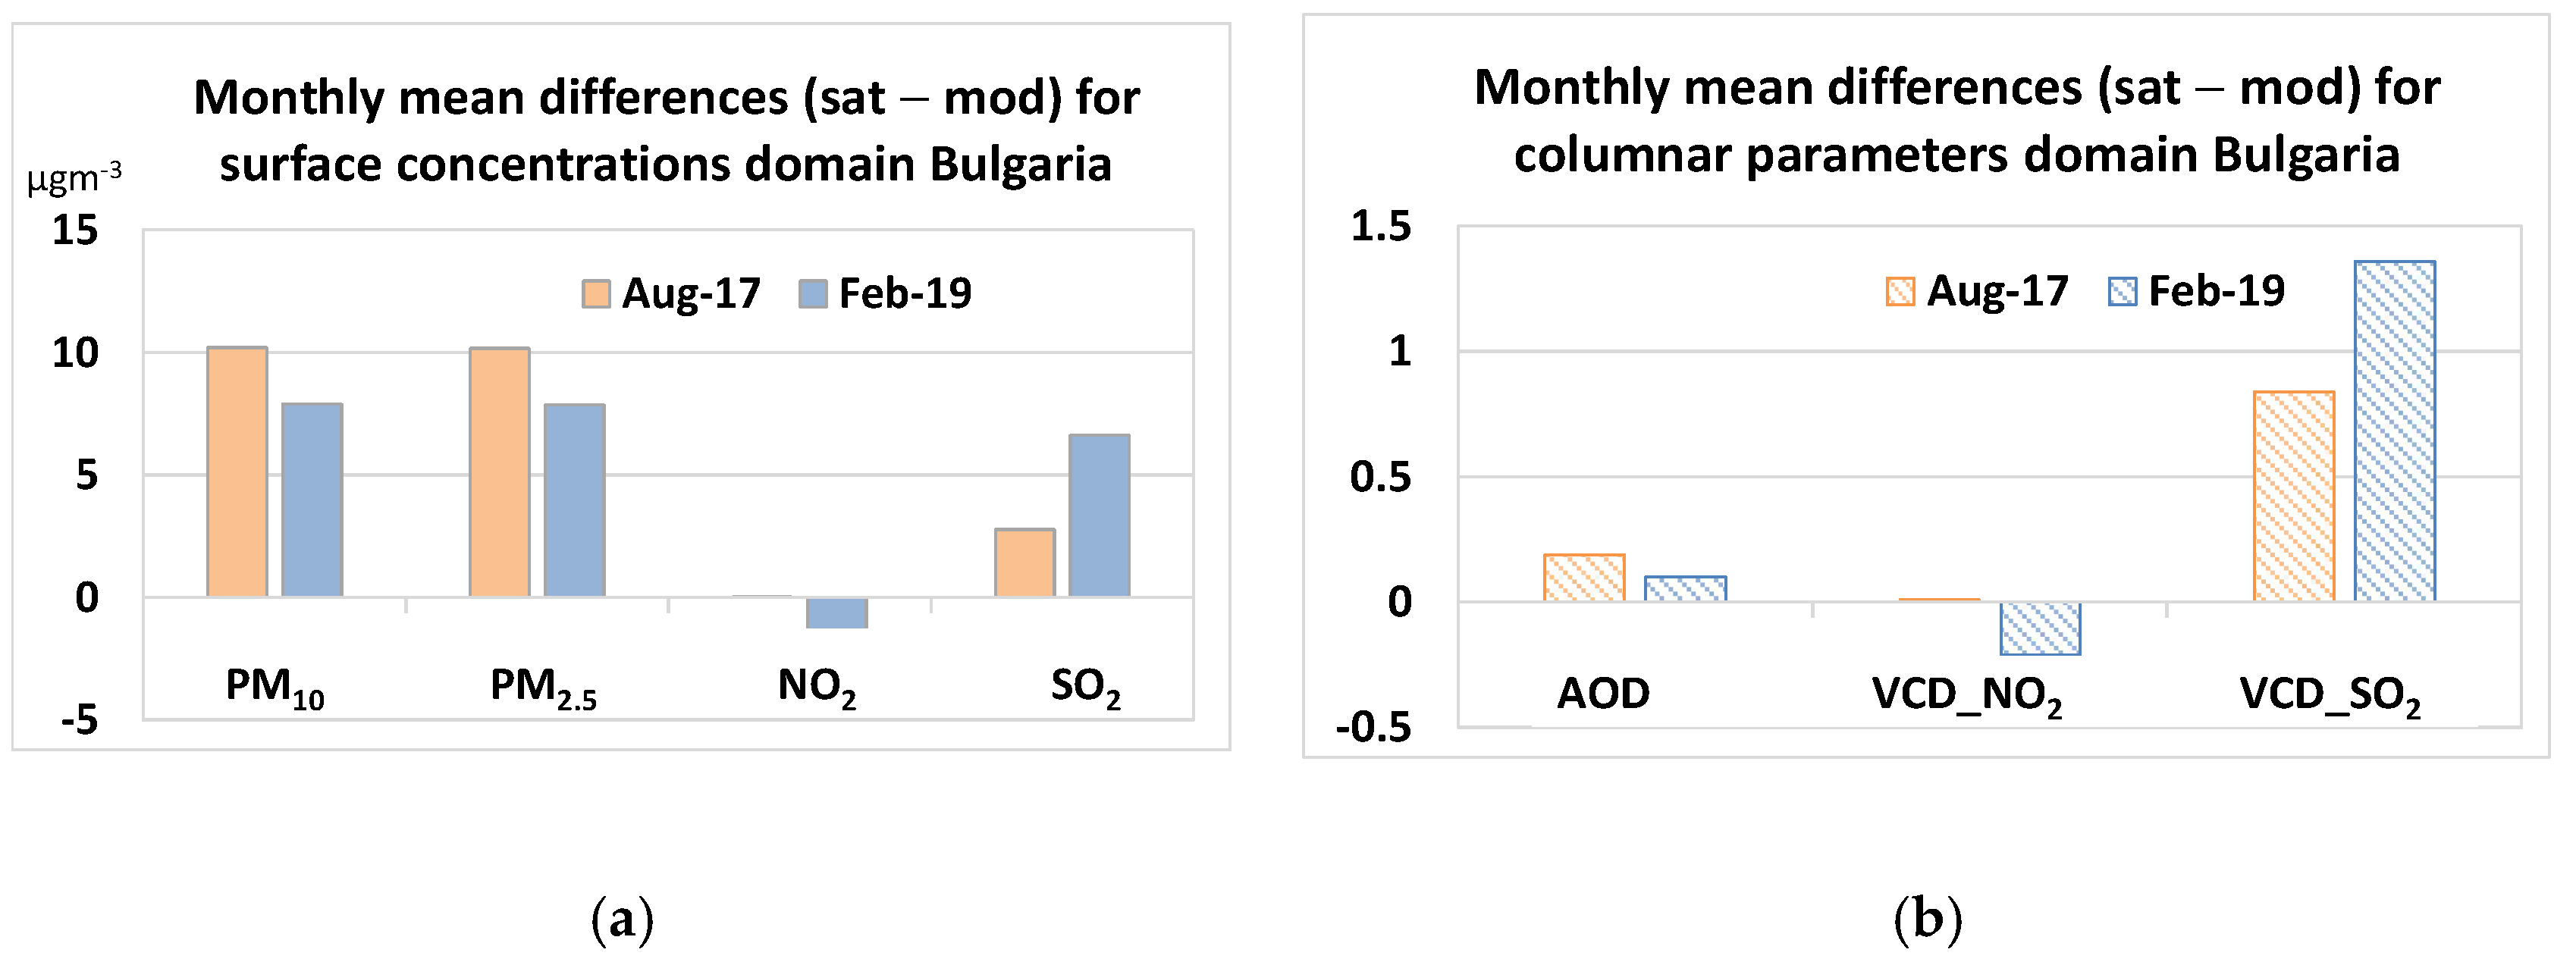

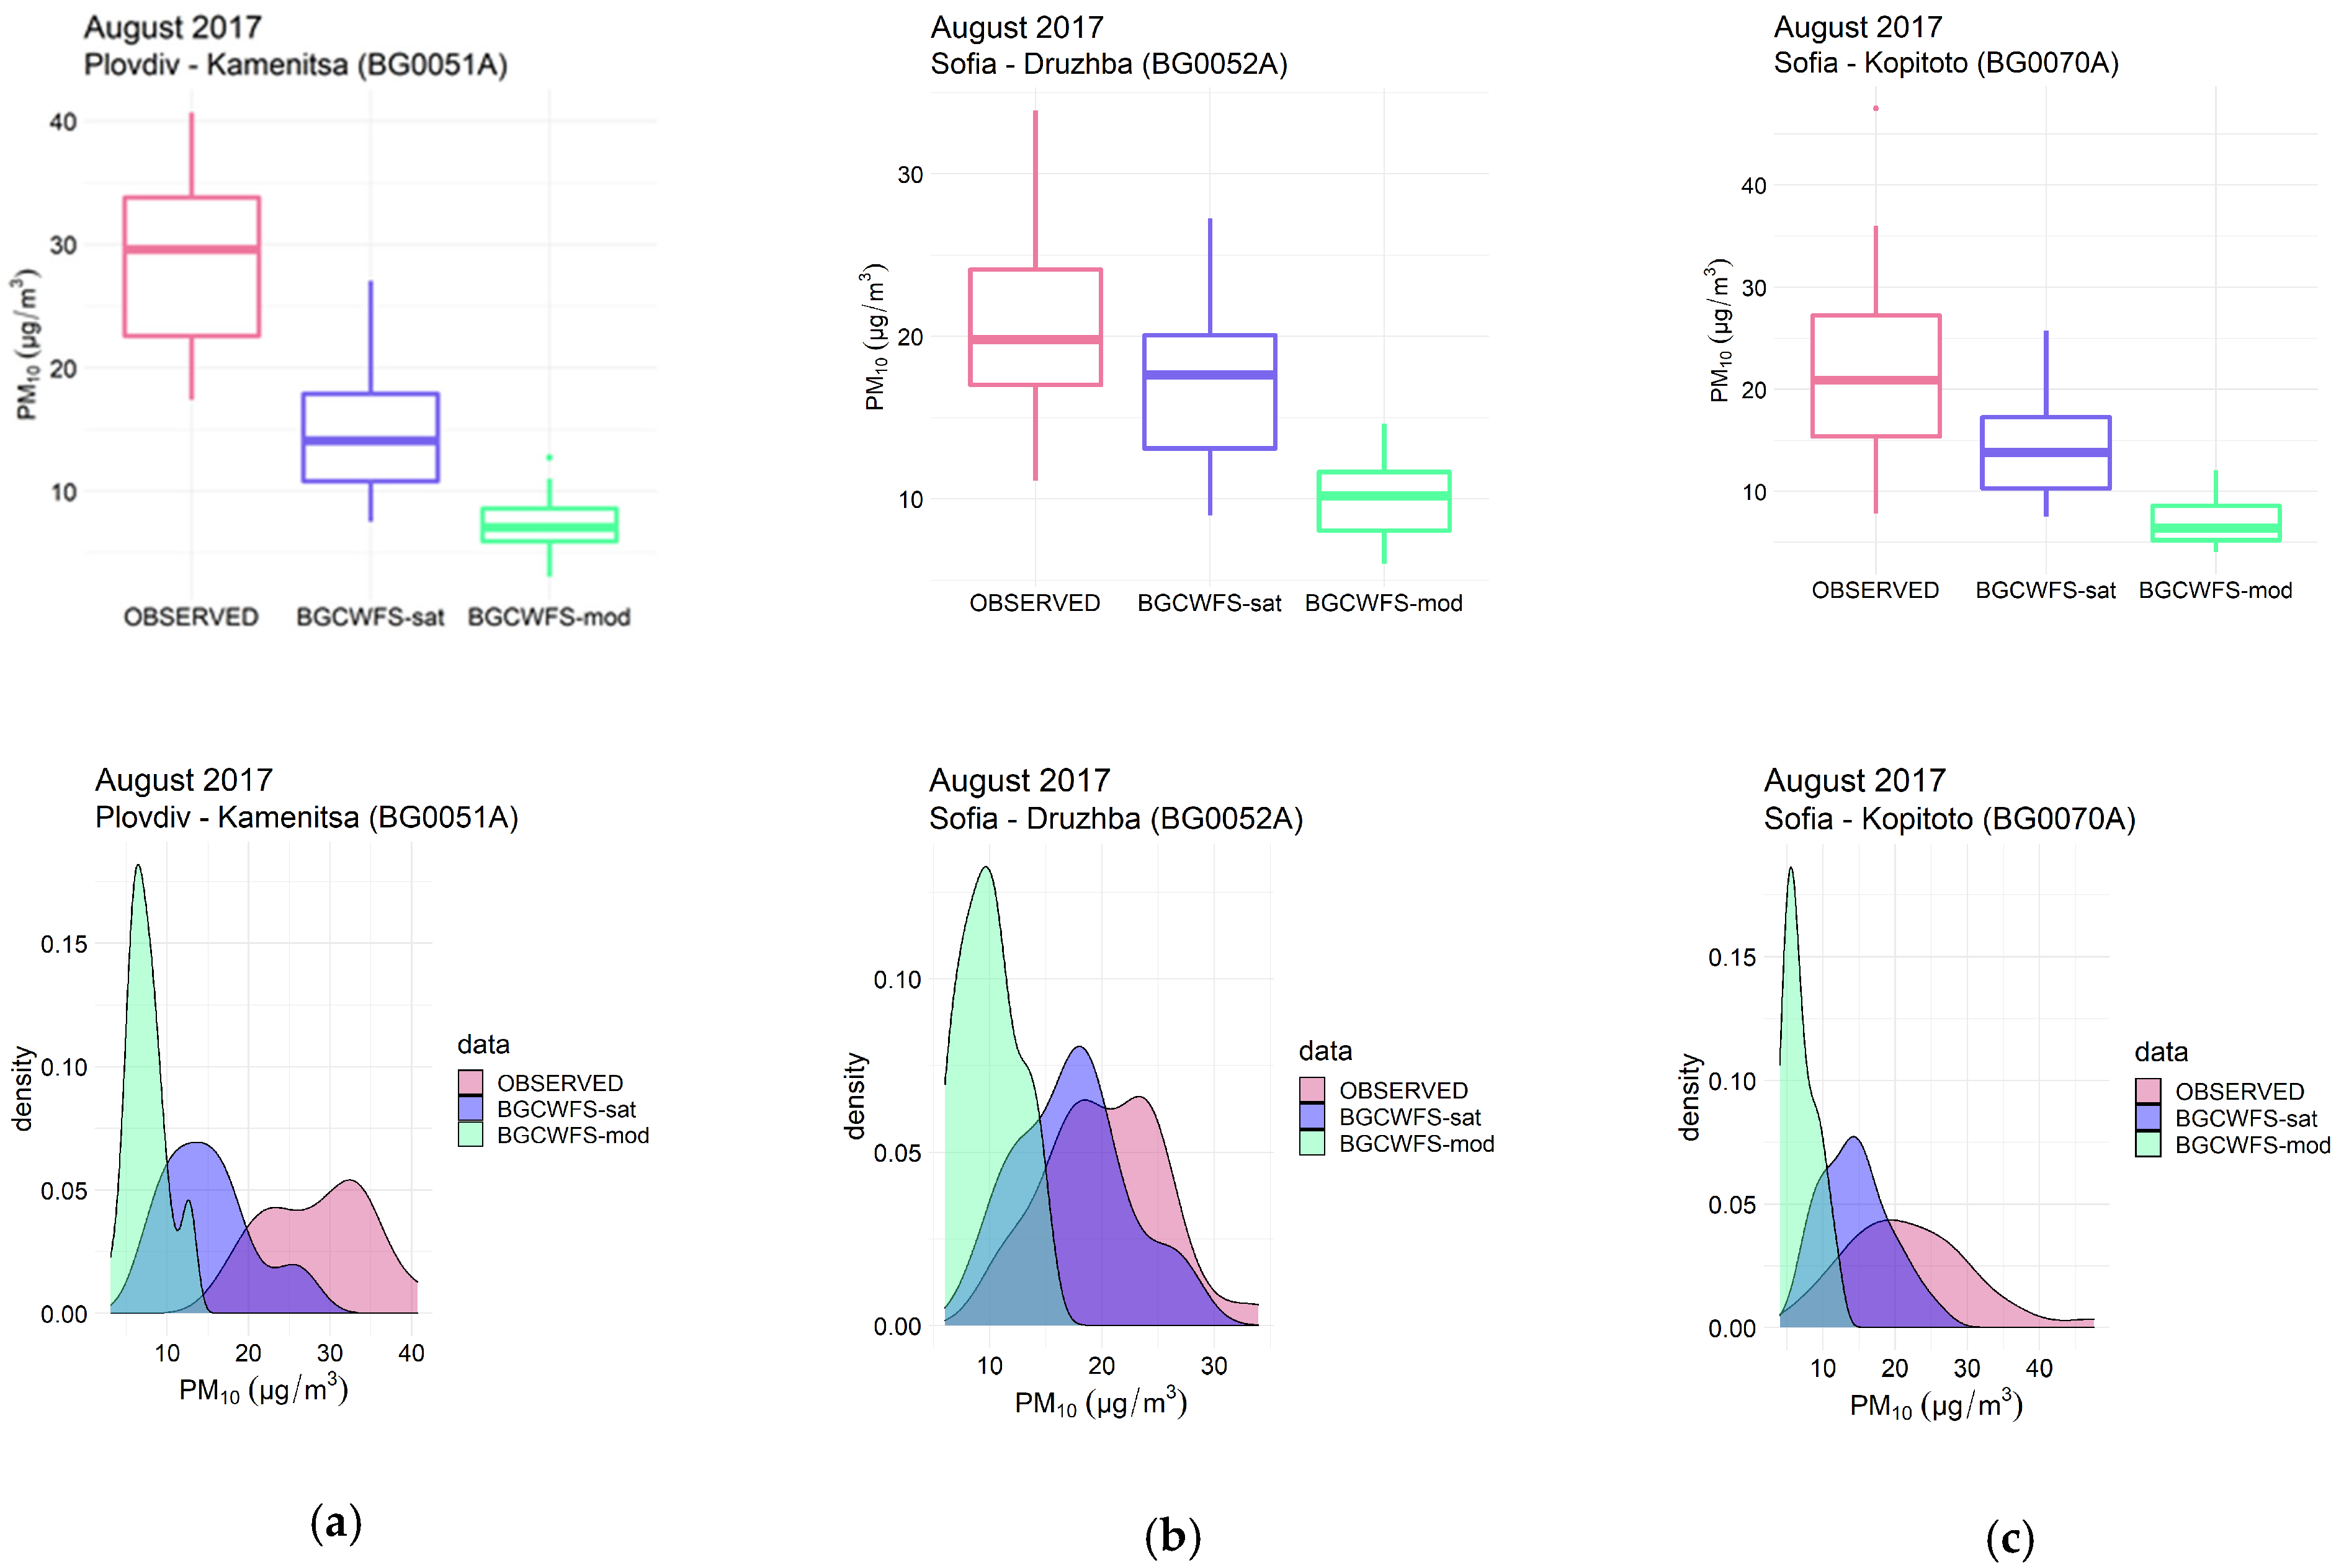
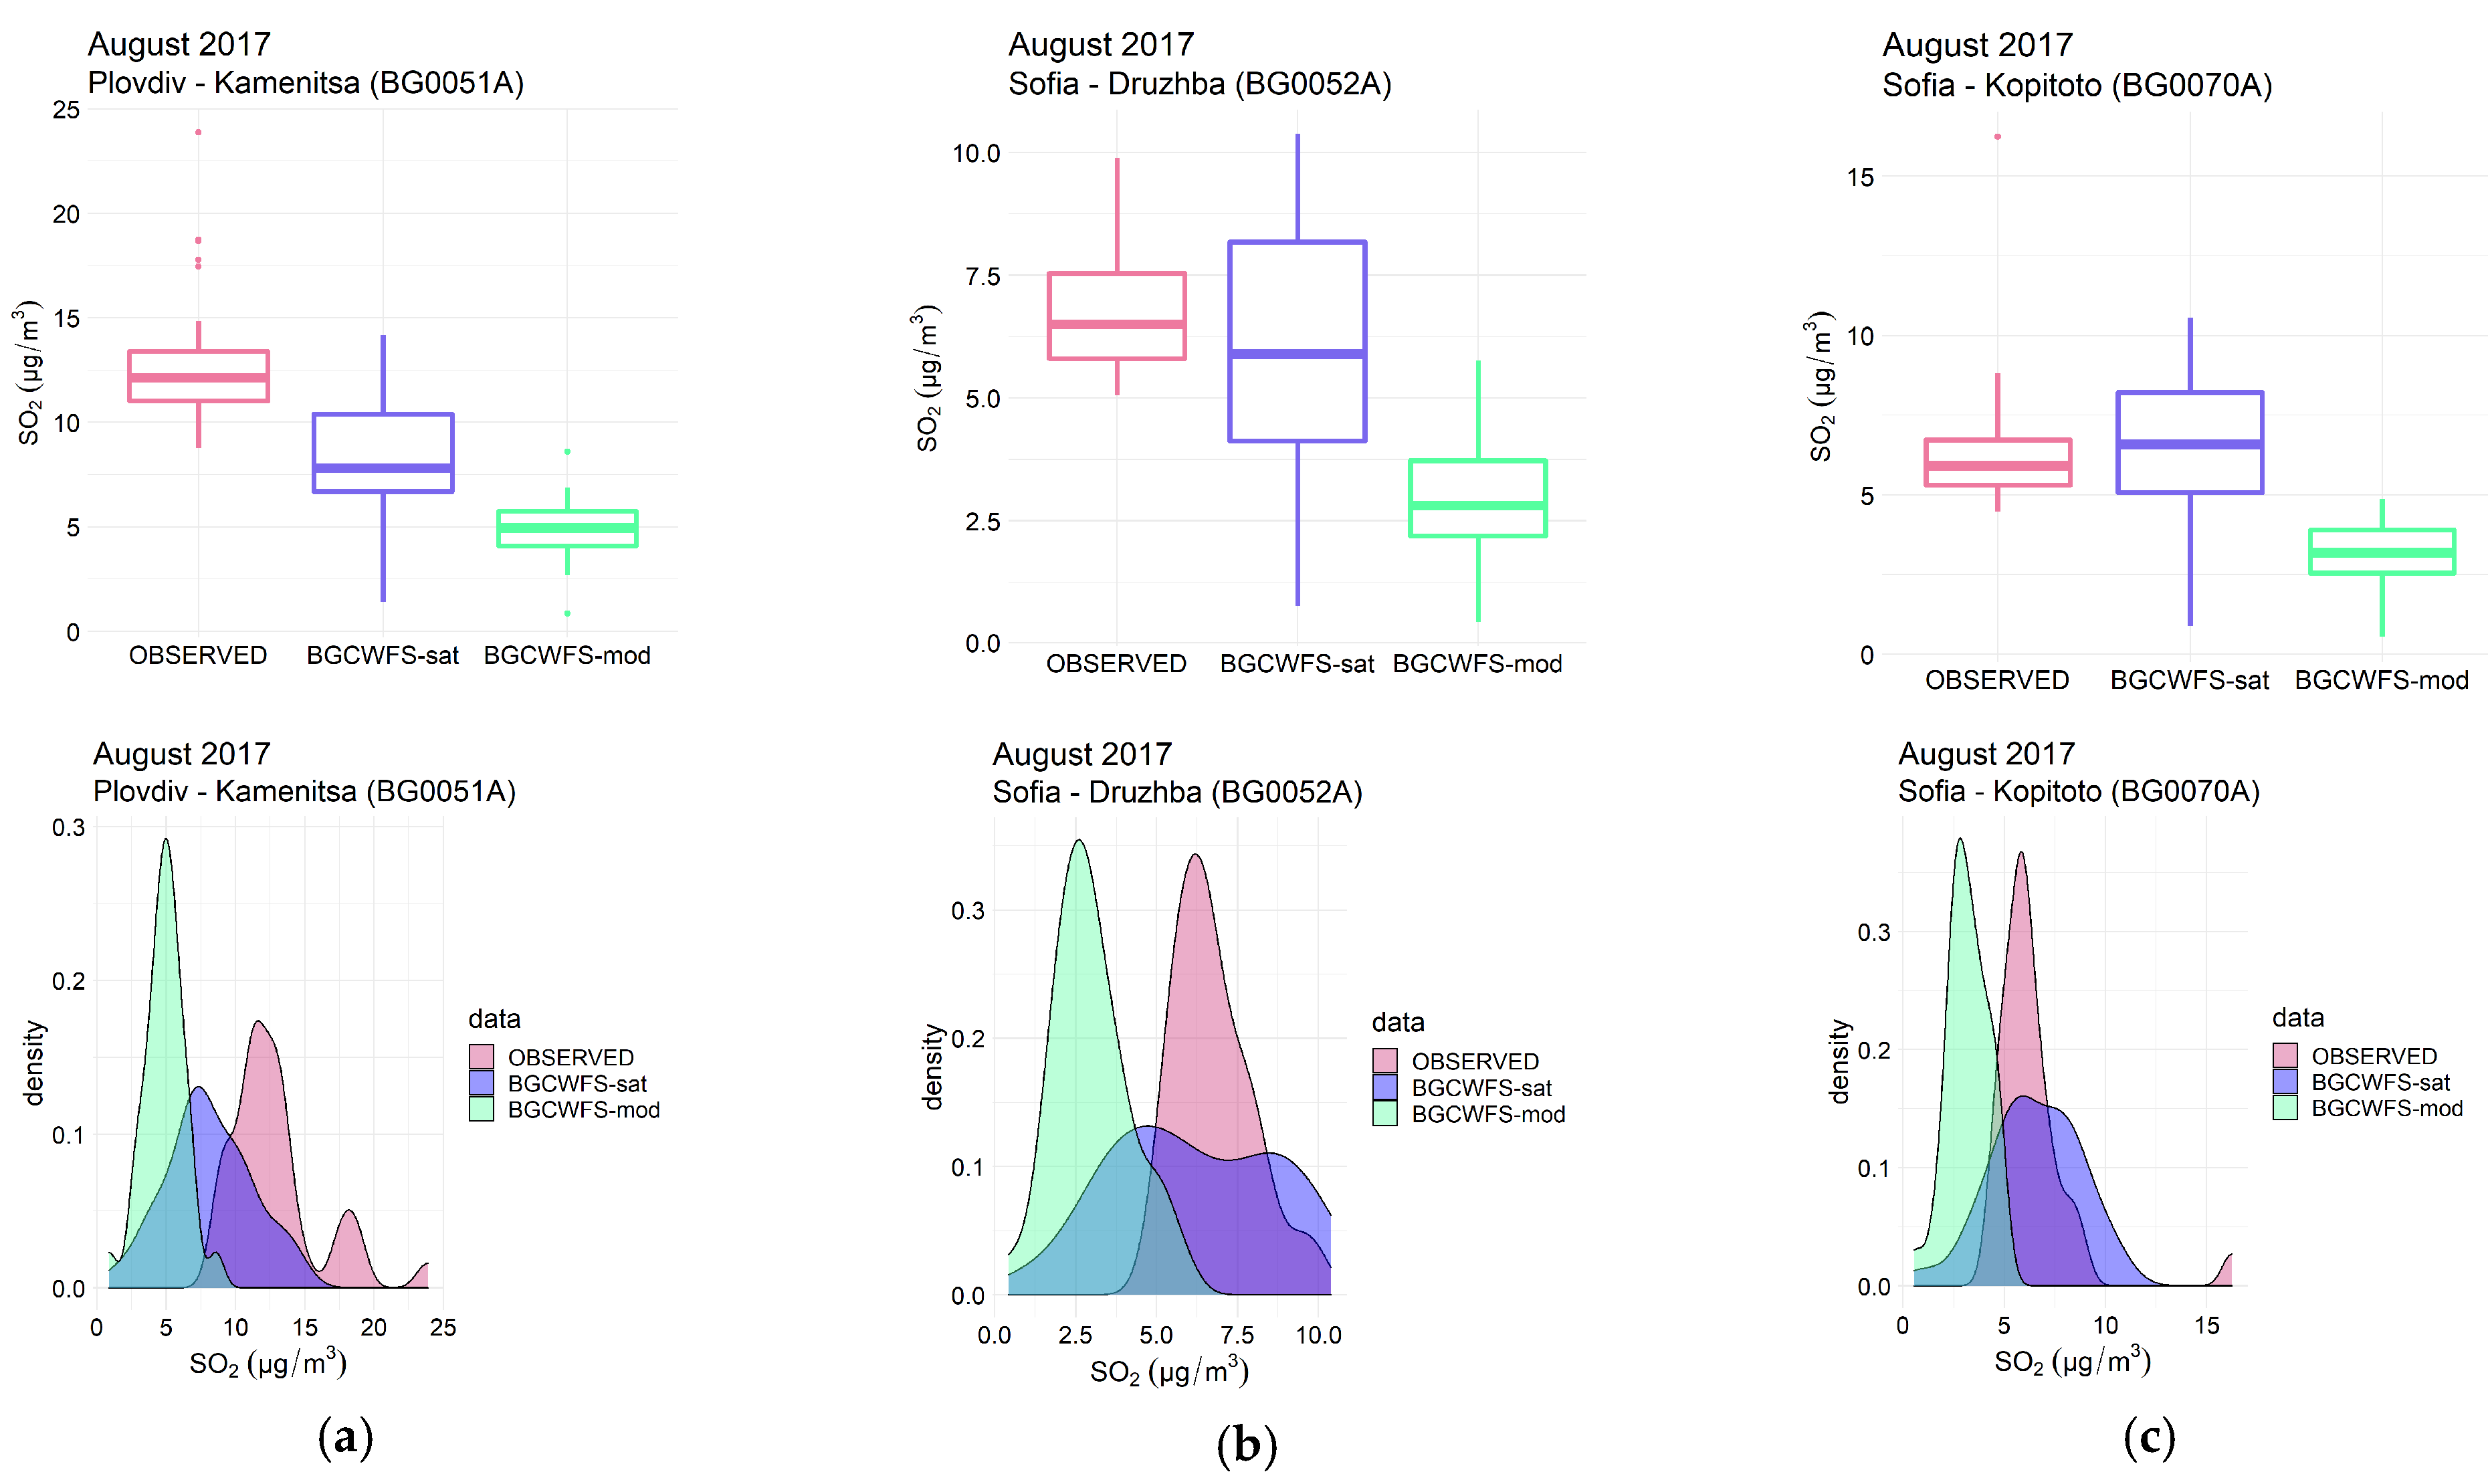
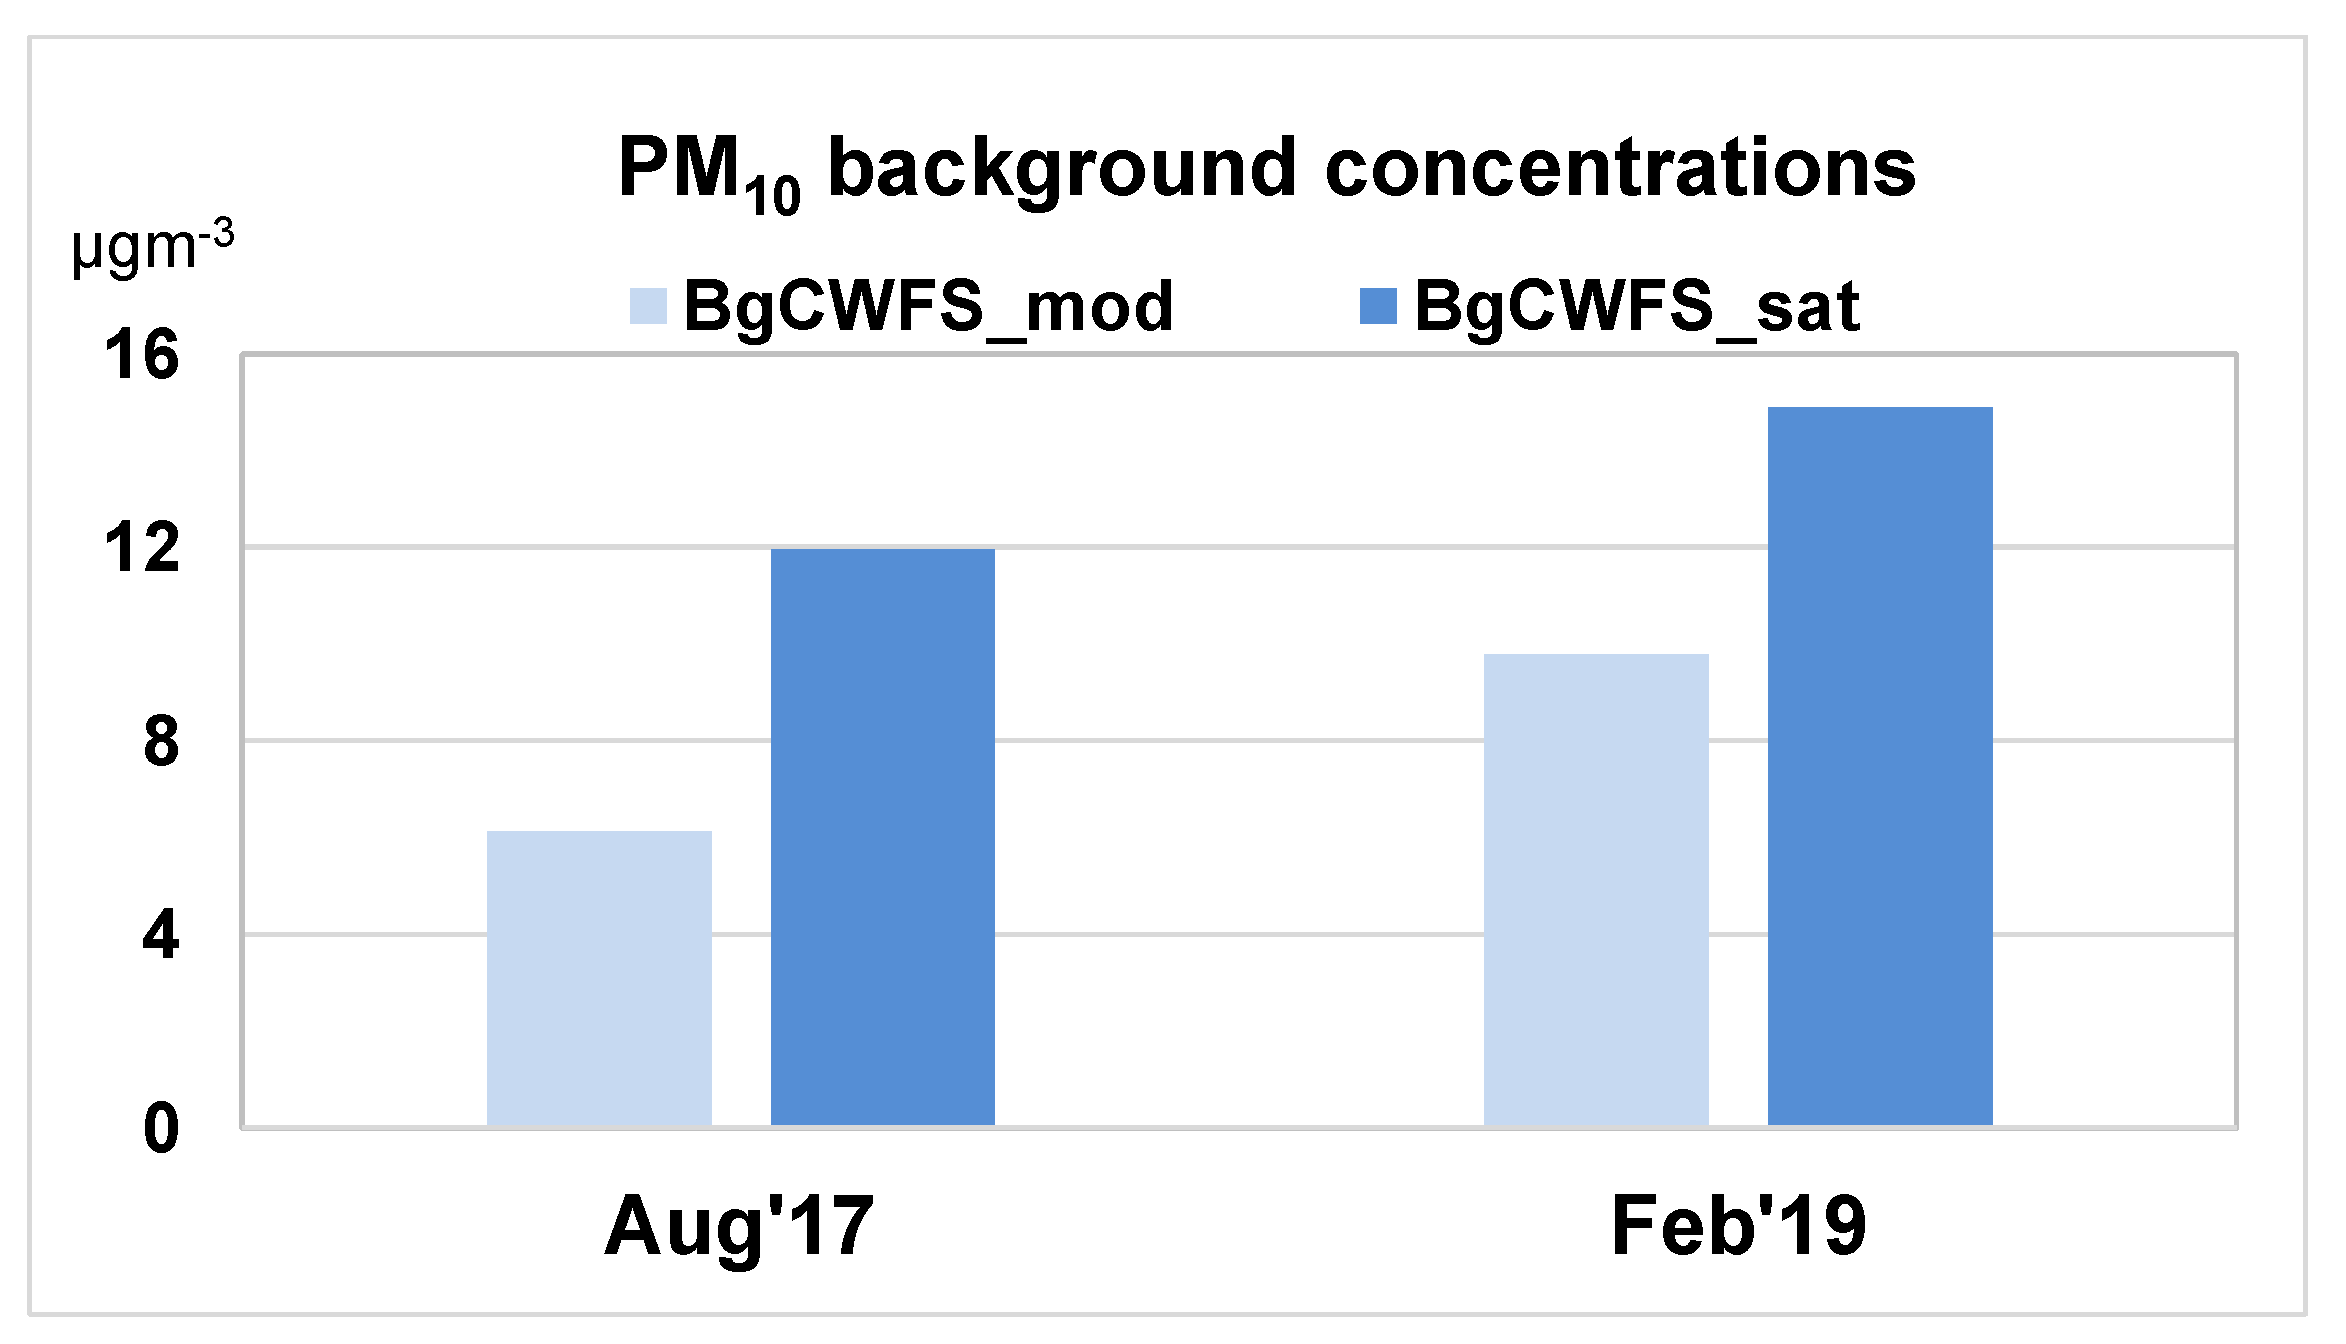
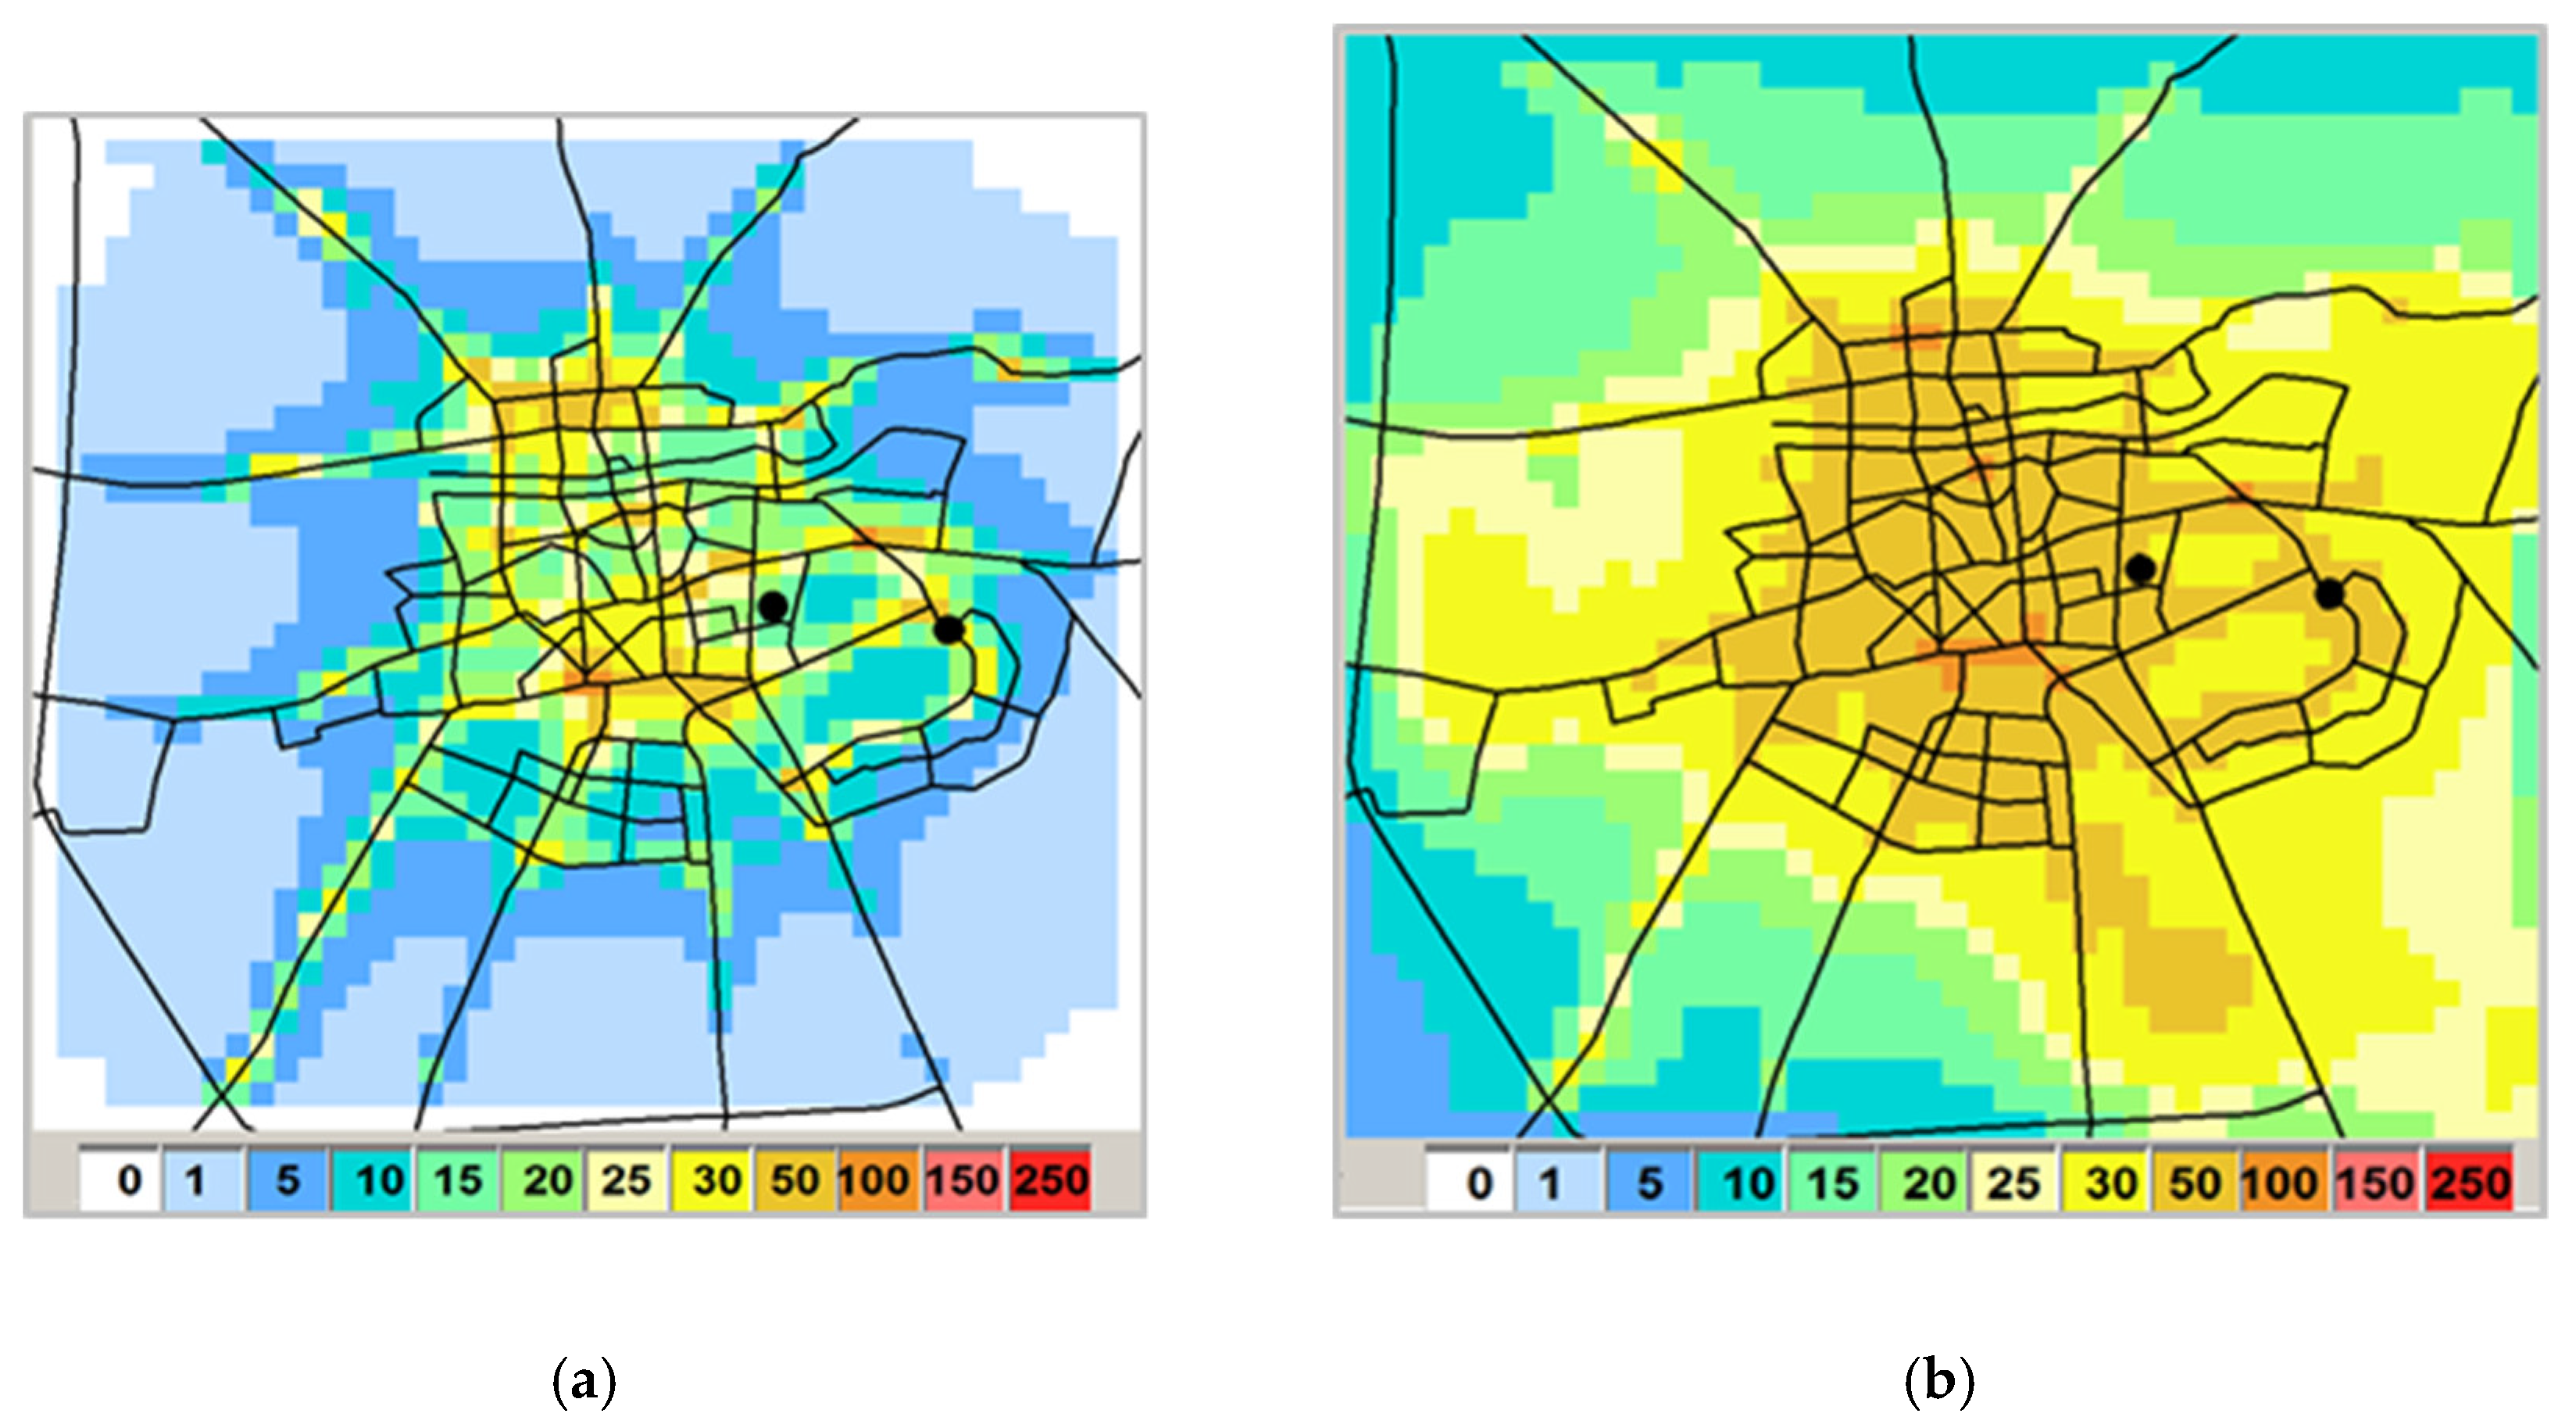
| August-2017 | Mean Model µgm−3 | MBE µgm−3 | RMSE µgm−3 | Corr | FGE | NMB % |
|---|---|---|---|---|---|---|
| PM10 (Nstations = 24) Mean OBS = 25.68 µgm−3 | ||||||
| BgCWFS_sat | 17.54 | −8.14 | 12.46 | 0.34 | 0.48 | −31.69 |
| BgCWFS_mod | 9.17 | −16.51 | 17.99 | 0.38 | 0.92 | −64.29 |
| PM2.5 (Nstations = 8) Mean OBS = 13.55 µgm−3 | ||||||
| BgCWFS_sat | 14.84 | 1.29 | 6.14 | 0.45 | 0.38 | 9.49 |
| BgCWFS_mod | 7.15 | −6.41 | 7.45 | 0.49 | 0.61 | −47.26 |
| NO2 (Nstations = 12) Mean OBS = 18.03 µgm−3 | ||||||
| BgCWFS_sat | 2.74 | −15.29 | 16.17 | 0.22 | 1.40 | −84.80 |
| BgCWFS_mod | 2.69 | −15.34 | 16.22 | 0.16 | 1.41 | −85.10 |
| SO2 (Nstations = 12) Mean OBS = 6.51 µgm−3 | ||||||
| BgCWFS_sat | 5.70 | −0.81 | 4.33 | 0.11 | 0.56 | −12.50 |
| BgCWFS_mod | 2.72 | −3.78 | 4.36 | 0.19 | 0.71 | −58.16 |
| February 2019 | Mean Model µgm−3 | MBE µgm−3 | RMSE µgm−3 | Corr | FGE | NMB % |
|---|---|---|---|---|---|---|
| PM10 (Nstations = 17) Mean OBS = 35.30 µgm−3 | ||||||
| BgCWFS_sat | 23.25 | −12.05 | 24.45 | 0.33 | 0.59 | −34.13 |
| BgCWFS_mod | 17.00 | −18.30 | 27.17 | 0.32 | 0.72 | −51.84 |
| PM2.5 (Nstations = 4) Mean OBS = 18.55 µgm−3 | ||||||
| BgCWFS_sat | 24.57 | 6.02 | 18.31 | 0.19 | 0.67 | 32.44 |
| BgCWFS_mod | 17.71 | −0.84 | 14.64 | 0.20 | 0.60 | −4.53 |
| NO2 (Nstations = 13) Mean OBS = 21.38 µgm−3 | ||||||
| BgCWFS_sat | 7.86 | −13.53 | 19.15 | 0.36 | 1.09 | −63.25 |
| BgCWFS_mod | 9.29 | −12.09 | 18.36 | 0.25 | 0.95 | −56.55 |
| SO2 (Nstations = 15) Mean OBS = 12.06 µgm−3 | ||||||
| BgCWFS_sat | 9.56 | −2.50 | 8.33 | 0.44 | 0.65 | −20.75 |
| BgCWFS_mod | 4.42 | −7.64 | 8.91 | 0.47 | 0.98 | −63.38 |
| PM10 (µgm−3) | BgCWFS_mod | BgCWFS_sat | |||
|---|---|---|---|---|---|
| Kamenitza | Trakia | Kamenitza | Trakia | ||
| Calculated by LAQMS | Household heating | 0 | 0 | 0 | 0 |
| Traffic | 18.96 | 22.30 | 18.96 | 22.30 | |
| Industry | 0.04 | 0.01 | 0.04 | 0.01 | |
| Background from BgCWFS | 6.13 | 6.13 | 11.96 | 11.96 | |
| Simulated BgCWFS plus LAQMS | 25.13 | 28.44 | 30.96 | 34.27 | |
| observed | 28.48 | 36.42 | 28.48 | 36.42 | |
| NMB % | −11.76 | −21.91 | 8.72 | −5.89 | |
| PM10 (µgm−3) | BgCWFS_mod | BgCWFS_sat | |||
|---|---|---|---|---|---|
| Kamenitza | Trakia | Kamenitza | Trakia | ||
| Calculated by LAQMS | Household heating | 23.4 | 23.58 | 23.4 | 23.58 |
| Traffic | 14.96 | 19.85 | 14.96 | 19.85 | |
| Industry | 0.03 | 0.01 | 0.03 | 0.01 | |
| Background from BgCWFS | 9.80 | 9.80 | 14.90 | 14.90 | |
| Simulated BgCWFS plus LAQMS | 48.19 | 53.24 | 53.29 | 58.34 | |
| observed | 50.00 | 70.60 | 50.00 | 70.60 | |
| NMB% | −3.62 | −24.59 | 6.58 | −17.36 | |
Publisher’s Note: MDPI stays neutral with regard to jurisdictional claims in published maps and institutional affiliations. |
© 2021 by the authors. Licensee MDPI, Basel, Switzerland. This article is an open access article distributed under the terms and conditions of the Creative Commons Attribution (CC BY) license (https://creativecommons.org/licenses/by/4.0/).
Share and Cite
Georgieva, E.; Syrakov, D.; Atanassov, D.; Spassova, T.; Dimitrova, M.; Prodanova, M.; Veleva, B.; Kirova, H.; Neykova, N.; Neykova, R.; et al. Use of Satellite Data for Air Pollution Modeling in Bulgaria. Earth 2021, 2, 586-604. https://doi.org/10.3390/earth2030034
Georgieva E, Syrakov D, Atanassov D, Spassova T, Dimitrova M, Prodanova M, Veleva B, Kirova H, Neykova N, Neykova R, et al. Use of Satellite Data for Air Pollution Modeling in Bulgaria. Earth. 2021; 2(3):586-604. https://doi.org/10.3390/earth2030034
Chicago/Turabian StyleGeorgieva, Emilia, Dimiter Syrakov, Dimiter Atanassov, Tatiana Spassova, Maria Dimitrova, Maria Prodanova, Blagorodka Veleva, Hristina Kirova, Nadya Neykova, Rozeta Neykova, and et al. 2021. "Use of Satellite Data for Air Pollution Modeling in Bulgaria" Earth 2, no. 3: 586-604. https://doi.org/10.3390/earth2030034
APA StyleGeorgieva, E., Syrakov, D., Atanassov, D., Spassova, T., Dimitrova, M., Prodanova, M., Veleva, B., Kirova, H., Neykova, N., Neykova, R., Hristova, E., & Petrov, A. (2021). Use of Satellite Data for Air Pollution Modeling in Bulgaria. Earth, 2(3), 586-604. https://doi.org/10.3390/earth2030034


