Abstract
Integration of land cover change with soil information is important for valuation of soil carbon (C) regulating ecosystem services (ES) and disservices (ED) and for site-specific land management. The objective of this study was to assess the change in value of regulating ES from soil organic carbon (SOC), soil inorganic carbon (SIC), and total soil carbon (TSC) stocks, based on the concept of the avoided social cost of carbon dioxide (CO2) emissions for the state of South Carolina (SC) in the United States of America (U.S.A.) by soil order (Soil Taxonomy), land cover, and land cover change (National Land Cover Database, NLCD) using information from the State Soil Geographic (STATSGO) and Soil Survey Geographic Database (SSURGO) databases. Classified land cover data for 2001 and 2016 were downloaded from the Multi-Resolution Land Characteristics Consortium (MRLC) website. The total estimated monetary mid-point value for TSC in the state of South Carolina was $124.42B (i.e., $124.42 billion U.S. dollars, where B = billion = 109) with the following monetary distribution in 2016 and percent change in value between 2001 and 2016: barren land ($259.7M, −9%) (i.e., $259.7 million U.S. dollars, where M = million = 106), woody wetlands ($33.8B, −1%), shrub/scrub ($3.9B, +9%), mixed forest ($6.9B, +5%), deciduous forest ($10.6B, −7%), herbaceous ($4.8B, −5%), evergreen forest ($28.6B, +1%), emergent herbaceous wetlands ($6.9B, −3%), hay/pasture ($7.3B, −10%), cultivated crops ($9.9B, 0%), developed, open space ($7.0B, +5%), developed, medium intensity ($978M, +46%), developed, low intensity ($2.9B, +15%), and developed, high intensity ($318M, +39%). The percent change in monetary values was different from percent change in areas because different soil orders have different TSC contents. The percent changes (between 2001 and 2016) both in areas and monetary values varied by soil order and land cover with $1.1B in likely “realized” social cost of C mostly associated with Ultisols ($658.8M). The Midlands region of the state experienced the highest gains in the “high disturbance” classes and corresponding SC-CO2 with over $421M for TSC, $354.6M for SOC, and $66.4M for SIC. Among counties, Horry County ranked first with over $142.2M in SC-CO2 for TSC, followed by Lexington ($103.7M), Richland ($95.3M), Greenville ($81.4M), York ($77.5M), Charleston ($70.7M), Beaufort ($64.1M), Berkeley ($50.9M), Spartanburg ($50.0M), and Aiken ($43.0M) counties. Spatial and temporal analyses of land cover can identify critical locations of soil carbon regulating ecosystem services at risk.
1. Introduction
Ecosystem services (ES) are the benefits people obtain from nature, which fall into three categories: provisioning (e.g., food, etc.), regulation/maintenance (e.g., gas regulation, etc.), and cultural (e.g., recreation, etc.) [1,2]. Ecosystem disservices (ED) are damages, which can be of natural and/or anthropogenic origin [2]. Soil carbon is composed of soil organic (SOC) and soil inorganic carbon (SIC) and provides numerous ES (e.g., provisioning, regulating) [3,4,5]. For example, soil C sequestration is a regulating ES, which results in the removal of carbon dioxide (CO2) from the atmosphere and subsequent storage in the soil, thereby avoiding social costs of CO2 (SC-CO2) emissions [3,4]. Common ED associated with SOC and SIC is the release of carbon dioxide (CO2) from various uses (e.g., agriculture, urbanization, etc.) into the atmosphere, which manifests in realized social SC-CO2 [6,7]. Land cover change analysis is particularly useful in ES/ED assessments because it reveals “patterns of human activities over time and space as well as the capacities of different ecosystems to provide ES/ED under changing land use” [8,9,10].
Traditional ES land cover analysis focuses primarily on land cover changes without integration of specific soil types and their properties [9]. Integration of land cover analysis with soil types allows the identification of hotspots of ES/ED and its temporal changes (Figure 1) [11]. For example, Brown and Quinn (2018) [12] studied the ES change in Upstate South Carolina using the InVEST model [13] to estimate SOC change (among other variables). The InVEST model assumes fixed soil carbon values associated with land cover classes to assess change and does not leverage the available soil spatial data, which could have helped identify hotspots of ES/ED change and its underlying biophysical characteristics (Figure 1).
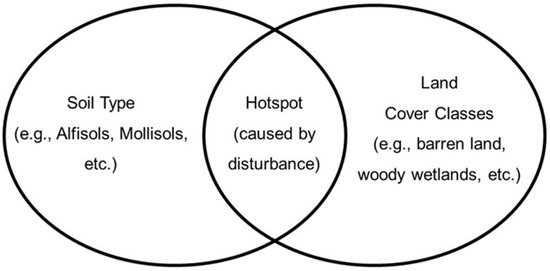
Figure 1.
The soil “hotspot” concept—an intersection between soil type and land cover classes under natural or anthropogenic disturbance (adapted from Bétard and Peulvast, 2019 [14]).
Previous research on soil C regulating ES in the state of South Carolina estimated the avoided social costs of carbon attributed to soil organic carbon (SOC, $107.14B), soil inorganic carbon (SIC, $17.22B), and total soil carbon (TSC, $124.36B) and was conducted at various scales using both biophysical (soil orders) and administrative accounts (state, region, county) [15]. That study used pedodiversity concepts (soil order) integrated with administrative units to report and rank estimates of avoided social costs of soil C, which provide practical information to design soil C management at various scales [15].
The present study hypothesizes that pedodiversity concepts overlayed with administrative units (e.g., state) and changes in land cover can be used to identify land cover patterns of soil carbon hotspots for sustainable management (Figure 1). The specific objectives of this study are to assess the value of TSC in the state of South Carolina (U.S.A.) by soil order, land cover class, and land cover change based on the social cost of carbon (SC–CO2) and avoided emissions provided by carbon sequestration, which the U.S. Environmental Protection Agency (EPA) has determined to be $46 per metric ton of CO2, applicable for the year 2025 based on 2007 U.S. dollars and an average discount rate of 3% [16]. This study provides monetary values of TSC for soil depth (0–200 cm) across the state and different land covers (i.e., barren land, woody wetlands, etc.) using State Soil Geographic (STATSGO) database, National Land Cover Database (NLCD), and information previously reported by Guo et al. (2006) [17].
2. Materials and Methods
2.1. Spatial Analysis
Classified land cover data for 2001 and 2016 were downloaded from the Multi-Resolution Land Characteristics Consortium (MRLC) website [18] (Table 1). Changes in land cover were calculated by comparing the 2001 and 2016 land cover maps using the raster calculator function in ArcMap 10.7 [19]. Land cover extent for each of the types of identified land cover (Table 2) was determined by converting the land cover maps to a vector format and then using the union tool with the vector land cover maps and the Soil Survey Geographic database (SSURGO) [20] data layer in ArcMap 10.7 and exporting the results to MS Excel for area analysis (Table 2). The spatial scale of the SSURGO and MRLC is appropriate for associating soil type with land cover change.

Table 1.
Data sources and descriptions.
Table 2.
The classification system, which is used by National Land Cover Database (NLCD) (adapted from USGS, 2012 [21]).
2.2. The Accounting Framework
The present study used both biophysical (science-based) and administrative/land cover (boundary-based) accounts to calculate monetary values for SOC, SIC, and TSC (Table 3 and Table 4).
Table 3.
A conceptual overview of the accounting framework used in this study (adapted from Groshans et al., 2018 [5]).
Table 4.
Area-normalized content (kg m−2) and monetary values ($ m−2) of soil organic carbon (SOC), soil inorganic carbon (SIC), total soil carbon (TSC) by soil order based on numbers (midpoint soil organic carbon, soil inorganic carbon) in the upper 2-m of the soil from Guo et al., 2006 [17] and a social cost of carbon (SC-CO2) of $46 per metric ton of CO2 (2007 U.S. dollars with an average discount rate of 3% [16]).
The present study is based on SOC, SIC, and TSC (SOC + SIC) [17] estimates for the SOC, SIC, TSC storage (in Mg or metric tons) and contents (in kg m−2) in the contiguous U.S. from Guo et al. (2006) [17]. A monetary valuation for SOC, SIC, TSC was calculated using the social cost of carbon (SC-CO2) of $46 per metric ton of CO2, which is applicable for 2025 based on 2007 U.S. dollars and an average discount rate of 3% [16]. According to the EPA, the SC-CO2 is intended to be a comprehensive estimate of climate change damages. Still, it can underestimate the true damages and cost of CO2 emissions due to the exclusion of various important climate change impacts recognized in the literature [16]. Soil carbon (SC) storage and content estimates were converted to U.S. dollars and dollars per square meter in Microsoft Excel using the following equations, with a social cost of carbon of $46/Mg CO2 (a metric ton is equivalent to 1 megagram (Mg) or 1000 kilograms (kg)):
Table 4 presents area-normalized content (kg m−2) and monetary values ($ m−2) of soil carbon, which were used to estimate TSC storage and TSC value by multiplying corresponding content (values) numbers by an area of a particular soil order within a county, region. For example, for the soil order of Entisols (based on SOC and SIC numbers from Guo et al. (2006) [17]), an area-normalized midpoint TSC content number of 12.8 kg∙m−2 in the upper 2 m of soil (Table 4) was used to calculate the total TSC storage in soil order by multiplying its area in particular county or region. Then, the reported area-normalized midpoint TSC content number of 12.8 kg∙m−2 in the upper 2 m (Table 4) was converted to monetary values ($ m−2) of TSC using a social cost of carbon (SC-CO2) of $46 per metric ton of CO2 (2007 U.S. dollars with an average discount rate of 3% [16]), which is $2.17 m−2 and was used to calculate the total monetary value of TSC storage.
3. Results
3.1. Land Cover Change in South Carolina
Land cover in the state of South Carolina is diverse (Figure 2) with the following distribution including open water (2016, in decreasing order): evergreen forest (23.85%); woody wetlands (19.37%); cultivated croplands (9.05%); deciduous forest (8.84%); hay/pasture (6.58%); open water (6.34%); developed, open space (6.12%); mixed forest (5.77%); herbaceous (3.99%); shrub/scrub (3.28%); developed, low intensity (2.70%); emergent herbaceous wetlands (2.61%); developed, medium intensity (0.92%); developed, high intensity (0.34%); and barren land (0.25%) (Figure 2). Land cover in South Carolina has undergone changes between 2001 and 2016, with a general trend of urbanization leading to losses in “low disturbance” land covers (e.g., deciduous forest) and gains in developed land cover classes (e.g., open, low, medium, and high intensity) (Table 5).
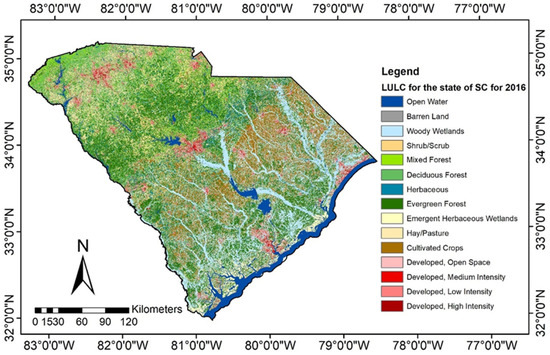
Figure 2.
Land cover map (2016) of South Carolina (SC) (U.S.A.) (33.8361° N, 81.1637° W) (adapted from Multi-Resolution Land Characteristics Consortium [18]).
Table 5.
Land cover change in South Carolina (U.S.A.) between 2001 and 2016 (based on Multi-Resolution Land Characteristics Consortium [18]).
3.2. Land Cover Change and Soil Carbon Regulating Ecosystem Services in South Carolina
The total estimated mid-point monetary value for TSC in South Carolina in 2016 was $124.4B (i.e., $124.4 billion U.S. dollars, where B = billion = 109), with the following monetary distribution and percent change in value between 2001 and 2016: barren land ($259.7M, −9%) (i.e., $259.7 million U.S. dollars, where M = million = 106); woody wetlands ($33.8B, −1%); shrub/scrub ($3.9B, +9%); mixed forest ($6.9B, +5%); deciduous forest ($10.6B, −7%); herbaceous ($4.8B, −5%); evergreen forest ($28.6B, +1%); emergent herbaceous wetlands ($6.9B, −3%); hay/pasture ($7.3B, −10%); cultivated crops ($9.9B, 0%); developed, open space ($7.0B, +5%); developed, medium intensity ($978M, +46%); developed, low intensity ($2.9B, +15%); and developed, high intensity ($318M, +39%) (Table 6). For a particular land cover, the percent change in monetary value can be different from the percent change in area because different soil orders have different TSC contents. Most soil orders experienced losses in “low disturbance” land covers and gains in developed land cover classes with $1.1B in likely “realized” social cost of carbon. Spodosols experienced dramatic increases (% change) in the developed land covers (Table 7).
Table 6.
Soil carbon regulating ecosystem services and land cover change in the state of South Carolina (U.S.A.) between 2001 and 2016 based on total soil carbon (TSC) derived from numbers in the upper 2 m of the soil (by soil type) from Guo et al., 2006 [17] and a social cost of carbon (SC-CO2) of $46 per metric ton of CO2 (2007 U.S. dollars with an average discount rate of 3% [16]).
Table 7.
Land cover change in the state of South Carolina (U.S.A.) between 2001 and 2016 based on soil order.
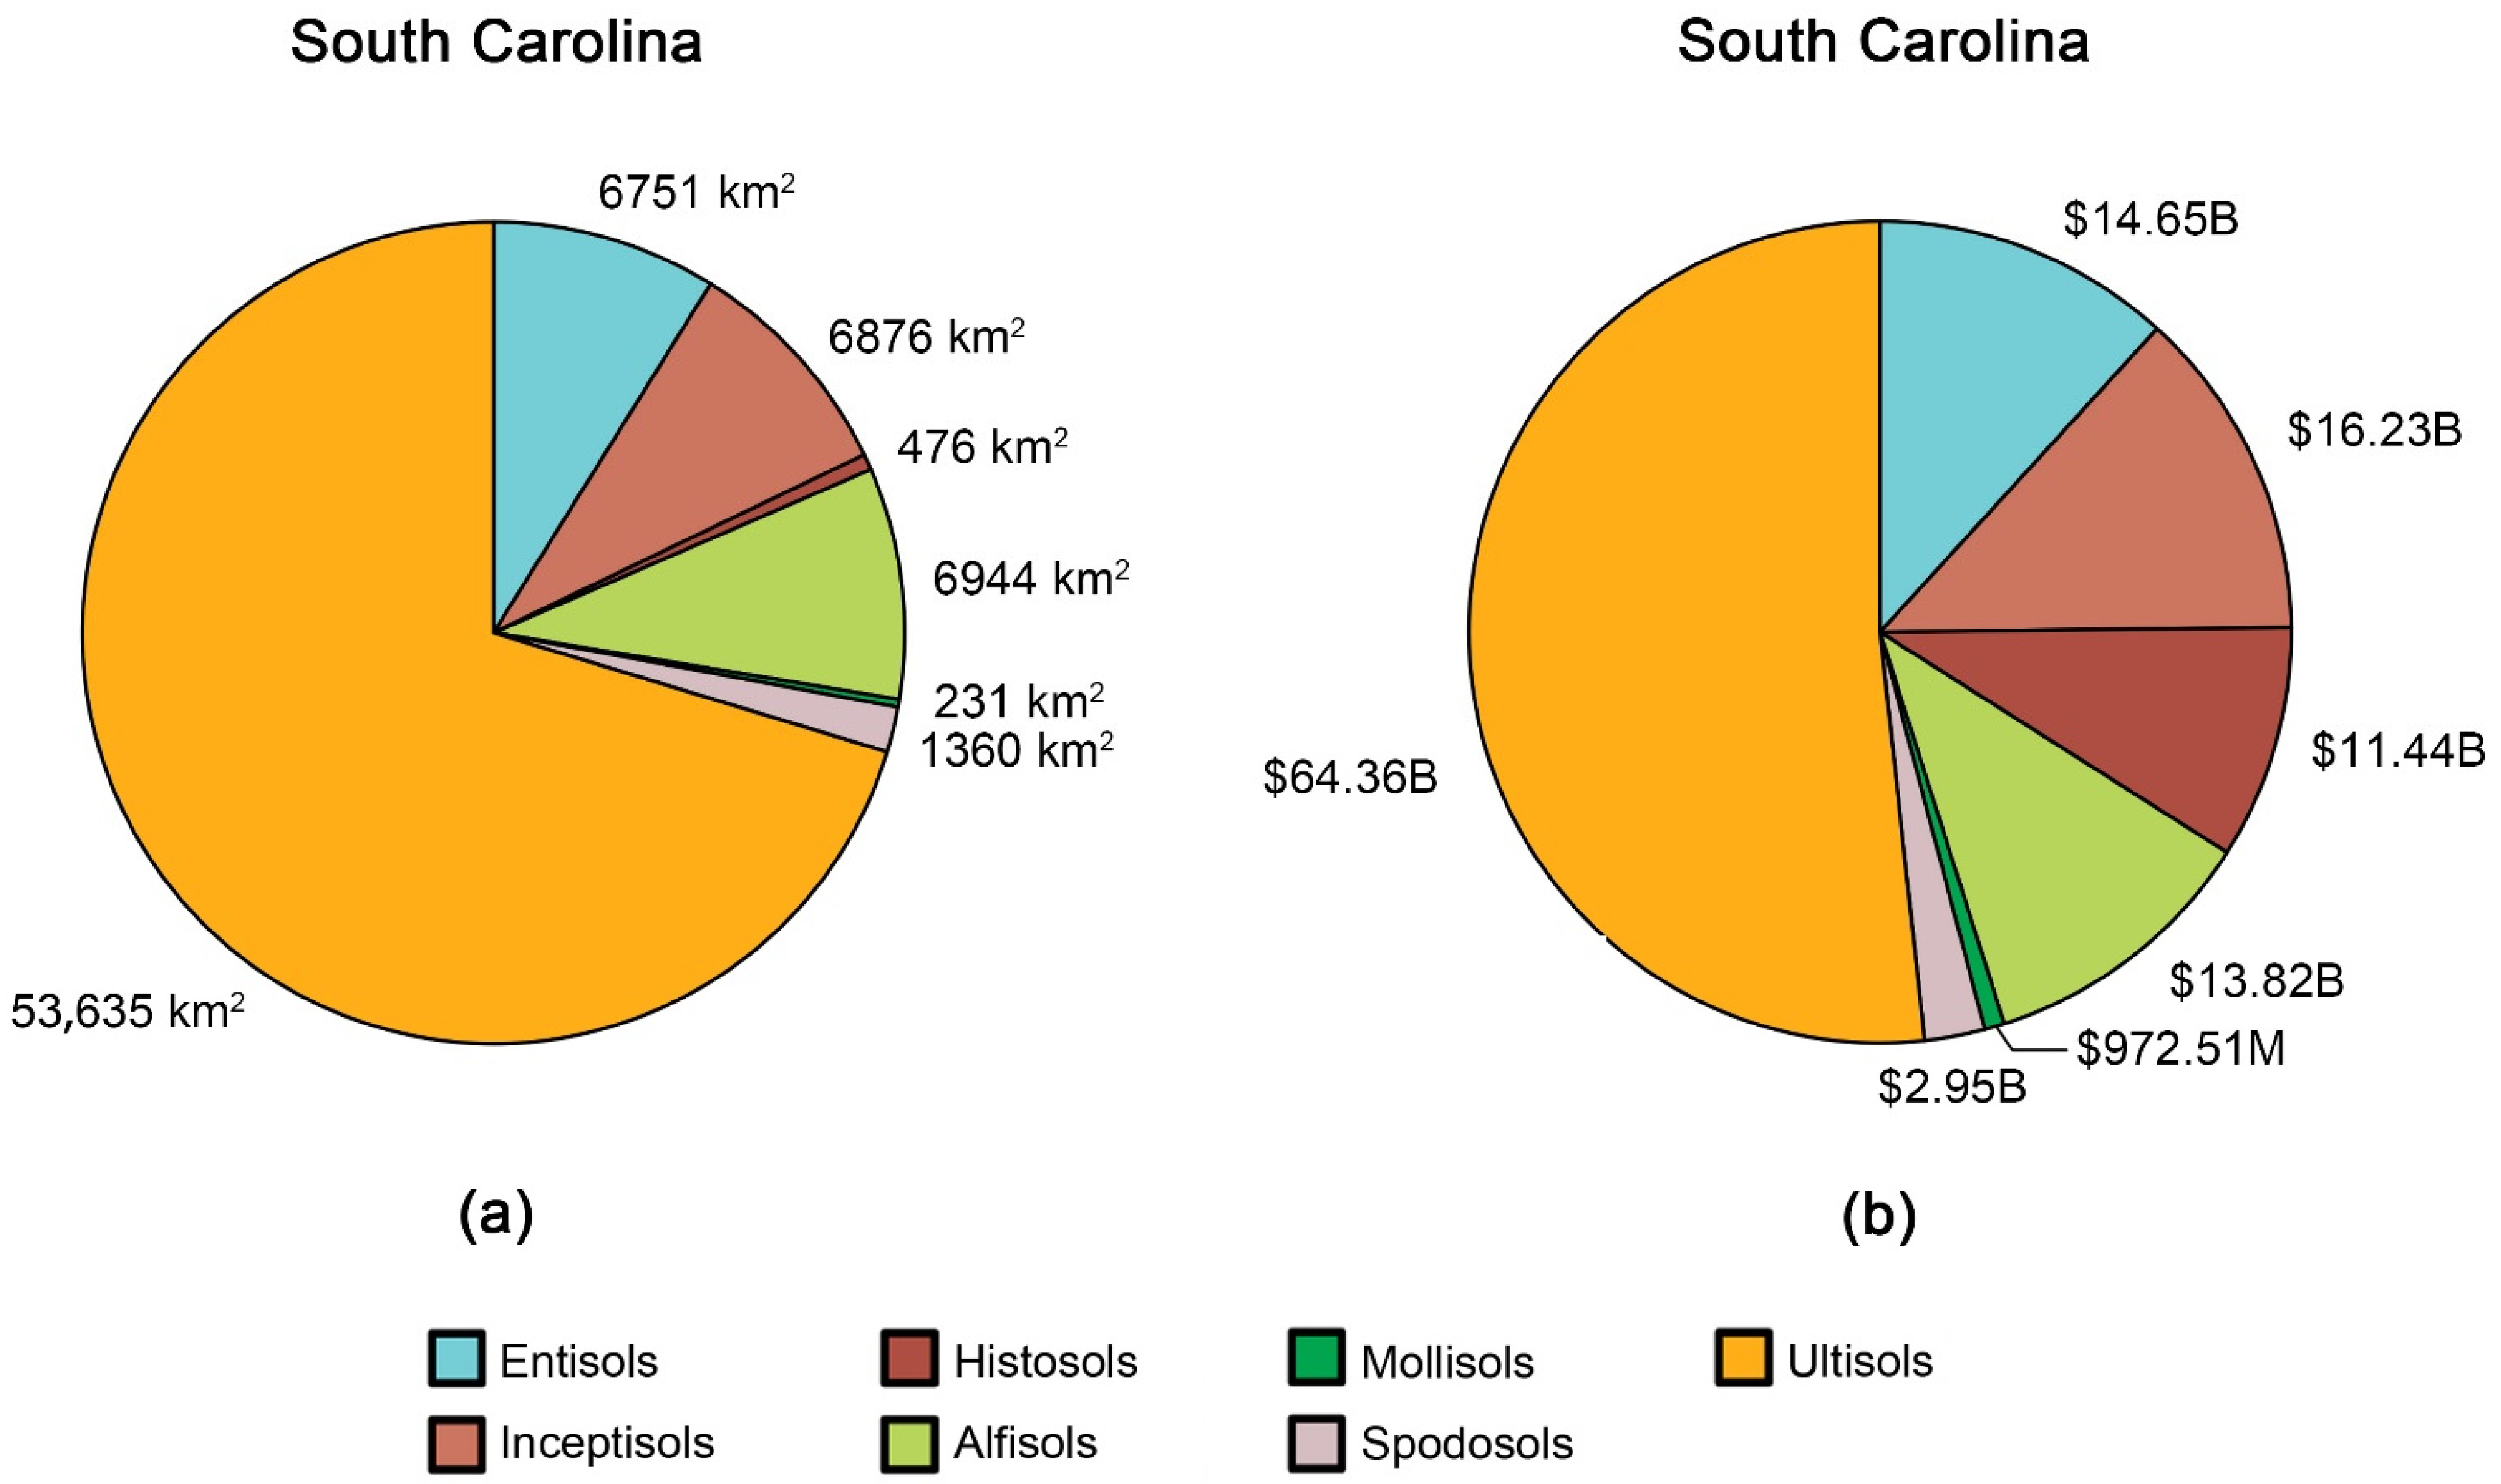
Integration of land cover change analysis with soil carbon regulating ecosystem services allows identification of “hotspots” of potential “realized” regulating ED due to land disturbance, which can be described by land cover classes (e.g., developed with various degrees of intensity: open, low, medium, and high). The area of soil type (e.g., soil order in this study, Figure 3) can be used to calculate the soil C regulating ES (e.g., the social cost of carbon, SC-CO2) using soil C contents for specific soil orders. There is no direct relationship between the area of the soil order and the social costs of soil C because different soil orders have different soil C contents (Figure 3a,b).

Figure 3.
Soil distribution in the state of South Carolina (U.S.A.) (2016): (a) area of soil orders; (b) value ($) of soil carbon regulating ecosystem services based on total soil carbon (TSC) derived from numbers in the upper 2 m of the soil from Guo et al., 2006 [17] and a social cost of carbon (SC-CO2) of $46 per metric ton of CO2 (2007 U.S. dollars with an average discount rate of 3% [16]).
Land cover change (between 2001 and 2016) resulted in $1.1B in most likely “realized” SC-CO2 with the following distribution by soil order: Entisols: $173.6M, 15% from the total; Inceptisols: $54.3M, 5%; Histosols: $0.0, 0%; Alfisols: $151.2M, 13%; Mollisols: $4.2M, 1%; Spodosols: $91.1M, 8%; Ultisols: $658.8M, 58%) (Table 8). Most of the potential “realized” social costs of C were associated with Ultisols, a highly weathered soil covering the largest proportion of the state area (70%).
Table 8.
Soil carbon regulating ecosystem services and “developed” land cover change in the state of South Carolina (U.S.A.) between 2001 and 2016 based on total soil carbon (TSC) derived from numbers in the upper 2 m of the soil from Guo et al., 2006 [17] and a social cost of carbon (SC-CO2) of $46 per metric ton of CO2 (2007 U.S. dollars with an average discount rate of 3% [16]).
3.3. Land Cover Change and Soil Carbon Regulating Ecosystem Services by Soil Order, County, and Region
South Carolina experienced changes in land use/land cover (LULC) over the 15-year period from 2001 to 2016, and these changes varied by soil order, county, and region. Most regions and counties experienced area losses in “low disturbance” LULC classes and gains in the “high disturbance” LULC classes (Table 9), which resulted in potential “realized” social costs of carbon from SOC (Table 10 and Table 11), SIC (Table 12 and Table 13), and TSC (Table 14 and Table 15). The Midlands region of the state experienced the highest gains in the “high disturbance” LULC classes and corresponding potential “realized” SC-CO2 with over $421M for TSC, $354.6M for SOC, and $66.4M for SIC.
Table 9.
Soil diversity (pedodiversity) and “developed” land cover (open space, low, medium, and high intensity) change from 2001 to 2016 by soil order (taxonomic pedodiversity), region, and county in the state of South Carolina (U.S.A.) based on Soil Survey Geographic (SSURGO) Database (2020) [20].
Table 10.
Mid-point soil organic carbon (SOC) storage for newly “developed” land covers (open space, low, medium, and high intensity) from 2001 to 2016 in the state of South Carolina (U.S.A.) based on mid-point SOC content numbers in the upper 2 m of the soil based on data from Guo et al., 2006 [17].
Table 11.
The total dollar value of mid-point soil organic carbon (SOC) storage value for newly “developed” land covers (open space, low, medium, and high intensity) from 2001 to 2016 in the state of South Carolina (U.S.A.) based on a social cost of carbon (SC-CO2) of $46 per metric ton of CO2 (2007 U.S. dollars with an average discount rate of 3% [16]).
Table 12.
Mid-point soil inorganic carbon (SIC) storage for newly “developed” land covers (open space, low, medium, and high intensity) from 2001 to 2016 in the state of South Carolina (U.S.A.) based on mid-point SIC content numbers in the upper 2 m of the soil based on data from Guo et al., 2006 [17].
Table 13.
The total dollar value of mid-point soil inorganic carbon (SIC) storage value for newly “developed” land covers (open space, low, medium, and high intensity) from 2001 to 2016 in the state of South Carolina (U.S.A.) based on a social cost of carbon (SC-CO2) of $46 per metric ton of CO2 (2007 U.S. dollars with an average discount rate of 3% [16]).
Table 14.
Mid-point total soil carbon (TSC) storage for newly “developed” land covers (open space, low, medium, and high intensity) from 2001 to 2016 in the state of South Carolina (U.S.A.) based on mid-point SIC content numbers in the upper 2 m of the soil based on data from Guo et al., 2006 [17].
Table 15.
The total dollar value of mid-point total soil carbon (TSC) storage value for newly “developed” land covers (open space, low, medium, and high intensity) from 2001 to 2016 in the state of South Carolina (U.S.A.) based on a social cost of carbon (SC-CO2) of $46 per metric ton of CO2 (2007 U.S. dollars with an average discount rate of 3% [16]).
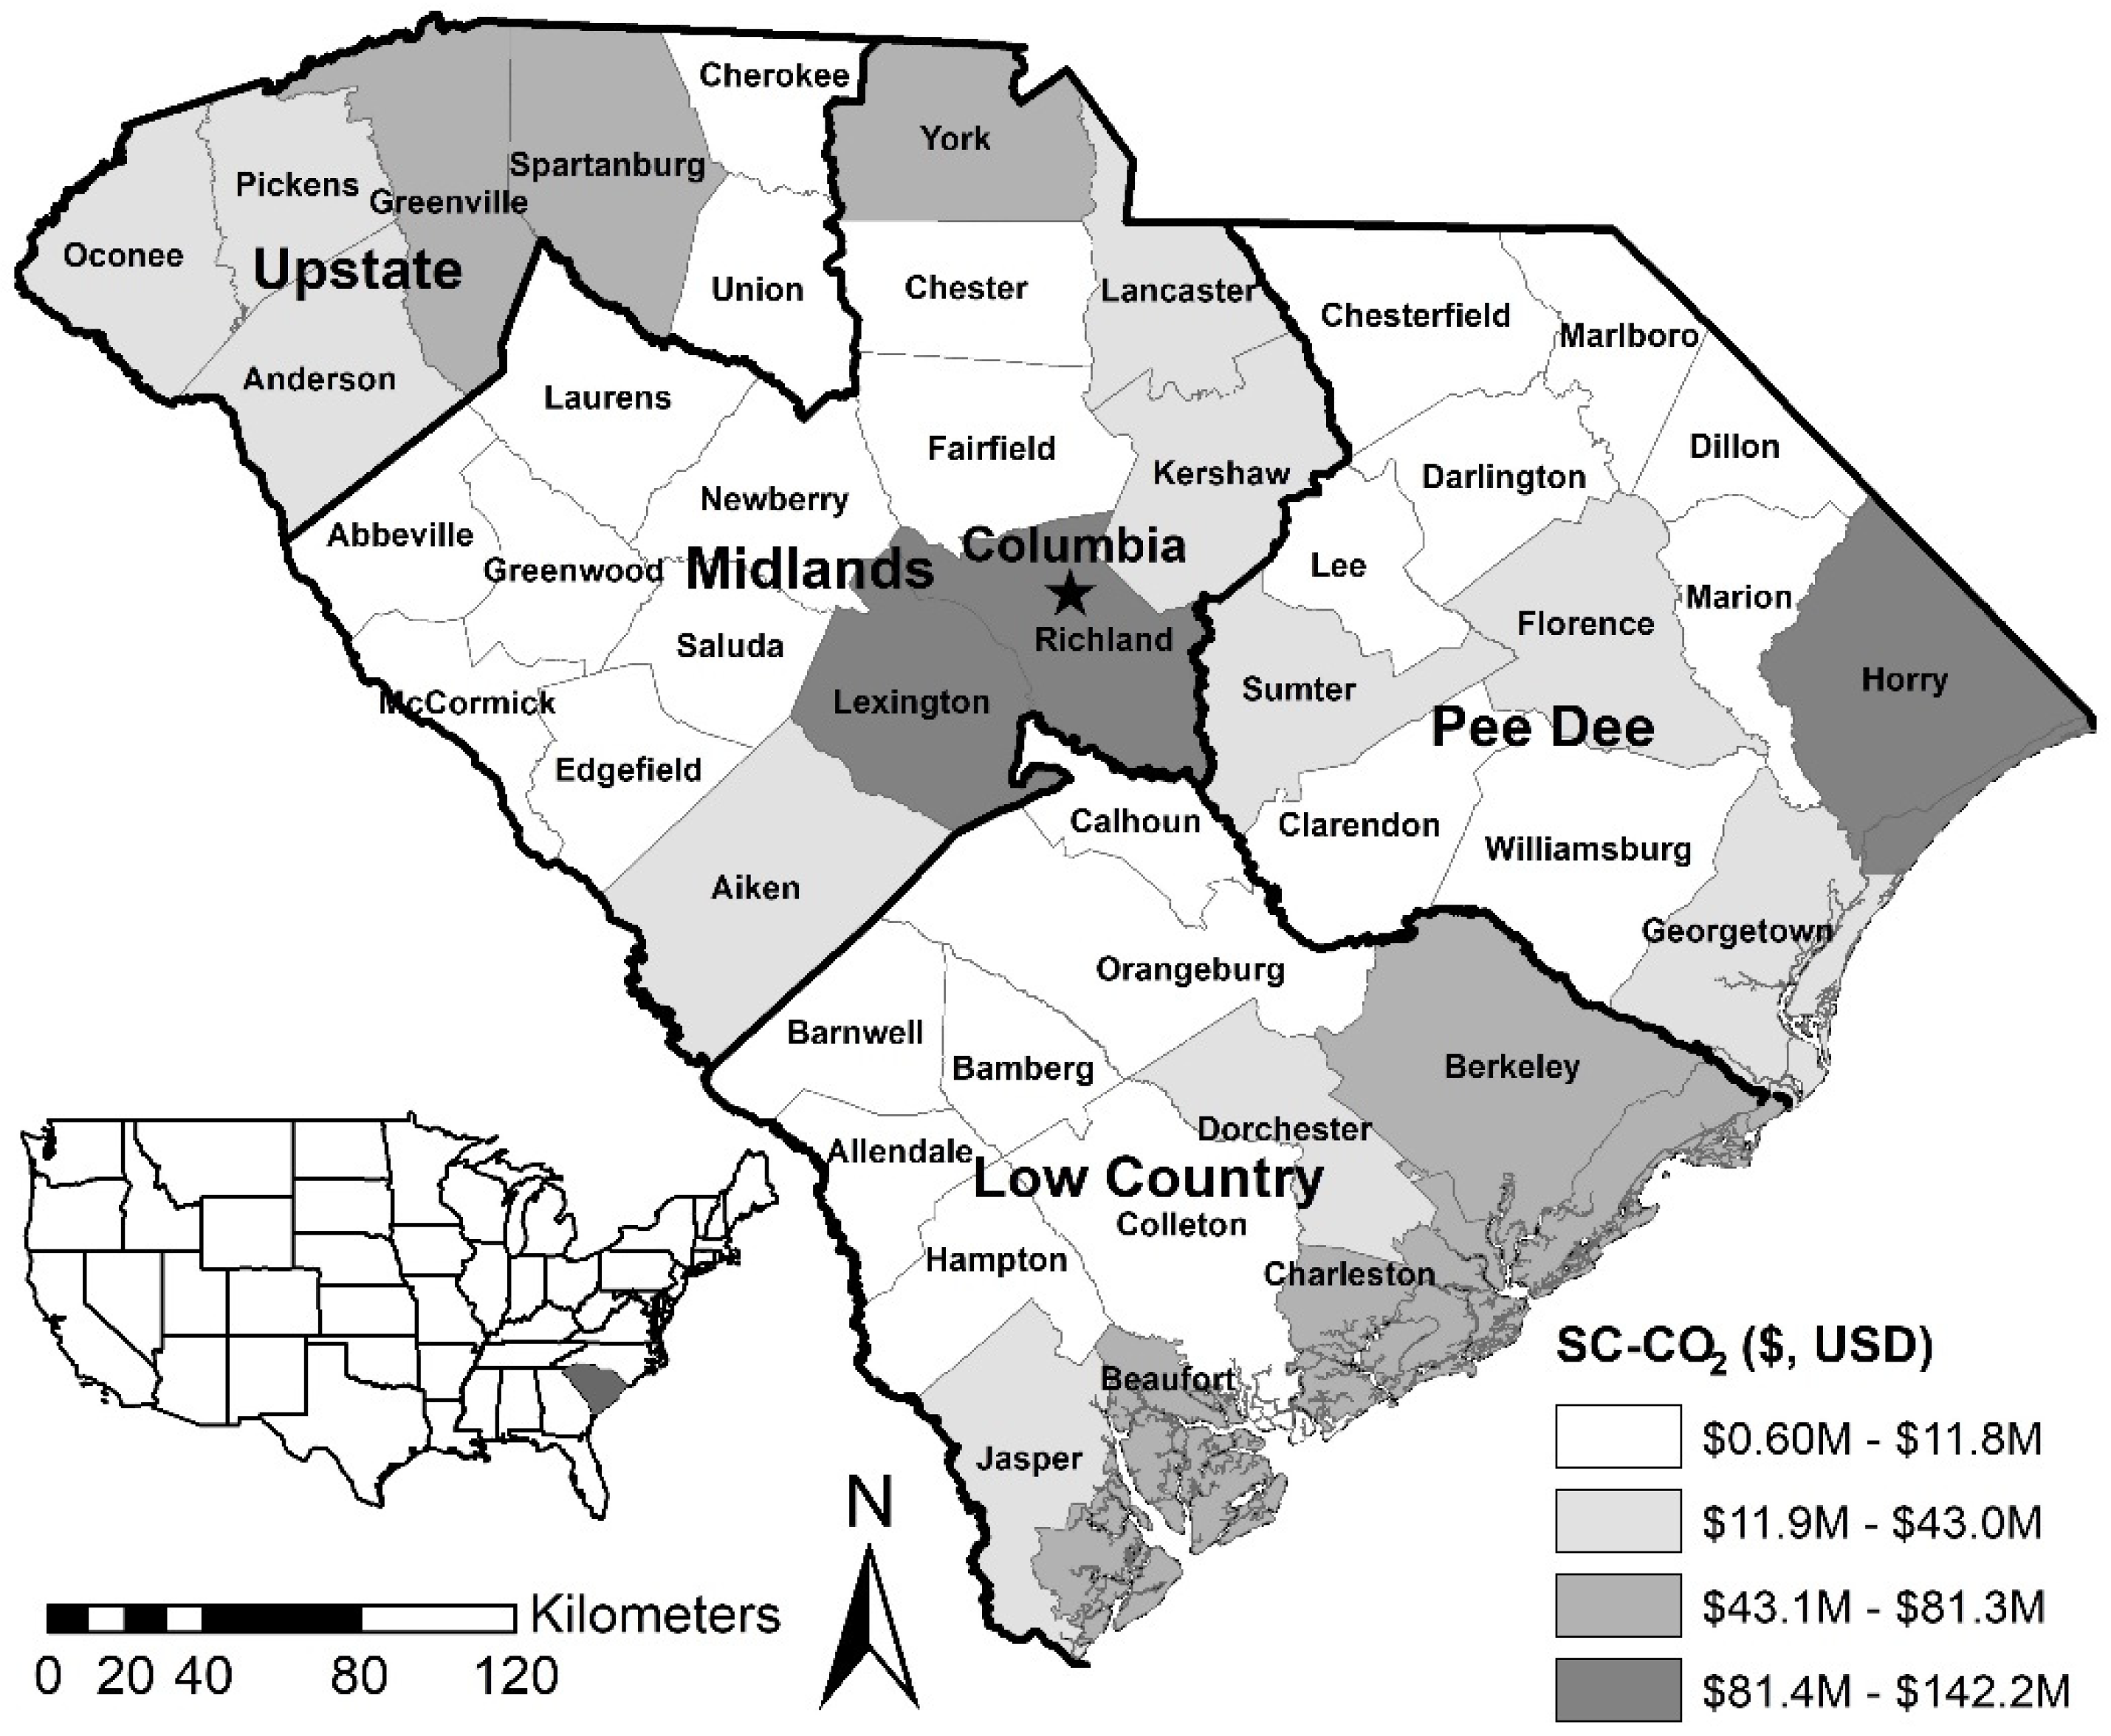
Among counties, Horry County ranked first with over $142.2M in potential “realized” SC-CO2 for TSC, followed by Lexington ($103.7M), Richland ($95.3M), Greenville ($81.4M), York ($77.5M), Charleston ($70.7M), Beaufort ($64.1M), Berkeley ($50.9M), Spartanburg ($50.0M), and Aiken ($43.0M) counties. Increases in “high disturbance” LULC classes are commonly associated with already existing urbanized areas in all regions, and several coastal counties. In addition to totals of potential “realized” SC-CO2 by county, this study also provides a breakdown of SC-CO2 by soil order for each county. This novel way to combine satellite based LULC change analysis with soil information can provide useful insight on the intersection between LULC change and soil resources. The benefits of this approach can be demonstrated using the results of this study, which shows that most of the potential “realized” SC-CO2 are associated with the soil order of Ultisols, which are highly leached and erodible soils. Previous research by Werts et al. (2013) [22] has shown that the development process can have additional social costs associated with this land conversion (e.g., erosion, water quality, and human social costs). Spodosols are present in many rapidly developing coastal areas of South Carolina but may not be suitable for development that includes septic systems because of their high saturated conductivity [23]. Several counties had development in agriculturally productive soils (Alfisols and Mollisols) which are commonly considered to be soil carbon hotspots with higher SC-CO2. In South Carolina, these agriculturally productive soils are relatively rare and represent less than 10% of the total state area, compared to Ultisols, which cover 70% of South Carolina [15]. Over time, loss of productive agricultural soils to development can reduce local food security. Future planning should consider different soil types to limit the social cost of development. For example, government protections of wetland soils (e.g., Histosols) have limited their development in South Carolina (Table 15).
4. Discussion
4.1. Determining “Hotspots” of Social Costs of C from Land Cover Change and Pedodiversity
Nationally, patterns of LULC are changing rapidly due to urbanization and agricultural expansion [9], with regional [24], state [25], and county [12] differences. Increasingly LULC change analysis is conducted in conjunction with the ES framework [12], with limited applications of soil ES/ED. The Southeastern United States and South Carolina are experiencing some of the highest urbanization rates and losses of ecosystem services [12,22]. Mikhailova et al. (2020) [15] examined soil C regulating ES in the state of South Carolina and reported the value of the social cost of carbon dioxide (SC-CO2) emissions by soil C type (SOC, SIC, TSC), soil order, region, and county in the context of “avoided” versus potential “realized” social costs of carbon. Although informative, that study lacked integration with LULC change analysis to indicate “hotspots” of potential “realized” social costs of C because of disturbance (change in LULC), especially in the “developed” LULC category. The present study integrates soil information with LULC change, which provides detailed information about SC-CO2 by LULC and soil type, as well as the LULC change by soil type. It is especially important because different soil types have different spatial distributions within the state and even association with a particular LULC (e.g., Histosols are commonly found in woody wetlands; emergent herbaceous wetlands), which can make them particularly sensitive to LULC changes and corresponding social costs. This study demonstrates that most of the soils have experienced losses in “low disturbance” LULC (e.g., woody wetlands, herbaceous) and gains in open, low, medium, and high intensity developed land cover classes with $1.1B in most likely “realized” social cost of C primarily associated with Ultisols ($658.8M). Ultisols are highly leached and highly erodible soils that occupy 70% of the area of South Carolina. It should be noted that both the state of South Carolina and Ultisols in particular, historically, experienced tremendous social costs associated with agricultural production in the form of high soil erosion [26], carbon loss, depletion of soil nutrients, and even “socioecological collapse that only state-initiated intervention” could address [27]. There is a legacy of various social costs associated with land and soil degradation in the state of South Carolina [27], which are only now being examined within the framework of ES/ED [12,15]. This legacy demonstrates a common trend with other places in the world, which involves maximizing provisioning ES at the expense of regulating ES and resulting in high social costs at the expense of environment and ordinary people [28,29].
The advantage of the present study is that it uses satellite-based remote sensing to accurately identify land cover and the areas with changing land cover [30], which is important because the land cover and land cover change are likely directly related to the level of disturbance [31]. Land cover maps derived from satellites allow the spatially explicit tracking of land cover and land cover change [32,33]. Many studies that examine the relationship of land cover change to ES rely on fixed estimates for soil carbon that are assumed for each land cover category, instead of relying on estimates from existing soil databases [12]. This study combines the spatial information from land cover maps with soil carbon estimates from soil databases to identify hotspots of disturbance (Figure 4). Because land cover maps are regularly updated [32], it is possible to use this framework to identify and monitor likely SC-CO2 hotspots over time and calculate cumulative costs associated with land cover change.
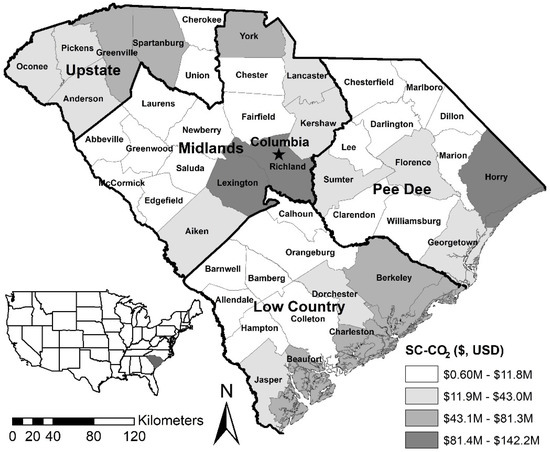
Figure 4.
The total dollar value of mid-point total soil carbon (TSC) storage value for newly “developed” land covers (open space, low, medium, and high intensity) from 2001 to 2016 in the state of South Carolina (U.S.A.) based on a social cost of carbon (SC-CO2) of $46 per metric ton of CO2 (2007 U.S. dollars with an average discount rate of 3% [16]).
Future improvements to the study methodology would be to include actual field samples, which would be more accurate than soil order averages; however, the soil carbon content trends are likely the same between the different soil types [11]. Linking this type of study to land cover change models would help inform decision-makers about potential impacts caused by land development [28]. With the existing database of satellite images for at least the last 49 years [34], it will be possible to track land cover change and disturbance over time to estimate the impact of development and understand the future trajectory of disturbance.
4.2. Determining Potential for C Sequestration Using LULC and Pedodiversity
Recarbonization potential is dependent on both LULC and pedodiversity, which should be considered together for sustainable carbon management at various administrative levels (e.g., state, region, county, etc.) (Table 16). For example, Table 16 demonstrates LULC by soil order at the state level, which shows the inherent soil capacity (based on soil properties) for C sequestration and LULC covers (either natural, managed, or in combination). According to Table 16, most LULC in the state of South Carolina are dominated by the soil order of Ultisols, which have a low recarbonization potential because these soils are highly weathered with low nutrient holding capacity [35]. Cherkinsky et al. (2018) [36] reported that land use has remarkable effects on Ultisols and forest root systems at great depth, which can result in “sluggish regeneration rates of forest root systems” compared to aboveground regeneration.
Table 16.
Land use/land cover (LULC) by soil order in the state of South Carolina (USA) in 2016.
Land covers and their changes are often associated with “human-dimension issues” [37], which have a direct impact on soil C. Clay et al. (2019) [38] reported that there is a significant potential for South Carolina forests to sequester C in the aboveground biomass, but soil C sequestration potential would be limited based on other studies for soils in the state [35,36]. Because most of the South Carolina forestland is in private ownership, forest landowners play an important role in decision making with regards to potential forest management practices aimed at C sequestration both in aboveground biomass and in the soil [39]. According to Richter et al. (1999) [40], soil C losses because of deforestation and cultivation are well-documented, but studies on “soil-carbon recovery after cultivation are limited.” Richter et al. (1999) [40] used data from a four-decade-long field study of C accumulation by pine ecosystems grown on previously cultivated soils at the Calhoun Experimental Forest in South Carolina (USA) and concluded that “despite high C inputs to the mineral soil, C sequestration was limited by rapid decomposition, facilitated by the coarse soil texture and low-activity clay mineralogy.”
4.3. Significance of Results for South Carolina
At present, state of South Carolina has no comprehensive state climate strategy [41]. However, in 2008 a special task force appointed by the South Carolina governor recommended more than 50 ways to stop rising greenhouse gas pollution from worsening global warming [42], which included policy recommendations for various economic sectors (e.g., tourism and recreation; agriculture and forestry, etc.). Our study here contributes important scientific findings and information that supports the final report of the special task force [42] in the following ways:
- Inventory of South Carolina’s Greenhouse Gas Emissions. Current SC GHG inventories do not include soil and LULC analysis. This study quantified and valued the soil C regulating ES for SOC, SIC, and TSC for the state of South Carolina by soil type and LULC. According to the final report by the South Carolina Climate, Energy, and Commerce Committee [42]: “South Carolina’s gross emissions of GHGs grew by 39% between 1990 and 2005, twice the national average of 16%. South Carolina’s emissions growth was driven by the growth of its population and many other factors. In addition, the state’s emissions on a per-capita basis increased by about 15% between 1990 and 2005, while U.S. per-capita emissions declined slightly (2%) over this period due to many other factors. South Carolina’s gross GHG emissions are projected to rise fairly steeply to about 125 MMtCO2e by 2025, or 87% over 1990 levels.” Areas that developed in South Carolina over a 15-year time period were evaluated by the combination of soil type, LULC, and county to calculate the potential realized SC-CO2 from this land conversion. By identifying these potential SC-CO2 hotspots, future land conversions could be reduced to help lower future greenhouse gas emissions.
- Agriculture, Forestry and Waste Management (AFW):
AFW-6a: Terrestrial Carbon Sequestration—Agriculture. This study provides spatial information about soil C stocks by soil type, LULC (including agricultural LULC), and associated SC-CO2 over time, which can be used to create a database to monitor the effectiveness of C sequestration using a cost-benefit analysis.
AFW-6bi: Terrestrial Carbon Sequestration—Forestry: Forest Management. This study provides spatial information about soil C stocks by soil type, LULC (including different forest LULC), and associated SC-CO2 over time, which can be used to create a database to monitor the effectiveness of C sequestration using a cost-benefit analysis.
AFW-6bii: Terrestrial Carbon Sequestration—Forestry: Afforestation/Reforestation. This study provides spatial information about soil C stocks by soil type, LULC (including different forest LULC) and associated SC-CO2 over time, which can be used to create a database to monitor the effectiveness of C sequestration using a cost-benefit analysis.
AFW-6biii: Terrestrial Carbon Sequestration—Forestry: Urban Forestry. This study provides spatial information about soil C stocks by soil type, LULC (including different forest, developed LULC), and associated SC-CO2 over time, which can be used to create a database to monitor the effectiveness of C sequestration using a cost-benefit analysis.
AFW-7a: Conservation and Restoration of Agriculture Lands for Enhanced Carbon Sequestration. This study provides information about soil C stocks by soil type, LULC (including agricultural LULC), and associated SC-CO2 over time, which can be used to create a database to monitor the effectiveness of C sequestration using a cost-benefit analysis.
AFW-7b: Conservation and Restoration of Forestlands for Enhanced Carbon Sequestration. This study provides information about soil C stocks by soil type, LULC (including different forest LULC), and associated SC-CO2 over time, which can be used to create a database to monitor the effectiveness of C sequestration using a cost-benefit analysis.
- Transportation and Land Use (TLU):
TLU-4: Improve Development Patterns. This study quantifies SC-CO2 as “avoided” and “realized” cost, which can be used for cost-benefit analysis when evaluating the development plans.
- Cross-Cutting (CC) Issues:
CC-1: Inventories and Forecasting. This study provides spatial information about soil C stocks by soil type, LULC, and associated SC-CO2 over time, which can be used in already existing inventories and forecasting efforts.
CC-2: GHG Reporting and Registry. This study reported spatial information about soil C stocks by soil type, LULC, and associated SC-CO2 over time, which can be used in GHG reporting and registry.
CC-3: State Government GHG Emissions. This study reported spatial information about soil C stocks by soil type, LULC, and associated SC-CO2 over time at the state level.
CC-4: Comprehensive Local Government Climate Actions Plans (Counties, Cities, etc.). This study reported spatial information about soil C stocks by soil type, LULC, and associated SC-CO2 overtime at the county level.
CC-5: Public Education and Outreach. Results from this study can be used for various educational (e.g., soil science courses, textbooks, etc.) and extension efforts (e.g., informal education not only with the agricultural communities but also with developers, etc.).
CC-6: Adaptation and Vulnerability. Spatial information about the SC-CO2 hotspots can be used to optimize economic opportunity while minimizing environmental impact.
5. Conclusions
This study examined the integration of soil diversity (pedodiversity) concepts (taxonomic) with land cover change analysis to value soil C regulating ES/ED in the state of South Carolina (U.S.A.) to be considered in territorial planning. Both pedodiversity and land cover information provide critical contexts (e.g., “portfolio-effect,” “distribution-effect,” “evenness-effect,” etc.) for analyzing, interpreting, and reporting ES/ED within the ES framework for sustainable management of soil carbon within the state. Soil carbon is either protected in the soil or subject to release to the atmosphere because of disturbance which depends on the land cover and land cover change. The percent change (between 2001 and 2016) both in areas and monetary values varied by soil order and land cover, with most soil orders experiencing losses in “low disturbance” land covers (e.g., woody wetlands, herbaceous) and gains in open, low, medium, and high intensity developed land cover classes with $1.1B in most likely “realized” social cost of carbon with the following distribution by soil order: Entisols: $173.6M, 15% from the total; Inceptisols: $54.3M, 5%; Histosols: $0.0, 0%; Alfisols: $151.2M, 13%; Mollisols: $4.2M, 1%; Spodosols: $91.1M, 8%; Ultisols: $658.8M, 58%). Most of the “realized” social costs of C were associated with Ultisols, a highly weathered soil covering the largest proportion of the state (70%). It is important to consider the social cost of soil C associated with land cover categories as well as their change in value over time (between 2001 and 2016) when determining if the soil carbon is likely stable or at risk. Considering the land covers with the largest social cost of soil C based on area and soil type, such as woody wetlands and evergreen forests, had very little change, −1% and +1% respectively. The total social cost of soil C for deciduous forest was reduced by 7%; similarly, hay/pasture was reduced by 10%, and barren land was reduced by 9%. Cultivated crops remained unchanged, while herbaceous land cover was reduced by 5%, and emergent herbaceous wetlands were reduced by 3%. Mixed forests increased by 5%, and shrub/scrub land increased by 9%. The developed categories increased between 2001 and 2016. Social cost soil C of developed open space increased by 5%, while developed low intensity increased by 15%. The social cost of soil C for developed medium intensity increased by 46% and developed high intensity increased by 39%. The percent change in monetary values was different from the percent change in areas because different soil orders have different TSC contents, which are dependent on the degree of soil weathering and development, with highly weathered soils having lower TSC compared to moderately weathered soils. The Midlands region experienced the highest gains in the “high disturbance” classes and corresponding SC-CO2 with over $421M for TSC, $354.6M for SOC, and $66.4M for SIC. Among counties, Horry County ranked first with over $142.2M in SC-CO2 for TSC, followed by Lexington ($103.7M), Richland ($95.3M), Greenville ($81.4M), York ($77.5M), Charleston ($70.7M), Beaufort ($64.1M), Berkeley ($50.9M), Spartanburg ($50.0M), and Aiken ($43.0M) counties. Administrative area of the state combined with pedodiversity and land cover change concepts can provide useful information to design cost-efficient policies to manage soil carbon regulating ES at the state level. Results of this study were linked with the proposed policy recommendations by South Carolina’s Climate, Energy, and Commerce Advisory Committee (CECAC).
Author Contributions
Conceptualization, E.A.M.; methodology, E.A.M., M.A.S., and L.L.; formal analysis, E.A.M.; writ-ing—original draft preparation, E.A.M.; writing—review and editing, E.A.M., C.J.P., G.C.P., and M.A.S.; visualization, L.L., H.A.Z., and Z.H. All authors have read and agreed to the published version of the manuscript.
Funding
This research received no external funding.
Acknowledgments
We would like to thank the reviewers for their constructive comments and suggestions.
Conflicts of Interest
The authors declare no conflict of interest.
Glossary
| ED | Ecosystem disservices |
| ES | Ecosystem services |
| EPA | Environmental Protection Agency |
| SC-CO2 | Social cost of carbon emissions |
| LULC | Land cover classes |
| SDGs | Sustainable Development Goals |
| SOC | Soil organic carbon |
| SIC | Soil inorganic carbon |
| SOM | Soil organic matter |
| SSURGO | Soil Survey Geographic Database |
| TSC | Total soil carbon |
| USDA | United States Department of Agriculture |
| U.S.A. | United States of America |
References
- Pereira, P.; Bogunovic, I.; Muñoz-Rojas, M.; Brevik, E.C. Soil ecosystem services, sustainability, valuation and management. Curr. Opin. Environ. Sci. Health 2018, 5, 7–13. [Google Scholar] [CrossRef]
- Zhang, W.; Ricketts, T.H.; Kremen, C.; Carney, K.; Swinton, S.M. Ecosystem services and dis-services to agriculture. Ecol. Econ. 2007, 64, 253–260. [Google Scholar] [CrossRef] [Green Version]
- Mikhailova, E.A.; Groshans, G.R.; Post, C.J.; Schlautman, M.A.; Post, G.C. Valuation of soil organic carbon stocks in the contiguous United States based on the avoided social cost of carbon emissions. Resources 2019, 8, 153. [Google Scholar] [CrossRef] [Green Version]
- Groshans, G.R.; Mikhailova, E.A.; Post, C.J.; Schlautman, M.A.; Zhang, L. Determining the value of soil inorganic carbon stocks in the contiguous United States based on the avoided social cost of carbon emissions. Resources 2019, 8, 119. [Google Scholar] [CrossRef] [Green Version]
- Groshans, G.R.; Mikhailova, E.A.; Post, C.J.; Schlautman, M.A.; Zurqani, H.A.; Zhang, L. Assessing the value of soil inorganic carbon for ecosystem services in the contiguous United States based on liming replacement costs. Land 2018, 7, 149. [Google Scholar] [CrossRef] [Green Version]
- Houghton, R.A.; Nassikas, A.A. Global and regional fluxes of carbon from land use and land cover change 1850–2015. Glob. Biogeochem. Cycles 2017, 31, 456–472. [Google Scholar] [CrossRef]
- Zamanian, K.; Zhou, J.; Kuzyakov, Y. Soil carbonates: The unaccounted, irrecoverable carbon source. Geoderma 2021, 384, 114817. [Google Scholar] [CrossRef]
- Burkhard, B.; Kroll, F.; Nedkov, S.; Muller, F. Mapping ecosystem service supply, demand, and budgets. Ecol. Indic. 2012, 21, 17–29. [Google Scholar] [CrossRef]
- Sleeter, B.M.; Sohl, T.L.; Loveland, T.R.; Auch, R.F.; Acevedo, W.; Drummond, M.A.; Sayler, K.L.; Stehman, S.V. Land-cover change in the conterminous United States from 1973 to 2000. Glob. Environ. Chang. 2013, 23, 733–748. [Google Scholar] [CrossRef] [Green Version]
- Zhang, F.; Xu, N.; Wang, C.; Wu, F.; Chu, X. Effects of land use and land cover change on carbon sequestration and adaptive management in Shanghai, China. Phys. Chem. Earth 2020, 120, 102948. [Google Scholar] [CrossRef]
- Mikhailova, E.A.; Post, C.J.; Schlautman, M.A.; Post, G.C.; Zurqani, H.A. Determining farm-scale site-specific monetary value of “soil carbon hotspots” based on avoided social costs of CO2 emissions. Cogent Environ. Sci. 2020, 6, 1817289. [Google Scholar] [CrossRef]
- Brown, M.G.; Quinn, J.E. Zoning does not improve the availability of ecosystem services in urban watersheds. A case study from Upstate South Carolina, USA. Ecosyst. Serv. 2018, 34, 254–265. [Google Scholar] [CrossRef]
- Nelson, E.; Ennaanay, D.; Wolny, S.; Olwero, N.; Vigerstol, K.; Penning-ton, D.; Mendoza, G.; Aukema, J.; Foster, J.; Forrest, J.; et al. InVEST 3.6.0 User’s Guide. The Natural Capital Project. 2018, Stanford University, University of Minnesota, The Nature Conservancy, and World Wildlife Fund. Available online: http://data.naturalcapitalproject.org/nightly-build/invest-usersguide/InVEST_3.6.0_Documentation.pdf (accessed on 12 December 2020).
- Bétard, F.; Peulvast, J. Geodiversity hotspots: Concept, method and cartographic application for geoconservation purposes at a regional scale. Environ. Manag. 2019, 63, 822–834. [Google Scholar] [CrossRef]
- Mikhailova, E.A.; Zurqani, H.A.; Post, C.J.; Schlautman, M.A.; Post, G.C.; Lin, L.; Hao, Z. Soil carbon regulating ecosystem services in the state of South Carolina. Land 2021, 10, 309. [Google Scholar] [CrossRef]
- EPA. The Social Cost of Carbon. EPA Fact Sheet. 2016. Available online: https://19january2017snapshot.epa.gov/climatechange/social-cost-carbon_.html (accessed on 15 March 2019).
- Guo, Y.; Amundson, R.; Gong, P.; Yu, Q. Quantity and spatial variability of soil carbon in the conterminous United States. Soil Sci. Soc. Am. J. 2006, 70, 590–600. [Google Scholar] [CrossRef] [Green Version]
- Multi-Resolution Land Characteristics Consortium (MRLC). Available online: https://www.mrlc.gov/ (accessed on 1 March 2021).
- ESRI. ArcMap 10.7. Available online: https://support.esri.com/en/products/desktop/arcgis-desktop/arcmap/10-7-1 (accessed on 1 March 2021).
- Soil Survey Staff, Natural Resources Conservation Service, United States Department of Agriculture. Soil Survey Geographic (SSURGO) Database for South Carolina. Available online: https://www.nrcs.usda.gov/wps/portal/nrcs/detail/soils/survey/?cid=nrcs142p2_053627 (accessed on 1 March 2021).
- U.S. Geological Survey. The National Land Cover Database; Report, Series Number 2012–3020; U.S. Geological Survey: Reston, VA, USA, 2012.
- Werts, J.D.; Mikhailova, E.A.; Post, C.J.; Sharp, J.L. Sediment pollution assessment of abandoned residential developments using remote sensing and GIS. Pedosphere 2013, 23, 39–47. [Google Scholar] [CrossRef]
- Mechtensimer, S.; Toor, G.S. Septic systems contribution to phosphorus in shallow groundwater: Field-scale studies using conventional drainfield designs. PLoS ONE 2017, 12, e0170304. [Google Scholar] [CrossRef] [Green Version]
- Sayler, K.L.; Acevedo, W.; Taylor, J.L. (Eds.) Status and Trends of Land Change in the Eastern United States—1973 to 2000: U.S. Geological Survey Professional Paper 1794–D; USGS Publications Warehouse: Reston, VA, USA, 2016; p. 195. [Google Scholar] [CrossRef] [Green Version]
- Arnold, C.; Wilson, E.; Hurd, J.; Civco, D. 30 years of land cover change in Connecticut, USA: A case study of long-term research, dissemination of results, and their use in land use planning and natural resource conservation. Land 2020, 9, 255. [Google Scholar] [CrossRef]
- Galang, M.A.; Markewitz, D.; Morris, L.A.; Bussell, P. Land use change and gully erosion in the Piedmont region of South Carolina. J. Soil Water Conserv. 2007, 62, 122–129. [Google Scholar]
- Coughlan, M.R.; Nelson, D.R.; Lonneman, M.; Block, A.E. Historical land use dynamics in the highly degraded landscape of the Calhoun Critical Zone Observatory. Land 2017, 6, 32. [Google Scholar] [CrossRef] [Green Version]
- Li, J.; Chen, H.; Zhang, C.; Pan, T. Variations in ecosystem service value in response to land use/land cover changes in Central Asia from 1995–2035. Peer J. 2019, 7, e7665. [Google Scholar] [CrossRef] [PubMed]
- Coupe, R.H.; Barlow, J.R.B.; Capel, P.D. Complexity of human and ecosystem interactions in an agricultural landscape. Environ. Dev. 2012, 4, 88–104. [Google Scholar] [CrossRef]
- Wickham, J.; Stehman, S.V.; Sorenson, D.G.; Gass, L.; Dewitz, J.A. Thematic accuracy assessment of the NLCD 2016 land cover for the conterminous United States. Remote Sens. Environ. 2021, 257, 112357. [Google Scholar] [CrossRef]
- Zhu, Z.; Zhang, J.; Yang, Z.; Aljaddani, A.H.; Cohen, W.B.; Qiu, S.; Zhou, C. Continuous monitoring of land disturbance based on Landsat time series. Remote Sens. Environ. 2020, 238, 111116. [Google Scholar] [CrossRef]
- Homer, C.; Dewitz, J.; Jin, S.; Xian, G.; Costello, C.; Danielson, P.; Gass, L.; Funk, M.; Wickham, J.; Stehman, S.; et al. Conterminous United States land cover change patterns 2001-2016 from the 2016 National Land Cover Database. ISPRS J. Photogramm. Remote Sens. 2020, 162, 184–199. [Google Scholar] [CrossRef]
- Mikhailova, E.A.; Lin, L.; Hao, Z.; Zurqani, H.A.; Post, C.J.; Schlautman, M.A.; Post, G.C. Vulnerability of soil carbon regulating ecosystem services due to land cover change in the state of New Hampshire, USA. Earth 2021, 2, 309. [Google Scholar] [CrossRef]
- Savage, S.L.; Lawrence, R.L.; Squires, J.R.; Holbrook, J.D.; Olson, L.E.; Braaten, J.D.; Cohen, W.B. Shifts in forest structure in Northwest Montana from 1972 to 2015 using the Landsat archive from multispectral scanner to operational land imager. Forests 2018, 9, 157. [Google Scholar] [CrossRef] [Green Version]
- Richter, D.D.; Markewitz, D.; Wells, C.G.; Allen, H.L.; April, R.; Heine, P.R.; Urrego, B. Soil chemical change during three decades in an old-field Loblolly Pine (Pinus Taeda L.) ecosystem. Ecology 1994, 75, 1463–1473. [Google Scholar] [CrossRef]
- Cherkinsky, A.; Brecheisen, Z.; Richter, D. Carbon and oxygen isotope composition in soil carbon dioxide and free oxygen within deep Ultisols at the Calhoun CZO, South Carolina, USA. Radiocarbon 2018, 60, 1357–1366. [Google Scholar] [CrossRef]
- Lal, R. Soil carbon sequestration to mitigate climate change. Geoderma 2004, 123, 1–22. [Google Scholar] [CrossRef]
- Clay, L.; Motallebi, M.; Song, B. An analysis of common forest management practices for carbon sequestration in South Carolina. Forests 2019, 10, 949. [Google Scholar] [CrossRef] [Green Version]
- Alhassan, M.; Motallebi, M.; Song, B. South Carolina forestland owner’s willingness to accept compensations for carbon sequestration. For. Ecosyst. 2019, 6, 16. [Google Scholar] [CrossRef] [Green Version]
- Richter, D.D.; Markewitz, D.; Trumbore, S.E.; Wells, C.G. Rapid accumulation and turnover of soil carbon in a re-establishing forest. Nature 1999, 400, 56–58. [Google Scholar] [CrossRef] [Green Version]
- Fretwell, S. As Heat Rises, SC Watches Quitely. Will State Suffer from Lack of Climate Action? The State 2020. Available online: https://www.thestate.com/news/local/environment/article239527278.html (accessed on 25 August 2021).
- South Carolina Climate, Energy, and Commerce Committee. Final Report. July 2008. Available online: http://uccrnna.org/wp-content/uploads/2017/06/South-Carolina_2008_Climate-Energy-Commerce-Committee-Final-Report.pdf (accessed on 25 August 2021).


Publisher’s Note: MDPI stays neutral with regard to jurisdictional claims in published maps and institutional affiliations. |
© 2021 by the authors. Licensee MDPI, Basel, Switzerland. This article is an open access article distributed under the terms and conditions of the Creative Commons Attribution (CC BY) license (https://creativecommons.org/licenses/by/4.0/).