1. Introduction
Forest disturbances are events that change the structure and composition of the forest ecosystems, their functions, and resources availability in the ecosystems [
1]. Disturbances, both natural and anthropogenic in origin, vary in frequency and intensity in a changing ecosystem [
2]. They are ecosystem processes that help to maintain the supply of ecosystem services and conservation of plant and wildlife populations [
3]. In particular, they play an important role in maintaining plant diversity, influencing stand structure, and impacting regeneration of forest ecosystems [
1,
4,
5,
6]. Furthermore, they regulate forest dynamics and tree diversity at the local and regional scale [
7,
8].
Structure, composition, and function are the three important attributes of forest ecosystems [
9]. Forest disturbance has a strong influence on plant structure and animal communities in many natural ecosystems [
10,
11]. The ecological characteristics of a forest largely depend on sites, species diversity, and regeneration status of different species [
12]. As the frequency and intensity of disturbances increase, plant diversity and other associated vegetation attributes decrease [
4,
13]. Changes in structural attributes of forests have often been attributed to disturbance gradients [
8] involving mostly a single factor that is limited in extent, e.g., selective logging [
7,
14,
15]. Similarly, it has also been argued that species richness and diversity are invariably affected by frequent and fluctuating disturbances of low-intensity e.g., grazing and browsing, firewood and fodder extraction suggesting the importance of combined effect of multiple low-intensity factors [
1,
5,
13].
Disturbance can have positive and negative impacts on forest by altering the environmental condition [
4]. Disturbance has a positive influence on diversity, as an intermediate level of disturbance increases forest diversity [
15,
16]. However, too much disturbance leads to the loss of late successional species, whereas too little leads to the exclusion of species adapted to colonize ecosystems immediately after disturbance [
16]. Furthermore, Connell (1978) [
17] noticed in tropical rain forests that the higher tree diversity occurs either at intermediate stage after large disturbances or with smaller disturbances that are neither frequent nor infrequent. In addition, an intermediate disturbance supports community co-existence [
16,
18].
In Nepal, large-scale catastrophic natural disturbances due to hurricanes or tornadoes do not occur, but disturbances due to flooding, river scouring, or landslides are common. The major portion of energy comes directly from forests in the country, with forest-based woody biomass consisting of 70% of total energy consumption [
19]. Most of the Nepalese forests turned to open access after the nationalization of all forests in 1957, resulting in higher deforestation rates on the national level [
20]. With more than two-thirds of the population living in rural areas, high dependence of rural people on forest resources leads to an anthropogenic disturbance, such as tree harvesting, fire, grazing and non-timber forest product collection. In addition, bush cutting, sapling cutting, lopping and forest fire are also common. Although forest disturbance is the highest in the Churia region, the disturbance due to tree cutting and lopping is a major concern in Terai forest [
21]. Historically, forest area covered almost 75% of the Terai region in central and western Nepal [
22,
23]. With the establishment of democracy and the eradication of malaria in the 1950s, the government launched the resettlement program in the lower belt of Nepal, which therefore triggered the deforestation and forest degradation in this region. The forest area in the region is continuously decreasing, with an annual deforestation rate of 0.44% between 2001 and 2010 [
24].
Sal (
Shorea robusta) is one of the most important tree species with economic and cultural importance in the country [
25]. The species is used for multiple purposes including timber, wood for tools and furniture, carvings for historical, religious and architectural structures, utensils, firewood, plates, bowls, gum, green manure, medicines, resin, and fodder. Thus, Sal forests are subjected to extensive logging, grazing, and logging. The higher population growth has resulted in heavy pressure on the forest resources of the region as livelihoods and economic well-being are closely linked to forest resources [
24]. Illicit felling of commercially valuable trees such as Sal and the trans-boundary timber trade are major problems in the Terai region [
26]. In addition, the length of monsoon, total rainfall, seasonal flooding and soil conditions have been considered as factors that are modifying vegetation composition and succession in these forests [
27]. Sal forests are one of the most disturbed forest types in the whole South Asia region [
15].
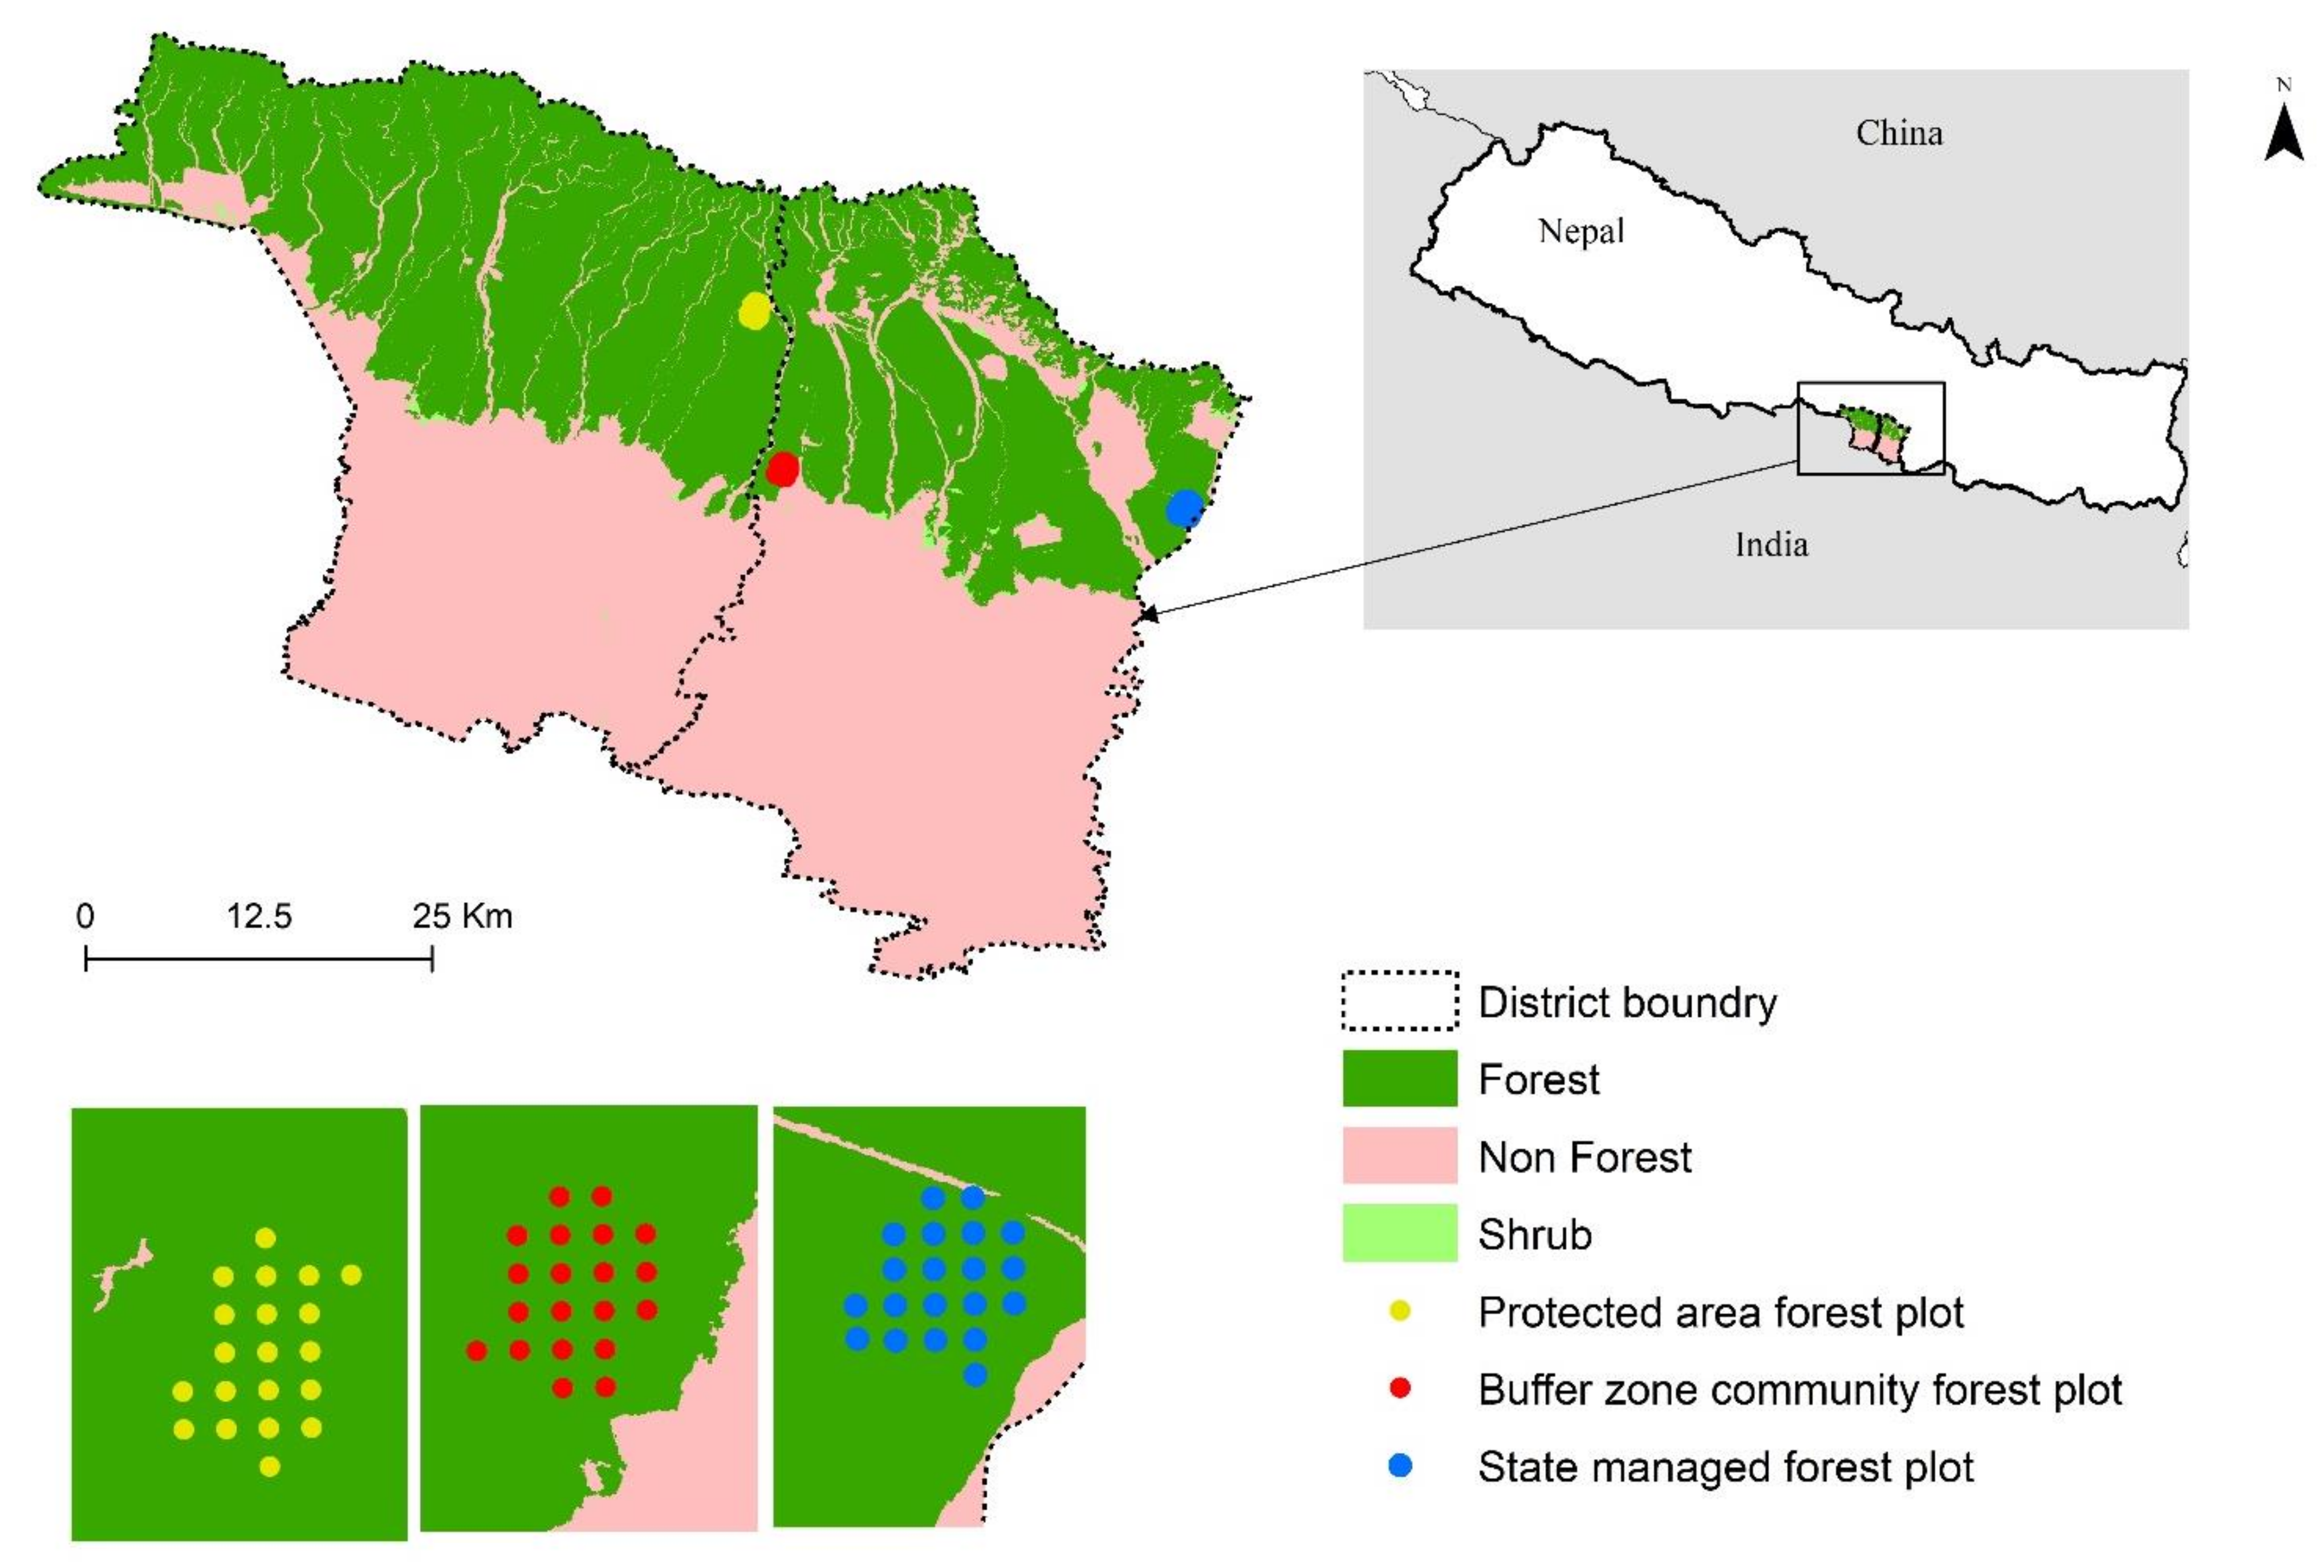
Given the immense pressure from decade-long frequent and fluctuating anthropogenic disturbances and the high conservation value as wildlife habitat and biological corridor in Terai [
23], the Sal forests need immediate management attentions. They are managed in different regimes, depending on management objectives and location of forests with respective to distance from human inhabitants. These forests are commonly managed as protected forests, participatory managed forests (such as community forests, buffer zone community forests, leasehold forests, and collaborative forests), and state-managed forests. While the major aim of the protected forests is biodiversity conservation, participatory managed forests are focused on supplying forest products for local demand. The state-managed forests are managed by government, under the Department of Forests, to protect forests from illegal logging and harvesting. Similar to participatory forests, they are also susceptible to human disturbances due to lower restrictions for public use and lack of strict protection. The level of disturbances also varies in these management regimes due to differences in access and rights to use resources. For example, selective felling, which can lead to serious forest degradation, is mostly practiced in community-based and government-owned Sal forests [
28].
As Sal forests experience continuous disturbances, understanding of their impacts on diversity, stand structure, and regeneration establishment is essential. A limited number of studies has been published to examine the impact of interactive disturbances on stand dynamics and regeneration of these forests in Nepal [
13,
15]. Furthermore, there is a study gap to elucidate how the forest attributes can be maintained under the disturbances. In particular, it is important to understand and compare the level of disturbance in the three major management regimes and effect of disturbance on forest attributes because identifying the disturbance effects help formulating management plans to balance forest protection along with providing forest products need of the local people. Therefore, the main objective of this study was to assess the disturbance level in three different forest management regimes and compare the effect of disturbance in tree species diversity, composition, and regeneration in Nepalese Sal forests. The specific objectives were to elucidate the forest management regimes and level of disturbance for each regime, assess status of species diversity, species richness, and stand structure in each management regime, and assess effect of regeneration due to disturbance in each management regime.
3. Results
3.1. Physical and Chemical Properties of Soils
The soil pH was neutral to slightly basic (6.50–8.47). The soil nitrogen (N) varied from 0.90% to 0.18% per kg, the phosphorus (P) ranged from 16.18 to 78.76 kg/ha, and potassium (K) ranged from 150.70 to 288.60 kg/ha. There was significant difference in P (F (2, 57)
= 18.44,
p < 0.001) and K (F (2, 57) = 44.54,
p < 0.001) among different forest types (
Table 2). Furthermore, pairwise comparison with Tukey’s test revealed significant higher P and K values in PAF compared to the other two forests (
p < 0.05). The soil texture was mostly sandy loam and sandy clay in PAF (15 plots) and BZCF (17 plots), but sandy clay loam in SMF (8 plots).
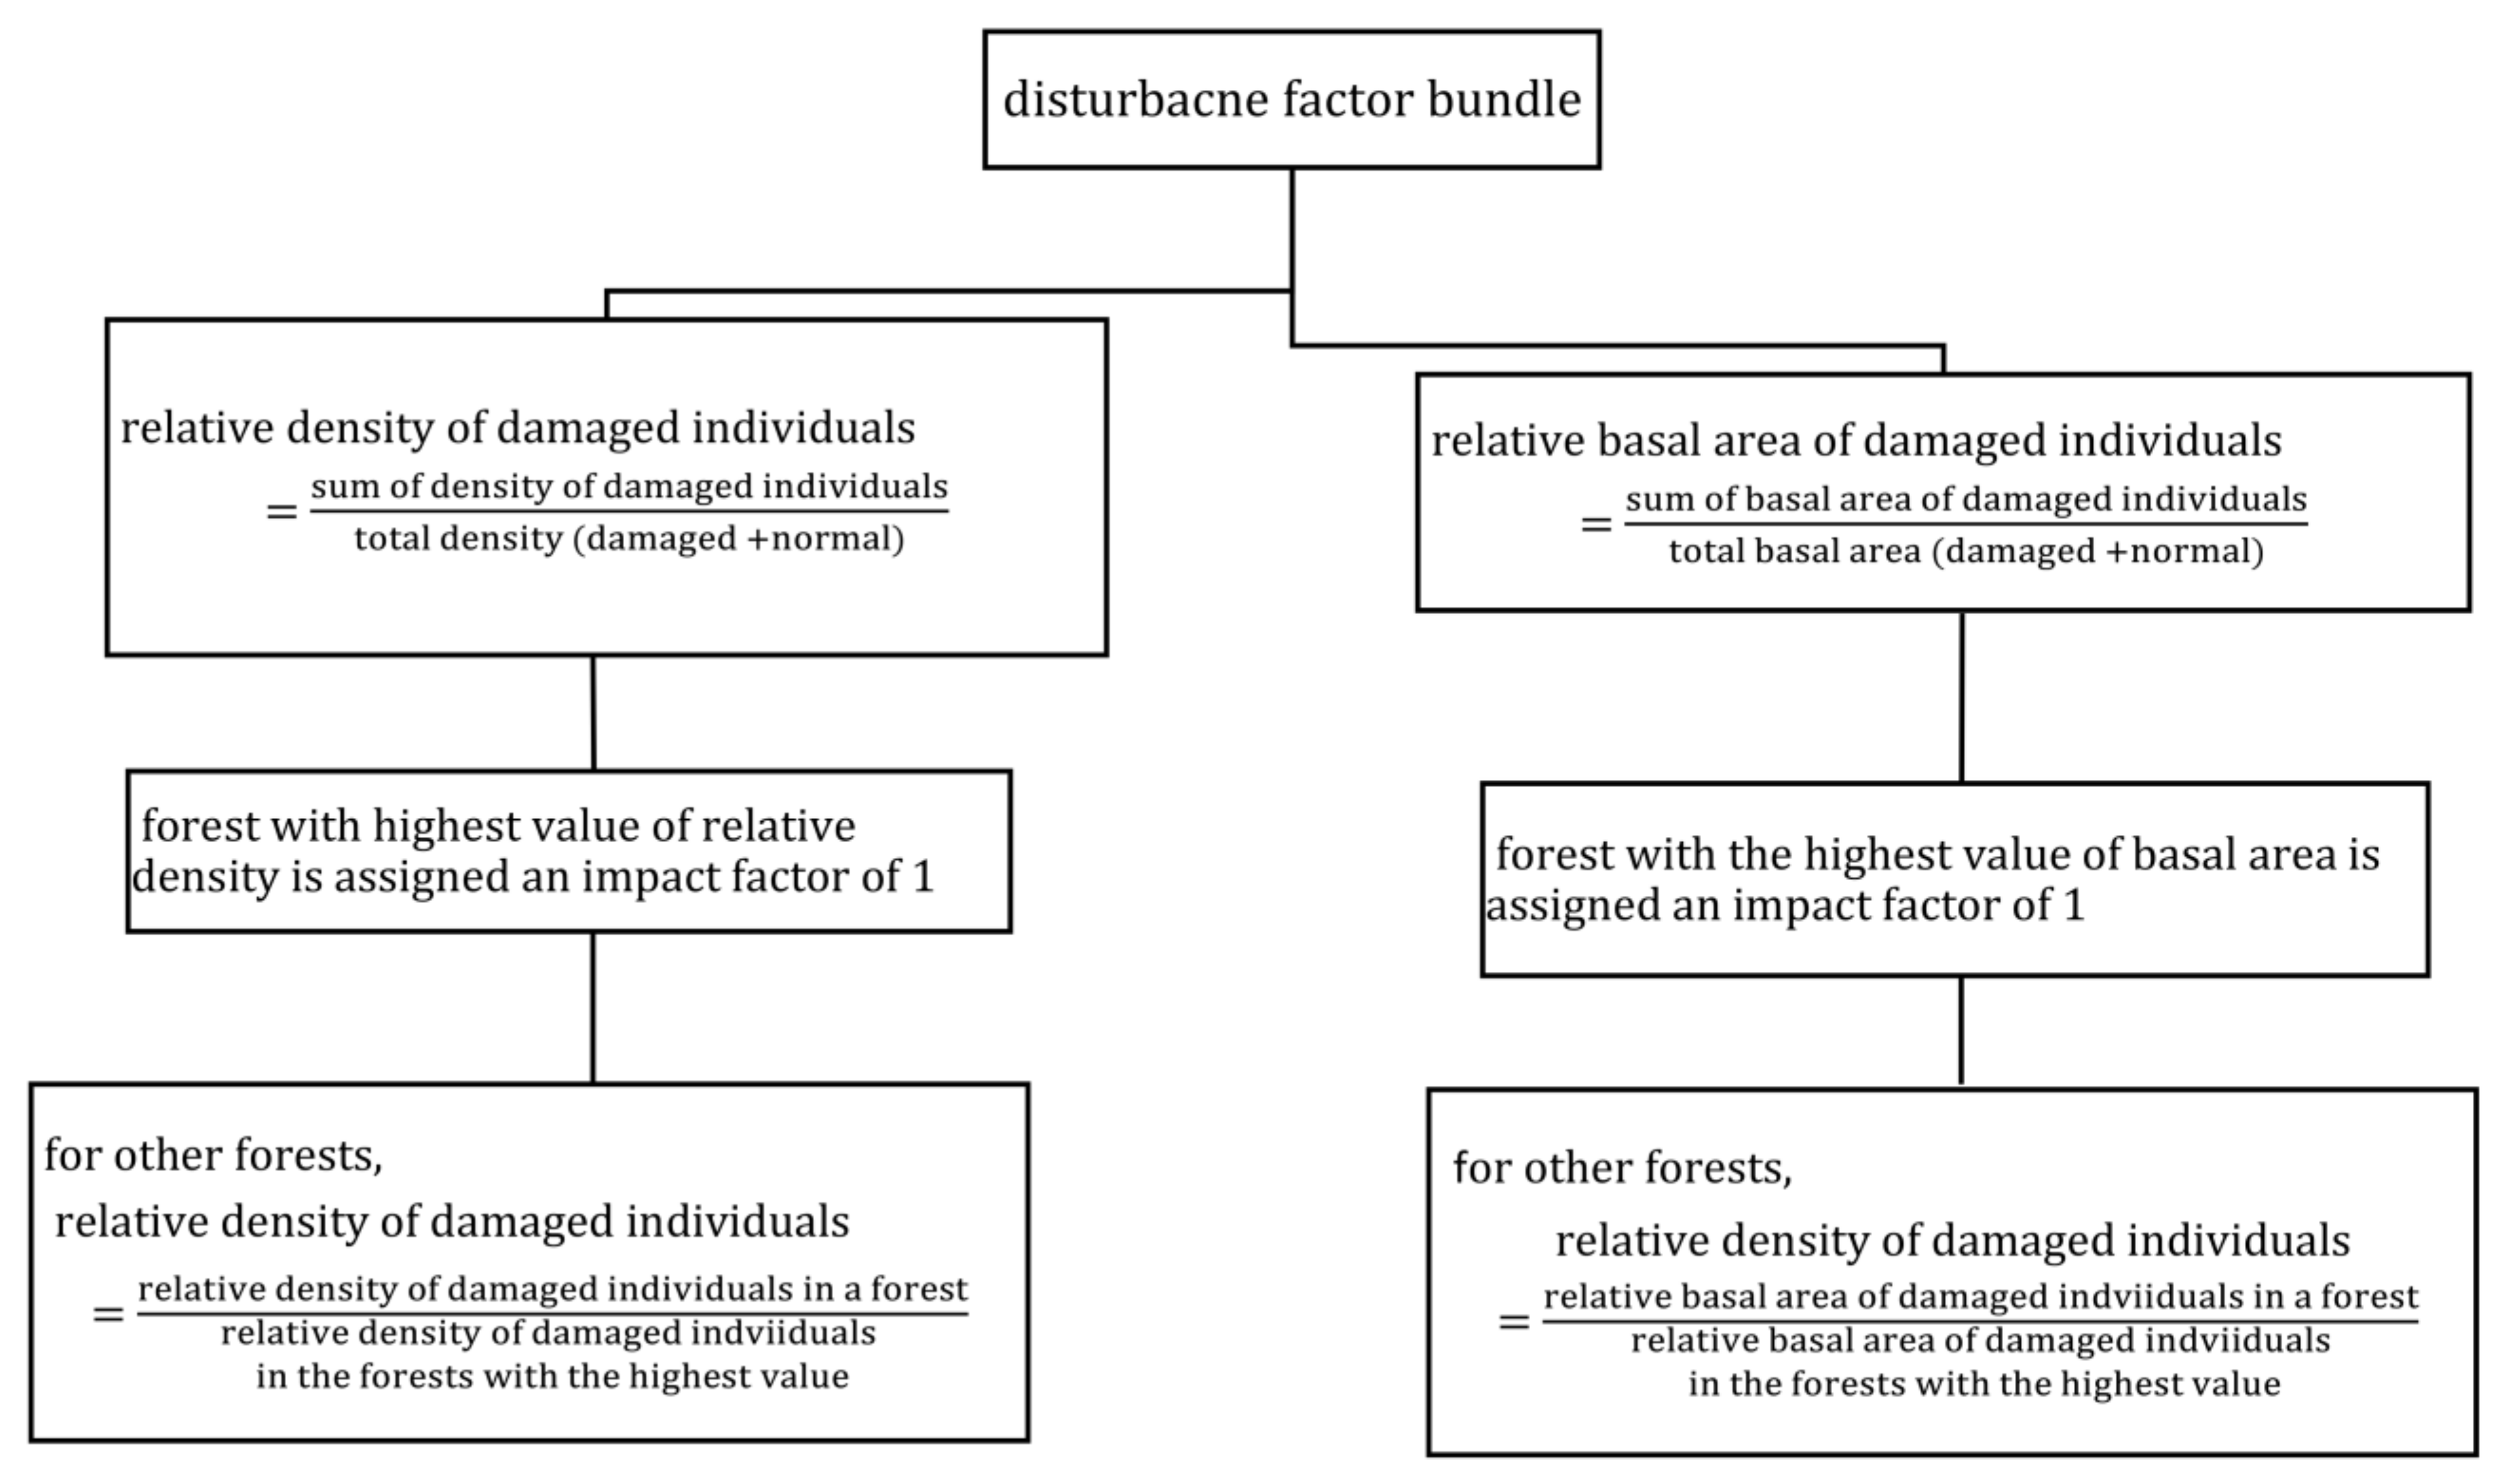
3.2. Disturbance Factor (DF)
We quantified a total of 20 different types of relative disturbance indices based on present and past disturbances in all three forests (
Table 3). The highest sum of disturbance indices was found in the BZCF, moderate values were observed in SMF, and lowest values in PAF, suggesting the highest to lowest disturbance in these forest types, respectively.
We found a significant difference in plot level disturbance bundles among different disturbance levels (p < 0.001). Furthermore, pairwise comparison with Tukey’s test revealed a significantly higher disturbance level in BZCF, with mean relative disturbance bundle per plot of 4.504 (±0.459), compared to other forest types (p < 0.05). Mean relative disturbance bundle per plot was 3.09 (±0.313), and 2.27 (±0.384), respectively for SMF and PAF, but the bundle between these two forest types was not significantly different.
3.3. Species Richness and Diversity
A total of 38 tree species were recorded representing 21 families in all three forest types. With 33 species, the highest number was recorded in SMF, followed by 30 species in PAF and 16 species in BZCF (
Table 4). The highest species richness was observed in moderately disturbed forest and lowest in highly disturbed forest. Thirteen species were found in all forest types. Similarly, the common species shared by PAF and SMF was the highest while the lowest species was shared by PAF and BZCF. The PAF and SMF represented more than 85% of species recorded in all disturbance levels. The Jaccard Index of similarity shows highest similarity between PAF and SMF, but the lowest similarity between PAF and BZCF.
The SMF had the highest species count for tree, pole and seedling, and PAF had the highest for the sapling (
Table 5). In contrast, BZCF experienced the lowest species count for all size classes in comparison to other disturbance levels. We found a significant difference in mean species richness in plot level for tree among the disturbance levels (F (2, 57) = 6.95,
p < 0.001). Furthermore, pairwise comparison with Tukey’s test revealed that SMF had significant higher species richness compared to PAF and BZCF (
p < 0.05). Similarly, mean species richness for pole was significantly different among the disturbance level (F (2, 57) = 4.23,
p = 0.019), and PAF had significant higher species richness than BZCF (
p < 0.05) for pole size class. We did not find a difference in species richness for sapling, but there was significant difference in seedlings between the disturbance levels (F (2, 57) = 4.86,
p = 0.011). In particularly, SMF forest had a significantly higher richness value of regeneration compared to BZCF (
p < 0.05).
Different biodiversity indices were estimated for plot level data. Shannon–Wiener index (F (2, 57) = 7.90, p < 0.001), Simpson’ index of dominance (F (2, 57) = 10.17, p < 0.0001) and abundance (F (2, 57) = 8.94, p < 0.001) were significantly different for tree size class among the disturbance categories. Furthermore, pairwise comparison with Tukey’s test revealed that SMF had a significantly higher Shannon–Wiener index value compared to PAF and BZCF (p < 0.05), and higher concentration of dominance i.e., Simpson’ index in PAF compared to SMF and BZCF (p < 0.05) and higher abundance in PAF compared to BZCF (p < 0.05). Similarly, Shannon–Wiener index was significantly different for pole among the disturbance categories (F (2, 57) = 3.74, p = 0.029) and PAF had a significantly higher value compared to BZCF (p < 0.05). In general, Shannon’s diversity, Pielou’s evenness and abundance were higher in PAF and SMF within the plot level, but the abundance of seedling was highest in BZCF. In contrast, Simpson’s index was lowest in SMF in all size classes except for pole in PAF.
3.4. Stand Structure
Density of individual size class revealed that the PAF had the highest density for tree, pole, and sapling, while highest seedling density was observed in BZCF (
Table 6). Seedling accounted for the highest percentage of stem density across all management regimes. Similarly, the tree density was lowest followed by pole in all management regimes; with less than 1% and 3% tree and pole density of total density, respectively. The percentage of sapling was highest in PAF and about the same in BZCF and SMF. Total basal area per ha was higher in PAF for pole and sapling compared to other two disturbance categories. Overall, PAF had the highest BA of all size classes and BZCF had the lowest. The BA of tree size in PAF and SMF were almost double than in the BZCF. The maximum diameter of trees in PAF and SMF did not exceed 95 cm, whereas it exceeded 100 cm in BZCF. The abundance of trees in higher diameter class increased with decreasing disturbance level.
Tree density above 1.3 cm DBH, varied from 2870 to 4013 stems/ha and basal area from 25.49 to 39.47 m
2/ha among the management regimes (
Table 5). Density was highest in PAF forest and lowest in BZCF. We found that there was a significant difference in mean density among management regimes (F (2, 57) = 3.61,
p = 0.0332). Furthermore, pairwise comparison with Tukey’s test revealed that the difference was limited only between PAF and BZCF (
p < 0.05). Similarly, we found that SMF forest had the highest BA for stems above 1.3 cm. There was also a significant difference in mean basal area among management regimes (F (2, 57) = 10.79,
p = 0.0001). Furthermore, pairwise comparison with Tukey’s test shows that PAF and SMF were significantly higher compared to BZCF (
p < 0.05).
3.5. Dominance of the Species
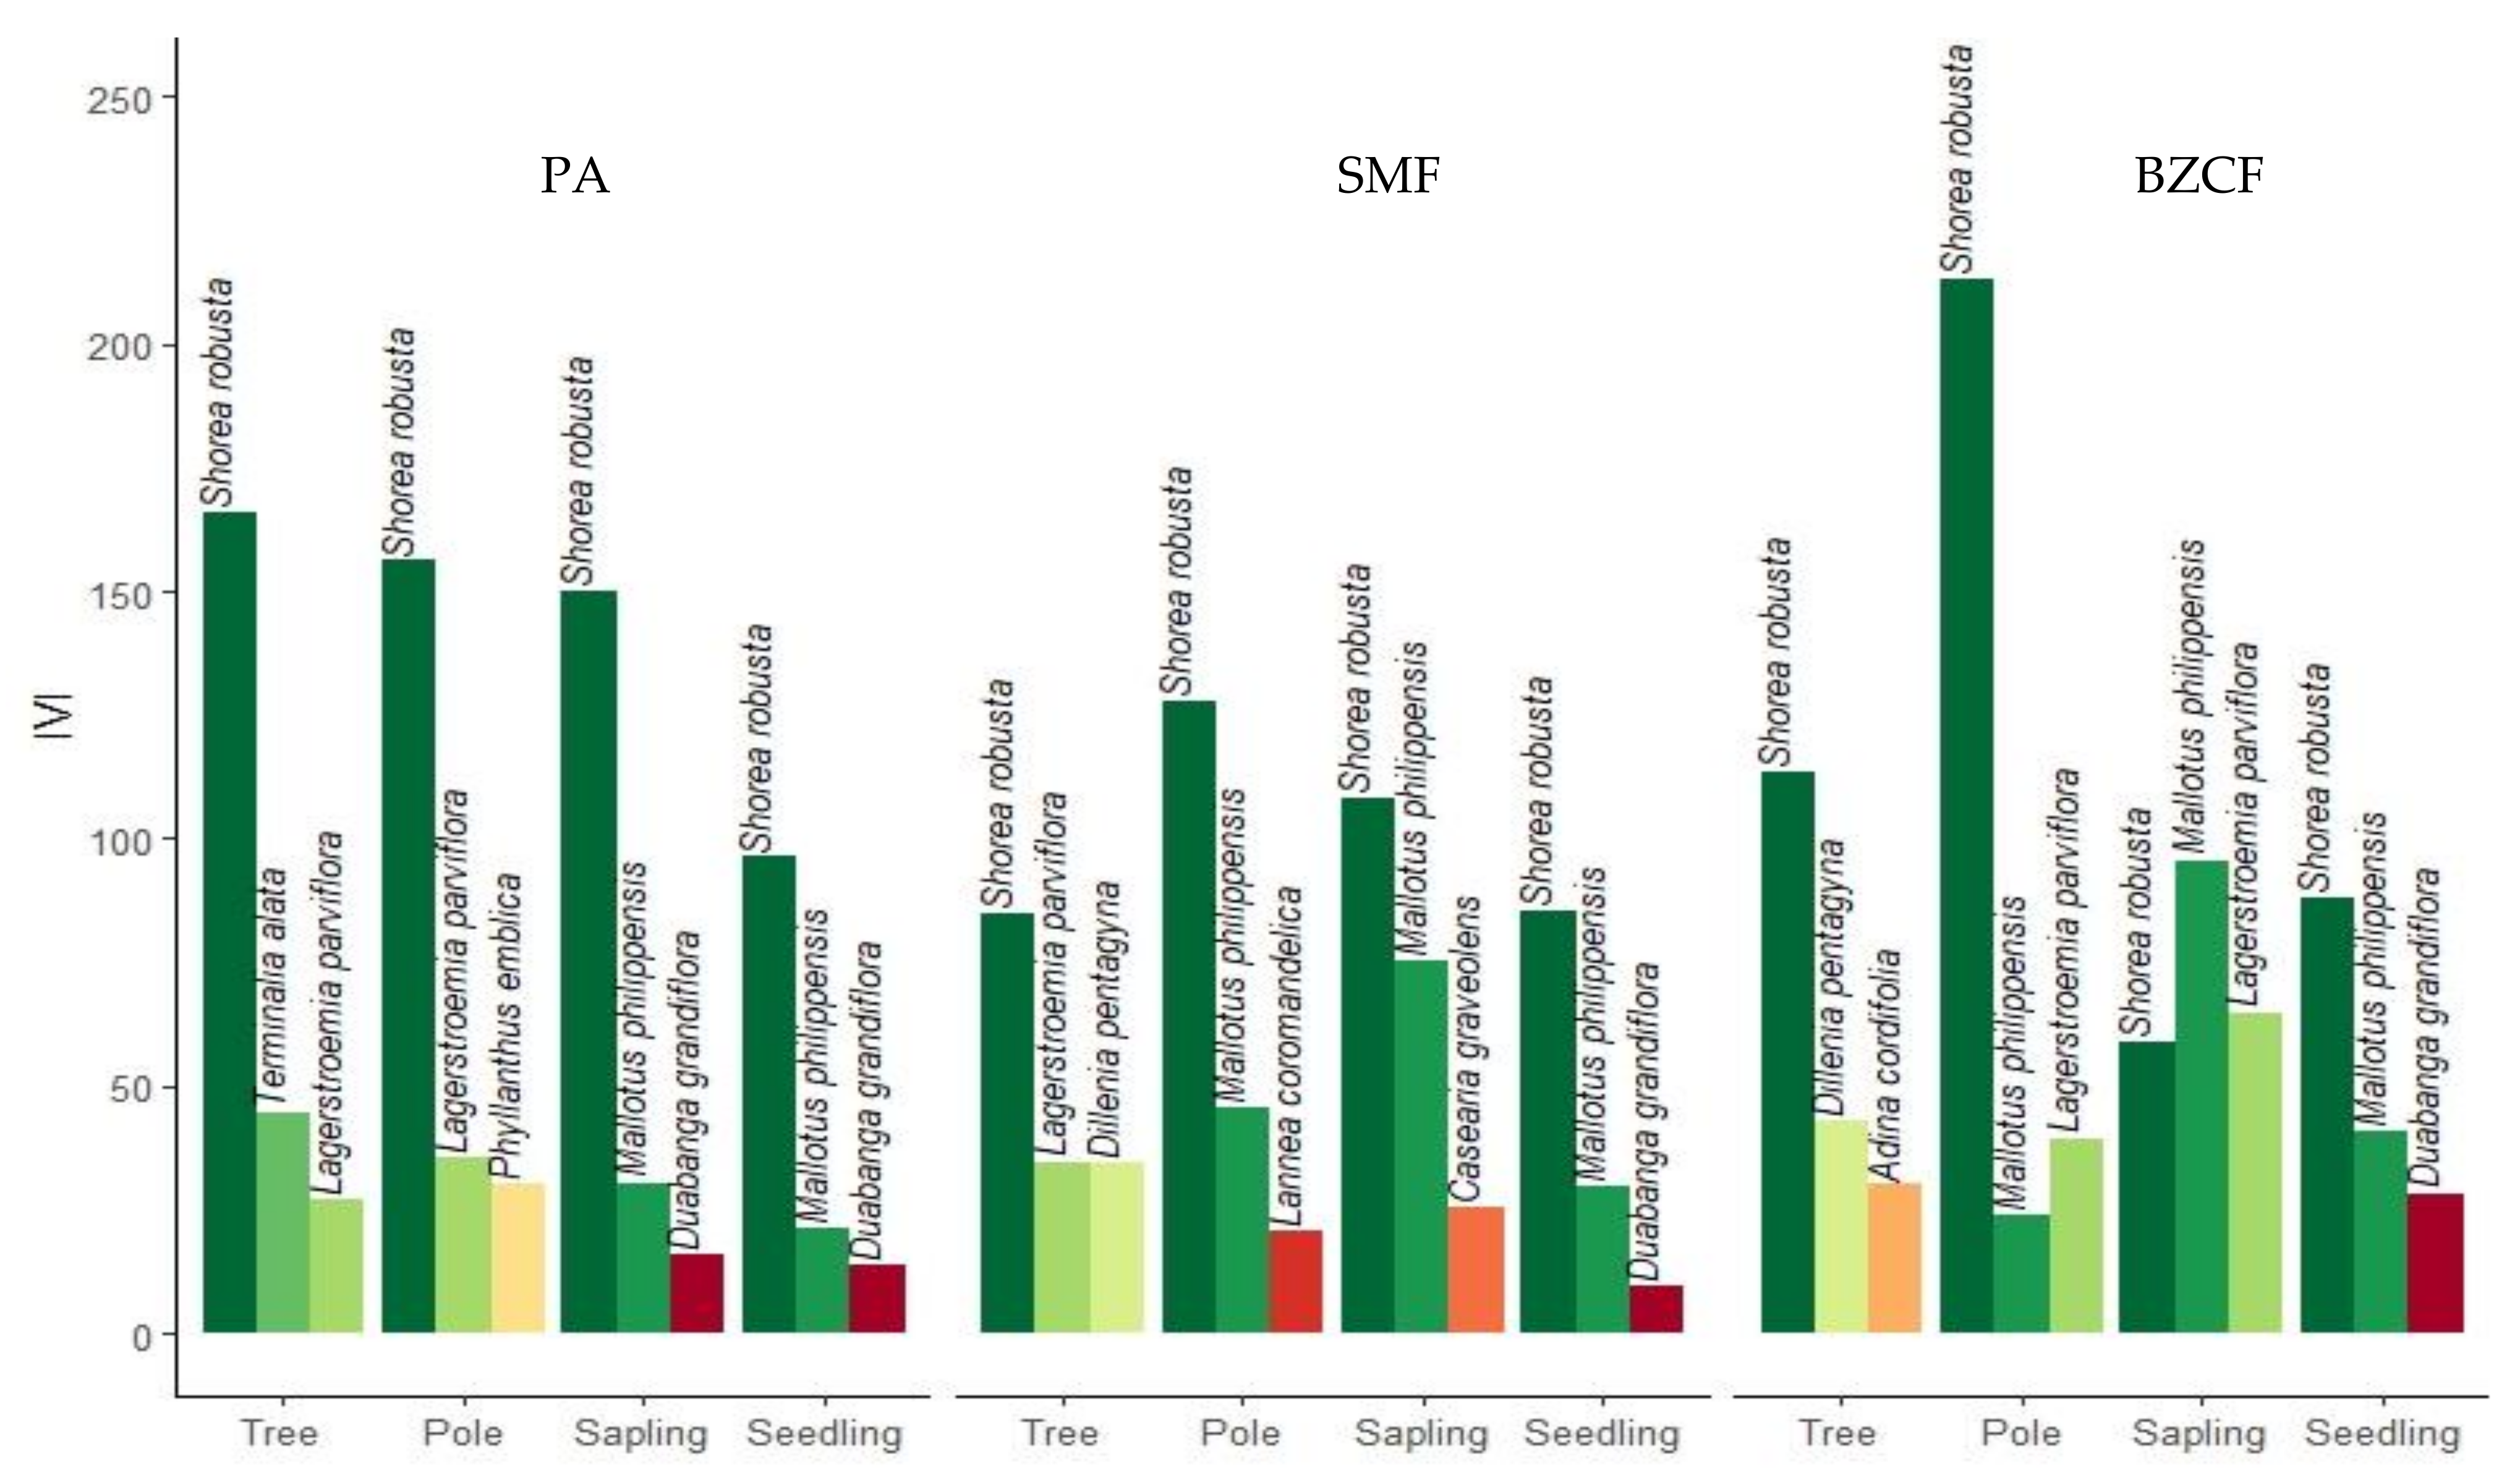
Shorea robusta was the most dominant species across all disturbance regimes in all size classes except the sapling class in the BZCF (
Figure 4). Only the top three dominant species on each class are reported in the figure. In tree size class, the second most dominant species was
Terminalia alata in the PAF and
Dillenia pentagyna in SMF and BZCF, respectively. For pole size, the second most dominant species was
Lagerstroemia parviflora in PAF and BZCF, but
Dillenia pentagyna in SMF.
For sapling,
Mallotus philippensis was the most dominant species in BZCF followed by
Lagerstroemia parviflora and
Shorea robust.
Shorea robusta was the most dominant species in PAF and SMF followed by
Mallotus philippensis. For seedling, the second most dominant species was
Mallotus philippensis across all disturbance regimes. The IVI gives a total picture of the social structure of species in a community and can be used to form an association of dominant species [
46]. Sal is dominant in all size classes, except in sapling of BZCF forest. The extent of Sal dominance differed considerably among the forests. PAF had the highest IVI of the Sal compared to other disturbance regimes in all but pole size classin BZCF.
3.6. Status of Regeneration
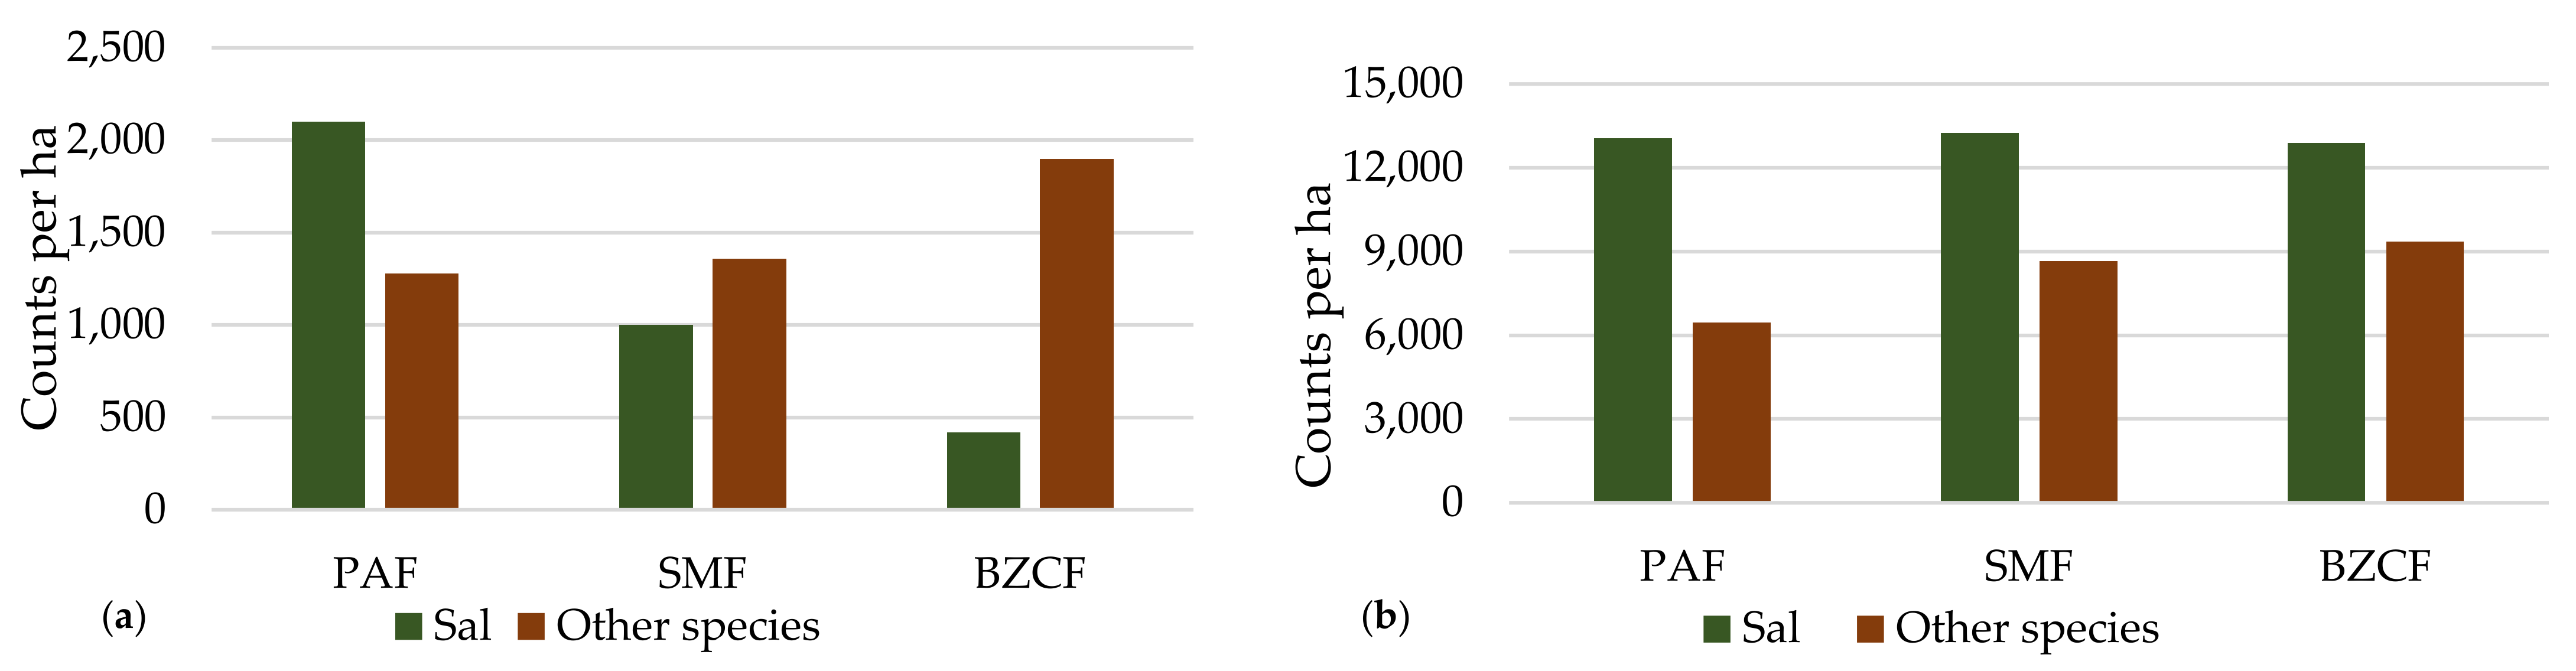
In the sapling class, we found a total of 15, 12 and 10 distinct species in PAF, SMF and BZCF, respectively (
Figure 5). Sal was the most dominant sapling species, which comprised 62.13% and 42.37% of sapling counts in PAF and SMF disturbance regimes, respectively. Meanwhile, in BZCF regime, Sal contributed only 18.12% of total sapling counts. It can be noticed that the highly disturbed regime was mostly inhabited by undesirable species. Regeneration was examined separately. A total of 17, 20 and 8 species were recorded in PAF, SMF, and BZCF, respectively. Sal was the most dominant regeneration species in all disturbance regimes; it accounted for 66.92%, 60.50%, and 57.97% of all regeneration in PAF, SMF, and BZCF, respectively.
3.7. Disturbance Bundles
We examined how disturbance impacts Sal ingrowth by calculating disturbance bundle as a proxy index to estimate disturbance on each plot across all regimes. We found a negative relation between Sal’s sapling density and disturbance bundle; with increasing disturbance, we found less sapling counts (b0 = 1919.3, b1 = −216.7, R2 = 0.1098, adj. R2 = 0.09446, p < 0.009). We also found negative relation between Sal’s regeneration and disturbance; however, the relationship was not significant (b0 = 13503.9 b1 = −134.6, R2 = 0.001457, adj. R2 = −0.01567, p = 0.7654). Sal had the highest sapling count compared to all other species in PAF (62.13%) and SMF (42.37%) but was only third highest in BZCF (18.12%). In contrast, Sal regeneration accounted for the highest in number compared to all other species regeneration in PAF (66.92%), SMF (60.50%) and BZCF (57.97%).


