Article

Phosphate Treatment by Five Onsite Wastewater Systems in a Nutrient Sensitive Watershed

by
Charles P. Humphrey, Jr.
Department of Health Education & Promotion, East Carolina University, Greenville, NC 27858, USA
Earth 2022, 3(2), 683-698; https://doi.org/10.3390/earth3020039
Submission received: 20 April 2022 / Revised: 28 May 2022 / Accepted: 30 May 2022 / Published: 31 May 2022

Abstract

:
Excess phosphate (P) loading to surface waters increases productivity sometimes causing an imbalance leading to eutrophication and water quality degradation. Wastewater contains elevated concentrations of P and other contaminants that pose threats to environmental health. Onsite wastewater systems (OWS) are used in many rural areas, but most are not monitored for P removal effectiveness. The goal of this research was to gain a better understanding of the P treatment efficiency of OWS in a nutrient-sensitive watershed. Groundwater monitoring infrastructure, including networks of wells and piezometers, was installed at five sites with OWS in coastal North Carolina. Groundwater samples from the piezometers and wastewater samples from the septic tanks were collected and analyzed for phosphate and physicochemical parameters. Results suggest that significant reductions in P concentrations (79.7 to 99.1%) were occurring in the soil immediately beneath the drainfield trenches, but P concentrations in groundwater near the OWS and more than 35 downgradient were alike and significantly elevated relative to background concentrations. OWS in areas with sandy soils such as the Hoods Creek watershed may be sources of P to groundwater and surface water. Nutrient management policies in watersheds with sandy soils should include provisions for assessing and reducing P contributions from OWS to surface waters.

1. Introduction

Primary productivity in aquatic environments, including freshwater streams and lakes, is often limited by the availability of phosphorus [1]. Additions of phosphorus to aquatic environments may stimulate growth of phytoplankton, thus providing a food source for larger aquatic organisms. However, excess loading of phosphorus to surface water has been documented to cause eutrophication and impairment of aquatic habitat and water-based recreation [2,3]. Furthermore, some blooms of blue-green algae (cyanobacteria) may produce toxins which can be deadly to animals and humans [4]. Animal manure, human wastewater and biosolids, and synthetic chemicals with elevated phosphorus concentrations are often land-applied to agricultural fields and/or lawns as fertilizers to stimulate growth but may also result in excess loading of phosphorus to surface waters via runoff [5]. In some regions with nutrient sensitive waters, including eastern North Carolina, regulations to reduce nutrient loading to water resources have been enacted [6]. Implementation of agricultural best management practices, such as vegetated buffers along drainageways, cover crops, conservation tillage, and nutrient managements was required to help reduce nutrients loads contributed by agricultural land to surface waters. Installation of stormwater control measures in urban areas, and nutrient loading caps for wastewater treatment plants were also required by the regulations. A ban of phosphorus use in laundry detergent also helped to curb phosphorus loading to receiving waters from point sources in many regions [7,8]. However, despite these efforts, excess nutrient loading remains a problem [9]. Other non-point sources of phosphorus that were not included in remediation strategies, such as OWS, may be contributors, but more research is needed to quantify their contributions.
Municipal wastewater contains concentrations of phosphorus (3–40 mg L−1) [10] that are often orders of magnitude greater than concentrations needed to stimulate eutrophication [11,12]. Wastewater from most homes and businesses is typically either treated by a centralized municipal sewer system or OWS. Municipal sewer systems treat wastewater from cities and towns and typically discharge treated effluent into nearby rivers or lakes and are thus considered point sources of pollution [12]. The effluent discharged from centralized sewer systems is monitored for nutrients and other water quality parameters [12,13]. The phosphorus treatment efficiency of OWS is typically not monitored, partly because most OWS do not discharge effluent directly to surface water [14]. An OWS includes a septic tank, drainfield trenches, and soil beneath the drainfield trenches [15]. The septic tank separates the solid and liquid portions of wastewater and should have sufficient capacity to accumulate and store solids for years before septage pumping is needed [16]. The liquid wastewater that leaves the tank is distributed to the drainfield trenches where it percolates into the subsoil. Most of the phosphorus discharged from septic tanks is reactive phosphate (PO4-P) [12,17,18]. Mechanisms for phosphate (P) treatment including adsorption, immobilization via plant and microbial uptake, and mineral precipitation may occur in the vadose zone (aerated soil) beneath the drain field trenches ultimately reducing P transport [12,14,17,18]. Treatment of P by OWS is thus influenced by the soil characteristics (e.g., pH, texture, aeration) and vertical separation distance between the drain field trenches and groundwater [12,19,20]. More specifically, reduction and oxidation (redox) reactions in the soil may cause changes in pH which in turn influence the solubility of iron, aluminum, and phosphorus [17,20]. Under certain pH and redox thresholds, P may combine with iron, aluminum, or calcium to form minerals that precipitate, and are removed from solution [20,21]. Some soils with high clay content and iron and aluminum oxide content, have the capacity to remove 90% or more of the P discharged by OWS via adsorption and precipitation [18,22,23]. However, OWS in sandy soils with less reactive surface area and absence of iron oxides may not remove much P, resulting in elevated groundwater P concentrations near the OWS and 20 m or more downgradient from the OWS [12,14,24]. If OWS are installed in soils with unfavorable conditions for adsorption or precipitation of P, then nutrient loading to groundwater and nearby surface waters may occur [12].
OWS are commonly used in coastal NC where the soils are sandy, and groundwater is relatively shallow [25]. It is therefore important to understand the effectiveness of these systems to access their contribution to P loading to water resources. The state’s Nutrient Sensitive Waters Management Strategies were developed to achieve a reduction in major point and non-point nutrient loading to water resources but failed to include provisions for loadings associated with OWS. The goal of this study was to evaluate the phosphorus treatment efficiency of five OWS serving private residences in coastal North Carolina to provide more information regarding OWS contributions of P to nutrient-sensitive waters.

2. Materials and Methods
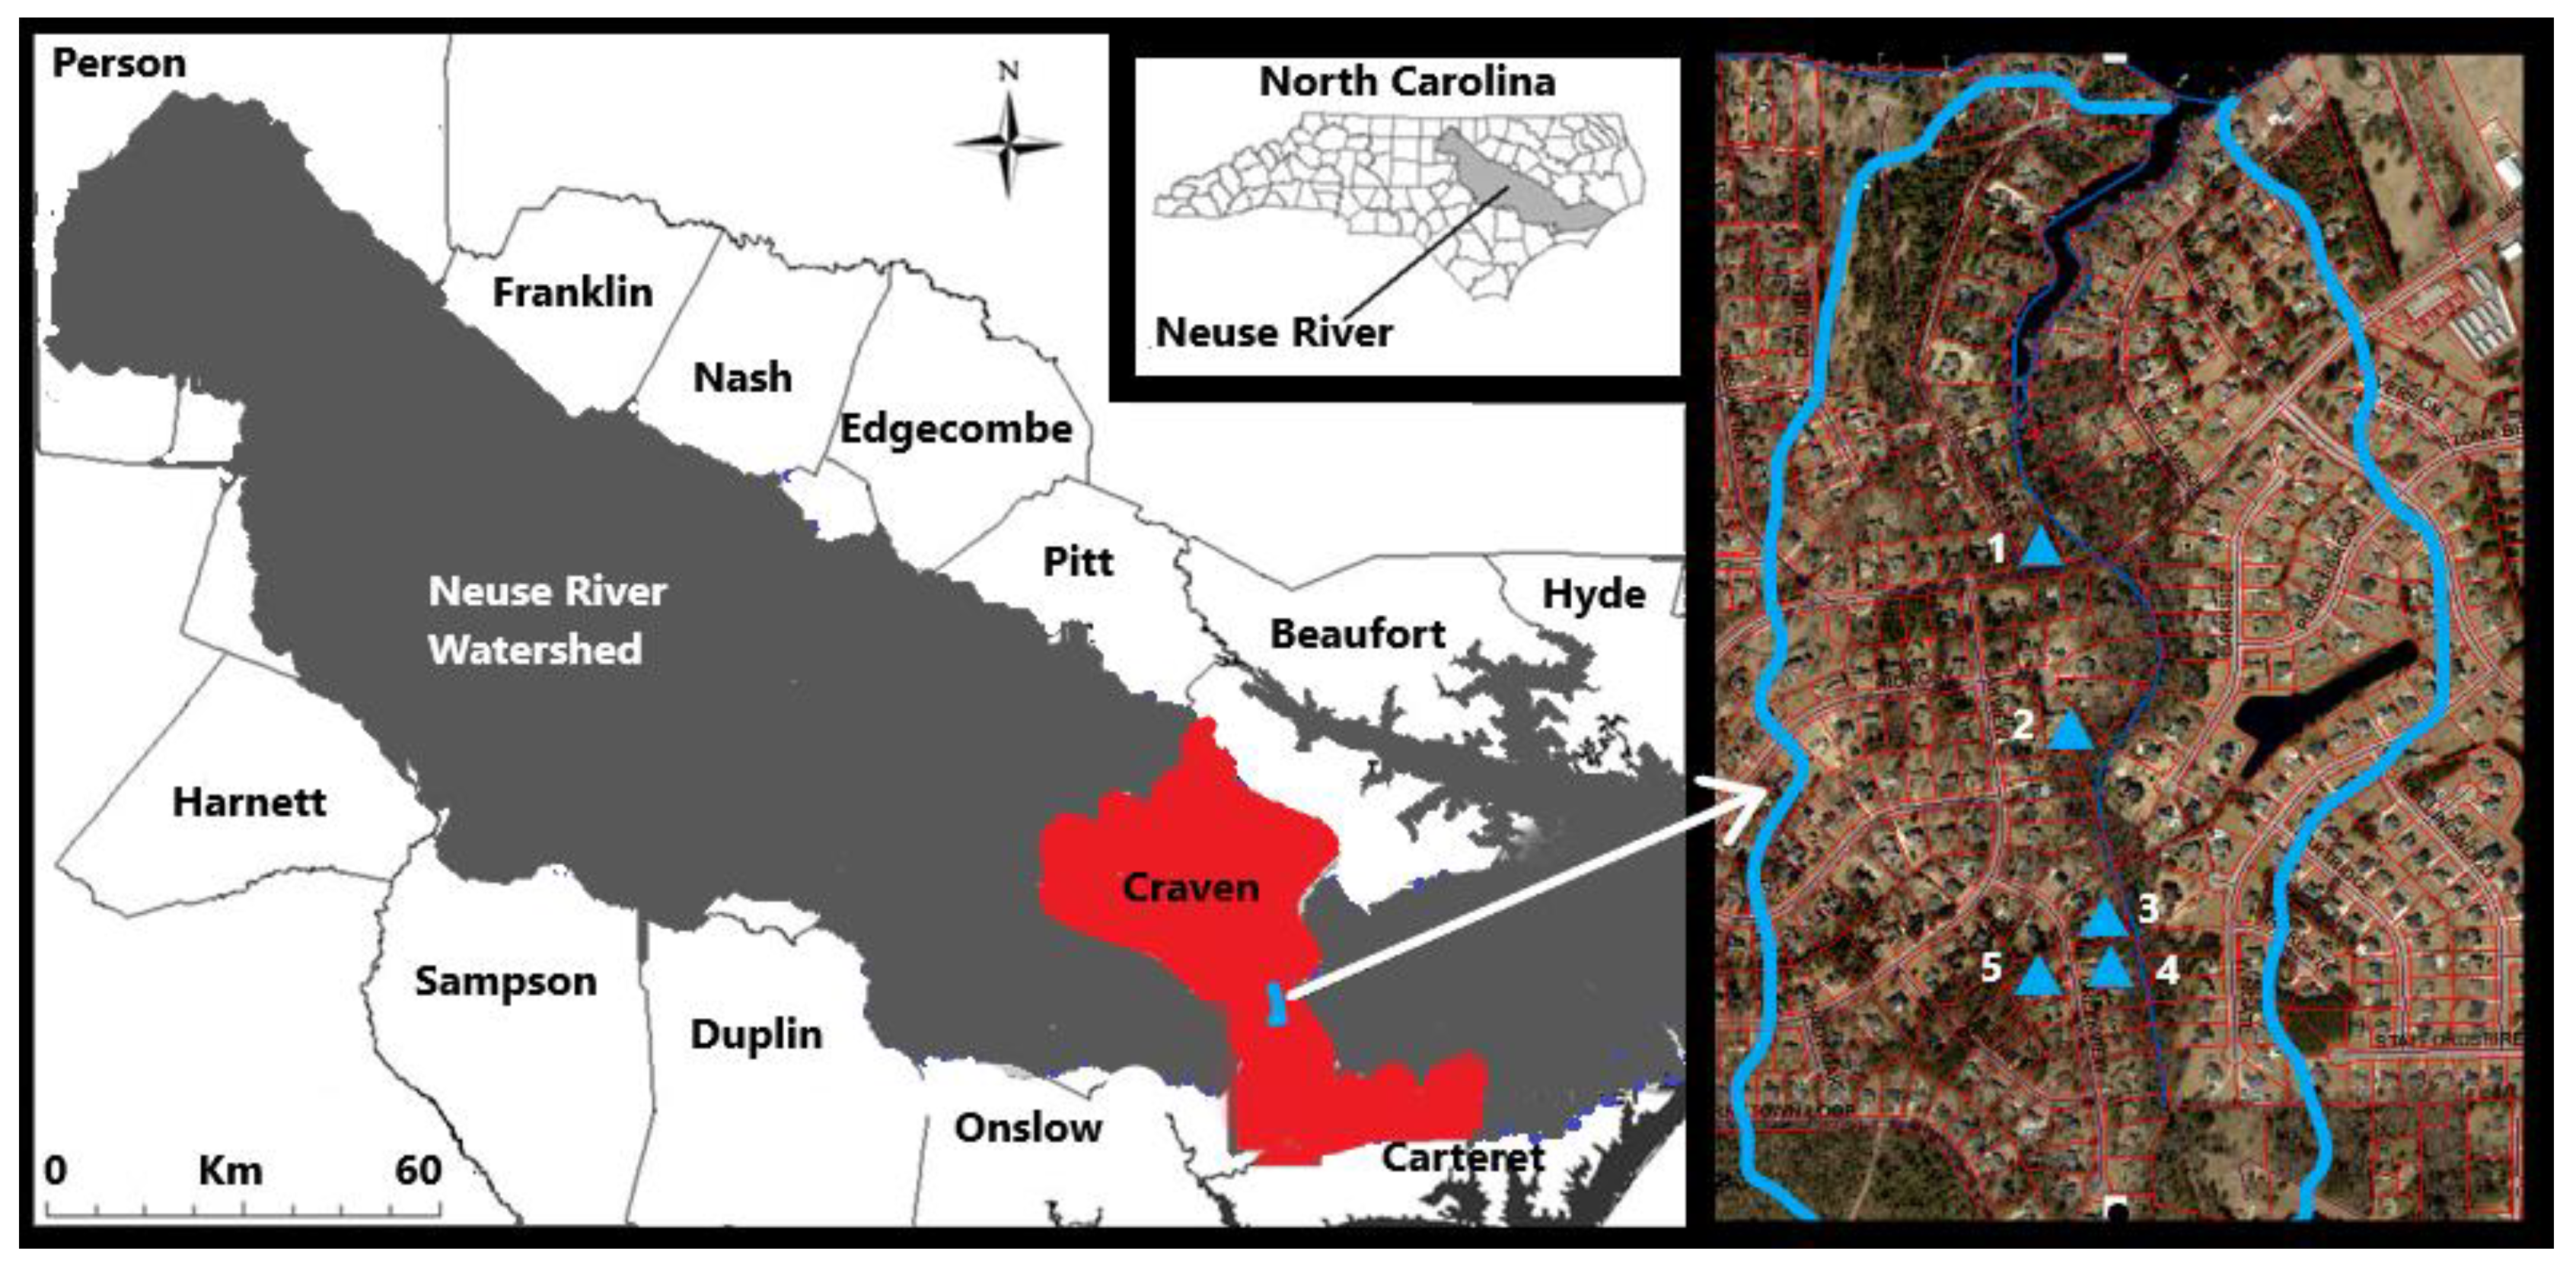
2.1. Study Location

Five volunteer study sites were selected in close proximity (<80 m) to Hoods Creek in Craven County, NC, USA (Figure 1). Hoods Creek drains approximately 184 ha of land that is predominantly used for residential development. The homes in the watershed are all served by OWS. Wetlands and forests account for about 15% of the watershed, while herbaceous vegetation and grasslands account for about 27% each [26]. Hoods Creek discharges to the Trent River, a tributary of the Neuse. The Neuse River has been identified as one of the most troubled rivers as a result of excess nutrient loading, thus identifying and remediating major sources of nutrient pollution to the Neuse is very important [9]. Hoods Creek is near the watershed outlet for the Neuse River (Figure 1) and thus P exports from Hoods Creek have less opportunity for in-stream processing before reaching the Neuse estuary relative to contributions from tributaries located closer to the headwaters of the Neuse. Hoods Creek and the surrounding area receive an average of 134 cm of rain annually, with monthly means ranging from 8.1 cm in April to 16.9 cm in August [27]. The average annual high is 22.8 °C and the average annual low is 11.3 °C. Temperatures are warmest during the summer months of July and August when mean daily high temperatures are between 31 and 32 °C, and the mean daily lows are between 21 and 22 °C. Temperatures are lowest in the winter months of December and January when highs are between 12.5 and 14.2 °C and lows are between 1 and 2.3 °C [27]. Craven County is in the Coastal Plain geologic region of North Carolina and is underlain by a series of eastwardly dipping and thickening wedges of sand, gravel, and limestone forming aquifers that are separated by confining units composed of clay and silt [28]. Groundwater from the surficial aquifer is hydrologically connected to streams and rivers in the coastal plain, thus groundwater influenced by OWS may also influence surface water quality [12,13]. The 5 study sites each used conventional-style OWS which included a septic tank and drain field trenches. The OWS specifications are displayed in Table 1.

2.2. Groundwater Monitoring Infrastructure

Soil augers with removal handles and extensions were used to create boreholes (up to 8 m deep) that extended below the water table. The depth to groundwater was noted and wells and piezometers were assembled to allow for groundwater sampling and monitoring. Three wells were initially installed at Sites 1 and 2 and an engineering level was used to determine the relative elevation of each well casing. A tape measure was used to determine the distance between each well. The well locations were plotted on a property survey. Depth to water at each well was subtracted from the relative elevation of the well casing to calculate the relative elevation of the water table. Three-point contouring was used with the water elevation data to assess the direction of groundwater flow [29]. Rows of piezometers approximately 10 m apart were installed perpendicular to the groundwater flow path between the OWS drainfields and the creek at Sites 1 and 2 (Figure 2 and Figure 3). Wells and piezometers were constructed using solid, 5 cm-diameter PVC pipe, well screen, and PVC caps. The casing was cemented and coupled to the well screen (60 cm long for piezometers and 150 cm for wells) and a cap was cemented to the end of the screen. Piezometers and wells were driven into the open boreholes to ensure they penetrated the water table. Well sand was poured around the outside screen portion of each well and piezometer. Above the well screen, a mixture of bentonite and sand was used to seal the annular space. Piezometers were installed at different depths and in nests (2 to 4 piezometers) to allow for observation of water quality at various levels below the water table (Supplementary Materials). Piezometers were installed upgradient from the OWS (background), near drainfield trenches (<2 m), and downgradient (10 to 35+ m) from the OWS at Sites 1 and 2 to allow “tracking” of the wastewater impacted groundwater plumes. Sites 3, 4, and 5 were neighboring properties, that were less intensively instrumented with 2 to 3 nests of piezometers installed near the OWS drainfield trenches, a few piezometers downgradient from the trenches to assess hydraulic gradients, and a piezometer (nest #1) in a background location at Sites 3 and 4 that provided background groundwater data for all 3 non-intensive sites (Figure 4). Sites 3–5 were monitored to provide additional information regarding P reductions in the vadose zone beneath OWS drainfield trenches. Overall, at the 5 sites, 125 piezometers and 7 wells were installed for groundwater monitoring. During the well installation process, soil samples were collected from Site 1 and Site 2 near the drainfield trenches for particle size analysis via the hydrometer method. Soil series were determined based on characteristics that most closely matched with soil descriptions in the Soil Survey of Craven County [30]. Each volunteered site was served by municipal water and the use was metered. Water records were used to assess P loading (kg yr−1) from the septic tanks to the soil by multiplying the P concentration in wastewater and the flow.

2.3. Bromide Tracer

Groundwater samples were collected from all piezometers and wells at Sites 1 and 2 and analyzed for bromide at the start of the study. Bromide was not detected in the groundwater at the sites, making them good candidates for a tracer experiment [31]. A 20-L solution of distilled water enriched with approximately 1.5 kg of potassium bromide was added to the distribution boxes at the sites to help determine the flow direction and the velocity of groundwater. After injection, groundwater samples were collected approximately biweekly for bromide analysis. Velocity of groundwater was estimated by recording the time observed for the bromide plume to travel from the drainfield piezometers to the piezometers more than 35 m downgradient and near the streams at Sites 1 and 2. Piezometers and wells from which groundwater with bromide was detected were considered within the flow path of the wastewater impacted groundwater plume and these data were also used to determine the groundwater flow direction. The dimensions of the wastewater impacted groundwater plumes were estimated based on the location and depth of piezometers that tested positive for bromide. Plume length was calculated by measuring the distances between drainfield piezometers and piezometer near the creek from which water samples tested positive for bromide. Plume width was calculated by measuring the farthest distance between piezometers adjacent to the creek that were positive for bromide. Plume depth was based on the screen lengths of multilevel piezometers near the creek that were positive for bromide. Slug tests [29] were performed at each piezometer nest and the data were analyzed using the Bouwer and Rice graphical method with the Super Slug program (Starpoint Software Inc., Mason, OH, USA) to determine the mean hydraulic conductivity at each site. A constant head permeameter (Ksat, Inc., Raleigh, NC, USA) was used to assess the saturated hydraulic conductivity of the soil layers above the water table in the boreholes used to collect soil samples. Hydraulic conductivity of the unsaturated zone (via permeameters) and the saturated zone via slug tests were compared. Hydraulic gradients between piezometers near the drainfield and the creek were calculated using differences in the hydraulic head divided by the distance between the piezometers. Effective porosity of the aquifer material was “back-calculated” after determining groundwater velocity at Sites 1 and 2 via the bromide tracer. Groundwater velocity estimates for Sites 3–5 were calculated using the effective porosity from Sites 1 and 2 and the hydraulic gradient and hydraulic conductivity were measured at Sites 3–5 using Darcy’s equation (Equation (1))
q = K ( d h d l ) / n e
where q = groundwater velocity, K = hydraulic conductivity, dh/dl = hydraulic gradient, ne = effective porosity.

2.4. Measurements and Sampling

Depth to groundwater was measured at each piezometer using a water level meter (Solinst Inc., Georgetown, ON, Canada). The piezometers were then purged several times and physicochemical parameters, including temperature, pH, electrical conductivity (EC), and oxidation–reduction potential were measured using multi-parameter field meters (Yellow Springs Inc., Yellow Springs, OH, USA). Groundwater from wells and piezometers, wastewater from septic tanks, and streams were sampled every three months over a one-year period. Sampling events occurred during the “wet season” months of December and March when groundwater levels are typically closer to the soil surface in North Carolina and in June and September when groundwater levels are lower due to increased evapotranspiration [23]. Some piezometers were dry during one or more of the four sampling events but overall, 403 samples were collected and analyzed for P. Groundwater samples were collected using disposable bailers. Each sampling location had a separate bailer to reduce the likelihood of cross-contamination. Samples were stored in ice-filled coolers and transported to the lab for analysis. Collected samples were filtered using 0.45 µm pore-size filter paper and analyzed for P concentrations using a Lachat QuickChem (Hach Company, Loveland, CO, USA) flow injection analyzer at the North Carolina State University Department of Crop and Soil Science Analytical Services Lab.

2.5. Statistical Analyses

The P treatment efficiencies of the OWS were calculated using Equation (2).
T r e a t m e n t   E f f i c i e n c y = W a s t e w a t e r   P   C o n c e n t r a t i o n G r o u n d w a t e r   P   C o n c e n t r a t i o n W a s t e w a t e r   P   Concentration × 100 %  
Concentrations of P in wastewater were compared to concentrations in groundwater near (<2 m) and downgradient from the OWS. Most data did not follow a normal distribution, thus non-parametric statistics, including Mann–Whitney tests, were used with Minitab 18 Statistical Software (Minitab LLC., State College, PA, USA) to determine statistical significance between comparison groups. Differences in concentrations were considered statistically significant at p < 0.05.

3. Results and Discussion

3.1. Hydrology and Soils

The Hoods Creek area received 125 cm of rainfall during the 1-yr study, which is about 9 cm or 7% below the annual mean of 134 cm [27]. Groundwater levels at each site near the OWS drainfields were deeper than 1.2 m below the soil surface during each site visit. All OWS drainfield trenches monitored were installed 0.6 m below the surface and thus the OWS were in compliance with NC Regulations (15A NCAC 18A.1995 (m)) stipulating that OWS in sandy soils must maintain a 0.45 cm separation or greater distance to groundwater. Groundwater levels fluctuated between 0.3 m (Site 4) and 0.6 m (Site 5) near the drainfields at each OWS during the study. The soil survey of Craven County, NC [30] lists the soil series at each of the five sites as Autryville loamy sand. Analyses of soil samples collected from Sites 1 and 2 revealed that the soils in the vadose zone beneath the drainfield trenches contained between 67 and 86% sand, 4 and 13% silt, and 10 and 20% clay (Table 2) and thus were consistent with ranges reported for Autryville soil series [30]. While soil samples were not collected at Sites 3–5, soil properties for all sites were alike. More specifically, the mean hydraulic conductivity rates in the unsaturated zone for Site 1 (2.3 m day−1), Site 2 (1.0 m day−1), Site 3 (2.8 m day−1), Site 4 (0.6 m day−1), and Site 5 (3.9 m day−1) were relatively similar and within the range of subsoil permeability rates listed for the Autryville series (0.4 to > 3.6 m day−1). Slug tests conducted at the sites showed that the mean hydraulic conductivity of the surficial aquifer beneath the OWS at Sites 1–5 were also relatively similar and ranged from 1.1 m day−1 at Site 5 to 7.8 m day−1 at Site 3 (Table 2). While differences were observed between sites regarding permeability and hydraulic conductivity rates, the differences were relatively minor considering some reports show 3 or more orders of magnitude variability in conductive properties of aquifer material with the same texture [32]. The mean hydraulic gradients were between 0.007 at Site 5 to 0.023 at Site 4 (Table 2). Groundwater flow direction was predominantly northeast at Site 1 and Site 2 based on the spread of the bromide tracer and 3-pt contouring results (Figure 2 and Figure 3). The tracer traveled 38 m in an average of 155 days at Site 1 (0.25 m day−1), and 38 m in an average of 140 days at Site 2 (0.27 m day−1) (Table 2). Groundwater velocities at Sites 3, 4, and 5 were estimated using the effective porosity value (0.25) that was back-calculated at Sites 1 and 2 where the hydraulic conductivity, hydraulic gradient, and velocity were known. Groundwater velocities at the Sites were between 0.03 m day−1 at Site 5 and 0.66 m day−1 at Site 4 (Table 2). The groundwater velocities observed at the sites in this study were similar to the mean groundwater velocity (0.27 m day−1) reported by Harman et al. [31] for a sandy aquifer in Ontario Canada that received OWS effluent.
Based on piezometers that tested positive for bromide, the wastewater impacted groundwater plume discharging into Hoods Creek at Site 1 was approximately 2.4 m thick, 13.7 m wide, and 38 m long. (Table 1). For Site 2, the wastewater impacted groundwater plume dimensions were 2.1 m thick, 22.9 m wide, and 38 m long. The plume widths for Sites 1 (13.7 m) and 2 (22.9 m) were similar to the length of the drainfield trenches at those sites (Site 1: 15 m; Site 2: 24 m), suggesting the flow direction during the study period was consistent. The flow direction at both sites was almost perpendicular to the orientation of the drainfield trenches. Had the plume width been much greater relative to the trench lengths, then that would suggest the groundwater flow direction shifts over time. The relatively consistent direction of groundwater flow at the sites may be related to the close proximity (<45 m) of the OWS drainfield trenches to Hoods Creek, a perennial stream.

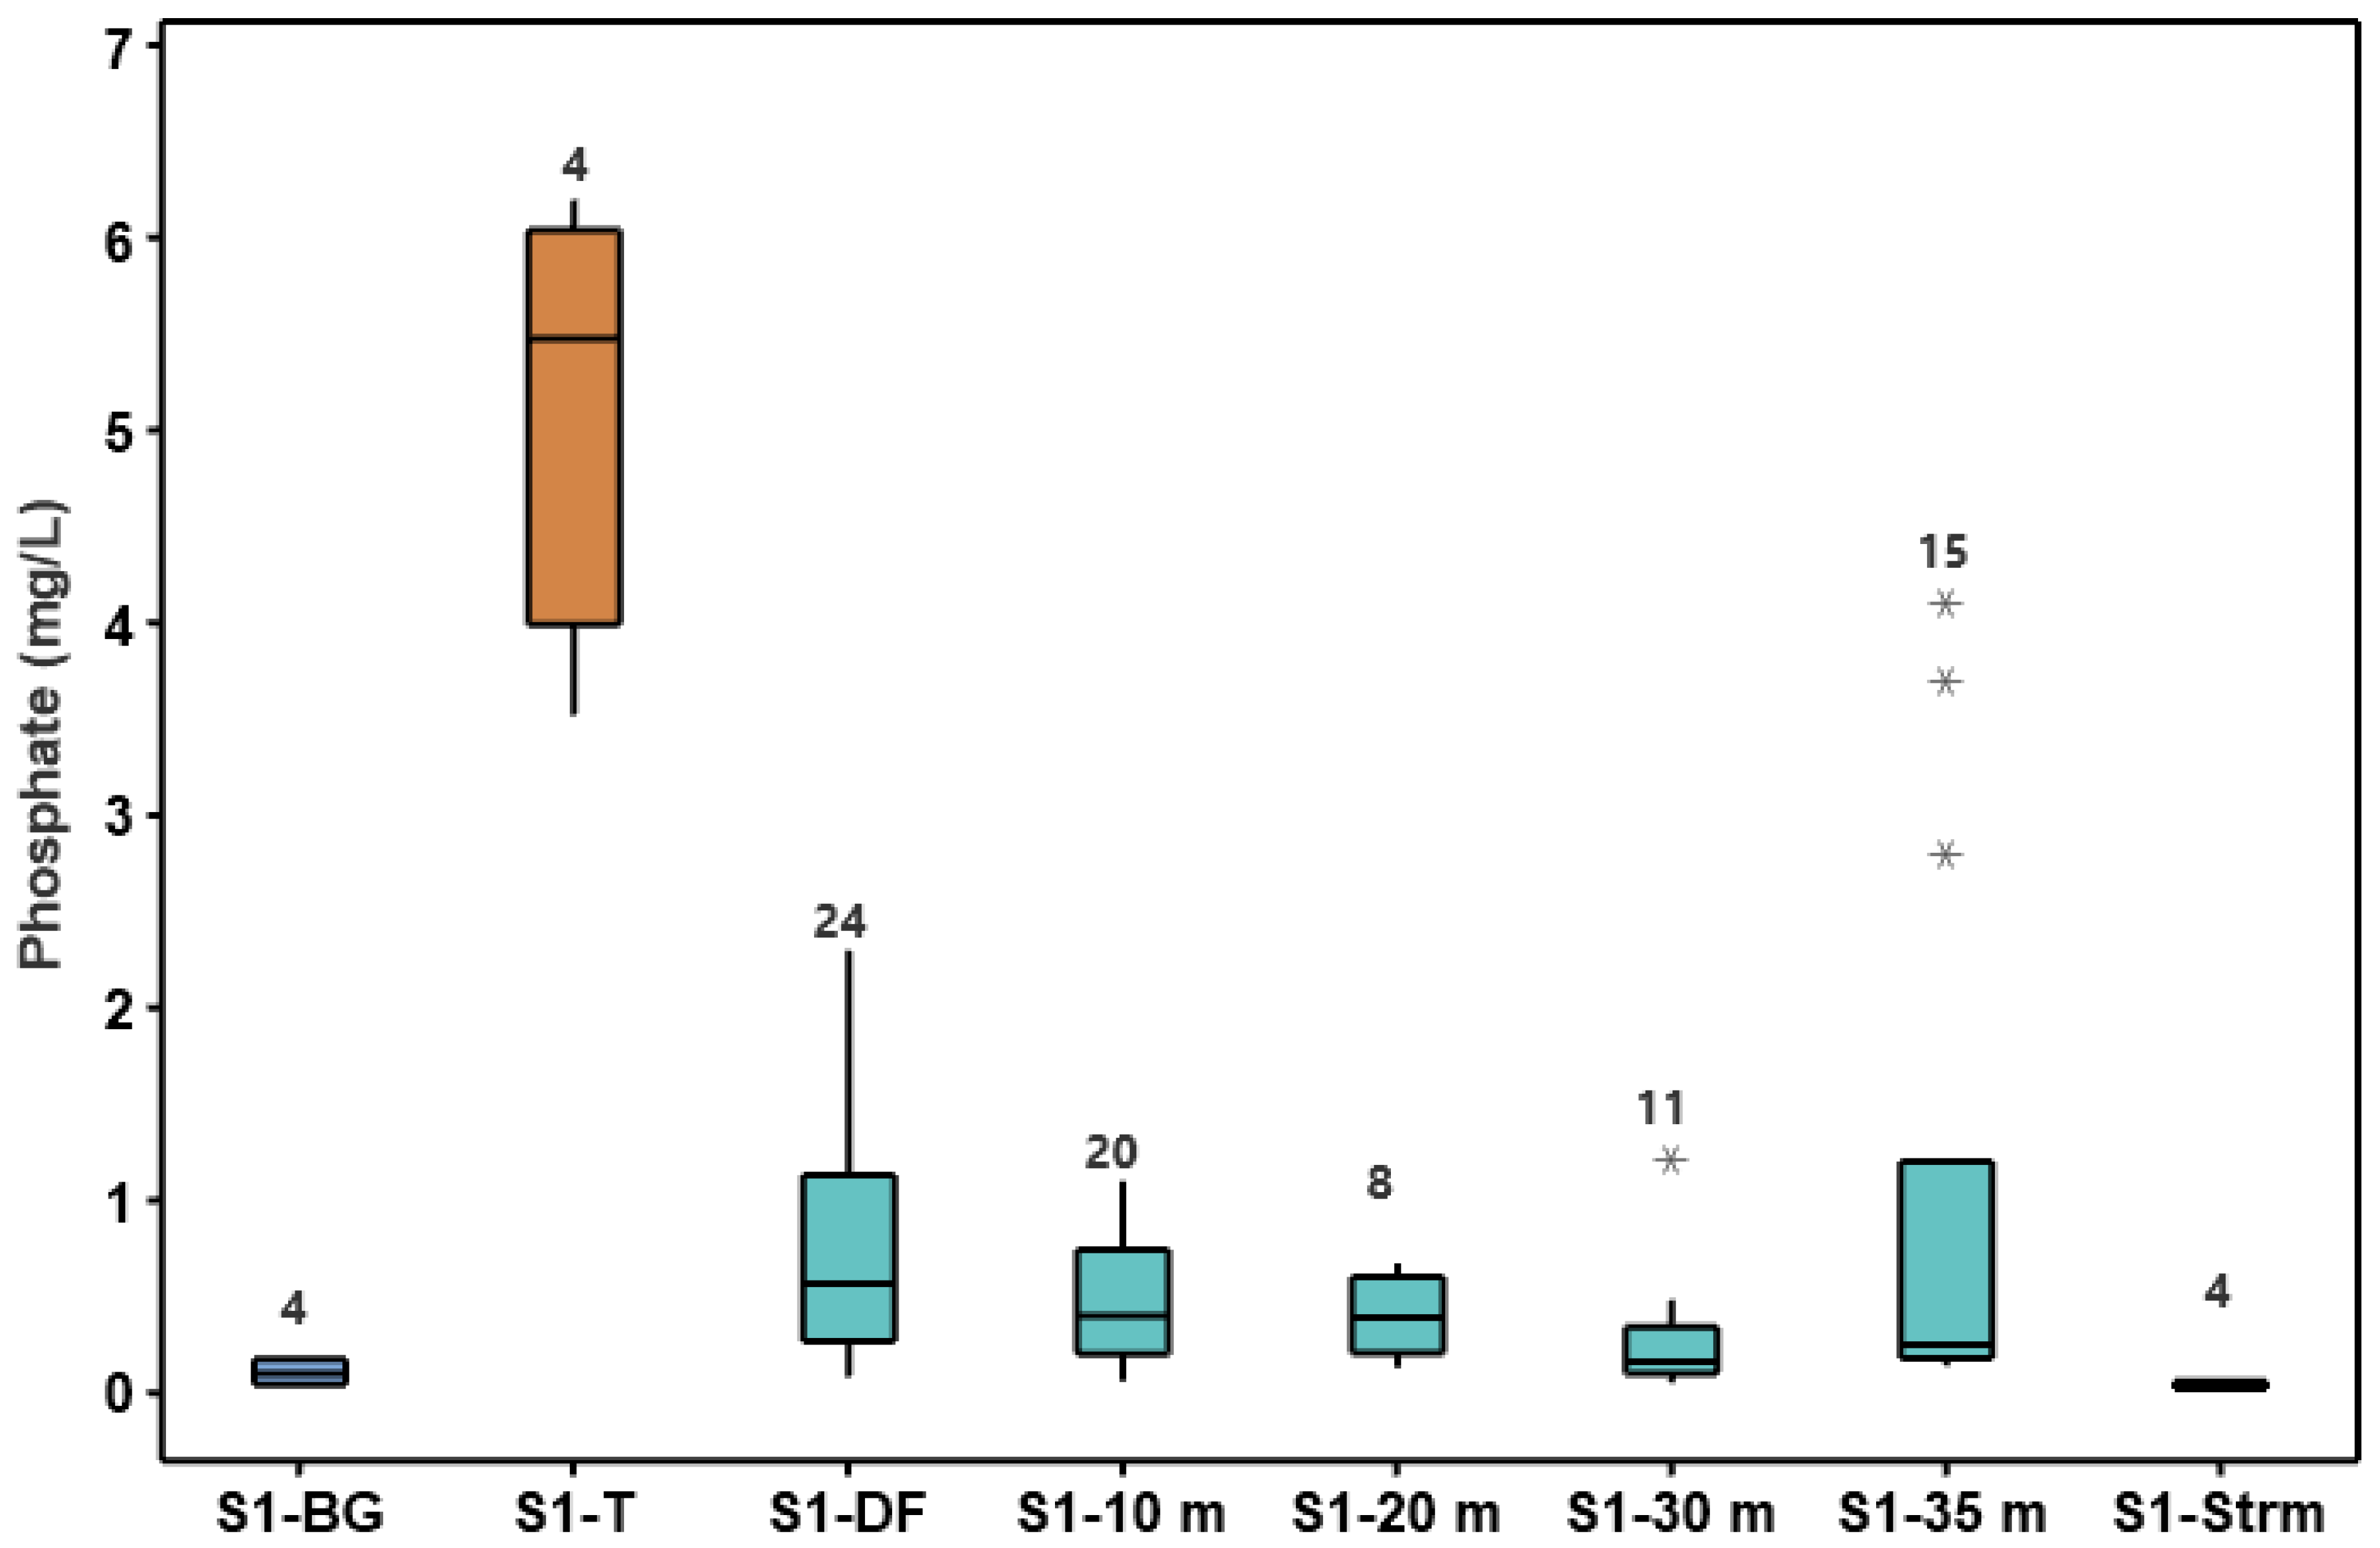
3.2. Phosphorus Treatment Efficiency by Onsite Wastewater Systems

Median concentrations of P in wastewater sampled from the septic tanks ranged from 4.70 mg L−1 at Site 5 to 7.80 mg L−1 at Site 3 (Figure 5) and were within the range of concentrations for domestic wastewater reported in a recent review of literature by Lusk et al. [18]. Mass loading of P from septic tanks to soil was estimated based on water use/wastewater discharge and median concentrations of P in septic tank effluent. The median daily mass of P discharged to the soil from the OWS were 5.1, 8.5, 4.6, 3.2, and 3.8 g day−1 for Sites 1 to 5, respectively. On an annual basis, these equate to between 1.2 kg (Site 4) and 3.1 kg (Site 2) of P discharged to soil from the OWS. Median concentrations of P in groundwater adjacent to the drainfield trenches of the OWS ranged from 0.04 mg L−1 at Site 5 to 1.20 mg L−1 at Site 4, thus each OWS was effective at lowering the concentration of P prior to effluent percolation into groundwater (Figure 5). More specifically, treatment efficiencies of P by the OWS were greatest at Site 5 (99.1%), followed by Site 2 (97.6%), Site 3 (91.1%), Site 1 (89.6%), and Site 4 (79.7%). Median concentrations of P in wastewater were significantly greater relative to groundwater at Site 1 (p = 0.002), Site 2 (p = 0.001), Site 3 (p < 0.001), Site 4 (p = 0.001), and Site 5 (p < 0.001). While all the OWS were efficient at P removal, groundwater near most of the OWS had P concentrations that exceeded the background groundwater concentrations (Figure 5), and thus the OWS were influencing groundwater quality. The median concentration of P in background groundwater ranged from 0.05 mg L−1 at Site 2 to 0.10 mg L−1 at Site 1 (Figure 5, Figure 6 and Figure 7). Concentrations of P in groundwater near the OWS were significantly (p < 0.05) greater relative to background groundwater concentrations at all sites except Site 5 (p = 0.789).
Concentrations of P in groundwater near the drainfields of the intensively monitored Sites 1 and 2 were variable, ranging from 0.08 to 2.3 mg L−1 at Site 1 and from 0.05 to 3.5 mg L−1 at Site 2 (Figure 6 and Figure 7). There was also variability in P concentrations in groundwater downgradient from the drainfields at those sites and near the creek. For example, concentrations of P in groundwater 35 m and 37 m downgradient from the OWS drainfields were between 0.14 and 4.1 mg L−1 at Site 1 (Figure 6) and between 0.08 and 1.5 mg L−1 at Site 2 (Figure 7), respectively. Median concentrations of P in groundwater near the drainfields at Sites 1 and 2 (0.15 to 0.57 mg L−1) were similar to concentrations farther downgradient (35–37 m) at these sites (0.25 to 0.31 mg L−1). Overall, differences in concentrations of P in groundwater downgradient from the OWS and near the OWS were not statistically significant (p = 0.506), indicating that most P treatment occurred in the vadose zone beneath the OWS drainfield trenches. Pooling the water quality data, concentrations of P in groundwater more than 35 m downgradient from the OWS were significantly higher (p < 0.001) relative to background groundwater and P concentrations in Hoods Creek (p < 0.001) (Supplementary Materials). Thus, P that reached groundwater beneath the OWS drainfield trenches was mobile, and plumes of P enriched groundwater extended more than 35 m and discharged to Hoods Creek. Prior studies in Florida [24], North Carolina [12,14], and Ontario Canada [31,33,34] have also shown that wastewater impacted groundwater plumes can extend more than 20 m downgradient from OWS in sandy environments. The OWS at Sites 1 and 2 were in use for 12 years at the start of the study period. Based on groundwater velocities at the sites measured via the bromide tracer, wastewater constituents that infiltrated into groundwater near the sites would reach the piezometers near the creek 38 m away within 155 days at both sites if the constituents traveled at the same velocity as the groundwater. However, prior research [31,34,35] has shown that P plumes typically advance slower than groundwater because of sorption and mineral precipitation reactions that retard the migration of P. Retardation factors of 20 and 100 have been reported for OWS derived P plumes in sandy regions, thus some plumes move much slower relative to groundwater [31,34]. Because elevated P concentrations were observed in groundwater >35 m downgradient from the OWS drainfields at Sites 1 and 2, the P plume reached those piezometers sometime within the prior 12 years of operation. Thus, retardation factors had to be less than 28 for Site 1 (4380 days/155 days) and 31 for Site 2 (4380 days/141 days).

3.3. Phosphorus Treatment by Adsorption

The most efficient OWS for lowering the concentrations of P was at Site 5 (99.1%), followed by Site 2 (97.6%). Both of these OWS had newly installed (1 year old) drainfield trenches (Table 1). Site 5 was a new construction home with new OWS. The home and initial OWS at Site 2 were constructed 12 years prior to the start of this study, but a replacement drainfield was recently (1 year) constructed due to a hydraulic malfunction (surfacing effluent) of the original drainfield. The relatively high P treatment efficiency of these new systems may be due in part to the availability of unoccupied sorption sites on the soil grains beneath the new drainfield trenches which can bind P and thus prevent migration of P to groundwater. Prior research has suggested that the sorption capacity of soils is influenced by factors such as particle size distribution and reactive surface area of soils beneath the drainfield [12,19,20,35]. The soils at each of the five sites were mapped as Autryville soil series and hydraulic conductivity values were alike (Table 2). The Autryville soil series has yellowish brown (10YR 6/4) to yellow (10YR 6/6) subsoil indicative of iron oxide coatings on the soil grains [14,30,36]. The subsoil of Autryville series is sand to sandy clay loam, acidic [30], and the pH is below the point of zero charge for most Fe and Al based minerals (pH of 7.2), thus a positive surface charge would enable sorption of P anions [18,35]. Many soils have been shown to have significant P sorption capacity, however, once the sorption sites are filled then leaching of P may occur [18,20]. Thus, the sorption capacity of soils beneath the drainfield trenches of older systems such as at Sites 1, 3, and 4 may have been exceeded after several years of wastewater application, resulting in less efficient treatment relative to the newer drainfields with available sorption capacity in soils beneath the trenches.

3.4. Soil Texture and Phosphorus Treatment

While both the OWS were efficient at the intensively monitored Sites 1 (89.6%) and 2 (97.6%), the difference in treatment may have been influenced by the higher clay content and lower infiltration rate of wastewater in the subsoil at Site 2 relative to Site 1. Lower infiltration rates cause increased residence time of wastewater in the vadose zone, allowing more opportunity for treatment (Table 2). Prior studies have shown that OWS in soils with higher surface area (e.g., higher clay content), and with coatings of iron oxides are more effective at reducing the transport of P relative to OWS in sandy soils that lack iron coatings, due to the increased potential for sorption and longer residence times of wastewater in the soil. For example, in a study of 16 OWS in three different soil textural groups in coastal North Carolina, Humphrey et al. [36] reported the greatest mean phosphorus treatment efficiency (98.8%) for four OWS in soils with the highest clay content (24%), and the poorest mean treatment efficiency (56.6%) for OWS in sandy soils with the lowest clay content (3%). They noted that the least efficient OWS were in sandy, hydraulically conductive (mean rate = 13.9 cm hr−1) soils that had low chroma, and gray colors that lacked iron coatings. The most efficient OWS were in soils with higher clay content, lower mean hydraulic conductivities (0.79 cm hr−1), and higher chroma, yellow and brown colored subsoil indicative of oxidized iron coatings. A different study [12] of four OWS in eastern North Carolina also revealed that the most efficient system for reducing P transport (99%) was in a soil with the highest clay content (35%) and lowest hydraulic conductivity (0.13 m day−1), while the least efficient system (73%) had the lowest clay content (25%) and highest hydraulic conductivity (0.41 m day−1). These studies indicate that treatment efficiencies of OWS are variable, and small differences in clay content hydraulic conductivity along with the presence or absence of iron coatings on soil grains may be important factors that influence P treatment and mobility.

3.5. Wastewater Loading and Phosphorus Treatment

The age of the systems, wastewater strength, water use/wastewater generation, and drainfield trench areas were variable between the systems and thus loading of P to soil and availability of sorption sites were also variable (Table 3). Sites 5 and 2 had the lowest estimated cumulative P loading from the septic tanks to the soil beneath their new drainfields at 1.37 kg and 3.11 kg, respectively, and the lowest estimated P loading rates to trenches at 0.03 kg m−2 and 0.07 kg m−2, respectively (Table 4). The cumulative P loading to soil was nearly an order of magnitude lower for OWS at Sites 5 and 2 relative to the others. Since the OWS at Sites 2 and 5 were in use for only a few years, the sorption sites on soil particles beneath the drainfield trenches may not have been completely filled resulting in better P removal for those OWS. Prior research has suggested that P sorption in soil receiving effluent from OWS may decrease over time and thus treatment may also decrease. For example, Gill et al. [20] observed a noticeable increase in P concentrations in soil water 60 cm beneath the drainfield of an OWS toward the end of a 32-month study period. While the efficiency of the OWS was still high, Gill et al. [20] speculated that the decline in treatment for that soil may have been related to reduced sorption processes. Mechtensimer and Toor [37] evaluated the fate and transport of phosphorus in sandy soil typical of OWS drainfields in Florida, USA. They reported less than 1% of phosphorus leached from the soil but estimated that 18% of the phosphorus sorption capacity was saturated after 1 year. They concluded that in less than 7 years, phosphorus leaching may be significant. The OWS at Sites 1, 3, and 4 of the current study were all more than 7 years of age and had lower P treatment efficiencies than the newer OWS at Sites 2 and 5, possibly because sorption sites for P were occupied due to higher P loading rates and longer use at those locations.

3.6. Phosphorus Treatment by Mineral Precipitation

While the treatment efficiency of the newer OWS at Sites 2 and 5 exceeded the efficiencies of the older OWS at Sites 1, 3, and 4, possibly due to active sorption processes, all systems were effective at lowering P concentrations by more than 79% relative to concentrations in wastewater. Therefore, other mechanisms for P treatment such as mineral precipitation must have been the dominant P removal process responsible for the reductions in the soil beneath the drainfield trenches. Harman et al. [31] reported in a study of a 44-year-old OWS in sandy soil in Langton, Canada, that P concentrations in groundwater beneath the system had reached a “steady state” because of mineral precipitation reactions, and reductions in the concentration of P by about 83% were observed. In a recent review of phosphorus mobility from 24 OWS in Ontario Canada, Robertson et al. [38] reported zones of phosphorus accumulation were present in almost all the drainfields where sand grains had distinct secondary coatings of phosphorus, suggesting mineral precipitation was a dominant process. These studies provide evidence that mineral precipitation reactions can greatly influence the phosphorus treatment efficiency of OWS if the environmental conditions in the subsoil are conducive to those processes. Mineral precipitation is influenced by pH, redox potential, and availability of Fe, Al, Ca, and PO4¯ [35,38]. Groundwater near the drainfield trenches at each of the sites of the current study can be characterized as slightly acidic, with mean pH values between 5.4 at Site 5 to 6.4 at Site 1 (Table 4). Mean oxidation–reduction potentials of groundwater near the drainfield trenches were between 90.3 at Site 1 to 262.3 at Site 5, and thus were indicative of suboxic to anoxic conditions [35] (Table 4). Based on mean pH and oxidation–reduction potential conditions in groundwater beneath the drainfield trenches, precipitation of the mineral vivianite (Fe3(PO4)2·8H2O) and/or variscite (AlPO4·2H2O) may have been P removal mechanisms if Fe and Al were also available with P to form the minerals in the vadose zone [31,33,34,35]. The mean pH of groundwater at Site 1 dropped about 1.2 units along the 35 m flow path from the OWS drainfield (6.4) towards the creek (5.2), while the redox potential increased from 96 to 135 (Table 4). In contrast, the mean pH at Site 2 increased by about 0.9 units, while the mean redox potential decreased by 178 as groundwater approached the creek (Table 4). While there were contrasting changes in pH and redox potential along the groundwater flow paths at the two sites, based on the environmental conditions (e.g., pH, redox potential) in groundwater, vivianite would be the expected phosphorus-based mineral that could precipitate [35]. However, precipitation of vivianite also requires Fe to combine with P. It is possible that sufficient Fe was not available in the groundwater, thereby limiting vivianite formation and further treatment of P along the flow path towards Hoods Creek. Precipitation reactions were likely active in the vadose zone beneath the OWS at Sites 1–5, providing for the >79% reduction in P concentration relative to wastewater, but those reactions may have been limited in groundwater.

3.7. Physical and Chemical Properties of Groundwater

The mean electrical conductivity (EC) of groundwater near the OWS drainfield trenches (194.3 to 560.5 µs cm−1) was elevated relative to groundwater in background wells (127.0 to 203.5 µs cm−1) sampled at each of the sites (Table 4). Because wastewater has high concentrations of dissolved ions relative to most shallow groundwater, the electrical conductance of wastewater and wastewater impacted groundwater is typically higher than groundwater not influenced by wastewater. Several groundwater monitoring studies conducted near OWS have reported using EC as an indicator of wastewater influence [14,34,39,40,41,42]. These data in addition to the bromide tracer at Sites 1 and 2 provide confidence that groundwater influenced by the OWS was being sampled. Mean groundwater temperatures near the drainfields at the sites were typically between 17 and 22 °C and groundwater downgradient from the OWS was also within this range (Table 4). The highest standard deviation of temperatures was noted in sampling locations farthest from the drainfields at Site 1 (5.0 °C) and Site 2 (4.8 °C) (Table 4), possibly because these groundwater sampling locations were closer to the soil surface and more influenced by changes in air temperature.

4. Conclusions

The goal of the study was to gain a better understanding of the P treatment efficiency of five OWS installed in a nutrient-sensitive watershed in coastal North Carolina. Results from this study indicate that P treatment by OWS in coastal sandy soils is largely dependent upon the conditions in the vadose zone beneath the drainfield trenches that influence adsorption and mineral precipitation reactions. Reductions in P concentrations between 79 and 99% for the five OWS were observed; thus each system was efficient. The most efficient OWS were the ones with the newest drainfield trenches, possibly because the adsorption capacity of the soil beneath those OWS had not yet been exceeded. The addition of bromide as a chemical tracer at the two intensively instrumented sites enabled the delineation of the wastewater impacted groundwater plumes and provided groundwater velocity and flow direction data. While the OWS were all effective, concentrations of P in groundwater near the drainfield trenches (<2 m) and more than 35 m downgradient from the intensively monitored OWS were alike and significantly elevated relative to background groundwater conditions. Therefore, once infiltrating wastewater reached the water table beneath the OWS trenches, additional P removal via adsorption or precipitation along the groundwater flow path towards Hoods Creek could not be confirmed, possibly due to insufficient Fe bind with P.
Wastewater discharged to the subsurface from the monitored OWS was a source of P loading to Hoods Creek and the Neuse River. The contributions of P from OWS to surface waters should be considered in watershed-scale nutrient management strategies, especially for water bodies that experience eutrophic conditions. Remediation efforts possibly including the implementation of retrofit permeable reactive barriers to reduce the transport of P from OWS with established plumes may help reduce the loading of P to surface waters [43], but more field-based research is needed to evaluate the real-world success of these practices. In addition, for new system installations in nutrient sensitve watershed, incorporation of iron rich material, such as furnace slag or zero valent iron [44], into soil media beneath the trenches should also be investigated as a method to improve treatment. As OWS will continue to be utilized for wastewater treatment in rural areas, it is important that we have a thorough understanding of their effectiveness in reducing pollutants of environmental and public health concern and research new methods to enhance their efficiency.

Supplementary Materials

The following supporting information can be downloaded at: https://www.mdpi.com/article/10.3390/earth3020039/s1, Figure S1: Figure showing multi-depth piezometers and fully screened wells; Figure S2: Figure showing pooled data from all sites including background wells (BG), tanks (T), drainfield piezometers (DF), piezometer 10 m down-gradient from the systems (10 m), piezometers 20 m down-gradient from the systems (20 m), piezometers 35 m down-gradient from the systems (35 m), and the stream samples (Strm).

Funding

This research was funded by the NC Department of Environmental Quality 319 Grant Program.

Data Availability Statement

Data are summarized and displayed in figures. Raw data may be made available via email with the corresponding author.

Acknowledgments

The author sincerely thanks the students, colleagues and faculty that contributed to this product, Craven County Environmental Health, and the NC DEQ 319 Program for their support during the design, implementation, and/or analyses of data during this study.

Conflicts of Interest

The author declares no conflict of interest.

References

  1. Schindler, D.W.; Carpenter, S.R.; Chapra, S.C.; Hecky, R.E.; Orihel, D.M. Reducing Phosphorus to Curb Lake Eutrophication is a Success. Environ. Sci. Technol. 2016, 50, 8923–8929. [Google Scholar] [CrossRef]
  2. Paerl, H.W. Controlling Eutrophication along the Freshwater-Marine Continuum: Dual Nutrient (N and P) Reductions are Essential. Estuaries Coasts 2009, 32, 593–601. [Google Scholar] [CrossRef] [Green Version]
  3. Conley, D.J.; Paerl, H.W.; Howarth, R.W.; Boesch, D.F.; Seitzinger, S.P.; Havens, K.E.; Lancelot, C.; Likens, G.E. Ecology: Controlling Eutrophication: Nitrogen and Phosphorus. Science 2009, 323, 1014–1015. [Google Scholar] [CrossRef]
  4. Brooks, B.W.; Lazorchak, J.M.; Howard, M.D.; Johnson, M.-V.V.; Morton, S.L.; Perkins, D.A.; Reavie, E.D.; Scott, G.I.; Smith, S.A.; Steevens, J. Are Harmful Algal Blooms Becoming the Greatest Inland Water Quality Threat to Public Health and Aquatic Ecosystems? Environ. Toxicol. Chem. 2016, 35, 6–13. [Google Scholar] [CrossRef]
  5. Havlin, J.L.; Tisdale, S.L.; Nelson, W.L.; Beaton, J.D. Soil Fertility and Fertilizers, 6th ed.; Prentice Hall: Upper Saddle River, NJ, USA, 1999; pp. 86–153. [Google Scholar]
  6. North Carolina Department of Environmental Quality. Neuse River Nutrient Strategy. 2022. Available online: https://deq.nc.gov/about/divisions/water-resources/planning/nonpoint-source-management/nutrient-strategies/neuse (accessed on 3 March 2022).
  7. Hoffman, F.A.; Bishop, J.W. Impacts of Phosphate Detergent Ban on Concentrations of Phosphorus in the James River, Virginia. Wat. Res. 1995, 29, 1425–1426. [Google Scholar] [CrossRef]
  8. Schellenger, F.L.; Hellweger, F.L. Phosphorus Loading from Onsite Wastewater Systems to a Lake (At Long Time Scales). Lake Reserv. Manag. 2019, 35, 90–101. [Google Scholar] [CrossRef]
  9. Lebo, M.E.; Paerl, H.W.; Peierls, B.L. Evaluation of Progress in Achieving TMDL Mandated Nitrogen Reductions in the Neuse River Basin, North Carolina. Environ. Manag. 2012, 49, 253–266. [Google Scholar] [CrossRef] [PubMed]
  10. Lusk, M.; Toor, G.S.; Obreza, T. Onsite Sewage Treatment and Disposal Systems: Phosphorus. Florida Cooperative Extension Service SL349. Available online: https://edis.ifas.ufl.edu/publication/SS551 (accessed on 6 March 2022).
  11. Bowes, M.J.; Gozzard, E.; Johnson, A.C.; Scarlett, P.M.; Roberts, C.; Read, D.S.; Armstrong, L.K.; Harman, S.A.; Wickman, H.D. Spatial and Temporal Changes in Chlorophyll-a Concentrations in the River Thames Basin, UK: Are Phosphorus Concentrations Beginning to Limit Phytoplankton Biomass? Sci. Total Environ. 2012, 426, 45–55. [Google Scholar] [CrossRef] [PubMed] [Green Version]
  12. Humphrey, C.P.; Anderson-Evans, E.; O’Driscoll, M.; Manda, A.; Iverson, G. Comparison of Phosphorus Concentrations in Coastal Plain Watersheds Served by Onsite Wastewater Treatment Systems and a Municipal Sewer Treatment System. Water Air Soil Pollut. 2015, 226, 2259. [Google Scholar] [CrossRef]
  13. Iverson, G.; O’Driscoll, M.; Humphrey Jr, C.; Manda, A.; Anderson-Evans, E. Wastewater Nitrogen Contributions to Coastal Plain Watersheds, NC, USA. Water Air Soil Pollut. 2015, 226, 325. [Google Scholar] [CrossRef]
  14. Humphrey, C.P.; O’Driscoll, M.A.; Deal, N.; Lindbo, D. Fate and Transport of Phosphate from an On-Site Wastewater System in Beaufort County, North Carolina. J. Environ. Health 2014, 76, 28–33. [Google Scholar] [PubMed]
  15. US EPA. Onsite Wastewater Treatment Systems Manual. 2002. Available online: https://www.epa.gov/sites/production/files/2015-06/documents/2004_07_07_septics_septic_2002_osdm_all.pdf (accessed on 6 March 2022).
  16. Iverson, G.; Humphrey, C.P., Jr.; O’Driscoll, M.; Jernigan, J.; Serozi, B.; Sanderford, C. Quantifying Total Phosphorus and Heavy Metals in Residential Septage. Appl. Sci. 2022, 12, 3336. [Google Scholar] [CrossRef]
  17. Robertson, W.D.; Blowes, D.W. Major Ion and Trace Metal Geochemistry of an Acidic Septic-System Plume in Silt. Ground Water 1995, 33, 275–283. [Google Scholar] [CrossRef]
  18. Lusk, M.G.; Toor, G.S.; Yang, Y.-Y.; Mechtensimer, S.; De, M.; Obreza, T.A. A Review of the Fate and Transport of Nitrogen, Phosphorus, Pathogens, and Trace Organic Chemicals in Septic Systems. Crit. Rev. Environ. Sci. Technol. 2017, 47, 455–541. [Google Scholar] [CrossRef]
  19. Karathanasis, A.D.; Mueller, T.G.; Boone, B.; Thompson, Y.L. Nutrient Removal from Septic Effluents as Affected by Soil Thickness and Texture. J. Water Health 2006, 4, 177–195. [Google Scholar] [CrossRef] [PubMed] [Green Version]
  20. Gill, L.; O’Luanaigh, N.; Johnston, P.; Misstear, B.; O’Suilleabhain, C. Nutrient Loading on Subsoils from On-Site Wastewater Effluent, Comparing Septic Tank and Secondary Treatment Systems. Water Res. 2009, 43, 2739–2749. [Google Scholar] [CrossRef]
  21. Zanini, L.; Robertson, W.D.; Ptacek, C.J.; Schiff, S.L.; Mayer, T. Phosphorus Characterization in Sediments Impacted by Septic Effluent at Four Sites in Central Canada. J. Contam. Hydrol. 1998, 33, 405–429. [Google Scholar] [CrossRef]
  22. Reay, W.G. Septic Tank Impacts on Groundwater Quality and Nearshore Sediment Nutrient Flux. Groundwater 2004, 42, 1079–1089. [Google Scholar] [CrossRef]
  23. Humphrey, C.; Serozi, B.; Iverson, G.; Jernigan, J.; Pradhan, S.; O’Driscoll, M.; Bean, E. Phosphate Treatment by Onsite Wastewater Systems in Nutrient-Sensitive Watersheds of North Carolina’s Piedmont. Water Sci. Technol. 2016, 74, 1527–1538. [Google Scholar] [CrossRef]
  24. Corbett, D.R.; Dillon, K.; Burnett, W.; Schaefer, G. The Spatial Variability of Nitrogen and Phosphorus Concentration in a Sand Aquifer Influenced by Onsite Sewage Treatment and Disposal Systems: A Case Study on St. George Island, Florida. Environ. Pollut. 2002, 117, 337–345. [Google Scholar] [CrossRef]
  25. Daniels, R.B.; Buol, S.W.; Kleiss, H.J.; Ditzler, C.A. Soil Systems in North Carolina. Technical Bulletin 314; North Carolina State University, Soil Science Department: Raleigh, NC, USA, 1999; pp. 1–6. [Google Scholar]
  26. United States Geologic Survey StreamStats. Available online: https://streamstats.usgs.gov/ss/ (accessed on 16 February 2022).
  27. United States Climate Data. New Bern, North Carolina. Available online: https://www.usclimatedata.com/climate/new-bern/north-carolina/united-states/usnc0484 (accessed on 15 February 2022).
  28. Winner, M.D.; Coble, R.W. Hydrogeologic Framework of the North Carolina Coastal Plain. U.S. Geological Survey Professional Paper 1404-1; United States Government Printing Office: Washington, DC, USA, 1996. [Google Scholar]
  29. Domenico, P.A.; Schwartz, W. Physical and Chemical Hydrogeology, 2nd ed.; Wiley: New York, NY, USA, 1998; pp. 36–115. [Google Scholar]
  30. United States Department of Agriculture, Natural Resources Conservation Service. Web Soil Survey. Available online: https://websoilsurvey.sc.egov.usda.gov/App/HomePage.htm (accessed on 14 February 2022).
  31. Harman, J.; Robertson, W.D.; Cherry, J.A.; Zanini, L. Impacts on a Sand Aquifer from an Old Septic System: Nitrate and Phosphate. Ground Water 1996, 34, 1105–1114. [Google Scholar] [CrossRef]
  32. USGS 1998 Basic Groundwater Hydrology. Water-Supply Paper 2220. Available online: https://doi.org/10.3133/wsp2220 (accessed on 14 February 2022).
  33. Robertson, W.D. Development of Steady-State Phosphate Concentrations in Septic System Plumes. J. Contam. Hydrol. 1995, 19, 289–305. [Google Scholar] [CrossRef]
  34. Robertson, W.D.; Schiff, S.L.; Ptacek, C.J. Review of Phosphate Mobility and Persistence in 10 Septic System Plumes. Groundwater 1998, 3, 1000–1010. [Google Scholar] [CrossRef]
  35. Lombardo, P. Phosphorus Geochemistry in Septic Tanks, Soil Absorption Systems, and Groundwater; Lombardo Associates, Inc.: Newton, MA, USA, 2006. [Google Scholar]
  36. Humphrey, C.P.; O’Driscoll, M.A. Biogeochemistry of Groundwater beneath Onsite Wastewater Systems in a Coastal Watershed. Univer. J. Environ. Res. Technol. 2011, 1, 320–328. [Google Scholar]
  37. Mechtensimer, S.; Toor, G.S. Fate, Mass Balance, and Transport of Phosphorus in the Septic System Drainfields. Chemosphere 2016, 159, 153–158. [Google Scholar] [CrossRef]
  38. Robertson, W.D.; Van Stempvoort, D.R.; Schiff, S.L. Review of Phosphorus Attenuation in Groundwater Plumes from 24 Septic Systems. Sci. Total Environ. 2019, 692, 640–652. [Google Scholar] [CrossRef]
  39. O’Driscoll, M.A.; Humphrey, C.P.; Deal, N.E.; Lindbo, D.L.; Zarate-Bermudez, M.A. Meteorological Influences on Nitrogen Dynamics of a Coastal Onsite Wastewater Treatment System. J. Environ. Qual. 2014, 43, 1873–1885. [Google Scholar] [CrossRef] [Green Version]
  40. Humphrey, C.; Iverson, G.; O’Driscoll, M. Nitrogen Treatment Efficiency of a Large Onsite Wastewater System in Relation to Water Table Dynamics. CLEAN Soil Air Water 2017, 45, 1700551. [Google Scholar] [CrossRef]
  41. Geary, P. Effluent Tracing and the Transport of Contaminants from a Domestic Septic System. Water Sci. Technol. 2005, 51, 283–290. [Google Scholar] [CrossRef]
  42. Humphrey, C.P., Jr.; O’Driscoll, M.; Iverson, G. Comparison of Nitrogen Treatment by Four Onsite Wastewater Systems in Nutrient-Sensitive Watersheds of the North Carolina Coastal Plain. Nitrogen 2021, 2, 268–286. [Google Scholar] [CrossRef]
  43. Buyanjargal, A.; Kang, J.; Sleep, B.E.; Jeen, S.W. Sequential Treatment of Nitrate and Phosphate in Groundwater Using a Permeable Reactive Barrier System. J. Environ. Manag. 2021, 300, 113699. [Google Scholar] [CrossRef] [PubMed]
  44. Maamoun, I.; Eljamal, O.; Khalil, A.M.; Sugihara, Y.; Matsunaga, N. Phosphate Removal through Nano-Zero-Valent Iron Permeable Reactive Barrier; Column Experiment and Reactive Solute Transport Modeling. Transp. Porous Media 2018, 125, 395–412. [Google Scholar] [CrossRef]
Figure 1. Study sites were located in the Hoods Creek watershed within Craven County, NC. Hoods Creek is a tributary of the Neuse River and thus within the Neuse River drainage basin. Sites 1–5 are shown as triangles in the right panel.
Earth 03 00039 g001
Figure 2. Groundwater monitoring infrastructure at Site 1, including wells and nests of piezometers between the drainfield and creek. Bromide tracer was in the groundwater at piezometer nests including 3–9, 12, 16, 17, and well C.
Earth 03 00039 g002
Figure 3. Groundwater monitoring infrastructure at Site 2, including wells and nests of piezometers between the drainfield and creek. Bromide tracer was in the groundwater sampled from piezometer nests including 6–9, 11–13, 15, 16, 18–21, and wells D and E.
Earth 03 00039 g003
Figure 4. Groundwater monitoring infrastructure at Sites 3–5, including nests of piezometers near the drainfields sampled for water quality (#1–3) and nests of piezometers away from the drainfields (#4–5) used to determine hydraulic gradients and groundwater flow direction. Samples at Sites 3 and 4 collected from piezometer nest number 1 were considered background samples based on flow direction and drainfield orientations at those properties. The background groundwater data from Sites 3 and 4 were pooled and also served as the background for Site 5.
Earth 03 00039 g004
Figure 5. Phosphate concentrations in wastewater sampled from the septic tanks (T), groundwater near the drainfield trenches (DF), and background groundwater (BG) at Sites 1–5. Vertical lines extending from the boxes show minimum and maximum values. Statistical outliers are shown as (*). Number of samples is shown above each box. Background groundwater data from Sites 3 and 4 were pooled and used as background groundwater for Sites 3–5, which are neighboring properties.
Earth 03 00039 g005
Figure 6. Phosphate concentrations in wastewater sampled from the septic tank (T), groundwater near the drainfield trenches (DF), groundwater 10 to 35 m downgradient from the trenches, in background groundwater (BG), and the adjacent stream at Site 1 (S1). Vertical lines extending from the boxes show minimum and maximum values. Statistical outliers are shown as (*). Number of samples is shown above each box.
Earth 03 00039 g006
Figure 7. Phosphate concentrations in wastewater sampled from the septic tank (T), groundwater near the drainfield trenches (DF), groundwater 10 to 37 m downgradient from the trenches, in background groundwater (BG), and the adjacent stream at Site 2 (S2). Vertical lines extending from the boxes show minimum and maximum values. Statistical outliers are shown as (*). Number of samples is shown above each box.
Earth 03 00039 g007
Table 1. Characteristics of onsite wastewater systems at each of the 5 study sites.
SiteTank Capacity (L)System Type, Trench MediaDrainfield Trenches Number, Length (m)System Age Start of StudyAvg. Water Usage
(L day−1)
13780 (2)Conventional, Gravel4, 15.212930
23780Conventional, Gravel3, 15.2; 2, 24.412, 11385
33780Conventional, Gravel3, 15.212590
43780Conventional, Gravel3, 15.27545
53780Conventional, Polystyrene3, 15.21798
Table 2. Characteristics of soil, aquifer material, and groundwater at Sites 1–5.
Site Vadose Zone Sand/Silt/Clay%Trench Infiltration Rate Ksat (m day−1)Hydraulic Gradient Slug Tests Ksat (m day−1)Groundwater Vel. (m day−1)
186/4/102.3 (1.3)0.010 (0.002)4.1 (2.4)0.25
267/13/201.0 (1.1)0.020 (0.003)3.8 (2.0)0.27
3 2.8 (4.3)0.019 (.002)7.8 (8.5)0.59 *
4 0.6 (0.7)0.023 (0.002)7.2 (5.8)0.66 *
5 3.9 (0.9)0.007 (0.004)1.1 (0.6)0.03 *
* Groundwater velocity for Sites 3–5 estimated using effective porosity values from Sites 1 and 2.
Table 3. Cumulative loading (kg) and loading rates (kg m−2) of PO4-P to soil at Sites 1–5.
SiteWastewater PO4-P (mg L−1)Flow Rate (L yr−1)System Age (Y)Cumulative Flow (L)Cumulative PO4-P Loading (kg)Trench Bottom Area (m2)PO4-P Loading to Trenches (kg m−2)
15.48339,450124,073,40022.32540.41
26.15505,5251505,5253.1143.7 *0.07
37.8215,350122,584,20020.1640.50.50
45.9198,92571,392,4758.2240.50.20
54.7291,2701291,2701.3740.50.03
* Replacement drainfield installed 1 year prior to start of the study.
Table 4. Mean and standard deviation of pH, oxidation–reduction potential (ORP), electrical conductivity (EC), and temperature for Site 1 (S1), Site 2 (S2), Site 3 (S3), Site 4 (S4), and Site 5 (S5). Samples were collected from groundwater downgradient (10 m, 20 m, 30 m, 35 m, 37 m) from the drainfields at S1 and S2 and in background locations not influenced by the systems.
Sampling LocationSamplespHORPEC (µs cm−1)Temp (°C)
S1-Background46.1 (0.3)293.5 (7.5)203.5 (30.0)18.4 (2.4)
S1-Drainfield246.4 (0.2)90.3 (101.5)560.5 (238.9)17.3 (3.6)
S1-10 m206.3 (0.3)143.2 (41.9)416.8 (149.5)17.3 (3.2)
S1-20 m86.3 (0.2)99.0 (124.5)410.0 (214.9)17.6 (3.4)
S1-30 m116.0 (0.4)95.5 (78.5)303.0 (171.6)16.4 (2.5)
S1-35 m155.2 (1.1)135.0 (62.3)238.0 (99.5)18.0 (5.0)
S2-Background115.3 (0.5)255.8 (73.6)185.8 (63.5)18.2 (2.1)
S2-Drainfield326.1 (0.3)221.4 (27.3)470.9 (242.7)18.6 (3.8)
S2-10 m315.7 (0.5)205.5 (54.8)304.8 (102.8)18.4 (3.6)
S2-20 m165.8 (0.3)178.3 (31.1)289.0 (60.5)17.9 (3.0)
S2-37 m327.0 (0.2)43.2 (64.0)401.4 (60.5)18.8 (4.8)
S3-Drainfield186.6 (0.2)136.3 (28.9)438.5 (199.1)22.2 (3.5)
S4-Drainfield195.6 (0.2)183.5 (45.4)194.3 (93.1)17.6 (3.7)
S5-Drainfield195.4 (0.5)262.3 (48.2)269.5 (122.6)17.7 (3.4)
S3-5 Background85.7 (0.4)141.8 (72.7)127.0 (31.1)19.7 (2.6)
Publisher’s Note: MDPI stays neutral with regard to jurisdictional claims in published maps and institutional affiliations.

