Article

Assessing Potential Land and Soil for Nature-Based Solutions (NBS) for United Nations (UN) Initiatives: An Example of the Contiguous United States of America (USA)

1
Department of Forestry and Environmental Conservation, Clemson University, Clemson, SC 29634, USA
2
College of Forestry, Agriculture, and Natural Resources, University of Arkansas at Monticello, Monticello, AR 71656, USA
3
The Libyan Center for Palm Tree Research, Libyan Authority for Scientific Research, Tripoli 00218, Libya
4
Department of Biological Science and Biotechnology, Minnan Normal University, Zhangzhou 363000, China
5
Department of Electronic Information, Zhangzhou Institute of Technology, Zhangzhou 363000, China
6
Department of Environmental Engineering and Earth Sciences, Clemson University, Anderson, SC 29625, USA
7
Clemson Center for Geospatial Technologies, Clemson University, Anderson, SC 29625, USA
8
School of Law, Emory University, Atlanta, GA 30322, USA
*
Author to whom correspondence should be addressed.
Earth 2025, 6(1), 17; https://doi.org/10.3390/earth6010017
Submission received: 2 February 2025 / Revised: 27 February 2025 / Accepted: 6 March 2025 / Published: 18 March 2025

Abstract

:
The concept of nature-based solutions (NBS) is widely promoted as an approach to effectively counteract climate change and land degradation (LD) as well as simultaneously add environmental and socio-economic benefits. To have a worldwide impact from NBS, it is important to consider potential land and soil resources at various scales, including administrative units (e.g., country, state, county, etc.). Nature-based solutions are considered by many United Nations (UN) initiatives, including the Paris Agreement and the UN Convention to Combat Desertification (UNCCD). Currently, there is no consensus on how to define NBS and their indicators. The innovation of this study is that it defines and evaluates soil- and land-based NBS potential while suggesting indicators for land- and soil-based NBS using the contiguous United States of America (USA) as an example. This study defines potential land for NBS as the sum of the individual satellite-identified areas of barren, shrub/scrub, and herbaceous land covers, which are linked to climate and inherent soil quality (SQ), so that NBS could be implemented without changing other land uses. The potential soil for NBS, based on SQ, is a subset of land available for potential NBS. As of 2021, anthropogenic LD affected 2,092,539.0 km2 in the contiguous USA, with 928,618.0 km2 (15.1% of the contiguous US area) of actual potential land for NBS. The contiguous USA had a negative balance between anthropogenic LD and actual potential land for NBS to compensate for anthropogenic LD of −1,163,921.0 km2. Thirty-seven states also exhibited a negative balance for LD compensation with Iowa having the worst balance of −124,497.0 km2. Many states with positive anthropogenic LD and NBS balances showed that most of the potential NBS land was of low SQ and, therefore, may not be suitable for NBS. Planning for NBS should involve a feasibility analysis of “nationally determined NBS” (NDNBS) through site and context-specific NBS.

1. Introduction

Humanity is facing numerous global challenges (e.g., climate change, land degradation, etc.) that require solutions, including nature-based solutions (NBS) [1]. Although there are various definitions of NBS, this study uses the United Nations (UN) definition, which states that NBS are “actions to protect, conserve, restore, sustainably use and manage natural or modified terrestrial, freshwater, coastal and marine ecosystems which address social, economic and environmental challenges effectively and adaptively, while simultaneously providing human well-being, ecosystem services, resilience and biodiversity benefits”, with further relevant actions outlined in the UN document [2]. In the same document, NBS are recognized as being in line with various UN initiatives, including the UN Convention on Biological Diversity [3,4], the UN Convention to Combat Desertification [5,6], the UN Framework Convention on Climate Change [7], and the UN Sustainable Development Goals (SDGs) among others [8]. In addition, NBS are supposed to cover a wide range of challenges, including seven societal challenges identified by the International Union for Conservation of Nature (IUCN) [9]: “(1) Climate change mitigation and adaptation, (2) Disaster risk reduction, (3) Economic and social development, (4) Human health, (5) Food security, (6) Water security, and (7) Reversing environmental degradation and biodiversity loss”.
Many of the above-mentioned societal challenges are intricately linked with each other and associated with land and soil, which need land- and soil-based NBS [10]. Planning of NBS requires a feasibility analysis of whether the NBS can be used as a successful solution to societal challenges or not [11] (Figure 1). Most societal challenges and NBS are context-specific (e.g., climate change, etc.) and site-specific (e.g., geographic location, etc.) [12] (Figure 1). For example, our proposed study focuses on societal challenges numbers one (“1. Climate change mitigation and adaptation”) and seven (“7. Reversing environmental degradation and biodiversity loss”), the latter also including land degradation (LD) as part of “environmental degradation”. The current UNCCD definition of LD describes it as a “reduction or loss, in arid, semi-arid and dry sub-humid areas, of the biological or economic productivity and complexity of rainfed cropland, irrigated cropland, or range, pasture, forest and woodlands resulting from land uses or from a process or combination of processes, including processes arising from human activities and habitation patterns, such as: soil erosion caused by wind and/or water; deterioration of the physical, chemical and biological or economic properties of soil; and long-term loss of natural vegetation” [5]. Determination of LD status involves three distinct sub-indicators, which are “(1) land cover trends, (2) land productivity trends, and (3) below and above-ground soil organic carbon (SOC) stock trends” [13]. Evaluation of the overall LD status uses the one-out-all-out (1OAO) method, in which degradation of any one sub-indicator causes an establishment of degraded LD status [13].
Although enormously popular and often highly promoted as “superior” solutions [10], the actual implementations of NBS are highly challenging because NBS assume using human actions for NBS to solve societal challenges as well [2]. Obviously, NBS cannot solve environmental and societal challenges by themselves and require an analysis of NBS feasibility and subsequent actions based on this feasibility analysis.
In other words, NBS depend on human actions, even if they in some ways mimic natural systems, to understand the potential and develop and deploy them to counter environmental/societal challenges. Implementation of NBS requires resources and can result in societal benefits, but also at a cost to society. Also, the potential for NBS and the actual benefits from NBS are often challenging to assess and quantify [14]. Our study examines an intricate link between LD and climate change, since LD is a source of GHG emissions and a constraint to C sequestration. The UN has developed a set of very general LD and land degradation neutrality (LDN) guidelines and indicators (e.g., the indicator for UN Sustainable Development Goal (SDG) 15: Life on Land [3], Indicator 15.3.1: Proportion of land that is degraded over total land area [13], etc.), but it does not have context-specific land and soil NBS guidelines to compensate for LD. Furthermore, LDN determination is based on land-cover trend analysis over time, where no apparent overall change in LD with time would lead to a conclusion of LDN status and where a positive change would indicate LD. This analysis provides no information about potential land for NBS that could be used to compensate for existing LD, which could potentially address other UN SDG 15 aspirations, such as “… restoration of terrestrial ecosystems, combating desertification, and halting and reversing land degradation and halting biodiversity loss” [3]. Using the state of Ohio (OH) (USA) as a case study, Mikhailova et al. (2024) [15] showed that the concept of LDN can be misleading because although OH had overall LDN, it was not neutral for the degradation associated with development. Furthermore, there was only 927.5 km2 of potential land for NBS to help compensate for a total of 53,540.9 km2 of anthropogenically degraded land in OH.
Despite these challenges and the lack of guidance, various examples exist of attempts to use NBS to address LD based on local realities. For example, Downing and Olago (2024) [16] analyzed NBS from a historical perspective in Kenya, where a colonial-era grazing scheme was used to address LD but fell short of connecting it to human wellbeing. Van der Zan and van ‘t Hof (2022) [17] identified that large-scale NBS has the potential to impact billions of hectares of degraded land that could, in turn, counter 37% of CO2 emissions. Although the UN provides specific indicators to evaluate LD, there is no similar guidance on evaluating the potential for NBS. Given the large scale of LD across the world, NBS need to be at a similar scale and matched to LD in the areas where LD occurs. This study’s hypothesis is that determining actual potential land for NBS is possible by identifying the potential NBS areas (based on specific land covers) and subtracting the degraded area (also associated with a set of land covers) from this NBS area. This fills a critical research gap by proposing a method to understand if there is actual potential land for NBS to compensate for degraded land by contextualizing this evaluation by soil type. This proposed method can be used over large spatial extents necessary to compensate for historic LD. Furthermore, land ownership and legal context are also critical for understanding the true potential of NBS.
The primary objective of this study was to develop a method of evaluating potential land for NBS and use recent and past land cover datasets derived from satellite remote sensing (the Multi-Resolution Land Characteristics Consortium (MRLC) [18]) together with key high-resolution soil databases (the Soil Survey Geographic Database (SSURGO) [19] and the State Soil Geographic Database (STATSGO) [20]) to determine the actual potential land for NBS in the contiguous United States of America (USA) which was chosen because of the availability of consistent land cover and soil spatial data. Sub-objectives included (1) quantifying the total area of potential land for nature-based solutions (NBS) disaggregated by land cover and soil type prior to and through 2021; (2) quantifying the recent percent area changes in NBS from 2001 to 2021; (3) determining the actual potential NBS area by subtracting degraded lands from land covers available for NBS; (4) evaluating the availability of like-for-like substitution, based on soil type, of potential NBS land with degraded land; and (5) exploring other potential limitations to NBS implementation including legal and land ownership issues.

2. Materials and Methods

This study utilized an organizational framework (Table 1) to enhance SDG 15: Life on Land, Target 15.3, and Indicator 15.3.1 by calculating potential land for NBS by identifying land cover types (barren, shrub/scrub, and herbaceous land; Figure 2) and their changes within the contiguous USA. This study was comprised of two parts documented in Table 1. Part 1 determined potential NBS by soil type, land cover type, and administrative unit, while the second part consisted of reducing the area available for NBS by previously degraded land (also identified by land cover type (developed, hay/pasture, and cultivated crops)). Both potential NBS and land subject to LD were determined using previously classified land cover data (30 m) derived from satellite remote sensing datasets from 2001 and 2021 by the Multi-Resolution Land Characteristics Consortium (MRLC) [18]. The geospatial analysis workflow included converting the raster land cover data from raster to vector format and then unioning it with a high-resolution vector soil spatial dataset (SSURGO) [19] using ArcGIS Pro 2.6 [21] to evaluate spatially associated land covers and soil orders. The soil and land cover data are at the highest resolution and the most commonly available spatial datasets available in the USA. The barren land cover category is both potentially a type of anthropogenically degraded land and a land cover type that is potentially available for NBS. In the case of barren land, land uses such as gravel pits and strip mines are clearly the result of human LD; however, there are also areas of bedrock, sand dunes, etc., that are not necessarily the result of human activity. When considering potential areas for NBS, the possible reclamation of strip mines and gravel pits, as well as other similar areas, should be included.

3. Results

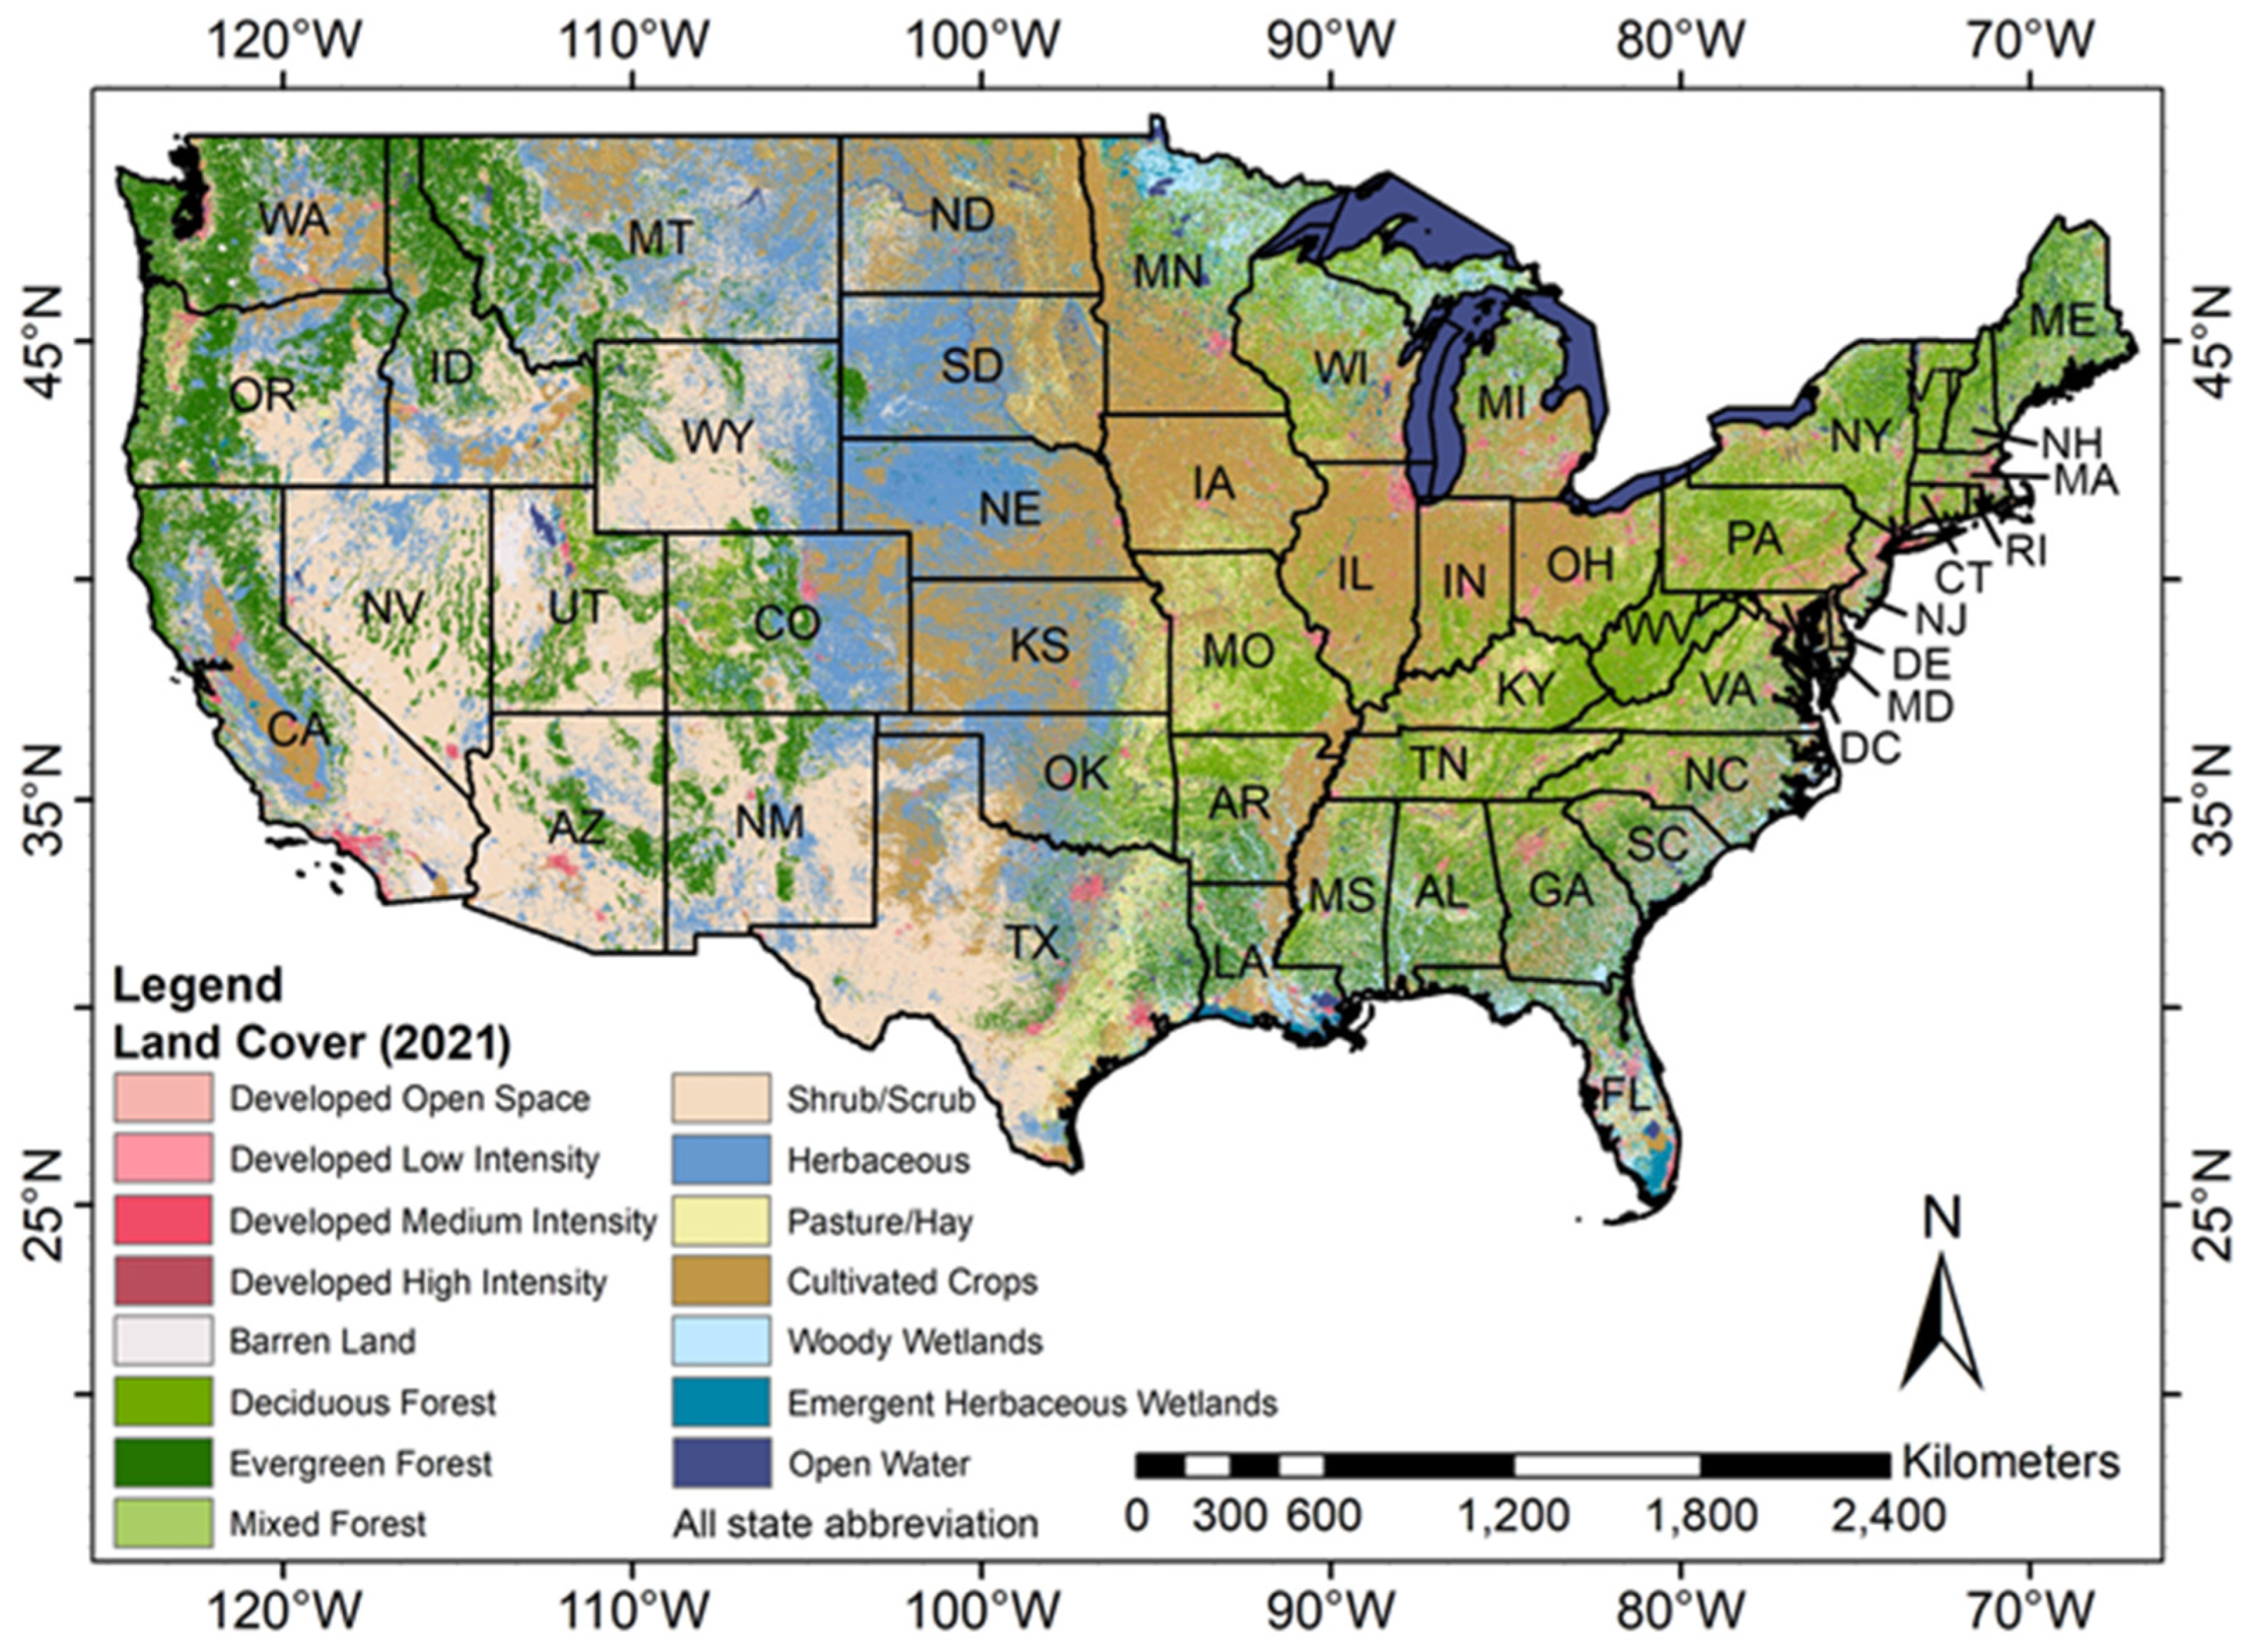
Status of Anthropogenic Land Degradation (LD) and Actual Potential Land for Nature-Based Solutions (NBS) in the Contiguous United States of America (USA)

Overall total anthropogenic LD in the contiguous USA was 2,092,539.0 km2 (34.1% of the country area), with high variability within the country ranging from as low as 4.0% for the state of New Mexico to as high as 88.7% for the state of Iowa (Figure 3, Table 2). Anthropogenic LD also varied by US region, with the Midwest Region having the highest overall anthropogenic LD of 62.8% and the West Region having the lowest overall anthropogenic LD of 12.6%. Land degradation neutrality (LDN) was not achieved for the contiguous USA, its six regions, or for 45 of its 48 states based on increases in overall anthropogenic LD between 2001 and 2021 (Table 2). Only three states (Arkansas, Louisiana, and Alabama) showed a decline in anthropogenic LD between 2001 and 2021 (Figure 3, Table 2).
In terms of potential compensation for the anthropogenic LD, this study calculated both the potential land for NBS and the actual potential land for NBS (adjusted by removing land with low-SQ soils) (Table 2). This actual potential land for NBS is the intersection between potential land for NBS and potential soil for NBS, which is used in the following discussion as a more realistic scenario for wide-scale NBS implementation. There were 928,618.0 km2 of actual potential land for NBS in the contiguous USA (15.1% of the contiguous US area) with high variability within the country (Table 2). Actual potential land for NBS also varied by US region, with the Northern Region having the largest actual potential land for NBS and the East Region having the smallest potential land for NBS (Table 2). The contiguous USA experienced a decline in actual potential land for NBS (−2.1%) between 2001 and 2021 (Table 2). Regions exhibited various changes in actual potential land for NBS over the same period (Table 2).
Thirty-seven states exhibited a negative balance between anthropogenic LD and actual potential land for NBS to compensate for anthropogenic LD with Iowa having the worst balance of −124,497.0 km2 (Table 2). Many states with positive anthropogenic LD and NBS balances revealed that most of the actual potential NBS land was of low SQ in arid and semi-arid climates; therefore, it truly may not be suitable as NBS (Table 2). Furthermore, the states with negative anthropogenic LD and NBS statuses may be unable to “outsource” their NBS to these states because of low-SQ soils and climate (Table 2).
Anthropogenic LD varied by soil order as well, with agriculturally productive soil orders of Mollisols and Alfisols having the largest areas of LD and Aridisols having the smallest area of LD (Table 3). All soil orders exhibited an increase in anthropogenic LD with the soil order of Vertisols showing the largest increase in LD between 2001 and 2021 (Table 3).
Regarding potential land for NBS, the soil orders of Mollisols, Aridisols, and Entisols had the most extensive areas, while the soil order of Histosols had the smallest area (Table 3). Six out of ten soil orders displayed a decline in potential land for NBS between 2001 and 2021 (Table 3). Seven out of ten soil orders revealed a negative balance between anthropogenic LD and potential land for NBS to compensate for anthropogenic LD, with agriculturally important Alfisols and Mollisols having some of the worst negative balances (Table 3). The highest positive balance appeared to be in the soil orders of Aridisols and Entisols, which tend to be low-SQ soils (Table 3). Outsourcing NBS from areas dominated by soil orders with negative balance areas (e.g., Alfisols and Mollisols) to low-SQ soils with a positive balance of potential land for NBS is not realistic because the low-SQ soils (e.g., Entisols and Aridisols) are unlikely to support NBS (Table 3).

4. Discussion

4.1. Assessing Land and Soil Potential for Nature-Based Solutions (NBS) for the United Nations (UN) Climate and Land Degradation (LD) Initiatives

Nature-based solutions are proposed to counteract societal challenges, including climate change and LD, but potential NBS benefits must be evaluated before implementation [26]. Therefore, it is necessary to quantitatively (e.g., area, etc.) and qualitatively (e.g., soil type, etc.) assess the actual potential (e.g., land, soil, etc.) of NBS to compensate for LD (Figure 4). Figure 4 provides a newly proposed definition for actual potential NBS. This research proposes a new enhancement based on this study (indicated in italics in Table 4) to one of the three existing land degradation (LD) sub-indicators, “land cover trends” [13], to determine potential land for NBS to compensate for LD. The sub-indicator “land cover trends” is part of the United Nations (UN) Sustainable Development Goal (SDG) Indicator 15.3.1: Proportion of land that is degraded over the total land area [13,27].
Climate change is intricately linked to LD, given the fact that anthropogenic LD contributes to greenhouse gas (GHG) emissions. A critical part of climate change mitigation has been the nationally determined contributions (NDCs) submitted to the 2015 Conference of the Parties (COP), which led to the Paris Agreement [28]. These NDCs detailed each of the 186 countries’ national climate action plan and GHG reduction goals, as well as the financial resources necessary to achieve the mitigation efforts [28]. The NDCs should be updated every five years [28]. Nature-based solutions are essential for addressing the sources and impacts of climate change [29]. Many (almost 66%) of the signatories to the Paris Climate Agreement have included NBS as one of the methods to reach their GHG reduction goals; however, there is a realization that NBS must be scaled up to meaningfully contribute to reaching these goals [29]. The US NDC (“Reducing Greenhouse Gases in the United States: A 2030 Emissions Target”) included an overall goal of reducing net emissions of greenhouse gases by 50–52% below 2005 levels by 2030 and mentioned recommended land management practices and methods that could reduce GHG emissions while increasing C sequestration [30]. This target is aggregated at the country level and does not provide individual targets at the state level and/or does not provide proportion targets in relation to past or current GHG emissions. This lack of specificity in assigning targets to individual states or even smaller administrative units makes it difficult to determine meaningful strategies for land-based GHG reductions. There are only a handful of US states that have climate change adaptation plans, and most of them do not consider soil-based emissions from LD (https://www.georgetownclimate.org/adaptation/plans.html (accessed on 15 December 2024)) [31].
Table 4. Proposed new enhancement based on this study (indicated in italics) to one of the three existing land degradation (LD) sub-indicators, “land cover trends” [13], to determine potential land for nature-based solutions (NBS) to compensate for LD. The sub-indicator “land cover trends” is part of the United Nations (UN) Sustainable Development Goal (SDG) Indicator 15.3.1: Proportion of land that is degraded over total land area (adapted from Sims et al. (2021) Refs. [13,27]). Items noted with bold text indicate previously proposed indicator enhancements [32].
Sub-IndicatorMetricBaseline Status (t0)
Sub-Indicator
Reporting Period (t1) Sub-IndicatorTotal Quantity of
Sub-Indicator (t1)
Enhancement of
Indicator 15.3.1
Degraded land and soil cover (results reported by land cover and soil type)AreaND or DN, P, SArea of inherently DLTotal area of IDL (t1)
(IDL) (t1)Total land area
AreaND or DN, P, SArea of anthropogenicallyTotal area of ADL (t1)
DL (ADL) (t1)Total land area
AreaND or DN, P, STotal area ofTotal area of DL (t1)
DL = IDL + ADL (t1)Total land area
Actual potential land for nature-based solutions (NBS) (results reported by land cover and soil type)AreaActual potential land for NBSN, P, SActual total potential land
area for NBS (t1)
Total potential land area for NBS (t1) − Total area of IDL
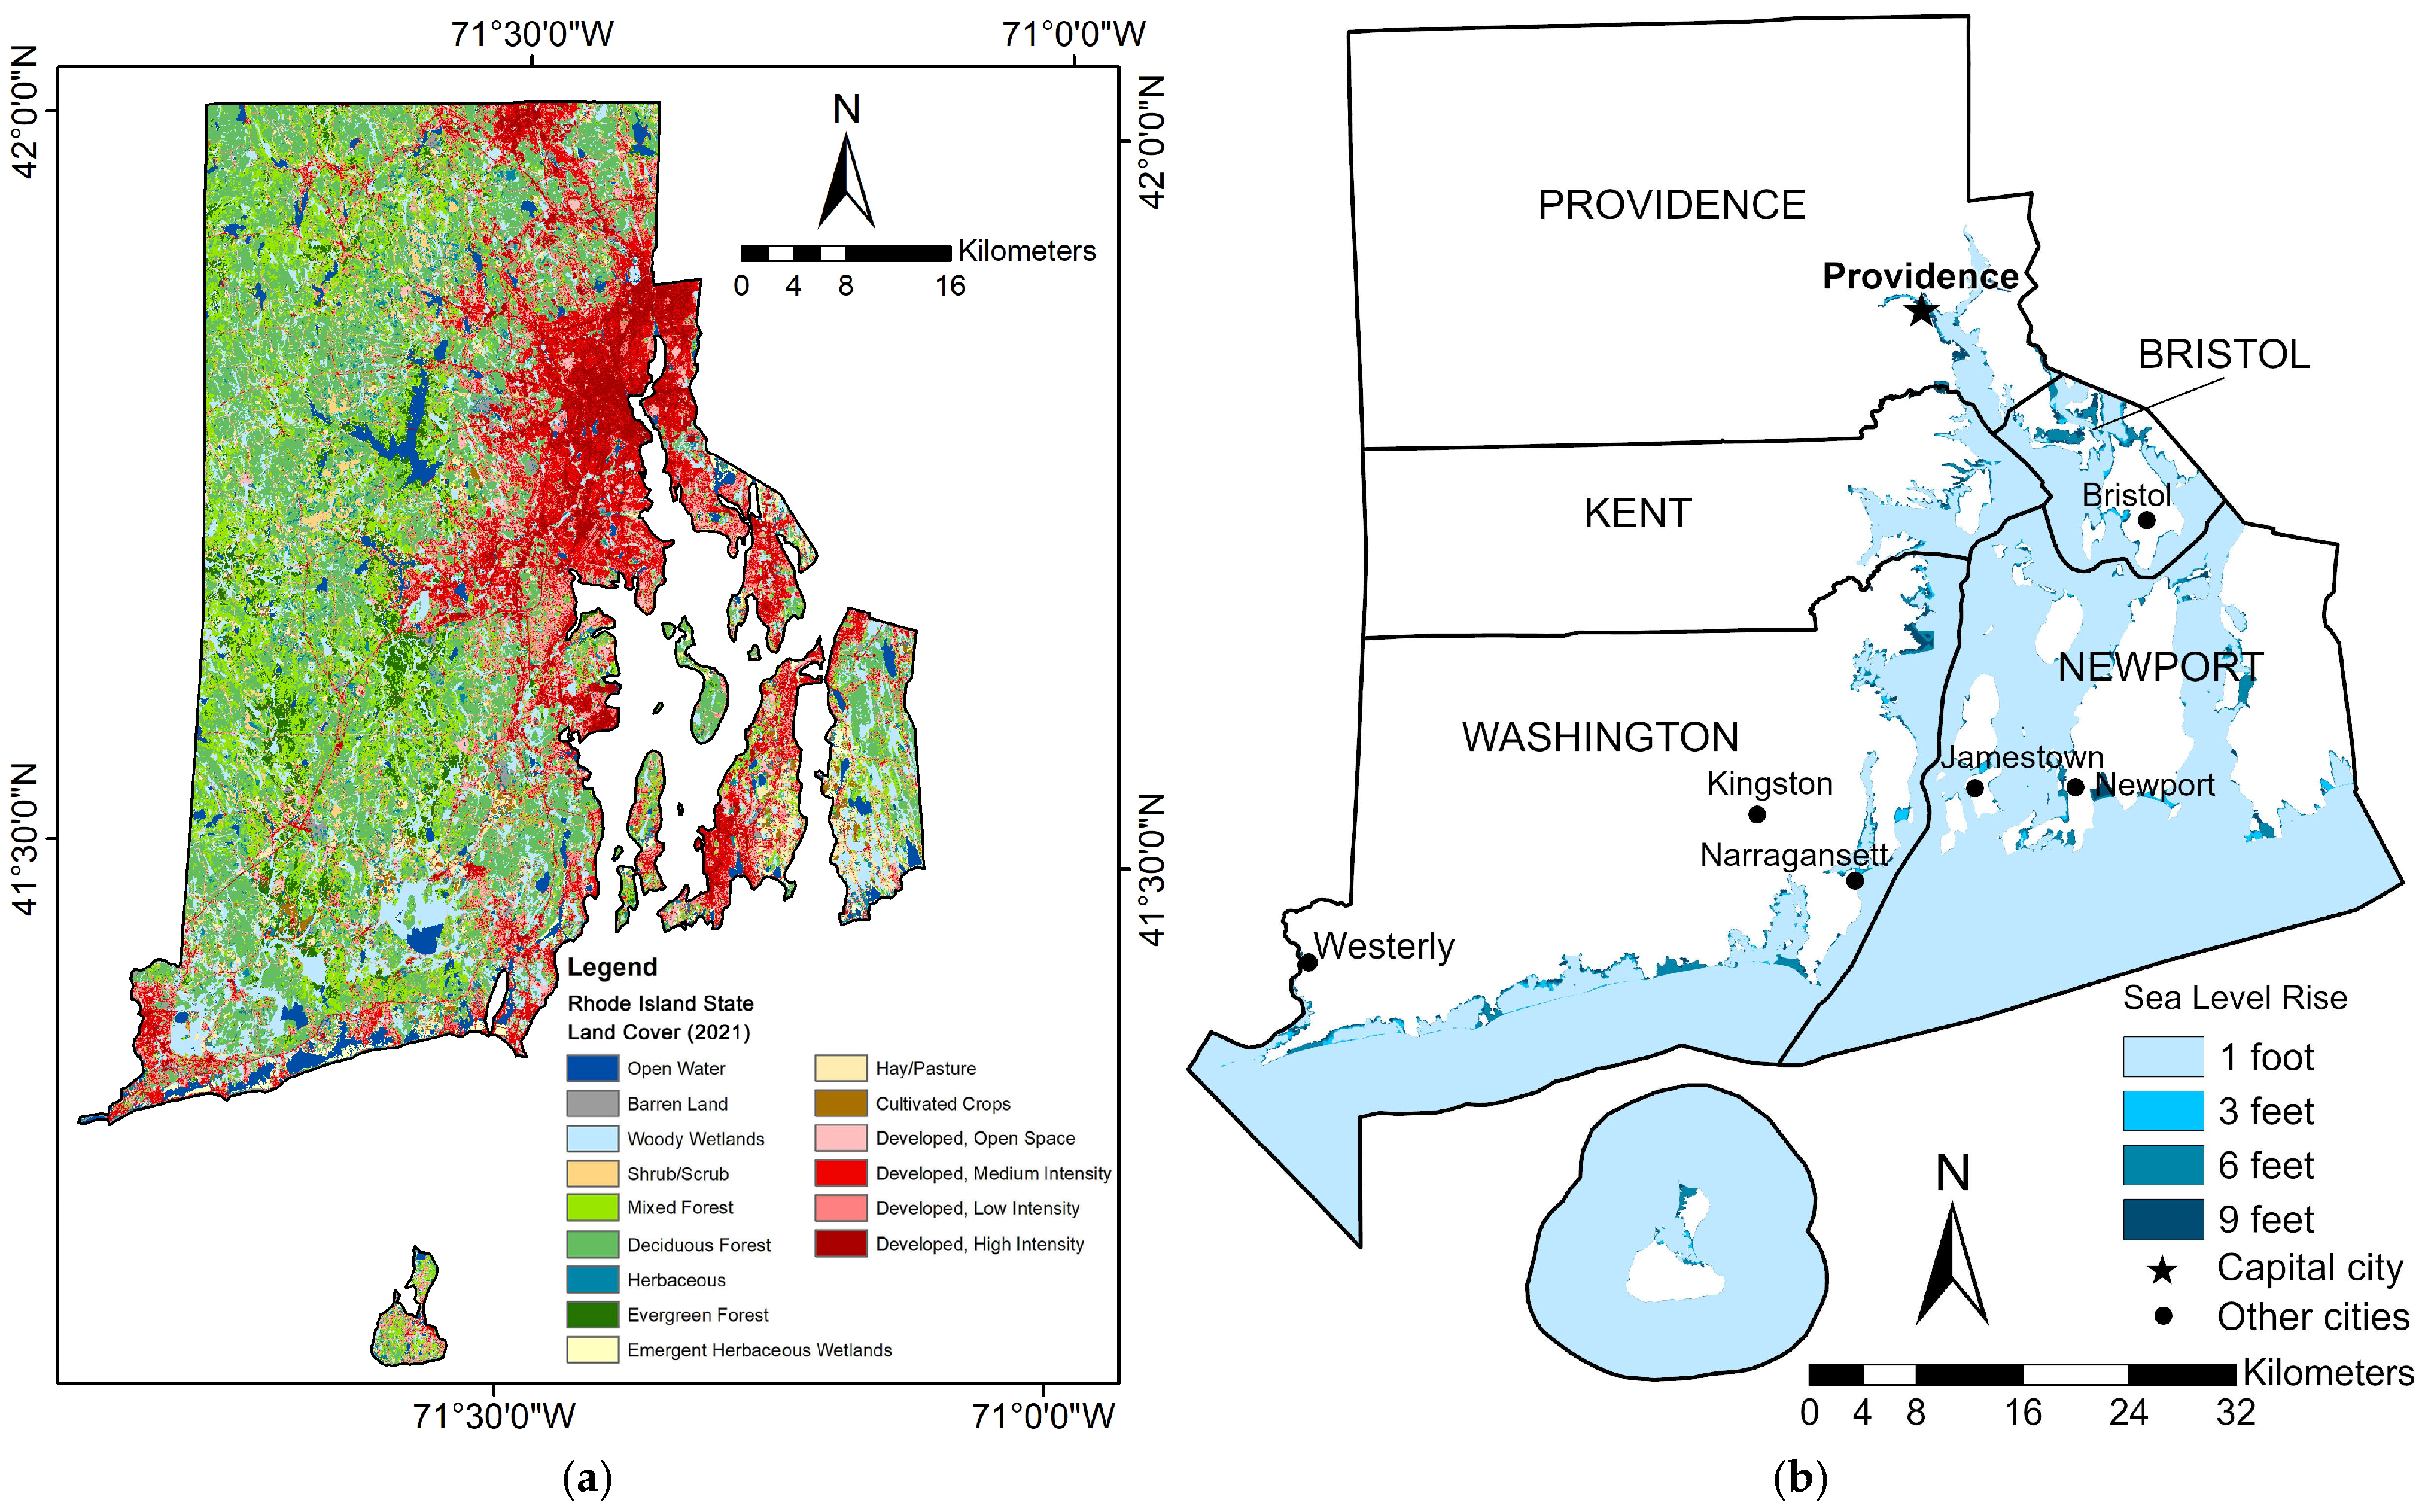
Note: DL = degraded land, ADL = anthropogenically degraded land, IDL = inherently degraded land, ND = not degraded, NBS = nature-based solutions, D = degraded, P = positive, S = stable, N = negative, t = time.
Overall, when considering the example of the contiguous USA, it appears that there is insufficient land to support NBS to mitigate LD on a one-to-one area basis for the whole country (Table 2). This is also the case for most of the individual states within the contiguous US, which exhibit insufficient potential land for NBS when compared by area and/or soil type (Table 2 and Table 3). Also, a more accurate accounting of this potential land for NBS needs to consider the productive potential of land based on soil type (Figure 4). Therefore, based on this understanding, the process to determine the actual potential land for NBS (Figure 4) is to (1) identify potential land for NBS based on land cover, and then (2) determine the actual potential land for NBS by reducing this total area based on the inherently (low-SQ soils) degraded lands (Figure 4).
This study revealed differences in actual potential land for NBS between states, ranging from as low as 0.4 km2 in Delaware to as high as 187,972.9 km2 in Texas (Table 2). Delaware has such a small actual potential NBS land area both because it is a small state and also because much of the potential NBS land area is limited by low-SQ soils (Table 2). On the other hand, Texas is one of the largest states in the USA and has a large potential NBS land area, more than half of which has high-SQ soils (Table 2). Given this wide variability in actual potential land for NBS by state, this study proposes using the concept of nationally determined contributions (NDCs) to enhance NBS as “nationally determined NBS” (NDNBS) to compensate for LD, which also reduces GHG emissions. Potential land for NBS can be calculated at the national and sub-national levels (Table 2) to evaluate if there is sufficient “high-quality” land for NBS to compensate for LD on an area basis. Such an evaluation should be conducted at the sub-national level (e.g., states, counties, cities, regions, etc.) because NBS implementation should occur in the same administrative area where land is degraded. Finally, the actual potential land for NBS must be calculated by identifying the inherently degraded land and removing it from consideration for NBS implementation. Adjusting the total potential land for NBS for the contiguous USA by removing inherently low-SQ soils (Entisols, Inceptisols, Ultisols, and Aridisols) reduced the potential NBS area by more than 55% to 928,617 km2, which resulted in an overall negative balance (difference between potential NBS area (adjusted for inherently low-SQ soils) and anthropogenically degraded land) of −1,163,923 km2 in the area needed to compensate for anthropogenic LD (Table 2). It is important to note that the determination of low-SQ soils can be subjective based on expert opinion and may vary based on past land-use history and climate. In some cases, for example, low-SQ soils may be selected for reclamation, even if the overall NBS impact is limited by soil capacity. To account for potential differences in low-SQ soil determination, this study provides data in Table 2 in both adjusted and non-adjusted formats.
Disaggregated LD and NBS data by state provided an important insight into the spatial variability, showing that most states do not have actual potential land for NBS (without a significant and costly change in current land use) to address LD and its contribution to climate change. States with potential NBS land are often located in arid and semi-arid environments, where a combination of a dry climate and predominant low-SQ soil types (e.g., Entisols, Inceptisols, and Aridisols) would impede NBS implementation (Figure 5). Disaggregated LD and NBS data by soil type showed a remarkable loss of soil diversity (pedodiversity), which limited potential NBS soil choices to low-SQ soils (e.g., Entisols, Aridisols, etc.). The lack of actual potential NBS land is further complicated by a high proportion of private landownership in the states, which requires the development of a legal framework to prevent conflicts in implementing NBS (Table 2) [33].
When considering using NBS to compensate for LD and climate change, there can be limited options regarding where to implement these NBS, particularly over large areas. This study has evaluated the potential for NBS implementation on land not currently used for agriculture, forestry, or human development. Another option is to use NBS as part of or in place of food or fiber production, given that removing human development areas for NBS is unlikely. Even though agriculture causes LD, it is difficult to reduce food production areas and put NBS in their places; however, changes to agricultural practices that increase soil C may act as NBS. Forest land covers already serve a critical role in C sequestration and cannot be widely augmented or replaced to implement NBS. While it is clearly possible that NBS, such as planting forests or restoring ecosystems [34], may be able to sequester C and reduce LD, the timescale of such impacts is unlikely to meet climate goals by 2030. Furthermore, these NBS would need to be implemented over large spatial extents and given the lack of available land (Table 2) and competing interests for land uses, it is unclear whether this is possible at all. Climate change and associated sea level rise will cause further loss of potential land for NBS in coastal areas of the contiguous USA as shown by using the state of Rhode Island (RI) as an example (Figure 6, Table 5). Noting the high prevalence of developments in coastal areas of RI that will most likely be impacted by rising sea levels (Figure 6), there will be an additional loss of area for NBS because of the needed relocation of people to other areas located away from these coastal regions that are at risk. The increase in developments over time in RI (Table 5) likely represents reverse climate change adaptation because developments in areas vulnerable to sea level rise are likely increasing over time. Furthermore, ongoing developments, often adjacent to existing development areas, decrease the opportunities for large-scale NBS over time.
Since NBS are intended to address global challenges, wide implementation of NBS on a global scale would also require global coordination, cooperation, and significant financial resources [35,36,37]. A detailed cost-benefit analysis of the financial resources necessary to counteract climate change impacts and compensate for LD needs to be conducted [37]. The IUCN itself acknowledges that some claims of NBS fall short of their goals/intentions and that it is essential to have effective design and monitoring strategies [38]. It is unlikely that NBS can undo many of the multiple Anthropocene deleterious impacts, which include climate change [39]. It is probably not the intent of advocates for NBS to claim that they can make things as they used to be on Earth since Earth is dynamic, and changes can happen with or without human actions. There can be no doubt that humans have disrupted/accelerated many critical elemental cycles on Earth. But humans are a part of nature, and if NBS can reverse, or at a minimum slow down, adverse effects on nature that poor human decisions have caused in the past, then that is perhaps all people can ever hope for.
Figure 6. Maps showing (a) the state of Rhode Island (RI) (USA) 2021 land cover map (41°09′ N to 42°01′ N; 71°07′ W to 71°54′ W) and the prevalence of developments (in red) adjacent to the coast (using data from the Multi-Resolution Land Characteristics Consortium (MRLC) [18]), and (b) projections of future sea level rise and land loss due to climate change in counties of the state of Rhode Island (RI) (USA) (based on original ArcGIS Pro 2.6 [21] analysis of data from the National Oceanic and Atmospheric Administration (NOAA) [40]).
Earth 06 00017 g006
Table 5. Selected county area changes in the developed area (2001–2021) and county area loss (%) due to sea level rise in the state of Rhode Island (RI) (USA) (based on original ArcGIS Pro 2.6 [21] analysis of data from the National Oceanic and Atmospheric Administration (NOAA) [40]).
Counties
(Affected by Sea Level
Rise)
Change in
Developed
Area (2001–2021) km2 (%)
County Area Loss Due to Sea Level Rise (%)
1 Foot3 Feet6 Feet9 Feet
Bristol1.9 (+4.8)47.949.753.957.6
Kent16.6 (+12.0)  7.8  7.9  8.4  8.8
Newport  9.7 (+11.1)66.867.368.269.1
Providence38.6 (+12.1)  1.4  1.4  1.6  1.8
Washington26.5 (+16.1)40.240.641.642.3
Note: All of Rhode Island’s (USA) counties are potentially affected by the projected sea level rise. One foot = 0.3048 m. Change in the area was calculated using the following method: ((2021 Area − 2001 Area)/2001 Area) × 100%.

4.2. Critical Aspects of Nature-Based Solutions

4.2.1. Asserted Benefits of Nature-Based Solutions

Nature-based solutions have been offered as a miracle panacea for solving global warming and its impacts. For example, flood risks related to extreme weather events associated with climate change can potentially be mitigated by implementing NBS that mimic nature to rebuild flood plains and riparian areas [33]. This NBS implementation to support flood risk management is seen as a more sustainable solution that can also increase biodiversity and ecosystem services while reducing the costs associated with flood risk management [33]. Governments and important international bodies have heralded NBS as a means to achieve GHG reduction. A White House Task Force recently noted that NBS can be used to reduce GHG emissions while also serving to remove and sequester atmospheric C [41]. Furthermore, these GHG removal and sequestration NBS are promoted as being both effective and having a lower cost than other strategies, while adding additional ecosystem benefits [41]. The United Nations has been especially glowing about the possibility that NBS will permit the achievement of climate goals with low costs [42]. The UN also mentions the multifaceted benefits of NBS for humans, as well as for nature itself (e.g., increased biodiversity), while addressing the SDGs and many of the economic, environmental and social challenges facing humanity [42].

4.2.2. Limitations of Nature-Based Solutions

However, NBS are no panacea to societal challenges in the age of the Anthropocene, which cannot be quickly “naturally fixed” given its geological scale [39]. They will likely not by themselves come anywhere close to either preventing climate change or mitigating the damage caused by such change. It is false, fairy-tale thinking to hope that NBS will rescue the world from climate change. At best, their contribution will be modest. Nature-based solutions will not relieve the world from making the wrenching choices that will be necessary to control climate change and mitigate its harmful effects.
The defects in rosy predictions for NBS are many. First, for many NBS measures, it would take decades from their establishment for them to provide substantial economic and ecological benefits compared to established natural ecosystems [43]. Moreover, to have any substantial impact on climate change, NBS interventions would need to be employed on a breathtaking scale. Countries or areas would need to commit large areas for NBS instead of for economic development or food production. For example, to counteract climate change, land use practices would need to be changed in most of the world’s ice-free land [44]. Such changes would impose profound economic impacts, as well as create environmental change and societal disruption on an unprecedented level [43]. Achieving such a change would also be politically impossible since it would require cooperation among hundreds of countries to impose wrenching change.
The contributions of many NBS may be only temporary. Reforested areas will remove C from the air only once they have matured, at which point they will achieve an equilibrium between C sequestration and C release. Although mature reforested areas might produce other environmental benefits, such as pollination, recharging groundwater, and storm protection—they will remove no further C [44]. The areas must then remain reforested; clearing the forests could release the stored C [45]. In this sense, NBS goals for reducing climate change conflict with other important goals. Forests that are used to reduce climate change cannot be cleared to produce food. Furthermore, economic incentives may cause people to counteract NBS measures. If some land is reforested, then an incentive exists for people to clear other land [46]. Likewise, many benefits of NBS may not persist. For example, the benefits of C sequestration from decades of efforts to reforest an area could be lost in a single forest fire or other tree-death event [47]. In sum, it is not clear that NBS are effective solutions to address climate change. Indeed, they may be harmful greenwashing, doing more harm than good. They may create a moral hazard, convincing people that NBS will replace actual impactful climate change actions.

4.2.3. Refining Nature-Based Solutions

Although NBS are not a climate savior and will neither stop climate change nor cure its impacts, NBS could play a modest role in such efforts. However, planners must carefully determine in advance whether NBS measures are worthwhile. In performing these calculations, expected benefits should be compared with the costs, both in terms of the funds spent on installation and maintenance and the value of the other activities that must be foregone to undertake the NBS measures [48]. Other key considerations are whether a particular NBS is appropriate for local conditions (e.g., soil characteristics, climate, and local biodiversity), if the NBS will have sufficient long-term performance, and, critically, if the NBS is being developed at a sufficient scale to make a real impact on the problem(s) being addressed [48]. Nature-based solutions, when possible, should aim to address multiple hazards or goals, and provide co-benefits to society and the environment [49]. Given that most NBS examples to date have been carried out at a local scale [49], there is a real question if the benefits scale with the size of NBS, and if NBS become more cost-efficient at larger sizes, given the necessary tradeoffs in land and resources necessary to construct and maintain them [48]. Another barrier to regional-scale NBS is that they can cross administrative units, making them difficult to implement because of the multiple governments, rules, and laws involved in land development and restoration, which may require country-level involvement [49].
Relatively few NBS projects may pass this test. Most examples of NBS implementation have been in Europe and at the local level, with few examples in other regions and at other landscape scales [49]. Most likely, this scarcity of NBS examples in many regions of the world has resulted in a lack of indicators that could be used to evaluate and compare the impact of NBS, which is seen as a limitation to future application of NBS [49]. Moreover, even if a proposed NBS project promises net benefits, it must be determined whether the project will nonetheless cause injustice. Many proposed NBS projects may bring about, as a side effect, the displacement of vulnerable groups and the destruction of their communities [26].

5. Conclusions

Nature-based solutions are actively being promoted for solving a wide range of societal challenges, including the problems of “climate change mitigation and adaptation” and “reversing environmental degradation and biodiversity loss”, which also includes anthropogenic LD. United Nations climate change (e.g., NDCs, etc.) and LD initiatives often include NBS, but there is a lack of guidance for quantifying and evaluating NBS in planning efforts and assessments. For example, although the UN developed a set of guidelines for LD and LDN analyses, it lacks guidelines for using NBS to solve these challenges. The innovation of this study in its proposal of potential quantitative and qualitative NBS sub-indicators to be included along with already existent LD and LDN indicators, which can be termed “nationally determined NBS“ (NDNBS). These newly proposed sub-indicators were “tested” using geospatial remote sensing and soil data for the forty-eight states within the contiguous USA. The analysis results were disaggregated using administrative and biophysical units, as recommended by the UN. The results of the analysis showed that there is a negative balance of actual potential land for NBS implementation, especially affecting agriculturally productive soils and states. Outsourcing NBS from areas dominated by soil orders with negative balance areas (e.g., Alfisols and Mollisols) to low-SQ soils with a positive balance of potential land for NBS is not realistic because low-SQ soils (e.g., Entisols and Aridisols) are unlikely to support NBS implementation. Only a subset of the land available for potential NBS is likely actually available because potential soil for NBS, based on soil type and quality, is a subset of the available land. This study demonstrates an example of potential NBS feasibility analysis, which shows biophysical and societal limitations to using NBS for anthropogenic LD and climate change mitigation at the country and state levels. It also shows an unevenly distributed burden of anthropogenic LD and a lack of actual potential NBS opportunities to compensate for it by states, which complicates the efforts of the US to meet its US NDCs goals.
This study is one of the first to look at NBS potential over large geographic extents in the context of helping to counteract LD at the country or state scale. In this case, LD is primarily associated with agriculture and development, so the scale of NBS required to impact overall LD is large. The proposed methodology has the advantage of being low cost and able to be performed in a standardized way across the world so that the overall potential of NBS in relation to LD can be understood at a range of different scales and in ways that could help direct future NBS action. This ability to quantify LD and NBS potential at the country scale could be translated into indicators and tools that could guide policymakers to help craft realistic and impactful goals for NBS implementation that could be used to inform national or even international policy. Possible limitations of this study include that it relies on land cover classification to identify both LD and potential land for NBS. This potential land for NBS is identified in land cover categories that would not reduce existing agriculture/forestry or impact existing human developments. While remotely sensed land cover classes have a relatively high degree of accuracy, they do not include ownership status as public or private lands, which could greatly reduce the potential for NBS implementation. Additionally, this study did not consider limits to NBS that result from climate-related issues; however, the inclusion of soil types does help understand many climate limitations because of the climate–soil associations. Climate change and associated sea level rise will cause further loss of potential land for NBS, as will ongoing developments, so the opportunity to develop large-scale NBS will decrease over time. Future research should focus on incorporating new datasets and technologies to help refine the identification of LD and the potential for NBS. This could include, for example, future remote sensing platforms that will be able to monitor soil moisture over time to help accurately classify climate/soil/land cover relationships to better understand NBS potential and target NBS implementation in real-time. With improving remote sensing technologies, it will be possible to identify and evaluate the potential for innovative agricultural practices that improve soil resources and act as NBS (e.g., regenerative agriculture).
It is important to note that future refinement of the assumptions used in this study, combined with new technologies and data, could help identify locations within other land cover categories where NBS interventions could help meet site-specific goals. This could allow the identification and ranking of the current site restoration potential within, for example, developed and agricultural areas. Evaluation of agricultural areas for NBS would need to consider both the potential and opportunity costs for altering land use to implement the NBS.
Despite much hopeful promotion, NBS are not a climate savior. Nature-based solutions are tantalizing, suggesting that society could solve climate change and its effects by planting a few trees and establishing some wetlands. Unfortunately, hope does not match reality. The benefits are too uncertain. Moreover, even if net benefits were positive, the scale of NBS would have to be too large to be practical—the size of whole large countries. Finally, large NBS projects might create injustice, as vulnerable groups could be dispossessed of their land. It is important that gauzy promises associated with NBS do not become distractions from making the hard choices that are still necessary for addressing climate change.

Author Contributions

Conceptualization, E.A.M.; methodology, E.A.M., M.A.S. and H.A.Z.; formal analysis, E.A.M. and G.C.P.; writing—original draft preparation, E.A.M., L.N.L. and L.C.R.; writing—review and editing, E.A.M., C.J.P., M.A.S. and G.B.S.; visualization, H.A.Z., L.L. and Z.H. All authors have read and agreed to the published version of the manuscript.

Funding

This research received no external funding.

Data Availability Statement

Data are contained within the article.

Acknowledgments

We would like to thank the reviewers for their constructive comments and suggestions.

Conflicts of Interest

The authors declare no conflict of interest.

Glossary

COPConference of the Parties
GHGGreenhouse gas
IUCN International Union for Conservation of Nature
LDLand degradation
LDNLand degradation neutrality
LULCLand use/land cover
MRLCMulti-Resolution Land Characteristics Consortium
NNorth
NDCsNationally determined contributions
NDNBSNationally determined nature-based solutions
NBSNature-based solutions
NLCDNational Land Cover Database
NOAANational Oceanic and Atmospheric Administration
NRCSNatural Resources Conservation Service
RIRhode Island
SDGsSustainable Development Goals
SQSoil quality
SSURGO
STATSGO
Soil Survey Geographic Database
State Soil Geographic Database
UNUnited Nations
UNCCDUnited Nations Convention to Combat Desertification
USAUnited States of America
USDAUnited States Department of Agriculture
WWest

References

  1. Dunlop, T.; Khojasteh, D.; Cohen-Shacham, E.; Glamore, W.; Haghani, M.; van den Bosch, M.; Rizzi, D.; Greve, P.; Felder, S. The evolution and future of research on Nature-based Solutions to address societal challenges. Commun. Earth Environ. 2024, 5, 132. [Google Scholar] [CrossRef]
  2. UNEP. Resolution Adopted by the United Nations Environment Assembly on 2 March 2022. 5/5. Nature-Based Solutions for Supporting Sustainable Development; United Nations Environment Assembly of the United Nations Environment Programme; UNEP: Nairobi, Kenya, 2022. [Google Scholar]
  3. UN. Convention on Biological Diversity. Treaty Collection. 1992. Available online: https://www.cbd.int/doc/legal/cbd-en.pdf (accessed on 16 October 2024).
  4. UN. Convention on Biological Diversity. Kunming-Montreal Global Biodiversity Framework. 2022. Available online: https://www.cbd.int/article/cop15-final-text-kunming-montreal-gbf-221222 (accessed on 16 October 2024).
  5. United Nations Convention to Combat Desertification. Available online: https://www.unccd.int/convention/overview (accessed on 8 October 2024).
  6. United Nations (UN) Convention to Combat Desertification. Decision 3/COP.12 (COP 12, Ankara, 2015). Integration of the Sustainable Development Goals and Target into the Implementation of the United Nations Convention to Combat Desertification and the Intergovernmental Working Group Report on Land Degradation Neutrality. Available online: https://www.unccd.int/official-documentscop-12-ankara-2015/3cop12 (accessed on 16 October 2024).
  7. UNFCCC: United Nations Framework Convention On Climate Change. United Nations, FCCC/INFORMAL/84 GE. 05-62220 (E) 200705, Secretariat of the United Nations Framework Convention on Climate Change, Bonn, Germany, 1992. 24p. Available online: https://unfccc.int/resource/docs/convkp/conveng.pdf (accessed on 1 November 2024).
  8. United Nations (UN). Transforming Our World: The 2030 Agenda for Sustainable Development; The Resolution Adopted by the General Assembly on 25 September 2015; United Nations: New York, NY, USA, 2015; 35p. [Google Scholar]
  9. IUCN. Global Standard for Nature-Based Solutions. A User-Friendly Framework for the Verification, Design and Scaling Up of NbS. 978-2-8317-2058-6; IUCN: Gland, Switzerland, 2020. [Google Scholar] [CrossRef]
  10. Keesstra, S.; Nunes, J.; Novara, A.; Finger, D.; Avelar, D.; Kalantari, Z.; Cerdà, A. The superior effect of nature based solutions in land management for enhancing ecosystem services. Sci. Total Environ. 2018, 610, 997–1009. [Google Scholar] [CrossRef]
  11. Sarabi, S.; Han, Q.; de Vries, B.; Romme, A.G.L. The nature-based solutions planning support system: A playground for site and solution prioritization. Sustain. Cities Soc. 2022, 78, 103608. [Google Scholar] [CrossRef]
  12. Castellar, J.A.; Popartan, L.A.; Pueyo-Ros, J.; Atanasova, N.; Langergraber, G.; Säumel, I.; Corominas, L.; Comas, J.; Acuna, V. Nature-based solutions in the urban context: Terminology, classification and scoring for urban challenges and ecosystem services. Sci. Total Environ. 2021, 779, 146237. [Google Scholar] [CrossRef]
  13. Sims, N.C.; Newnham, G.J.; England, J.R.; Guerschman, J.; Cox, S.J.D.; Roxburgh, S.H.; Viscarra Rossel, R.A.; Fritz, S.; Wheeler, I. Good Practice Guidance. SDG Indicator 15.3.1, Proportion of Land That Is Degraded Over Total Land Area; Version 2.0; United Nations Convention to Combat Desertification: Bonn, Germany, 2021; ISBN 978-92-95118-35-5. [Google Scholar]
  14. Seddon, N.; Chausson, A.; Berry, P.; Girardin, C.A.; Smith, A.; Turner, B. Understanding the value and limits of nature-based solutions to climate change and other global challenges. Philos. Trans. R. Soc. B 2020, 375, 20190120. [Google Scholar] [CrossRef]
  15. Mikhailova, E.A.; Zurqani, H.A.; Lin, L.; Hao, Z.; Post, C.J.; Schlautman, M.A.; Brown, C.E. Disaggregating land degradation types for United Nations (UN) land degradation neutrality (LDN) analysis using the State of Ohio (USA) as an example. Earth 2024, 5, 255–273. [Google Scholar] [CrossRef]
  16. Downing, T.A.; Olago, D.O. History of ‘nature-based’solutions to land degradation in the savannahs of Kenya: An analysis of literature and archival records. Environ. Sci. Policy 2024, 161, 103874. [Google Scholar] [CrossRef]
  17. van der Zaan, T.; van ‘t Hof, S. Regeneration of Degraded Land with Nature-Based Solutions. In Design for Regenerative Cities and Landscapes: Rebalancing Human Impact and Natural Environment; Springer International Publishing: Cham, Switzerland, 2022; pp. 173–196. [Google Scholar]
  18. Multi-Resolution Land Characteristics Consortium—MRLC. Available online: https://www.mrlc.gov/ (accessed on 1 September 2024).
  19. Soil Survey Staff, Natural Resources Conservation Service, United States Department of Agriculture. n.d.a. Soil Survey Geographic (SSURGO) Database. Available online: https://www.nrcs.usda.gov/resources/data-and-reports/soil-survey-geographic-database-ssurgo (accessed on 14 September 2024).
  20. Soil Survey Staff, Natural Resources Conservation Service, United States Department of Agriculture. U.S. General Soil Map (STATSGO2). Available online: https://sdmdataaccess.sc.egov.usda.gov (accessed on 14 September 2024).
  21. ESRI (Environmental Systems Research Institute). ArcGIS Pro 2.6. Available online: https://pro.arcgis.com/en/pro-app/2.6/get-started/whats-new-in-arcgis-pro.htm (accessed on 14 October 2024).
  22. Hák, T.; Janoušková, S.; Moldan, B. Sustainable Development Goals: A need for relevant indicators. Ecol. Indic. 2016, 60, 565–573. [Google Scholar] [CrossRef]
  23. United Nations (UN) General Assembly. Global Indicator Framework for the Sustainable Development Goals and Targets of the 2030 Agenda for Sustainable Development; United Nations Statistics Division: New York, NY, USA, 2017; Available online: https://unstats.un.org/sdgs/indicators/indicators-list/ (accessed on 30 September 2024).
  24. United Nations (UN) General Assembly. Resolution 68/261. Fundamental Principles of Official Statistics. Resolution Adopted by the General Assembly on 29 January 2014. Available online: https://unstats.un.org/unsd/dnss/gp/fp-new-e.pdf (accessed on 14 September 2024).
  25. U.S. Bureau of the Census. Statistical Abstract of the United States: 1991; U.S. Bureau of the Census: Washington, DC, USA, 1991; p. 201.
  26. Anguelovski, I.; Corbera, E. Integrating justice in Nature-Based Solutions to avoid nature-enabled dispossession. Ambio 2023, 52, 45–53. [Google Scholar] [CrossRef]
  27. UN-Habitat, UN Statistics Division. SDG Indicator Metadata. 2021. Available online: https://unstats.un.org/sdgs/metadata/files/Metadata-15-03-01.pdf (accessed on 14 October 2024).
  28. Mills-Novoa, M.; Liverman, D.M. Nationally determined contributions: Material climate commitments and discursive positioning in the NDCs. Wiley Interdiscip. Rev. Clim. Chang. 2019, 10, e589. [Google Scholar] [CrossRef]
  29. Seddon, N.; Sengupta, S.; García-Espinosa, M.; Hauler, I.; Herr, D.; Rizvi, A.R. Nature-Based Solutions in Nationally Determined Contributions; IUCN: Gland, Switzerland; University of Oxford: Oxford, UK, 2019. [Google Scholar]
  30. The United States of America (No Date b) Reducing Greenhouse Gases in the United States: A 2030 Emissions Target. Available online: https://unfccc.int/sites/default/files/NDC/2022-06/United%20States%20NDC%20April%2021%202021%20Final.pdf (accessed on 14 December 2024).
  31. Georgetown Law. Georgetown Climate Center. State Adaptation Progress Tracker. Available online: https://www.georgetownclimate.org/adaptation/plans.html (accessed on 15 December 2024).
  32. Mikhailova, E.A.; Zurqani, H.A.; Lin, L.; Hao, Z.; Post, C.J.; Schlautman, M.A.; Post, G.C.; Shepherd, G.B. Accounting for climate and inherent soil quality in United Nations (UN) land degradation analysis: A case study of the state of Arizona (USA). Climate 2024, 12, 194. [Google Scholar] [CrossRef]
  33. Bogdzevič, K. Floods and nature-based solutions. A call for a legal approach. Curr. Opin. Environ. Sci. Health 2023, 36, 100521. [Google Scholar] [CrossRef]
  34. Pathak, A.; Hilberg, L.E.; Hansen, L.J.; Stein, B.A. Key considerations for the use of nature-based solutions in climate services and adaptation. Sustainability 2022, 14, 16817. [Google Scholar] [CrossRef]
  35. de Lemos, G.L.; de Aquino Eslabão, A.; dos Santos, J.F.; Rodrigues, A.T.; da Costa, L.F.; de Medeiros Costa, H.K.; Fagá, M.T.W.; dos Santos, E.M. Nature-based Solutions experiences: A Systematic Literature Review for public policies. Nat.-Based Solut. 2024, 5, 100121. [Google Scholar] [CrossRef]
  36. Thompson, A.; Bunds, K.; Larson, L.; Cutts, B.; Hipp, J.A. Paying for nature-based solutions: A review of funding and financing mechanisms for ecosystem services and their impacts on social equity. Sustain. Dev. 2023, 31, 1991–2066. [Google Scholar] [CrossRef]
  37. Vicarelli, M.; Sudmeier-Rieux, K.; Alsadadi, A.; Shrestha, A.; Schütze, S.; Kang, M.; Leue, M.; Wasielewski, D.; Mysiak, J. On the cost-effectiveness of Nature-based Solutions for reducing disaster risk. Sci. Total Environ. 2024, 947, 174524. [Google Scholar] [CrossRef]
  38. International Union for Conservation of Nature (IUCN). Issues Brief. July 2020. Available online: https://iucn.org/sites/default/files/2022-02/iucn_issues_brief_-_nbs_standard_eng.pdf (accessed on 16 September 2024).
  39. Lewis, S.L.; Maslin, M.A. Defining the Antropocene. Nature 2015, 519, 171–180. [Google Scholar] [CrossRef]
  40. National Oceanic and Atmospheric Administration (NOAA). Climate.gov. Available online: https://www.climate.gov/maps-data (accessed on 16 September 2024).
  41. White House Council on Environmental Quality. Opportunities for Accelerating Nature-Based Solutions: A Roadmap for Climate Progress, Thriving Nature, Equity, and Prosperity; Report to the National Climate Task Force; The White House: Washington, DC, USA, 2022.
  42. United Nations. Environment Assembly, Resolution: Nature-Based Solutions for Supporting Sustainable Development; UNEP: Nairobi, Kenya, 2022. [Google Scholar]
  43. Simpson, D.; United Nations Environment Programme. The Economics of Nature-Based Solutions: Current Status and Future Priorities; United Nations Environment Programme: Nairobi, Kenya, 2020. [Google Scholar]
  44. Griscom, B.W.; Adams, J.; Ellis, P.W.; Houghton, R.A.; Lomax, G.; Miteva, D.A.; Schlesinger, W.H.; Shoch, D.; Siikamäki, J.V.; Smith, P.; et al. Natural climate solutions. Proc. Natl. Acad. Sci. USA 2017, 114, 11645–11650. [Google Scholar] [CrossRef]
  45. Fargione, J.; Hill, J.; Tilman, D.; Polasky, S.; Hawthorne, P. Land clearing and the biofuel carbon debt. Science 2008, 319, 1235–1238. [Google Scholar] [CrossRef]
  46. Parrotta, J.A.; Wildburger, C.; Mansourian, S. Understanding Relationships between Biodiversity, Carbon, Forests and People: The Key to Achieving REDD+ Objectives. A Global Assessment Report Prepared by the Global Forest Expert Panel on Biodiversity, Forest Management and REDD+; IUFRO World Series; IUFRO: Vienna, Austria, 2012; Volume 31. [Google Scholar]
  47. Baldocchi, D.; Penuelas, J. The physics and ecology of mining carbon dioxide from the atmosphere by ecosystems. Glob. Change Biol. 2019, 25, 1191–1197. [Google Scholar] [CrossRef]
  48. Sowińska-Świerkosz, B.; García, J. A new evaluation framework for nature-based solutions (NBS) projects based on the application of performance questions and indicators approach. Sci. Total Environ. 2021, 787, 147615. [Google Scholar] [CrossRef] [PubMed]
  49. Debele, S.E.; Leo, L.S.; Kumar, P.; Sahani, J.; Ommer, J.; Bucchignani, E.; Vranić, S.; Kalas, M.; Amirzada, Z.; Pavlova, I.; et al. Nature-based solutions can help reduce the impact of natural hazards: A global analysis of NBS case studies. Sci. Total Environ. 2023, 902, 165824. [Google Scholar] [CrossRef] [PubMed]
Figure 1. A conceptual framework for planning nature-based solutions (NBS) involves the identification of the global challenge that needs to be addressed, followed by a feasibility analysis and determination of context and site-specific NBS.
Earth 06 00017 g001
Figure 2. Potential land for nature-based solutions (NBS) can be defined as the sum of the individual areas of barren, shrub/scrub, and herbaceous land covers, which are linked to climate and inherent soil quality (SQ) (adapted from Mikhailova et al. 2024 [15]).
Earth 06 00017 g002
Figure 3. Land cover map of the contiguous United States of America (USA) for 2021 (based on data from the Multi-Resolution Land Characteristics Consortium (MRLC) [18]). Land cover types show large areas of anthropogenic land degradation (e.g., hay/pasture, cultivated crops, developed, and barren land). Inherent land degradation is difficult to identify through remote sensing techniques because it is largely based on soil and climate.
Earth 06 00017 g003
Figure 4. Actual potential land for nature-based solutions (NBS), as newly proposed, is the difference between the total potential land for NBS (barren, shrub/scrub, and herbaceous land covers) and inherently degraded land (inherently degraded land: soil suitability based on soil types), which is directly linked to inherent soil quality (SQ) and impacted by climate and climate change (adapted from Mikhailova et al. 2024 [15]). Barren lands are both potential areas for NBS and anthropogenically or inherently degraded lands.
Earth 06 00017 g004
Figure 5. Examples of potential land for nature-based solutions (NBS) for the state of New Mexico (NM) were identified by using classified satellite images from the Multi-Resolution Land Characteristics Consortium (MRLC) with detailed descriptions of the land classes [18], including the barren, shrub/scrub, and herbaceous land covers.
Earth 06 00017 g005
Table 1. The organizational framework for including potential land for nature-based solutions (NBS) into the United Nations (UN) Sustainable Development Goal (SDG) 15 and Target 15.3 (adapted from Hák et al. (2016) [22]; Assembly, U.G. (2017) [23]).
United Nations (UN) Sustainable Development Goal (SDG), Target, and Indicator 1
United Nations Sustainable Development Goal 15. Protect, restore and promote sustainable use of terrestrial ecosystems, sustainably manage forests, combat desertification, and halt and reverse land degradation and halt biodiversity loss.
Target 15.3 By 2030, combat desertification, restore degraded land and soil, including land affected by desertification, drought and floods, and strive to achieve a land degradation neutral world.
Current Indicator 15.3.1 Proportion of land that is degraded over total land area.
Current Sub-indicator: Land cover trends.
This study—Determining potential land for nature-based solutions (NBS) to evaluate the potential to compensate for LD:
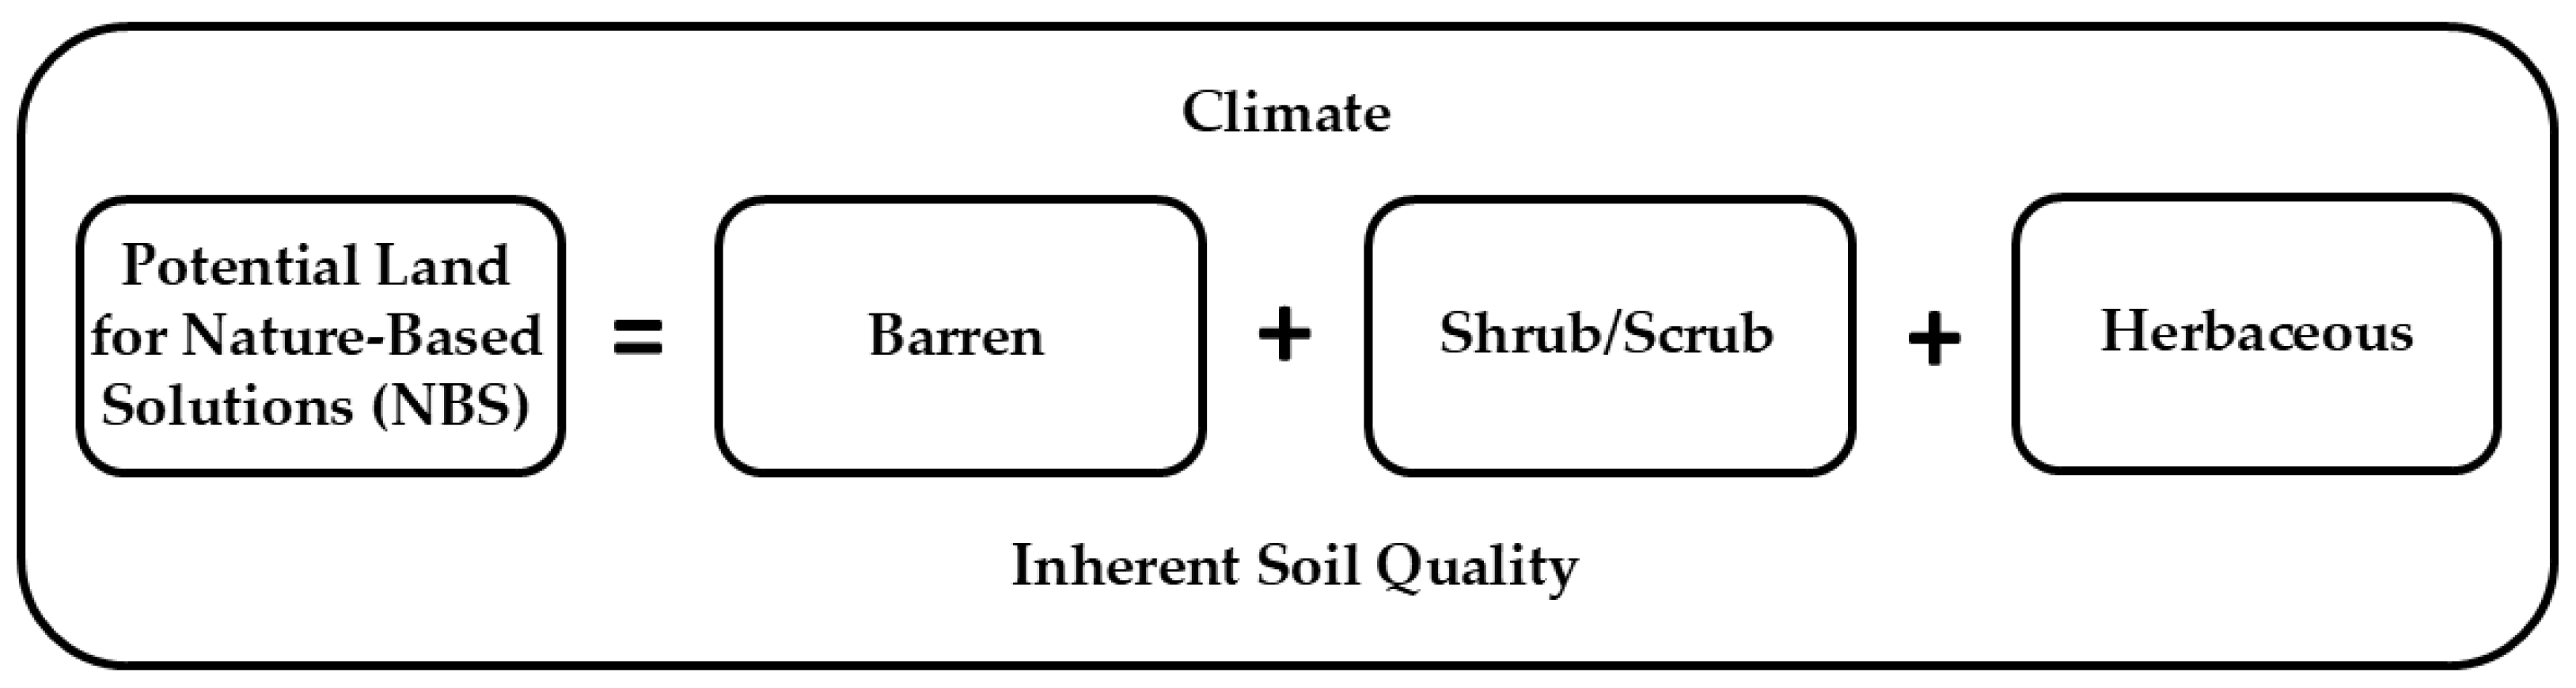
1. Determination of potential land for NBS based on land cover, which is disaggregated by different available land covers (barren, shrub/scrub, and herbaceous land covers), soil types, administrative units, and trends over time to determine changes in NBS (Metric: area, %; Scale: local, regional, national, global; Measurement frequency: annual).
2. Determination of the actual potential land for NBS by using the difference between the total potential land area for NBS and the total area of inherently degraded land (IDL) (Metric: area; Scale: local, regional, national, global; Measurement frequency: annual).
1 Sustainable Development Goal indicators should be disaggregated, where relevant, by income, sex, age, race, ethnicity, migratory status, disability and geographic location, or other characteristics, in accordance with the Fundamental Principles of Official Statistics, United Nations (UN) Resolution 68/261 [24].
Table 2. Anthropogenic land degradation (LD) and potential land for nature-based solutions (NBS) in the contiguous United States of America (USA) in 2021. Percent area changes from 2001 to 2021 are shown in parentheses.
State (Region),
Proportion of Private Land [25]
Anthropogenic Land Degradation (LD)Anthropogenic
Land Degradation from Total Area
Potential Land for Nature-Based
Solutions (NBS)
Actual Potential Land for Nature-Based
Solutions (Actual NBS)
Difference
(NBS − Anthropogenic LD)
Actual Difference
(Actual NBS − Anthropogenic LD)
%km2 (%)%km2 (%)km2 (%)km2km2
Connecticut (93.8)3930.9 (+12.3)32.2191.8 (+35.2)1.6 (+19.8)−3739.1−3929.3
Delaware (92.6)2378.8 (+1.4)59.039.8 (−47.0)0.4 (+1.6)−2338.9−2378.4
Massachusetts (93.7)5450.1 (+11.4)31.5431.7 (+25.3)49.4 (+83.1)−5018.5−5400.7
Maryland (92.4)11,364.9 (+3.2)50.0307.5 (−8.0)23.2 (+3.8)−11,057.4−11,341.7
Maine (94.3)6838.9 (+4.7)9.03331.6 (−15.9)2603.3 (−17.3)−3507.2−4235.6
New Hampshire (82.0)2743.3 (+11.1)14.5545.7 (+9.5)315.0 (+6.3)−2197.6−2428.3
New Jersey (81.7)8016.1 (+6.0)46.1284.9 (−7.9)56.2 (−14.8)−7731.1−7959.9
New York (62.9)39,462.8 (+2.1)32.71718.5 (+15.2)698.8 (−1.1)−37,744.2−38,764.0
Pennsylvania (83.9)39,826.4 (+4.3)36.31815.6 (+6.6)313.2 (+37.3)−38,010.8−39,513.2
Rhode Island (98.5)958.5 (+10.3)36.1126.3 (+73.1)4.0 (+250.7)−832.2−954.5
Vermont (84.2)4700.2 (+3.1)20.3293.0 (+28.7)161.9 (+8.0)−4407.2−4538.3
West Virginia (83.5)9896.7 (+6.9)16.01807.5 (+26.0)309.9 (+32.4)−8089.2−9586.8
(East)135,567.6 (+4.4)27.810,893.9 (+2.8)4536.9 (−7.1)−124,673.4−131,030.7
Iowa (97.2)126,637.3 (+0.3)88.72864.0 (−8.0)2140.3 (−7.4)−123,773.3−124,497.0
Illinois (95.9)101,987.1 (+0.5)82.2735.1 (+12.8)545.3 (+14.4)−101,252.1−101,441.8
Indiana (95.5)60,698.4 (+0.5)73.3793.5 (+16.4)563.7 (+10.7)−59,904.9−60,134.7
Michigan (71.9)54,104.5 (+1.9)37.65316.1 (−8.5)4207.9 (−8.2)−48,788.5−49,896.6
Minnesota (76.5)96,342.2 (+4.2)56.93057.7 (−8.9)2099.5 (−9.6)−93,284.4−94,242.7
Missouri (88.8)103,335.2 (+2.0)59.52170.5 (+104.2)1405.7 (+117.8)−101,164.7−101,929.5
Ohio (95.8)54,037.7 (+0.9)67.5869.3 (+24.2)493.9 (+29.0)−53,168.4−53,543.8
Wisconsin (82.2)53,897.8 (+0.8)44.71729.3 (−18.4)1054.0 (−20.4)−52,168.5−52,843.8
(Midwest)651,040.2 (+1.4)62.815,806.2 (+0.2)12,510.3 (−0.3)−633,504.8−638,529.9
Arkansas (82.7)40,153.7 (−0.2)41.94687.6 (+52.5)693.9 (+51.6)−35,466.1−39,459.8
Louisiana (89.3)23,750.6 (−1.4)32.24257.3 (−18.3)1819.2 (−20.1)−19,493.3−21,931.4
Oklahoma (95.4)60,818.5 (+1.6)35.969,213.9 (−0.2)48,291.0 (−0.5)8395.4−12,527.5
Texas (95.8)163,209.1 (+5.2)29.4313,678.9 (−2.5)187,972.9 (−3.2)150,469.824,763.8
(South Central)287,931.9 (+3.1)32.2391,837.7 (−1.9)238,777.0 (−2.8)103,905.8−49,154.9
Alabama (92.9)33,069.0 (−3.0)25.611,218.4 (−3.1)629.8 (−4.0)−21,850.6−32,439.2
Florida (70.8)47,411.5 (+2.2)37.010,125.9 (−1.9)3192.7 (−13.6)−37,285.6−44,218.8
Georgia (90.3)43,578.7 (+3.7)29.712,939.8 (+17.8)1326.7 (+19.7)−30,638.9−42,252.0
Kentucky (88.2)41,750.2 (+1.8)44.11887.6 (+29.2)589.6 (+71.8)−39,862.6−41,160.6
Mississippi (89.1)38,602.2 (+8.0)32.77441.2 (−8.3)1718.9 (−2.8)−31,161.0−36,883.3
North Carolina (85.4)42,396.3 (+3.9)34.96734.5 (+8.1)697.0 (+4.9)−35,661.7−41,699.3
South Carolina (88.2)21,282.7 (+2.4)27.96931.4 (+15.8)652.4 (−3.5)−14,351.3−20,630.3
Tennessee (85.9)42,966.4 (+1.4)42.62739.1 (+13.7)515.5 (+55.8)−40,227.3−42,450.9
Virginia (82.9)30,505.9 (+3.5)31.45788.4 (+43.7)523.5 (+49.9)−24,717.5−29,982.4
(Southeast)341,562.9 (+2.7)33.765,806.3 (+7.7)9846.1 (+2.6)−275,756.5−331,716.8
Colorado (56.7)33,219.4 (+6.1)19.396,121.0 (+0.6)43,863.0 (+0.9)62,901.610,643.6
Kansas (98.1)124,100.6 (+1.6)60.570,871.3 (−2.8)59,251.1 (−3.2)−53,229.4−64,849.5
Montana (62.5)64,890.6 (+17.2)20.1196,127.5 (−2.5)94,625.1 (−4.5)131,236.829,734.5
North Dakota (90.9)111,439.1 (+5.2)64.051,189.4 (−9.9)41,063.3 (−11.3)−60,249.7−70,375.8
Nebraska (97.2)84,610.0 (+4.8)43.1102,817.9 (−3.6)34,830.1 (−6.5)18,207.9−49,779.9
South Dakota (91.1)85,823.1 (+7.2)45.693,197.8 (−5.8)57,389.8 (−7.8)7374.7−28,433.3
Wyoming (44.1)7922.6 (+26.2)5.3121,469.0 (−0.7)33,954.7 (−1.2)113,546.326,032.1
(Northern Plains)512,005.4 (+6.3)36.3731,793.9 (−3.0)364,977.1 (−4.9)219,788.2−147,028.3
Arizona (43.2)11,354.7 (+9.6)8.6108,411.7 (0.0)15,677.3 (+2.8)97,057.04322.6
California (47.9)33,782.6 (+5.8)19.987,910.9 (+10.7)42,231.0 (+6.9)54,128.38448.4
Idaho (29.6)26,213.2 (+5.2)17.879,451.2 (+0.2)45,865.6 (−0.8)53,238.119,652.4
New Mexico (52.6)10,265.7 (+17.0)4.0216,241.3 (−0.3)63,525.1 (+0.2)205,975.553,259.4
Nevada (12.2)9911.6 (+1.9)4.3201,653.0 (+0.0)44,427.4 (+1.2)191,741.434,515.8
Oregon (39.6)25,875.6 (+1.1)16.771,310.6 (0.0)45,652.0 (+1.8)45,434.919,776.4
Utah (24.8)14,457.9 (+3.0)14.175,242.7 (+1.0)15,234.1 (+5.6)60,784.7776.2
Washington (58.1)32,570.3 (+1.5)28.936,010.2 (+1.6)25,358.4 (+2.5)3439.9−7211.9
(West)164,431.6 (+4.4)12.6876,231.6 (+1.1)297,970.9 (+1.9)711,799.8133,539.3
Totals2,092,539.0 (+3.4)34.12,094,099.1 (−0.7)928,618.0 (−2.1)1559.2−1,163,921.0
Note: Anthropogenically degraded land was calculated as the sum of degraded land from agriculture (hay/pasture, and cultivated crops), from development (developed, open space; developed, low intensity; developed, medium intensity; developed, high intensity), and barren land. Potential land for nature-based solutions (NBS) is limited to barren land, shrub/scrub, and herbaceous land cover classes, to provide potential land areas without changing other land uses. Inherently degraded land was considered as areas of Entisols, Inceptisols, Ultisols, and Aridisols (when present). Actual potential land for NBS was calculated by subtracting the inherently degraded land from the potential land for NBS. Change in the area was calculated using the following method: ((2021 Area − 2001 Area)/2001 Area) × 100%.
Table 3. Anthropogenic land degradation (LD) status and potential land for nature-based solutions (NBS) by soil order for the contiguous United States of America (USA) in 2021. Percent area changes from 2001 to 2021 are shown in parentheses. Reported values have been rounded; therefore, calculated sums and percentages may exhibit minor discrepancies.
Soil OrderTotal AreaAnthropogenically
Degraded Land
Potential Land for Nature-Based
(NBS) Solutions
Difference
(NBS − Anthropogenic LD)
km2%km2 (%)km2 (%)km2
Slightly Weathered Soils
1,743,80528.4371,482 (+3.6)     636,824 (+0.7)                 265,343                
Entisols819,17013.3182,794 (+3.8)    455,868 (−1.0)                273,074                
Inceptisols767,97312.5173,900 (+3.5)    168,327 (+4.9)                −5573                
Histosols97,3661.611,966 (+0.1)    1462 (−7.5)                −10,504                
Andisols59,2961.02822 (+9.5)    11,167 (+15.0)                8345                
Moderately Weathered Soils
3,451,51156.21,449,576 (+3.6)     1,389,498 (−1.9)                 −60,080                
Aridisols537,7608.847,818 (+9.0)    485,106 (−1.2)                437,287                
Vertisols157,7522.675,954 (+17.8)    57,635 (−4.4)                −18,320                
Alfisols1,055,77017.2505,881 (+1.9)    180,292 (+1.1)                −325,589                
Mollisols1,700,22927.7819,923 (+3.3)    666,465 (−2.9)                −153,459                
Strongly Weathered Soils
949,32615.5271,482 (+2.2)     67,779 (+9.8)                 −203,704                
Spodosols207,9123.433,031 (+5.1)    11,598 (−9.4)                −21,434                
Ultisols741,41412.1238,451 (+1.9)    56,181 (+14.8)                −182,270                
All Soils
Totals6,144,640100.02,092,540 (+3.4)     2,094,099 (−0.7)                 1559                
Note: Entisols, Inceptisols, Andisols, Aridisols, Vertisols, Alfisols, Mollisols, Spodosols, and Ultisols are mineral soils. Histosols are mostly organic soils. Anthropogenically degraded land was calculated as the sum of degraded land from agriculture (hay/pasture and cultivated crops), from development (developed, open space; developed, low intensity; developed, medium intensity; developed, high intensity), and barren land. Potential land for nature-based solutions (NBS) is limited to barren land, shrub/scrub, and herbaceous land cover classes, to provide potential land areas without changing other land uses. Change in the area was calculated using the following method: ((2021 Area − 2001 Area)/2001 Area) × 100%.
Disclaimer/Publisher’s Note: The statements, opinions and data contained in all publications are solely those of the individual author(s) and contributor(s) and not of MDPI and/or the editor(s). MDPI and/or the editor(s) disclaim responsibility for any injury to people or property resulting from any ideas, methods, instructions or products referred to in the content.

