Abstract
The Circular Economy set a frame to govern sustainable growth. Laspias river basin (Thrace) is characterized by various land and water uses and pressures posed directly and/or indirectly on the riverine system which acts as a burdened receptor. The aim is to prioritize threats in the basin and to further recognize the causality relationships in main elements affecting water management parameters that fall upon circular economy using enhanced DPSIR, Decision Making Trial and Evaluation Laboratory (DEMATEL) techniques. To assess the status quo, circular economy principles were adopted using a sustainable water management perspective embedded in DPSIR to link the causes and effects components. The key criteria based on the cause-factors were mined simplifying the multicriteria analysis of the effects. Findings highlight the multiplicity of pressures and origin of the impacts. This method proved as a valuable tool to track threats prior to stakeholder mapping for participatory management.
1. Introduction
The Circular Economy set a brand-new frame to govern the ways growth can be achieved shifting to renewable energy sources and resources utilization [1,2,3]. Although the six Rs (reuse-reduce-recycle-reclaim-recover-restore) have much connectivity with the environmental stewardship and the Food-Water-Energy nexus, its implementation in river water management planning is not well studied. While water ecosystems act as receptors of wastes and by-products and are further affected by wide range of economic activities, the idea that the Rs can support resource saving in favor of the environment without affecting productivity is long stated [4]. There, its usefulness lies on optimization of water demand, investment on reusable water, regeneration of natural systems and crises mitigation [5] assisting the complex and challenging nature of integrated river basin management. So, these challenges demand a holistic management approach, adopting the circular economy frame aiming finally towards the well-being of the society.
The circular model is actually based on three principles: (a) designing out waste and pollution, (b) keeping products and materials in use, and (c) regenerating natural systems [6]. Managing freshwater resources under the principles of circular economy, regardless if these flows naturally or diverted, stored or included in supply and food-energy chain, is a rather complicated task [7]. This implies that a deep understanding of the functioning of the water system is needed and its interaction with the social system is the basis of a set of “remission-requiring” solutions with broad acceptance. Participatory approach with stakeholder engagement is necessary in management, aiming to bring their knowledge on table, though a “common language” needs to be spoken. So, a detailed matrix of relations is needed prior to stakeholder engagement [8] to properly address the six Rs within water stewardship and the food-water-energy nexus.
Relations chains and causal loop diagrams can offer a clear representation of the system under investigation. Generally, the strength of connection, the timing of interactions and types of feedback loops can also be marked [9,10,11]. Conceptual models are acknowledged to assist decision making through information grouping and communication facilitation. The DPSIR model is an analytical framework for determining pressures and impacts also applied in the Water Framework Directive [12,13,14]. It is a convenient logical frame [15] assisting water resources modeling due to its ability to endorse quantifiable (or not) indicators [16]. Enhanced DPSIR causal network model (eDPSIR) can provide insight into the complicated causality of the environmental indicators since it endorses mathematical techniques for quantitative exploration of the environmental dimensions [17,18].
The Decision-Making Trial and Evaluation Laboratory (DEMATEL) is a long-existing and well-tested technique/model [19] able to track and highlight the inter-relations among different scales of indicators as presented in an eDPSIR model. DEMATEL, after building a cause-effect network, can model and quantify relevant degrees and relationships between various elements of the system [20]. According to Azarniv and Chitsaz [18], the steps in such an application are firstly to select key indicators of eDPSIR as evaluation criteria for the water management testing. Apart from causality relation, weights can also be attributed according to the task [18]. Then the inclusion of stakeholders’ different interests is inserted as part of the solution in the Responses.
Laspias river watershed is located in Xanthi Prefecture, Thrace District, North Greece (24°53′ E and 40°59′ N) (Figure 1). The watershed’s surface area is about 211.97 km2 and the river itself is about 30 km long. The basin is characterized by various land and water uses and pressures posed directly and/or indirectly on the riverine system. The river itself is a heavily modified system acting as a burdened receptor. Main water use is agricultural and main pressures come from peri-urban areas which host various activities besides agricultural areas as landfills, WWTP outflowing in the river, military action fields, and industrial areas. Water availability is also affected by seasonality and most torrential flows are unable to be exploited. Nonetheless, some parts are protected by Natura 2000 and Ramsar. Unfortunately, the waterbody is not widely researched so there lies a gap of information.
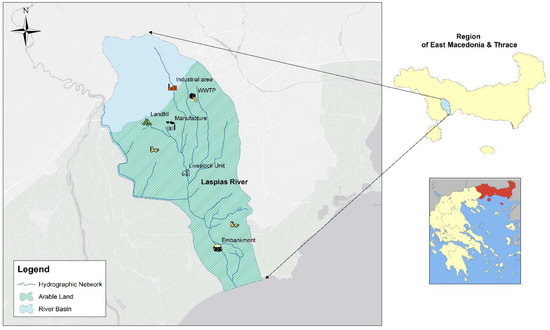
Figure 1.
Study area of Laspias river basin with annotated the main pressure points.
Acknowledging the importance and variety of pressures on the one hand and the importance of the river for the local economy, the main aim is to prioritize threats in the given basin and to further identify the causality relationships in main elements affecting water management parameters that fall upon circular economy using the combination of eDPSIR and DEMATEL. The task is to preliminary test the sustainability of such a case study and then include all aspects deriving from the major Driving Forces that relate with the circular economy agenda and are grouped under the three main circular economy principles. This is a primer step for the inclusion of stakeholders in a participatory management as part of the Eye4Water programme dealing with the strengthening of the water management practices (in Thrace) through the development of innovative ICT methodologies and improvement of research infrastructures.
2. Methodological Approach
2.1. DPSIR and Incators Setting
To assess the status quo of this particular area that has not been much studied, a systematic literature review and a content analysis (evidence synthesis) [21] were carried out during the first phase of Eye4Water project. All relevant documented information was collected, including research articles, technical studies, reports, databases and grey literature and the basic information was decoded using systematic review method so as to create a managemental hypermatrix (to be published). Coming to the science-policy interaction [22], we went through circular economy principles using a sustainable water management perspective inspired by the “water and circular economy white paper”.
In DPSIR application several adjustments were made while also, before the fuzzy analysis, there was a pre-clustering for proper indicators inclusion:
- In Driving forces, the three principles of the circular economy were applied to group the indicators (a) waste and pollution, (b) products and materials, (c) natural systems.
- In Pressures, we adopted the four categories for systemic analysis exerted and governed by the main water-users; environment, agriculture, industry and municipality.
- State and Impact included only indicators reflecting simultaneously the status quo and elements affecting circular economy-related water management.
- As Responses, only the main stakeholders (operators) groups are addressed without having the responsibility of naming the variety of measures that can be undertaken, i.e., address each organization’s place in the projected global and local demands for water. That is mostly because the solution differs in scale and impact depending on the type and extent of use. Seeking to serve the six Rs of circular economy in water, it is also important alongside to actively look for collaborative opportunities with local or regional stakeholders.
2.2. DEMATEL Method
Based on the experience the chain diagram created by the DPSI (without the Responses), cause-effect is presented in Figure 2. In this study a directed graph without loops and obviously without multiple edges is used. Then the Adjacency matrix D is created which indicates the causality between several factors. Since a directed graph is produced the adjacency matrix is not symmetric. The elements dij (i ≠ j) different to zero reflect the impact of the i-th object on the j-th object. For this research, only the causality was under review and for this reason, only two values were considered, zero and one.
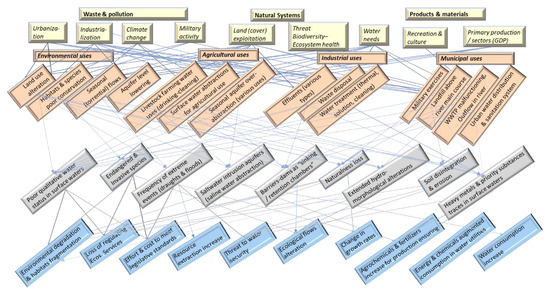
Figure 2.
Causal web among eDPSIR indicators.
The second step was the evaluation of the normalized initial direct-relation matrix (matrix D). Therefore, the next step was attaining the total-relation matrix (matrix T) as follows:
The totalinfluence matrix T can be interpreted as the direct effects and all of the indirect effects. The physical meaning can be extracted from the graph theory.
Then, vectors R and J, representing the sum of the rows and the sum of the columns from the total-influence matrix T, are calculated as follow:
In DEMATEL approach, the elements are separated into two main- groups including the causes and effects [23]. To illustrate these groups, a cause and effect graph should be plotted by mapping the dataset of (R + J, R − J). The horizontal axis, is named prominence, while the vertical axis, representing the net influence of the matrix T, is called relation [20,21]. If (Ri – Ji > 0), then the criterion can be assumed a net cause.
Furthermore, to highlight the importance among synergies in the steps affecting the State of DPSIR, meaning Driving Forces and Pressures, and to generate weights only in causality relations the Kobryń DEMATEL method [24] was applied for Driving forces and Pressure with State as ultimate causality receiver. Hence, the produced weights are determined as proportional to the average value of the appropriate pair of indicators ti+ and ti:
To assess the normalized weights the following equation can be exploited:
3. Results and Discussion
Having described the procedure, the main groups, subgroups and (quantifiable) indicators selected for DEMATEL analysis are presented in Table 1. This matrix is pressure-based, driver-oriented. Then, all the indicators of higher category were linked to one or more indicators of the next category as seen in Figure 2 and based on the quantification of their relation, their cause-effect diagram is presented in Figure 3. Quadrant I (QI) includes the most significant factors, mainly Driving forces and Pressure, with the most influence as cause factors (Figure 3). These indicators have higher prominence and gather the majority of causality links: urbanization, industrialization, land exploitation, water needs, land use alteration, seasonal flows, livestock farming water uses, surface water abstractions for agricultural use, landfill above river main course, WWTP malfunctioning, outflow in the river, endangered and invasive species, frequency of extreme events.

Table 1.
eDPSIR subgroups and indicators for Laspias river included in DEMATEL analysis.
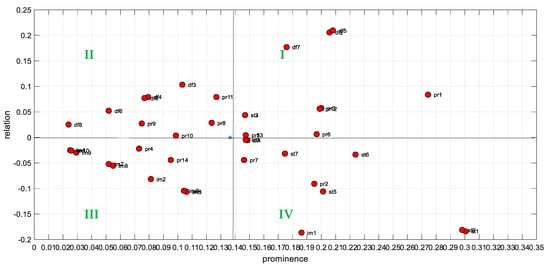
Figure 3.
Cause and effect diagram among all eDPSIR indicators for Laspias river. Where; df: driving force, pr: pressure, st: status, im: impact.
Quadrants II (QII) and III (QIII) are more “disconnected” and autonomous, with lower influence, and contain some lesser Driving Forces (e.g., Climate change, Recreation and Culture, Primary production/sectors) Pressures (e.g., Military exercises, Effluents, Waste disposal, Water treatment) and the majority of Impact indicators/factors, being gathered in QIII (Figure 3). Despite the significands of the climate change phenomenon since to act like an indirect force whilst other factors affect directly the web of pressures in circular economy matters. Quadrant IV (QIV) has high prominence and low causality (intertwined receivers), gathering the majority of State indicators/factors (e.g., Land use alteration & naturalness loss) (Figure 3), meaning the ones that are impacted by other factors and cannot be directly improved or addressed [25].
Kobryń weights [24] were further applied by reducing the number of relations, to check the influence factors by enhancing the parameters’ role in such application. This secondary analysis took place to simplify the causal web and to assess the importance of major influencing factors (i.e., the indicators included in Driving Forces and Pressures). This assists the prioritization of management measures (Responses), since only causal links are taken into account by this method. It is noted that the last level of factors is always attributed zero (0) weights, meaning the State factors, which complies with the aim of such method (Figure 4).
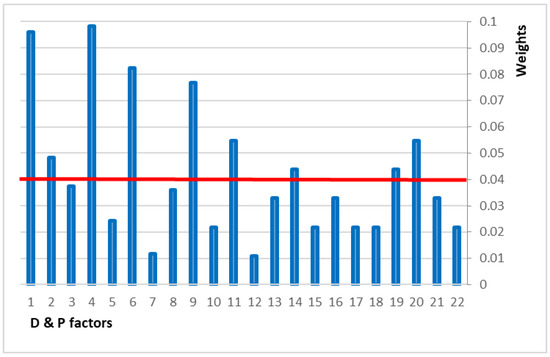
Figure 4.
Assessment of the weights regarding the DPS factors. The numbers of factors (x axis) correspond to those given in brackets in Table 1 for Driving Forces and Pressures. The 0.04 is the importance threshold set by expert judgement.
That is, tij = 0, for i belongs to the last level of analysis by supposing directed graphs without loops. The analysis is based on Equations (3) and (4) [24]. Another interesting point is that based on the assessment of the weights, the decision maker can put more emphasis on the factors with higher weights, e.g., greater than 0.04 (Figure 4) as decided in this research, a threshold adopted by expert judgement. Even if this threshold is rather subjective (but not the calculation of the weights), this selection can be found in other articles too (e.g., [18]).
Hence urbanization, industrialization, climate change, land exploitation, water needs, land use alteration, seasonal flows, surface water abstractions for agricultural use, military exercises and landfill above river main course can be selected as more determinant factors regarding the Driving forces and Pressures. This couples the findings of QI with the basic DEMATEL application, confirming the major drivers of this basin’s problem, but enhances more the role of climate change.
Altering the analysis results in managerial knowledge, the Driving Forces that trigger more pressures are: urbanization, industrialization, climate change, land exploitation and water needs. This means that, the directly concerned Circular Economy pillars are firstly “waste and pollution elimination” and secondly the effect on “natural systems regeneration” acknowledging that “production and materials circulation” does not alleviate pressure posed on the system. Though, the Pressures affected by multiple Driving forces co-hinder by multiplying their negative effect on the ecological status in both quantitative and qualitative point of view are: land use alteration, seasonal flows, surface water abstractions for agricultural use and the landfill above the river main course. In turn, the State with augmented severity, characterized for “inflicted” impacts are primarily the poor qualitative water status, the heavy metals existence, the saltwater intrusion, the barriers and other hydromorphological alterations, along with the naturalness loss.
This analysis revealed synergistic problems from the resource use. In order to address these challenges posed on an already degraded river and a basin under multiple pressures the target category needs to be found. So, from all the actors as named in Responses of the eDPSIR model, the major part of the burden must be supported by the government and local authority with the support of the academia and secondly the production chain. The role of actors, mainly industry goes deep in the value chain to maintain or enhance the primary resources value and productivity [26]. It is easy to suggest individual measures (mostly technical) to counteract separately each pressure and/or impact, since countless have been proposed over the last 15 years but is of primer importance to pick which of the six Rs could support the most our attempt. So, of the 6Rs of circular economy, the reuse, reduce, reclaim and restore measures hold the leading role of the solution addressing Impacts to ameliorate probably the State. The solution, though, needs to be found in how the Driving forces exploit the natural resources. In simple words, maximize resource efficiency and treat byproducts for reuse, or at least safe return to the environment should be promoted.
Such an approach surpasses linear economy and classical mechanics in water management and requires a major transformation of the current production and consumption patterns simultaneously with sustainable management and minimization of grey infrastructure. Researchon the circular economy is currently fragmented across various disciplines and there are often different perspectives and interpretations of the concept [27].
In conclusion, this research encompassed circular economy principles in an eDPSIR model for DEMATEL to provide a qualitative approach for system analysis and threat prioritization. The causality relation showed more synergistic than antagonistic role of the influencing factors/indicators. The only antagonism seems to be for the water resource leading to ecosystem deterioration. The above context of analyses support mitigation hierarchy in water management and enhancing measures efficiency. Eye4Water intends to include stakeholders from all categories, which will offer the possibility for weighted feedback loops, either balancing or reinforcing [9,10,11].
Author Contributions
Conceptualization, D.L.; methodology, D.L. and M.S.; software, M.S.; validation, D.L., I.K. and M.S.; formal analysis, T.B. and M.S.; investigation, D.L.; resources, I.K.; data curation, T.B.; writing—original draft preparation, D.L. and M.S.; writing—review and editing, D.L., I.K. and M.S.; supervision, I.K. All authors have read and agreed to the published version of the manuscript.
Funding
The research was funded by Eye4Water project (eye4water.com). Implemented under the action: “Support for Research Infrastructure and Innovation” by the Operational Program “Competitiveness, Entrepreneurship and Innovation” in the framework of the Co-financed by Greece and the European Union-European Regional Development Fund.
Institutional Review Board Statement
Not applicable.
Informed Consent Statement
Not applicable.
Data Availability Statement
Not applicable.
Acknowledgments
The authors would like to express their gratitude towards A. Mirli, C. Bakalakou, Ch. Ntislidou, K. Basdeki and N. Ioannidou for their work in literature scoping review and map production.
Conflicts of Interest
The authors declare no conflict of interest.
References
- McDonough, W.; Braungart, M. Design for the triple top line: New tools for sustainable commerce. Corp. Environ. Strategy 2002, 9, 251–258. [Google Scholar] [CrossRef]
- EC, Communication from the Commission to the European Parliament, the Council, the European Economic and Social Committee and the Committee of the Regions. Towards a Circular Economy—AZero Waste Programmefor Europe, COM 2014, 398 Final. Available online: https://www.oecd.org/env/outreach/EC-Circular-econonomy.pdf (accessed on 3 December 2021).
- Pantzar, M.; Suljada, T. Delivering a Circular Economy within the Planet’s Boundaries: An Analysis of the New EU Circular Economy Action Plan; Institute for European Environmental Policy (IEEP) and Stockholm Environment Institute (SEI): Brussels, Belgium; Stockholm, Sweden, 2020; p. 30. [Google Scholar]
- EC, Communication from the Commission to the European Parliament, the Council, the European Economic and Social Committee and the Committee of the Regions. Roadmap to a Resource Efficient Europe, COM 2011, 571 Final. Available online: https://www.europarl.europa.eu/meetdocs/2009_2014/documents/com/com_com%282011%290571_/com_com%282011%290571_en.pdf (accessed on 3 December 2021).
- Smol, M.; Adam, C.; Preisner, M. Circular economy model framework in the European water and wastewater sector. J. Mater. Cycles Waste Manag. 2020, 22, 682–697. [Google Scholar] [CrossRef]
- Ogunmakinde, O.E.; Sher, W.; Egbelakin, T. Circular economy pillars: A semi-systematic review. Clean. Technol. Environ. Policy 2021, 23, 899–914. [Google Scholar] [CrossRef]
- Mutikanga, H.E.; Sharma, S.K.; Vairavamoorthy, K. Multi-criteria decision analysis: A strategic planning tool for water loss management. Water Resour. Manag. 2011, 25, 3947–3969. [Google Scholar] [CrossRef]
- Roos Lindgreen, E.; Salomone, R.; Reyes, T. A critical review of academic approaches, methods and tools to assess circular economy at the micro level. Sustainability 2020, 12, 4973. [Google Scholar] [CrossRef]
- Sterman, J. Business Dynamics: Systems Thinking and Modeling for a Complex World; McGraw-Hill: New York, NY, USA, 2002; p. 982. [Google Scholar]
- Mirchi, A.; Madani, K.; Watkins, D.; Ahmad, S. Synthesis of system dynamics tools for holistic conceptualization of water resources problems. Water Resour. Manag. 2012, 26, 2421–2442. [Google Scholar] [CrossRef]
- Coletta, V.R.; Pagano, A.; Pluchinotta, I.; Fratino, U.; Scrieciu, A.; Nanu, F.; Giordano, R. Causal Loop Diagrams for supporting Nature Based Solutions participatory design and performance assessment. J. Environ. Manag. 2021, 280, 111668. [Google Scholar] [CrossRef] [PubMed]
- EC. Directive 2000/60/EC of the European Parliament and of the Council of 23 October 2000 establishing a framework for community action in the field of water policy. Off. J. Eur. Communities 2000, L327, 1–73. [Google Scholar]
- EC. Common Implementation Strategy for the Water Framework Directive (2000/60/EC): Guidance Document No. 3 Analysis of Pressures and Impacts; Office for Official Publications of the European Communities: Luxembourg, 2003. [Google Scholar]
- Borja, A.; Galparsoro, I.; Solaun, O.; Muxika, I.; Tello, E.M.; Uriarte, A.; Valencia, V. The European Water Framework Directive and the DPSIR, a methodological approach to assess the risk of failing to achieve good ecological status. Estuar. Coast. Shelf Sci. 2006, 66, 84–96. [Google Scholar] [CrossRef]
- Zare, F.; Elsawah, S.; Bagheri, A.; Nabavi, E.; Jakeman, A.J. Improved integrated water resource modelling by combining DPSIR and system dynamics conceptual modelling techniques. J. Environ. Manag. 2019, 246, 27–41. [Google Scholar] [CrossRef] [PubMed]
- Tscherning, K.; Helming, K.; Krippner, B.; Sieber, S.; Paloma, S.G. Does research applying the DPSIR framework support decision making? Land Use policy 2012, 29, 102–110. [Google Scholar] [CrossRef]
- Niemeijer, D.; Groot, R.S. Framing Environmental Indicators: Moving from Causal Chains to Causal Networks. Environ. Dev. Sustain. 2008, 10, 89–106. [Google Scholar] [CrossRef]
- Azarnivand, A.; Chitsaz, N. Adaptive policy responses to water shortage mitigation in the arid regions—A systematic approach based on eDPSIR, DEMATEL, and MCDA. Environ. Monit. Assess. 2015, 187, 23. [Google Scholar] [CrossRef] [PubMed]
- Gabus, A.; Fontela, E. World Problems, an Invitation to Further Thought within the Framework of DEMATEL; Battelle Geneva Research Center: Geneva, Switzerland, 1972; pp. 1–8. [Google Scholar]
- Chen, C.A. Using DEMATEL method for medical tourism development in Taiwan. Am. J. Tour. Res. 2012, 1, 26–32. [Google Scholar] [CrossRef]
- Livoreil, B.; Glanville, J.; Haddaway, N.R.; Bayliss, H.; Bethel, A.; de Lachapelle, F.F.; Robalino, S.; Savilaakso, S.; Zhou, W.; Petrokofsky, G.; et al. Systematic searching for environmental evidence using multiple tools and sources. Environ. Evid. 2017, 6, 23. [Google Scholar] [CrossRef]
- Armitage, D.; De Loe, R.C.; Morris, M.; Edwards, T.W.; Gerlak, A.K.; Hall, R.I.; Huitema, D.; Ison, R.; Livingstone, D.; MacDonald, G.; et al. Science–policy processes for transboundary water governance. Ambio 2015, 44, 353–366. [Google Scholar] [CrossRef] [PubMed]
- Dalalah, D.; Hayajneh, M.; Batieha, F. A fuzzy multi-criteria decision making model for supplier selection. Expert Syst. Appl. 2011, 38, 8384–8391. [Google Scholar] [CrossRef]
- Kobryń, A. DEMATEL as a weighting method in multi-criteria decision analysis. Mult. Criter. Decis. Mak. 2017, 12, 153–167. [Google Scholar] [CrossRef]
- Si, S.L.; You, X.Y.; Liu, H.C.; Zhang, P. DEMATEL technique: A systematic review of the state-of-the-art literature on methodologies and applications. Math. Probl. Eng. 2018, 2018, 3696457. [Google Scholar] [CrossRef]
- Braungart, M.; McDonough, W.; Bollinger, A. Cradle-to-cradle design: Creating healthy emissions–a strategy for eco-effective product and system design. J. Clean. Prod. 2007, 15, 1337–1348. [Google Scholar] [CrossRef]
- Rizos, V.; Tuokko, K.; Behrens, A. The Circular Economy: A Review of Definitions, Processes and Impacts; CEPS Papers, 12440; Centre for European Policy Studies: Brussels, Belgium, 2017. [Google Scholar]


Publisher’s Note: MDPI stays neutral with regard to jurisdictional claims in published maps and institutional affiliations. |
© 2022 by the authors. Licensee MDPI, Basel, Switzerland. This article is an open access article distributed under the terms and conditions of the Creative Commons Attribution (CC BY) license (https://creativecommons.org/licenses/by/4.0/).