Abstract
The main focus of this study is to optimize proposed solutions for a residential PV-based net-metering systems with the option of EV adaptation, utilizing a weighted grading system. Technical, environmental and financial parameters are assessed to develop a techno-economic and environmental evaluation model. The proposed analysis investigates the electricity consumption of a typical household and possible energy-saving interventions. Solar PV installation scenarios and their combination with solar water heating and EV adaptation are evaluated in terms of sizing and financial sustainability, as well as CO2 emissions reduction, along with the net-metering scheme.
1. Introduction
According to the International Energy Agency (IEA) [1], worldwide electricity consumption is increasing for all sectors, especially the residential sector. In Greece, domestic-sector electricity consumption is equal to commercial and public sector demand combined.
The PV-based net-metering system is a mature technological application [2], which consist of a PV installation linked to the national energy grid. The system represents an electricity billing mechanism, counterbalancing energy consumption and energy production on an annual basis. However, potential excessive energy production is not compensated [3], leading to consumers limiting their production up to the level of their energy needs. The net-metering scheme is an efficient and sustainable energy investment for domestic RES based systems, especially in cases of increased electricity prices, in contrast to systems built on a Feed-in-Tariff basis, selling electricity at a contractually fixed price [4]. In the meantime, increasing indirect taxes, fuel price ascending fluctuations, and the environmental impacts of CO2 emissions highlight investment opportunities in electromobility coupled with RES applications.
2. Problem Description and Data
The scenario under examination includes a typical household of four people in Athens, using electricity from a three-phase connection to the national grid in order to cover their energy, heating, cooling and water heating needs, leading to an annual electricity demand of 12,000 kWhe, which was accompanied by an average annual cost of approximately EUR 2500. The residence of the household possesses an available area of 48 m2 clear of shading, while the available capital and loan capability of the household is estimated as being flexible for both the PV-based net-metering system and EV adaptation.
2.1. PV System and Net-Metering Parameters
For the current study, three different PV system sizing options are examined, taking into account the small available installation area (~48 m2) and the possibility of solar water heater and EV adaptation. More specifically, based on a hypothesis of the needed area being 7 m2/kWp [5], scenarios of 2.5-, 5.0- and 6.5-kilowatt peak PV systems are examined, and they provide enough electricity supply while allowing the installation of a solar water heater (required area of ~2 m2).
The solar energy potential of a PV system located in Athens has been calculated via the PVGIS simulation tool [6], leading to a capacity factor of 20% on an annual basis, while the energy losses related to the inverter, wiring, heterogeneity, diodes, shading and temperature are cumulatively calculated as being approximately 15% of the whole system [7]. The installation of the net-metering scheme requires the purchase of an energy production meter, with a cost being EUR 400 for a three-phase meter, along with a connection fee of EUR 500, which is paid to HEDNO, for electricity grid certification purposes, leading to a total cost of EUR 900 [8].
2.2. Solar Water Heater and EV Adaptation
The household’s conventional water heating method is a 4 kW electric boiler. Assuming an average daily usage of 30 min leads to an annual energy consumption of 730 kWh, i.e., 6.1% of the total annual household electricity demand. The replacement of this appliance with a 125-liter double-energy solar water heater is taken into consideration, leading to an initial cost of EUR 800 and requiring installation area of 2 m2. The result of this replacement is expected to be a reduction in the annual domestic water heating energy demand of 90%, namely 660 kWh.
Moreover, the household’s current car is an old gasoline-powered city car, which is driven for approximately 15,000 km annually, and it is planned to be replaced by a new conventional or electric car. The annual energy consumption in each scenario is 900 gasoline liters and 2360 kWhe, respectively. Since the household had already considered buying the replacement car, the techno-economic evaluation of the EV adaptation scenarios only accounted for the excessive forecasted costs linked to an EV car purchase compared to the purchase of a new conventional car.
As a result of the above-mentioned options, annual energy demand for the examined household varies depending on the form of investment used, accounting for 11,200 kWhe in case of solar water heater installation, and 13,570 kWhe in the case of its combination with the adaptation of electromobility.
2.3. Financial and Systemic Charasteristics and Assumptions
In this study, systemic variables needed for the proper implementation of the model have been considered based on their price at the time of this research. More specifically, the electricity price has been set at 0.13 EUR/kWh, while the annual price volatility has been forecasted at 3%. Moreover, the gasoline price and its annual average increase have been set to 1.90 EUR/l and 3% per year, respectively, while the discount rate of the investment was set to 5%, with an annual inflation rate of 1%. Finally, the case study assumed that the examined system is totally free of annual maintenance and operation or severe repair costs, and the investment will not be burdened by taxes due to its non-profit character.
The examined case study consists of nine different scenarios devised via a 3 × 3 rectangular matrix, which is a combination of three types of installations shown in rows (a: standalone PV; b: PV and SWH; and c: PV and SWH and EV adaptation) and three different PV system sizes shown in columns (2.5 kWp, 5.0 kWp and 6.5 kWp), as depicted in Table 1.

Table 1.
Matrix representation of combinations leading to examined scenarios.
For the proper calculation of the critical values of the study, a series of variables was introduced into the model, being mainly derived from data collected or assumed, as previously stated. Some of the input variables were linearly connected to the size of the PV system, as shown in Table 2.
Table 2.
Input variables for different PV system sizes.
Furthermore, other variables were common in every type of installation, as shown in Table 3.
Table 3.
Common input variables for all PV system sizes for a 20-year period operation.
3. Scenarios’ Evaluation Criteria
The nine examined scenarios were evaluated with respect to both their techno-economic efficiency and environmental impact. Regarding this scope, a series of critical variables were defined, and a grading system was established, in order to provide an efficient sorting mechanism that compared weighted averages.
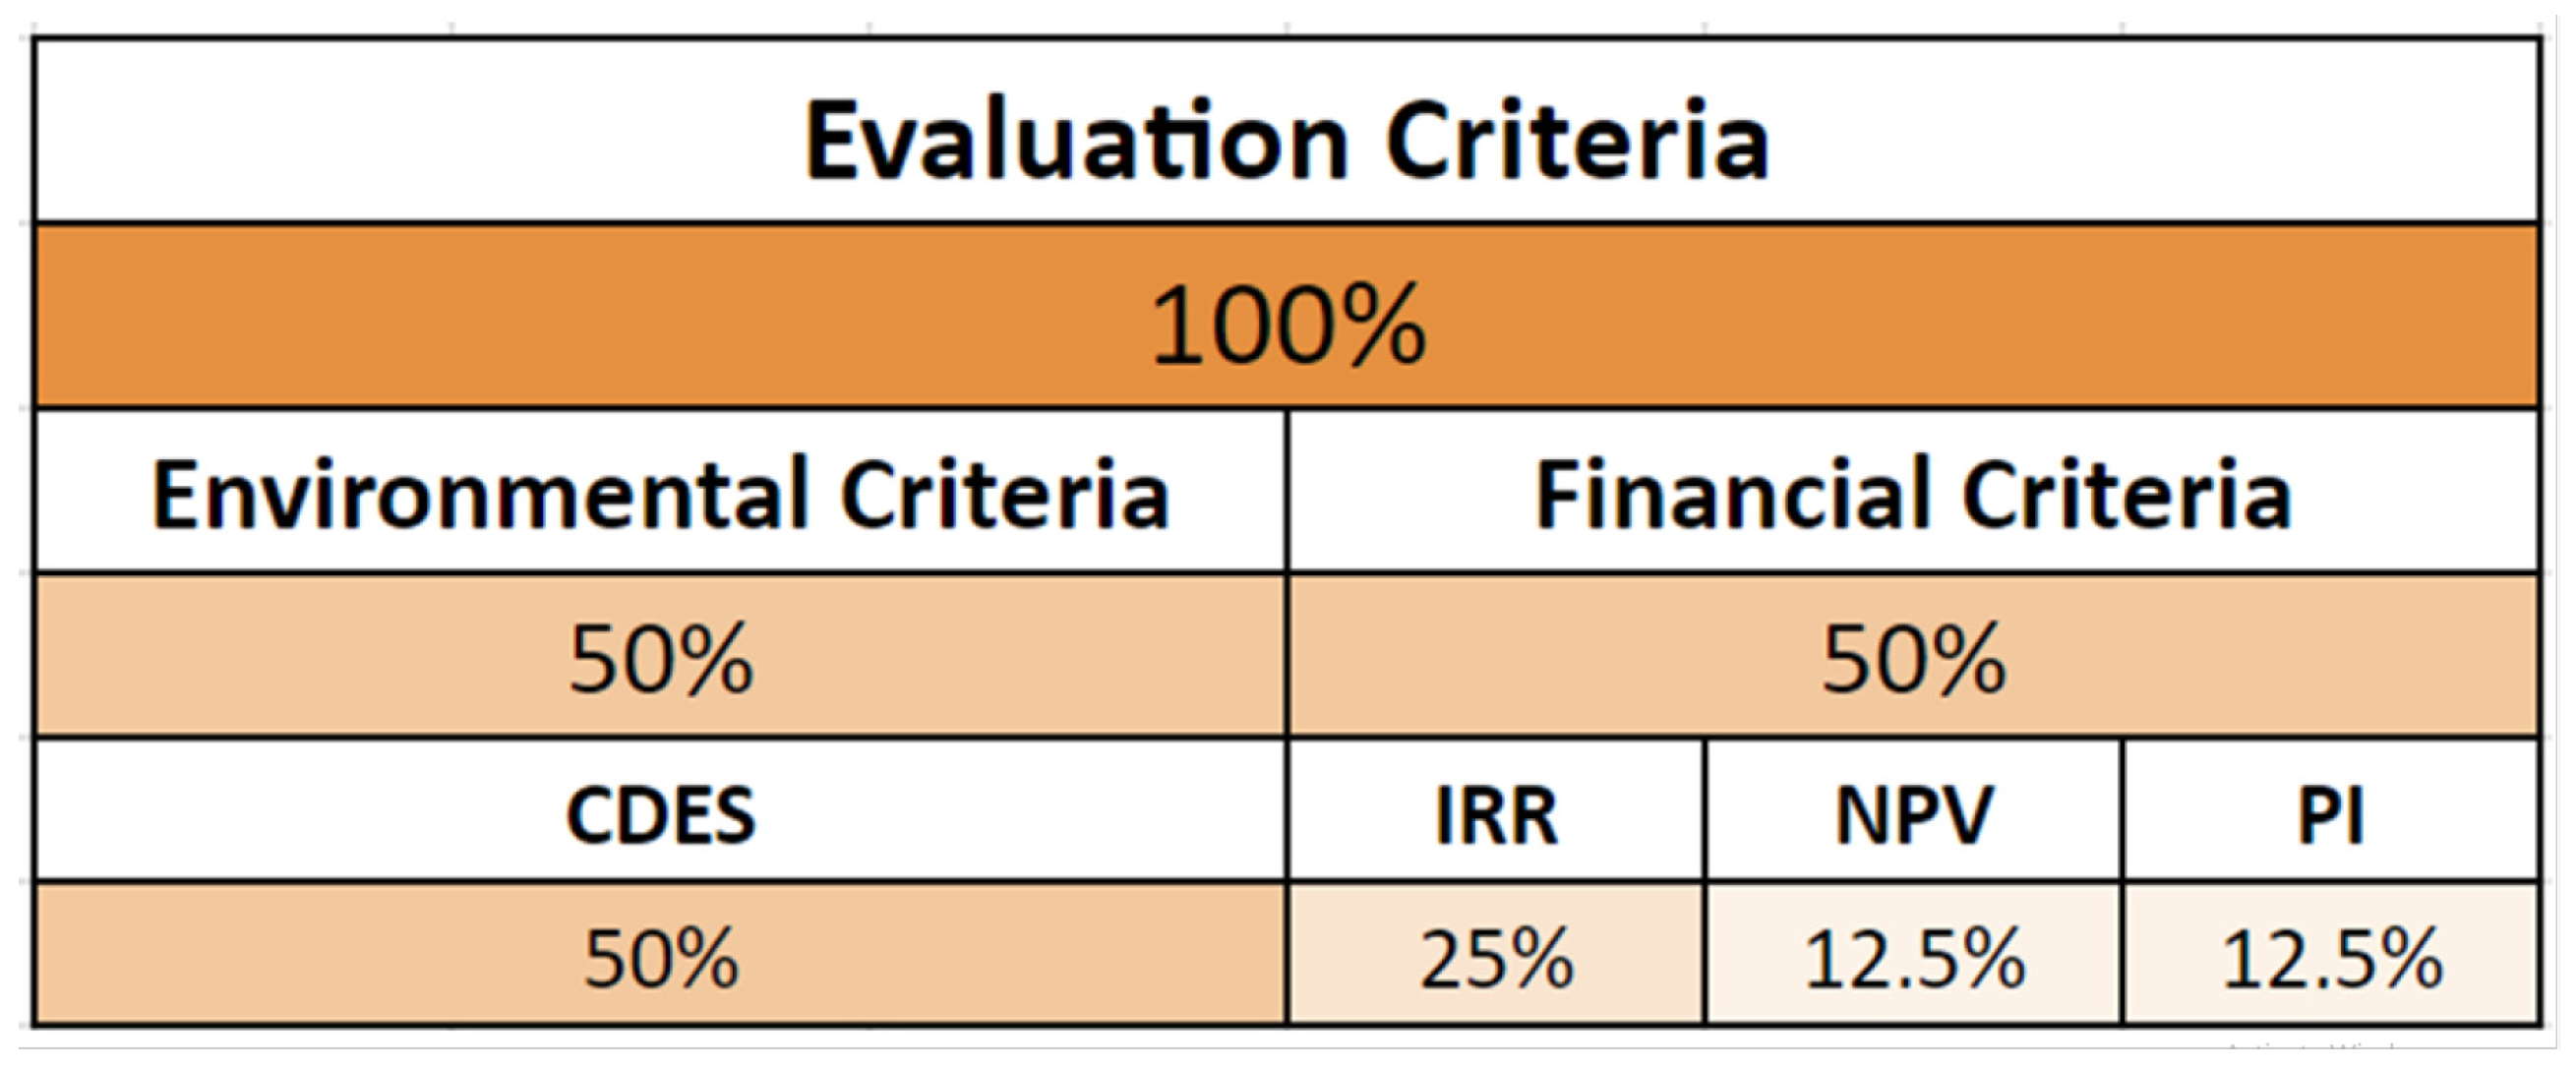
The selected criteria for use in this study included techno-economic aspects (IRR, NPV and PI), along with environmental aspects (CDES). These criteria had to be weighted according to the scope of this specific study, balancing its financial and environmental effects. For this reason, a 50–50 approach between the two main aspects was embraced, while financial criteria weights were purposefully chosen in order to obtain a global perspective regarding the investment. The distribution of evaluation weights is presented in Figure 1.
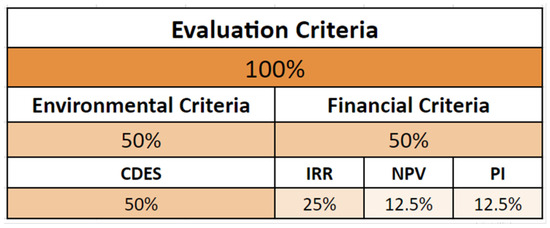
Figure 1.
Multi-level distribution of critical values’ evaluation weights.
The grading mechanism used in every criterion was represented by a numerical value from 0 to 100, awarding a grade of 100 to the maximum value for each criterion “”, while the grades of all other values were calculated as follows:
where “k” represents each of the 4 selected criteria (IRR, NPV, PI and CDES), “” represents the matrix of grades for the k-th criterion, “” represents the matrix of values for the k-th criterion, “i” represents the 3 types of installation (matrices rows) and “j” represents the 3 different PV system sizes (matrices columns).
For each scenario, the grades’ weighted averages were equal to the following equation:
4. Results and Discussion
4.1. Numberical Results for Critical Values
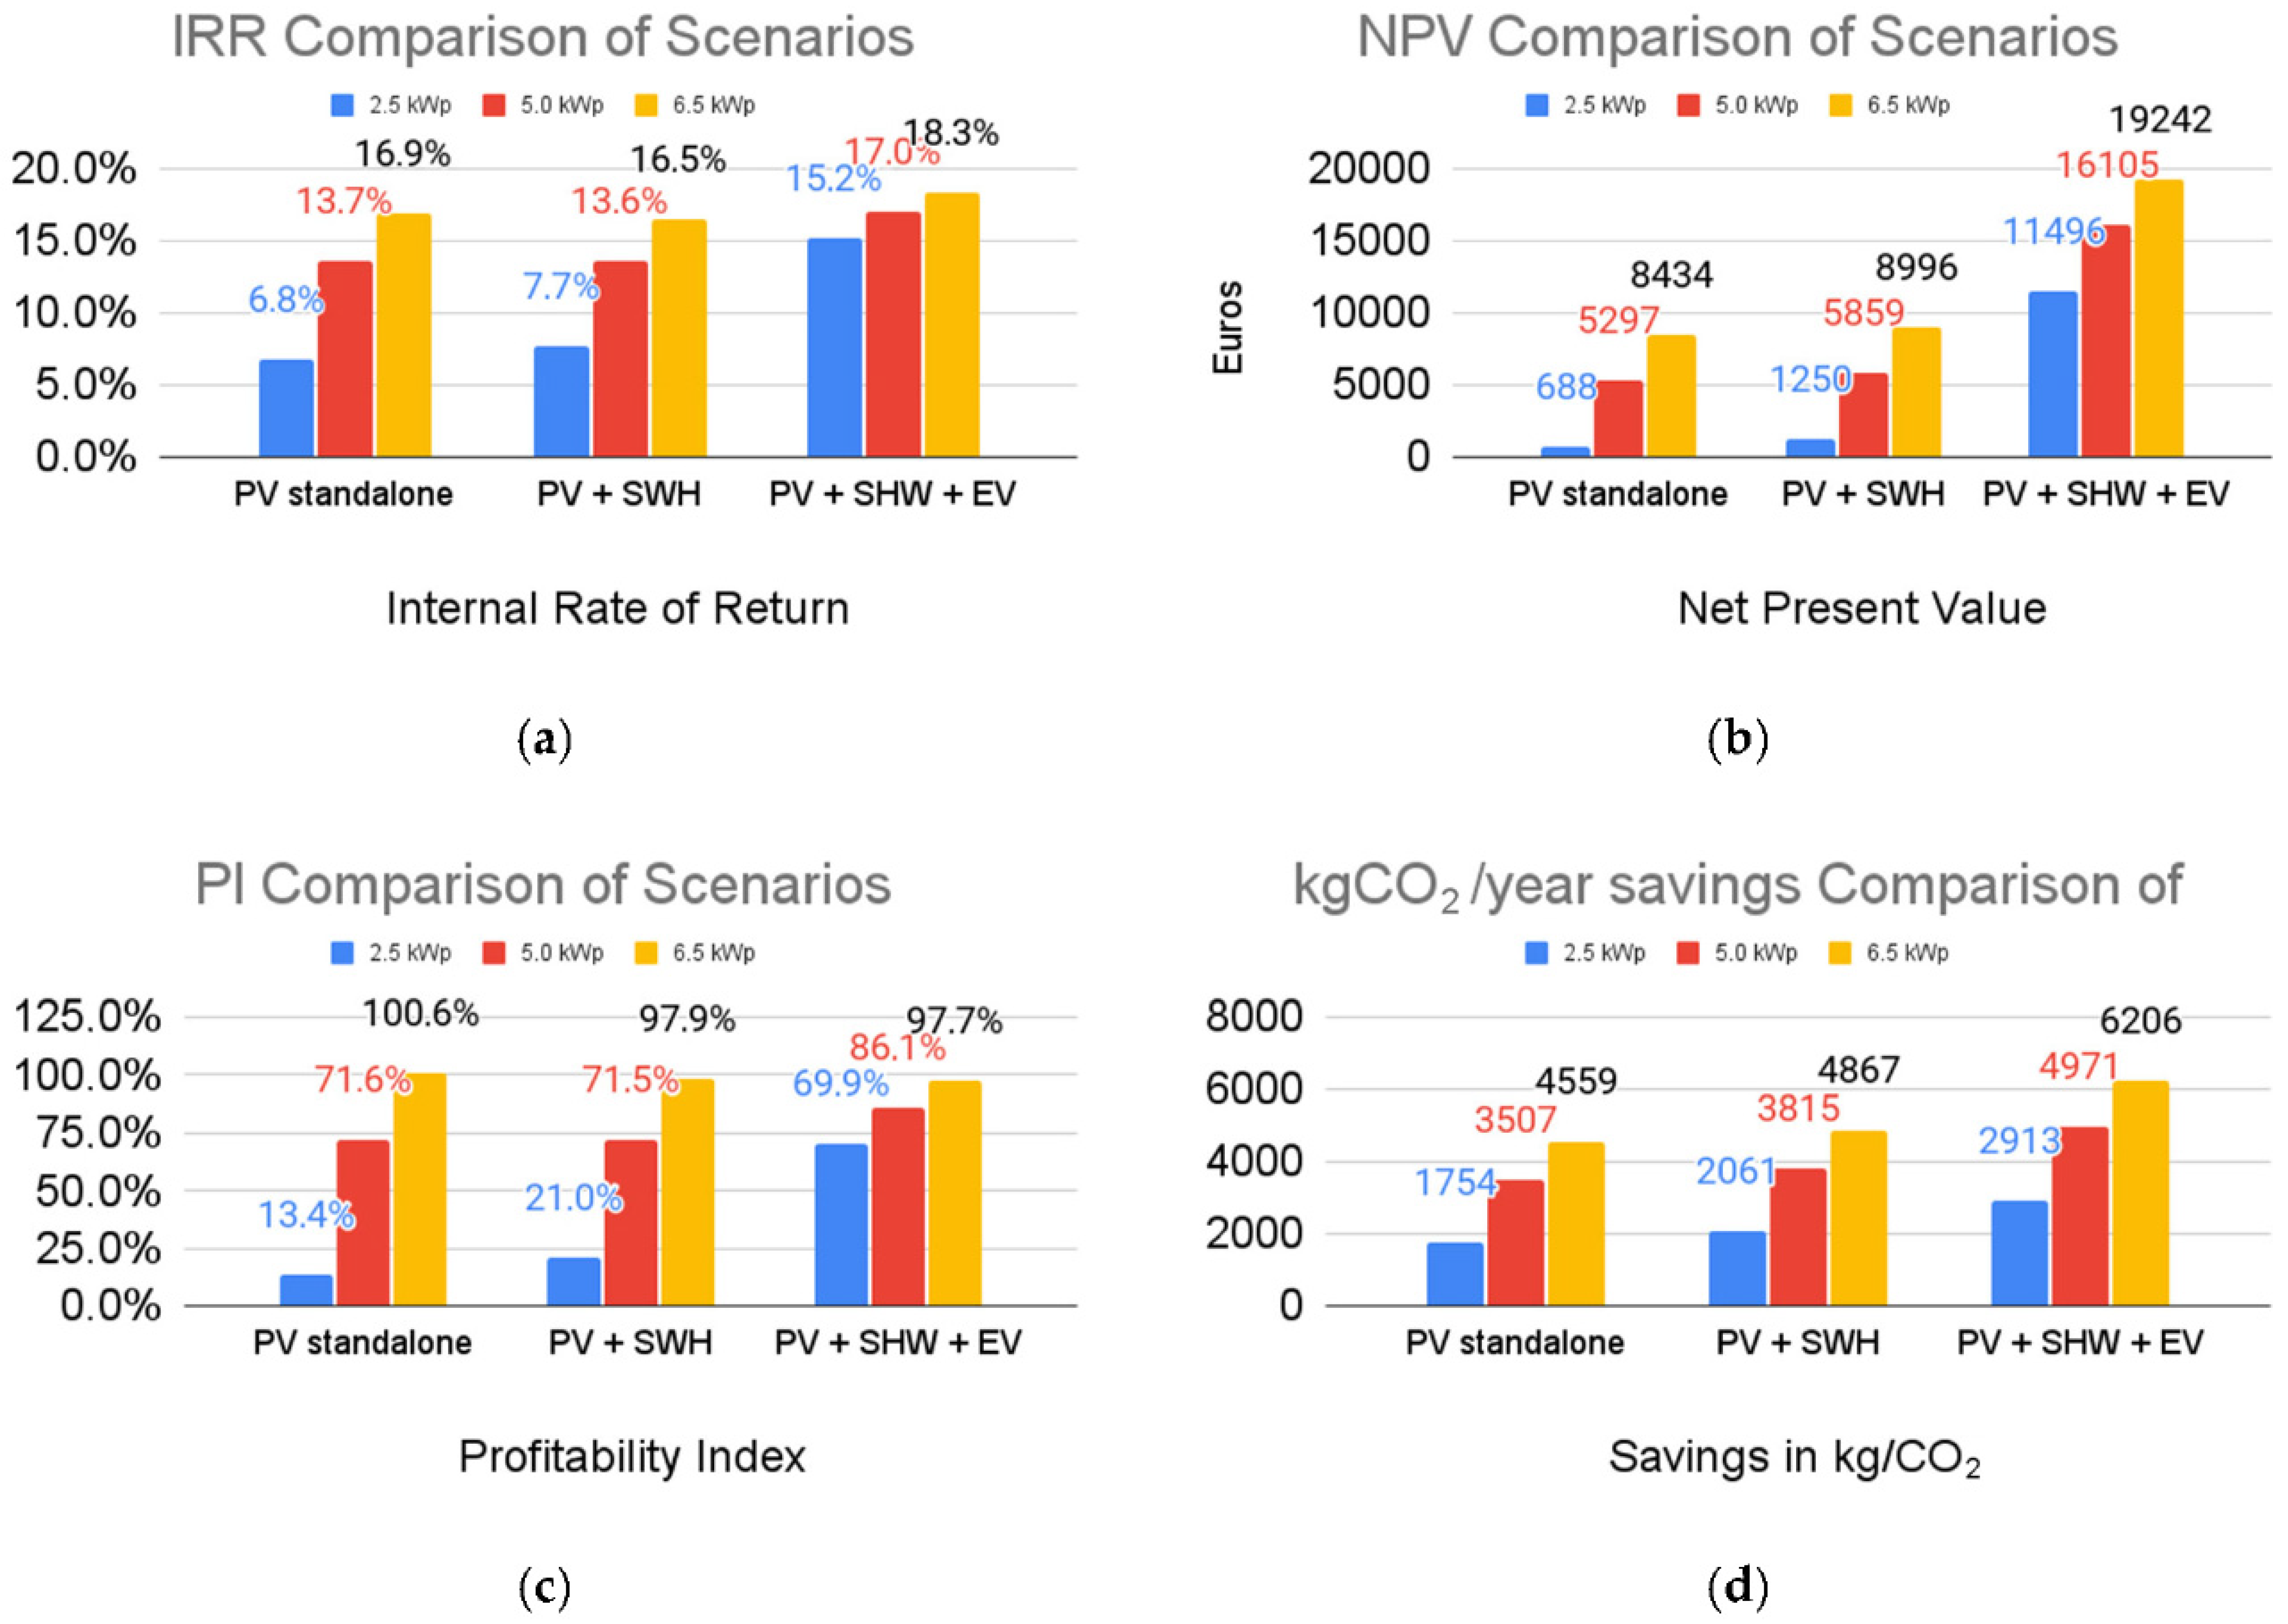
By inserting the relevant data, the model calculated the critical values for the nine scenarios under evaluation (Figure 2).
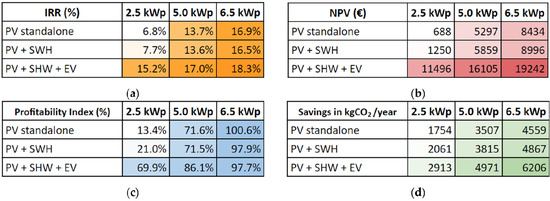
Figure 2.
Combined numerical and graphical comparison of the results of the nine examined scenarios related to the four critical variables: (a) IRR comparison for a 20-year investment; (b) NPV (in EUR) for a 20-year investment; (c) profitability index (NPV/CapEx) for a 20-year investment; (d) yearly savings of kgCO2 for each scenario (CDES).
4.2. Graphic Respesentation of Critical Values
The numerical results of the four critical values for the nine scenarios can be graphically visualized in the four graphs shown in Figure 3.
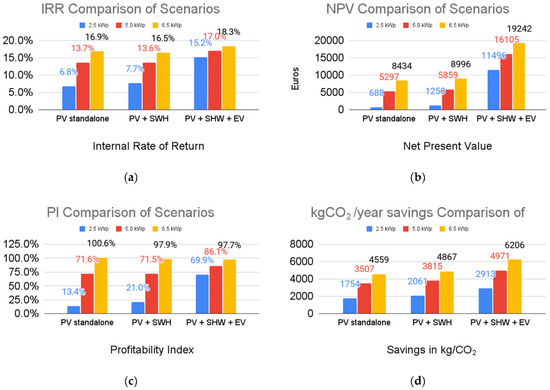
Figure 3.
Graphic representation of calculated data for the nine examined scenarios related to the four critical variables: (a) IRR comparison for a 20-year investment; (b) NPV (in EUR) for a 20-year investment; (c) profitability index (PI = NPV/CapEx) for a 20-year investment; (d) yearly savings of kgCO2 for each scenario.
4.3. Assignment of Grades to Critical Values and Evaluation
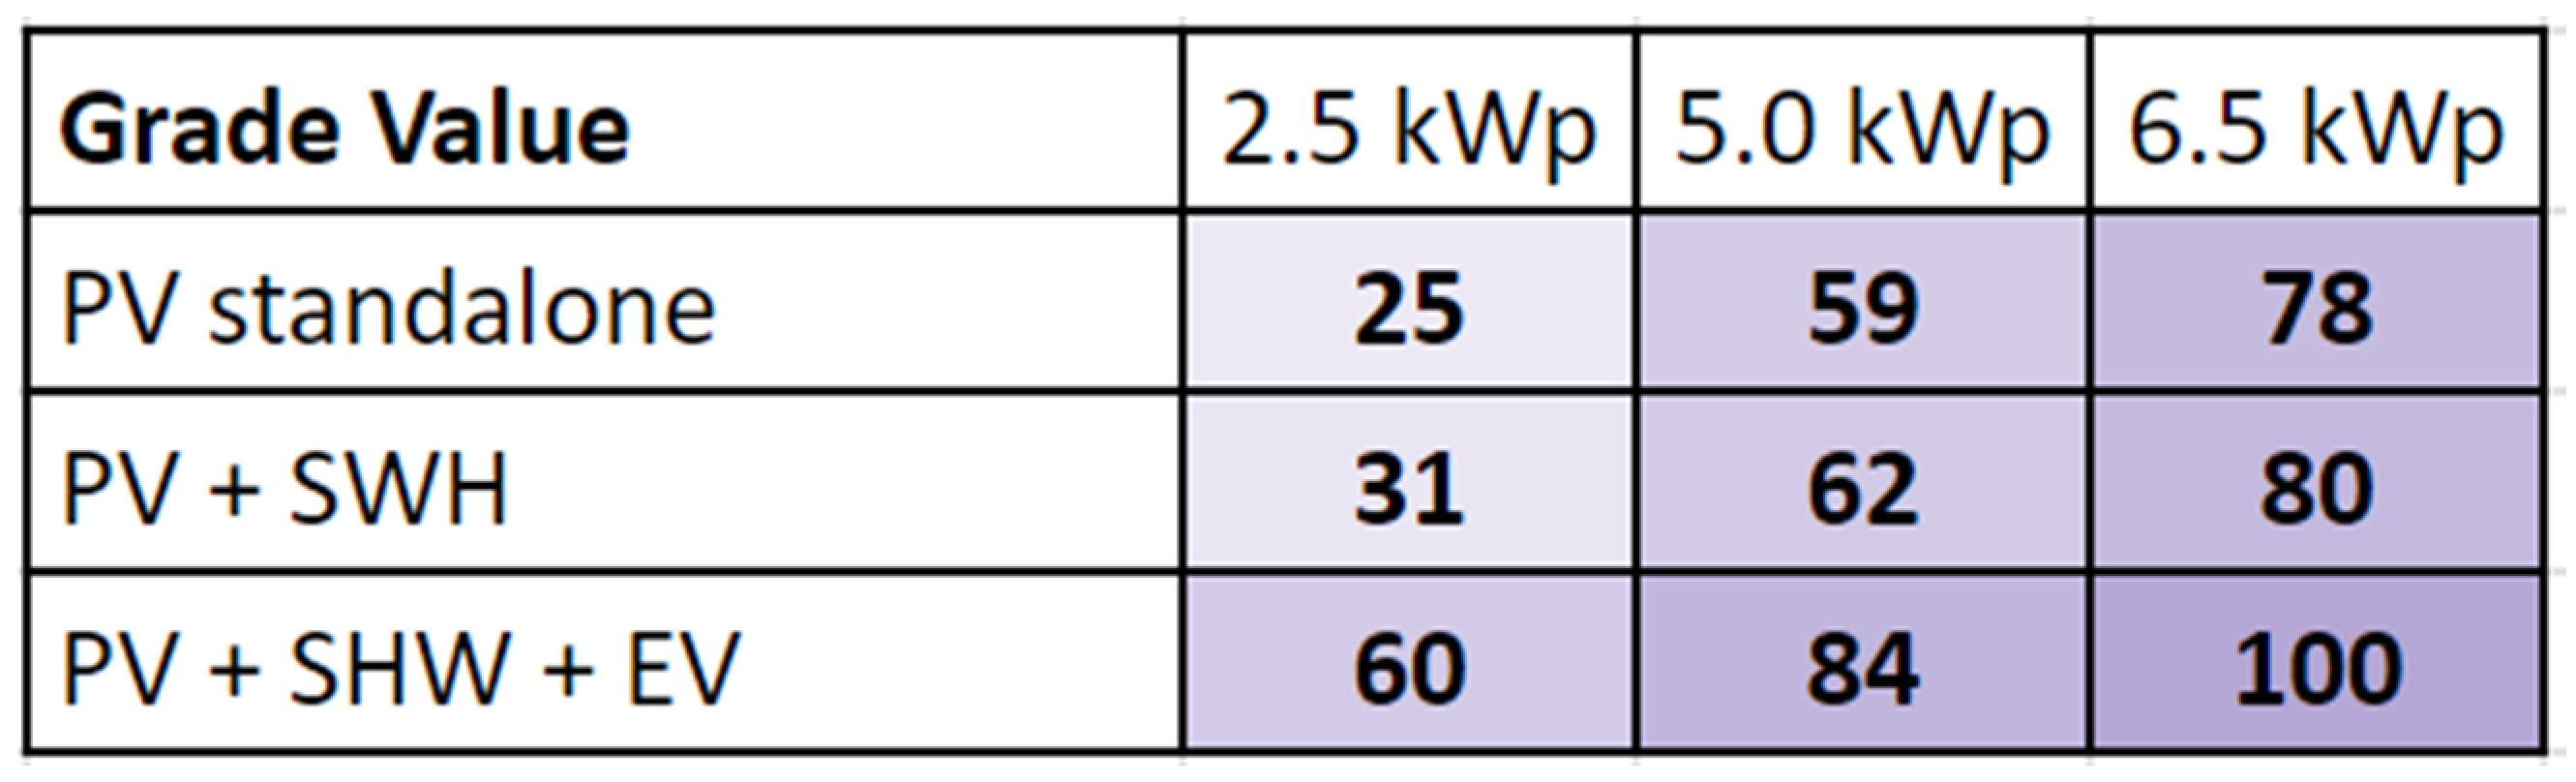
The results derived from the model can be used as inputs to the before-mentioned grading mechanism (Equations (1) and (2)), allowing the evaluation and sorting of the nine suggested scenarios presented in Table 4.
Table 4.
Examined scenarios under study and corresponding grades.
A more concentrated and comparative depiction of the total grading values for each scenario is presented below, providing investors with the overview needed to complete the decision-making process.
As shown in Figure 4, the optimal scenario for the case study under examination is the 6.5-kilowatt peak PV system coupled with solar water heater and EV adaptation under the net-metering mechanism, as it offers the best techno-economic and environmental protection results. Except the optimal solution, three other scenarios seem to provide investors with significant advantages, offering IRR of 16.5–17% and similar carbon dioxide emission savings (approximately 4500–5000 kgCO2 annually).
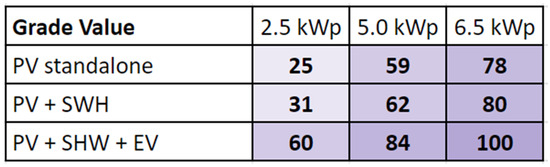
Figure 4.
Hybrid visualization of the final grades of the nine proposed scenarios.
5. Conclusions and Proposals
According to results presented, the maximization of PV installation improves the techno-economic efficiency to the greatest extent, since solar PV installation is the most efficient studied technology in terms of net metering scheme. Moreover, the solar water heater seems to slightly reduce the techno-economic efficiency (IRR) of the PV installation (especially for larger-sized installations) while improving the NPV index, supporting energy-saving and the rational use of energy, especially concerning the primary energy consumption and environmental protection.
In parallel, EV adaption proves to be a very efficient alternative due to the Greek national subsidy policy. However, electro-mobility adaptation requires an extra initial investment capital that is more relevant to consumers who are already considering purchasing a new car.
Finally, the available household area is fully exploited, leaving enough space for the installation of a solar water heater, allowing the consumer to maximize their energy independence, while eliminating their environmental impact and investing in an efficient optimized energy system.
Author Contributions
Conceptualization, K.K. and A.K.; methodology, K.K., J.K. and A.K.; software, K.K.; formal analysis, K.K. and A.K.; investigation, K.K., J.K. and A.K.; resources, J.K. and A.K.; data curation, K.K. and J.K.; writing-review and editing, K.K. and A.K.; visualization, K.K.; supervision, A.K. All authors have read and agreed to the published version of the manuscript.
Funding
This research received no external funding.
Institutional Review Board Statement
Not applicable.
Informed Consent Statement
Not applicable.
Data Availability Statement
Data are unavailable due to privacy restrictions.
Conflicts of Interest
The authors declare no conflict of interest.
References
- International Energy Agency (IEA). Data and Statistics. 2021. Available online: https://www.iea.org/data-and-statistics (accessed on 15 January 2022).
- Albaker, A.F. Impact of Net Metering on Customer Saving. Master’s Thesis, University of Denver, Denver, CO, USA, 2014. [Google Scholar]
- Hellenic Ministry of Environment and Energy. Ministerial Decision No 15084/382/19.02.2021 (Gazette B’ 759/05.03.2019). 2021. Available online: https://ypen.gov.gr/ (accessed on 15 January 2022).
- Poulikkas, A. A comparative assessment of net metering and feed in tariff schemes for residential PV systems. Sustain. Energy Technol. Assess. 2013, 3, 1–8. [Google Scholar] [CrossRef]
- International Energy Agency (IEA). Technology Collaboration Programme: PVPS—Climatic Rationg of Photovoltaic Modules: Different Technologies for Various Operating Conditions 2020, Report IEA-PVPS T13-20:2020. Available online: https://iea-pvps.org/wp-content/uploads/2021/02/Report-IEA-PVPS-T13-20_2020-Climatic-Rating-of-PV-Modules.pdf (accessed on 15 January 2022).
- PVGIS Tool. 2021. Available online: https://re.jrc.ec.europa.eu/pvg_tools/en/# (accessed on 15 January 2022).
- Pearsall, N.M. (Ed.) Introduction to photovoltaic system performance. In The Performance of Photovoltaic (PV) Systems; Woodhead Publishing: Sawston, UK, 2017; pp. 1–19. [Google Scholar]
- Hellenic Electricity Distribution Network Operator (HEDNO). 2021. Available online: https://deddie.gr/en/ (accessed on 15 January 2022).

Disclaimer/Publisher’s Note: The statements, opinions and data contained in all publications are solely those of the individual author(s) and contributor(s) and not of MDPI and/or the editor(s). MDPI and/or the editor(s) disclaim responsibility for any injury to people or property resulting from any ideas, methods, instructions or products referred to in the content. |
© 2023 by the authors. Licensee MDPI, Basel, Switzerland. This article is an open access article distributed under the terms and conditions of the Creative Commons Attribution (CC BY) license (https://creativecommons.org/licenses/by/4.0/).