Abstract
In this work, we present a hybrid methodology based on ADA, applied to the simulation of pine species from northern Mexico. From algebraic transformations and certain premises, we were able to reduce the parameter space of the Weibull growth function from three parameters to just one, the maximum diameter of the individual at the end of growth. From the point of view of complexity, we have a decrease in computational cost, because now we have only one parameter to estimate, and from a practical point of view, it is an easy parameter to obtain, even in the field. To present the quality of the method, we used the mean absolute percentage error and the quantile regression to visually present the quality of the fit. Then we compare this proposed methodology with the GADA versions for the Chapman–Richards and Hossfeld models. The results presented for the study area, to avoid generalizations, show that the proposed hybrid method was more accurate in the estimates.
1. Introduction
For many purposes in forestry, it is helpful to be able to make precise future predictions of the mean values of growth variables based on repeated measurements through time made on units that are grouped hierarchically. Many forest management decisions are based on yield projections that crucially depend on projections of plot level averages of tree diameter and height, basal area, and other dentrometric variables [9].
A stand growth model is an abstraction of the natural dynamics of a forest stand, and may encompass growth, mortality, and other changes in stand composition and structure. Common usage of the term “growth model” generally refers to a system of equations which can predict the growth and yield of a forest stand under a wide variety of conditions [1].
Growth and yield are mathematically related. From the biological point of view, growth is the increase in dimensions of one or more individuals in a forest stand over a given period of time. Yield corresponds to final dimensions at the end of a certain period. In even-aged stands, a growth equation might predict the growth of diameter, basal area, or volume in units per annum as a function of age and other stand characteristics, whereas a yield equation would predict the diameter, stand basal area, or total volume production attained at a specified age. In an uneven-aged stand, yield is the total production over a given time period, and growth is the rate of production [1].
Whole stand models are often simple and robust, but may involve complexities not possible in other approaches. On the other hand, single-tree models is the most detailed approach which uses the individual tree as the basic unit of modeling. The minimum input required is a list specifying the size of every tree in the stand. Some models also need the spatial position of the tree, or tree height and crown classes. Single-tree models usually are very complex for modeling branches and internal stem characteristics, and may be linked to harvesting and conversion simulators [2]. Therefore, our study aim was to test a new and simple method to model tree growth.
2. Materials and Methods
2.1. Study Area
The study was conducted in the mixed and irregular forests of the Sierra Madre Occidental of Durango (Figure 1), more precisely in the longitudinal gradient between the states of Durango and Sinaloa, from September to November 2017. Six plots, 50 m × 50 m (0.25 ha), were established, where the diameter at breast height (DBH) was measured, growth rings were analyzed to describe the age and diameter increments of each tree based on growth nuclei, the pines were located within the plot, and the species were recorded. For the analysis presented here, we applied the methodology only to the species found in plot 5 (Figure 2), which had the largest number of individuals.
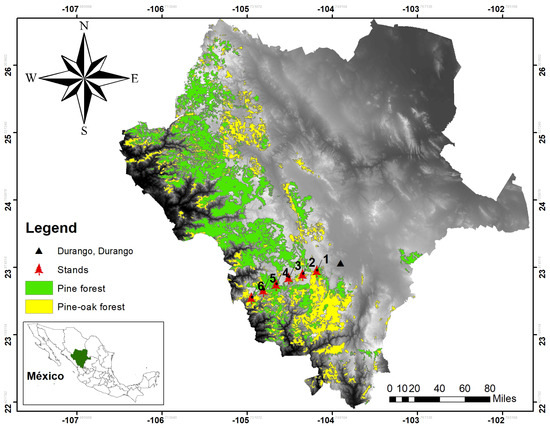
Figure 1.
Study area and the locations of the six data collection plots.
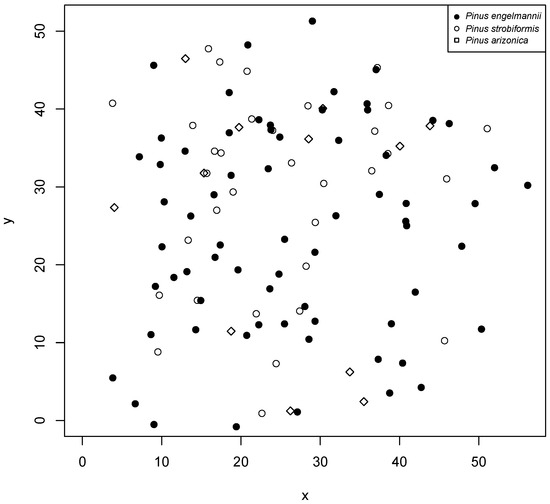
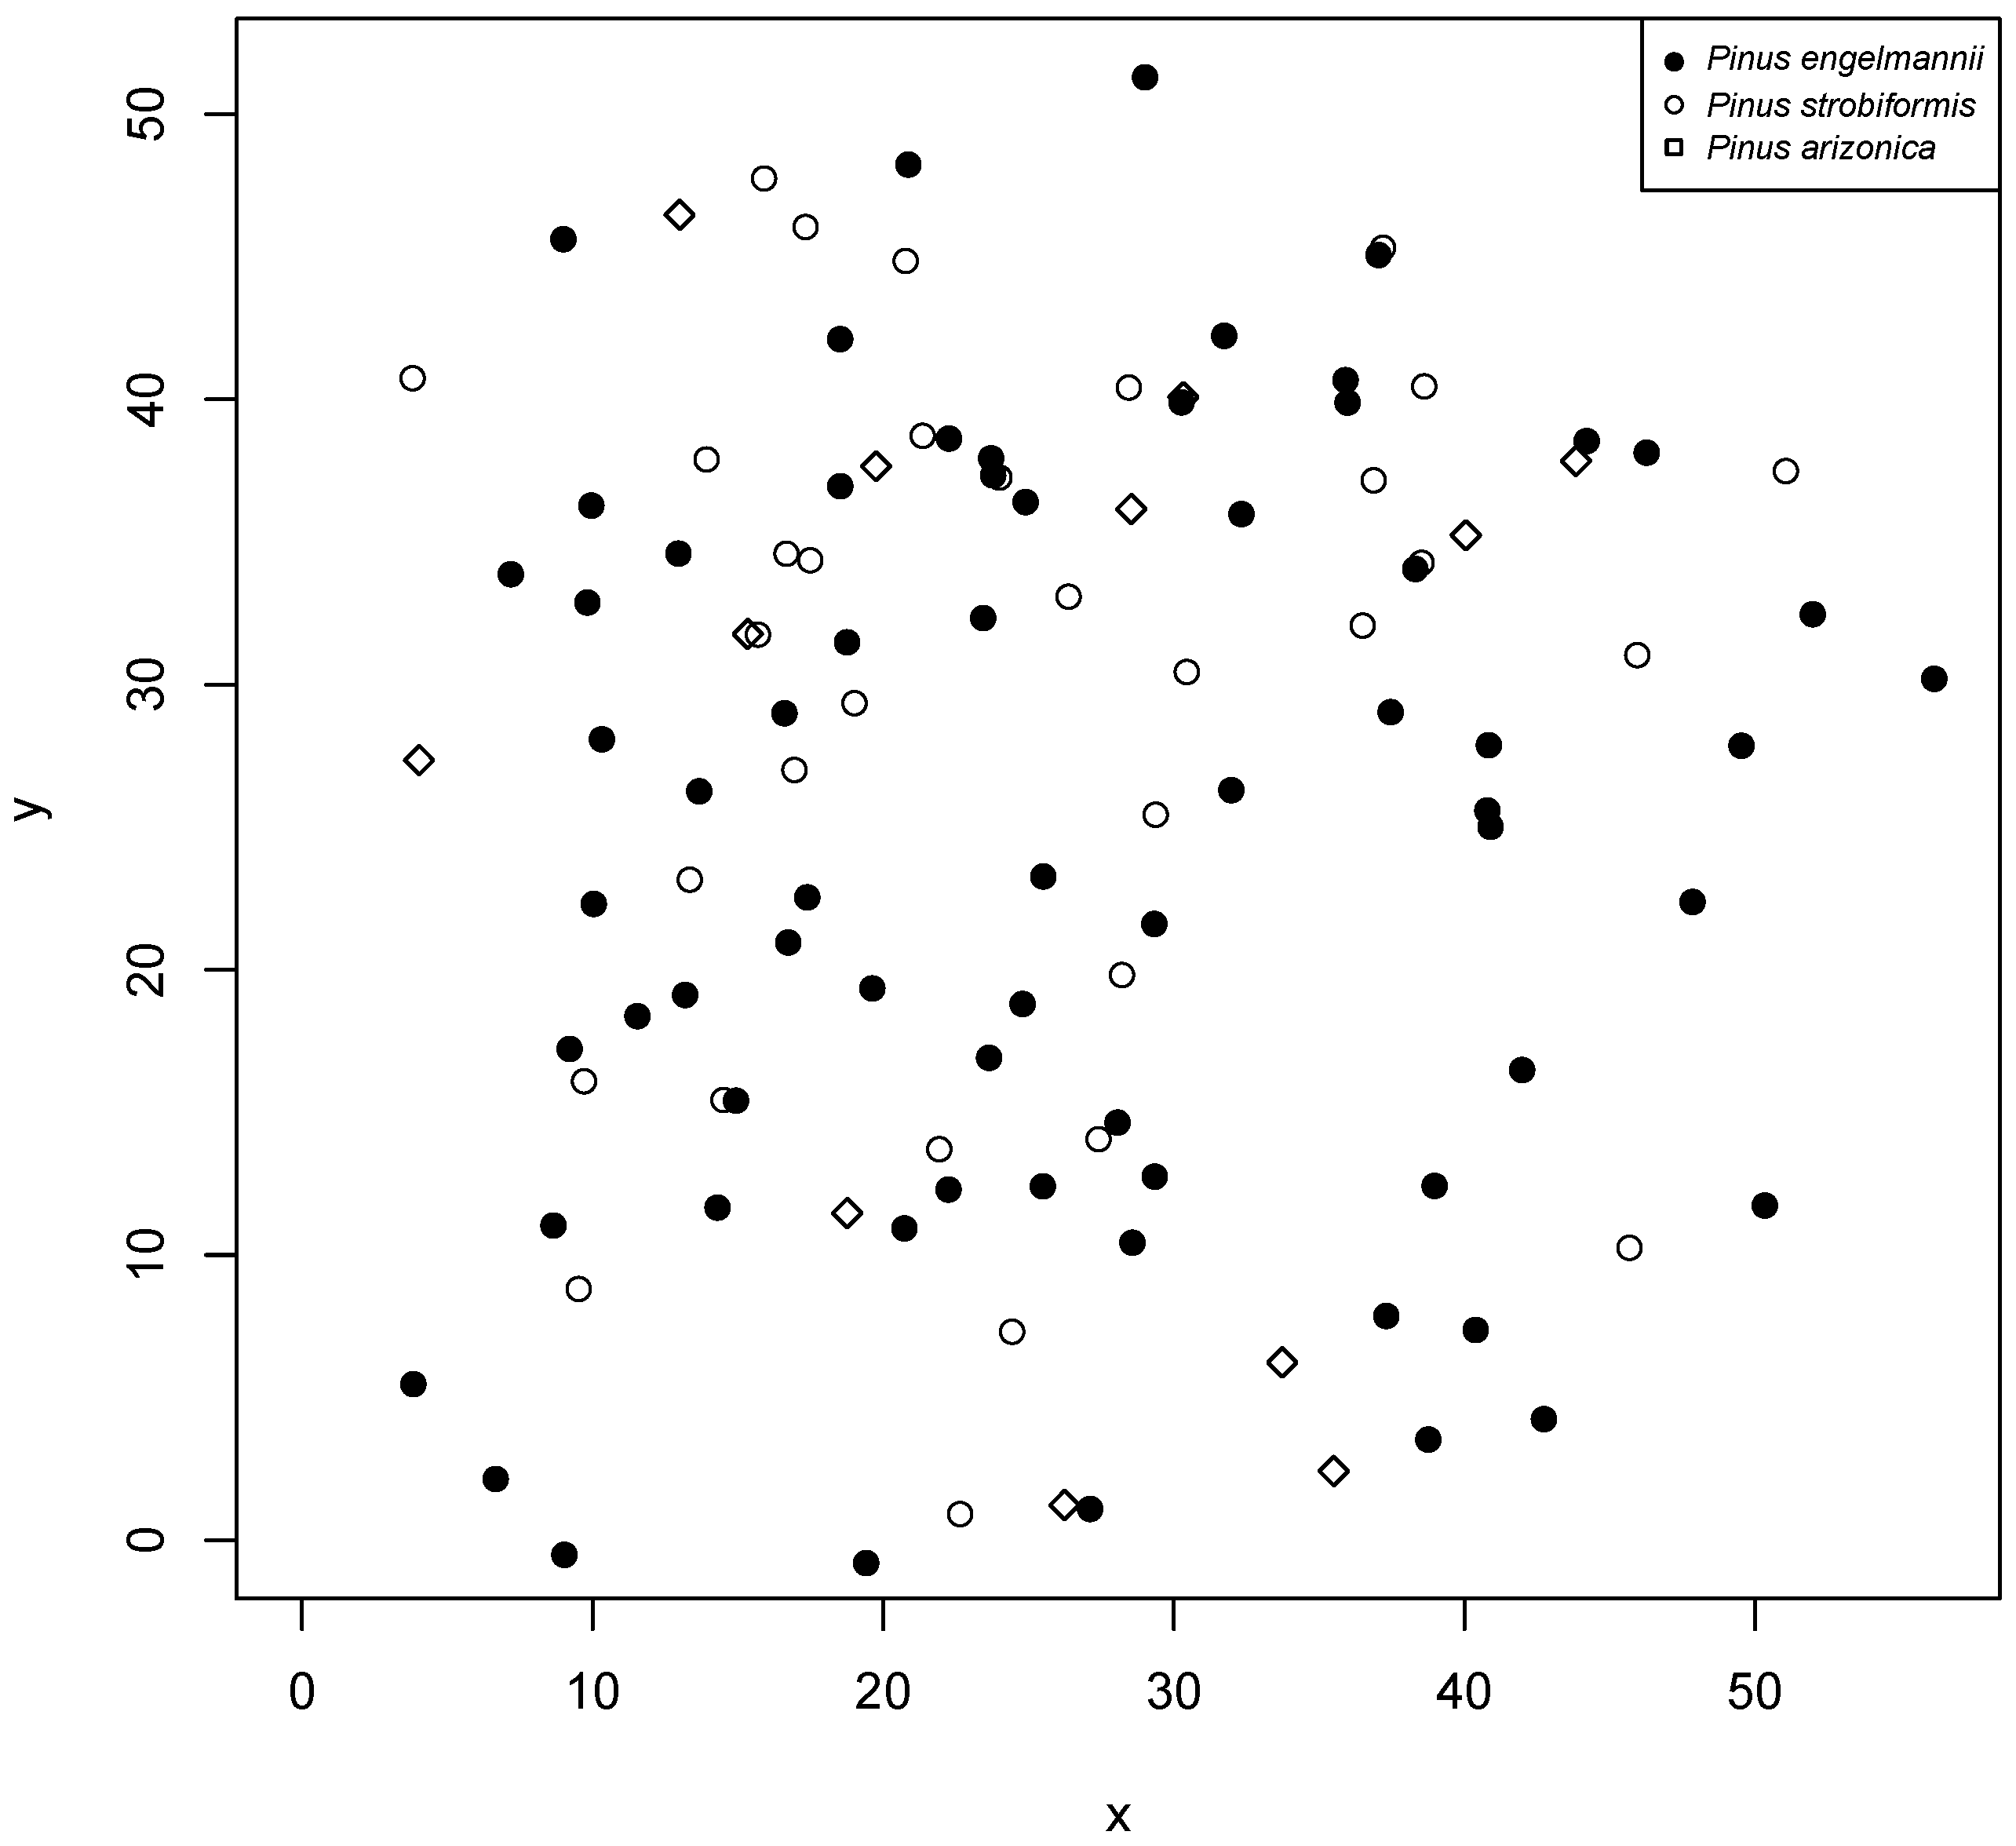
Figure 2.
Plot 5 of the study area and location of each tree and species within the plot.
2.2. Base-Aged-Specific Model (BAS Model)
The BAS models implemented in order to estimate and evaluate the respective diametric growth of the pine trees in the study area were taken from the literature [3,4,5]. In this case, we only used versions that depend on three parameters (Table 1).

Table 1.
List of some growth models to be implemented at this work, where , , and are the model parameters; and d and t are, respectively, the diameter () and the age of the individual.
2.3. Algebraic Difference Approach (ADA) and Generalized Algebraic Difference Approach (GADA)
The Algebraic Difference Approach (hereinafter ADA) was introduced by Bailey and Clutter [8] and it consists replacing a parameter of the base model with its initial condition solution. The ADA technique allows the derivation of dynamic or non-static functions that are capable of producing anamorphic or polymorphic curves, from a BAS model chosen a priori. The GADA methodology [6] arises when we assume that two or more parameters of the BAS model are simultaneously site-specific.
2.3.1. Chapman–Richards (Hereinafter C-R) GADA Model
The C–R GADA model [6] implemented here is defined as:
where and
2.3.2. Hossfeld GADA Model
The Hossfeld GADA Model [6] implemented here is defined as:
where .
2.4. Proposed Methodology Based on the Algebraic Difference Approach (ADA)
The procedure proposed here consists of first reducing parameters to immediately apply the ADA methodology, assuming in this case that there is any intrinsic relation between the parameters and . In such case, we can rewrite the Weibull BAS model as:
where is the the maximum diameter reached by the individual; is the recruitment diameter, which has been considered the same for all individuals. This re-structuring of the equation restricts the model to the unique parameter , of course, only if the relationship exists.
For the population in study, in order to avoid generalization, we observed a strong inverse relationship between the variable and , such that:
hence, it is possible rewrite Equation (3) as:
where a is a scale factor.
2.5. Mean Absolute Percentage Error (MAPE)
In order to quantify the error associated with each of the models implemented in our analysis, we use, for its robustness and simplicity, the mean absolute relative error [7], here defined by the equation:
where and are respectively the estimated and the observed values, and n is the number of observations.
3. Results and Discussion
Here we provide a concise and precise description of our results, their interpretation and the conclusions concerned.
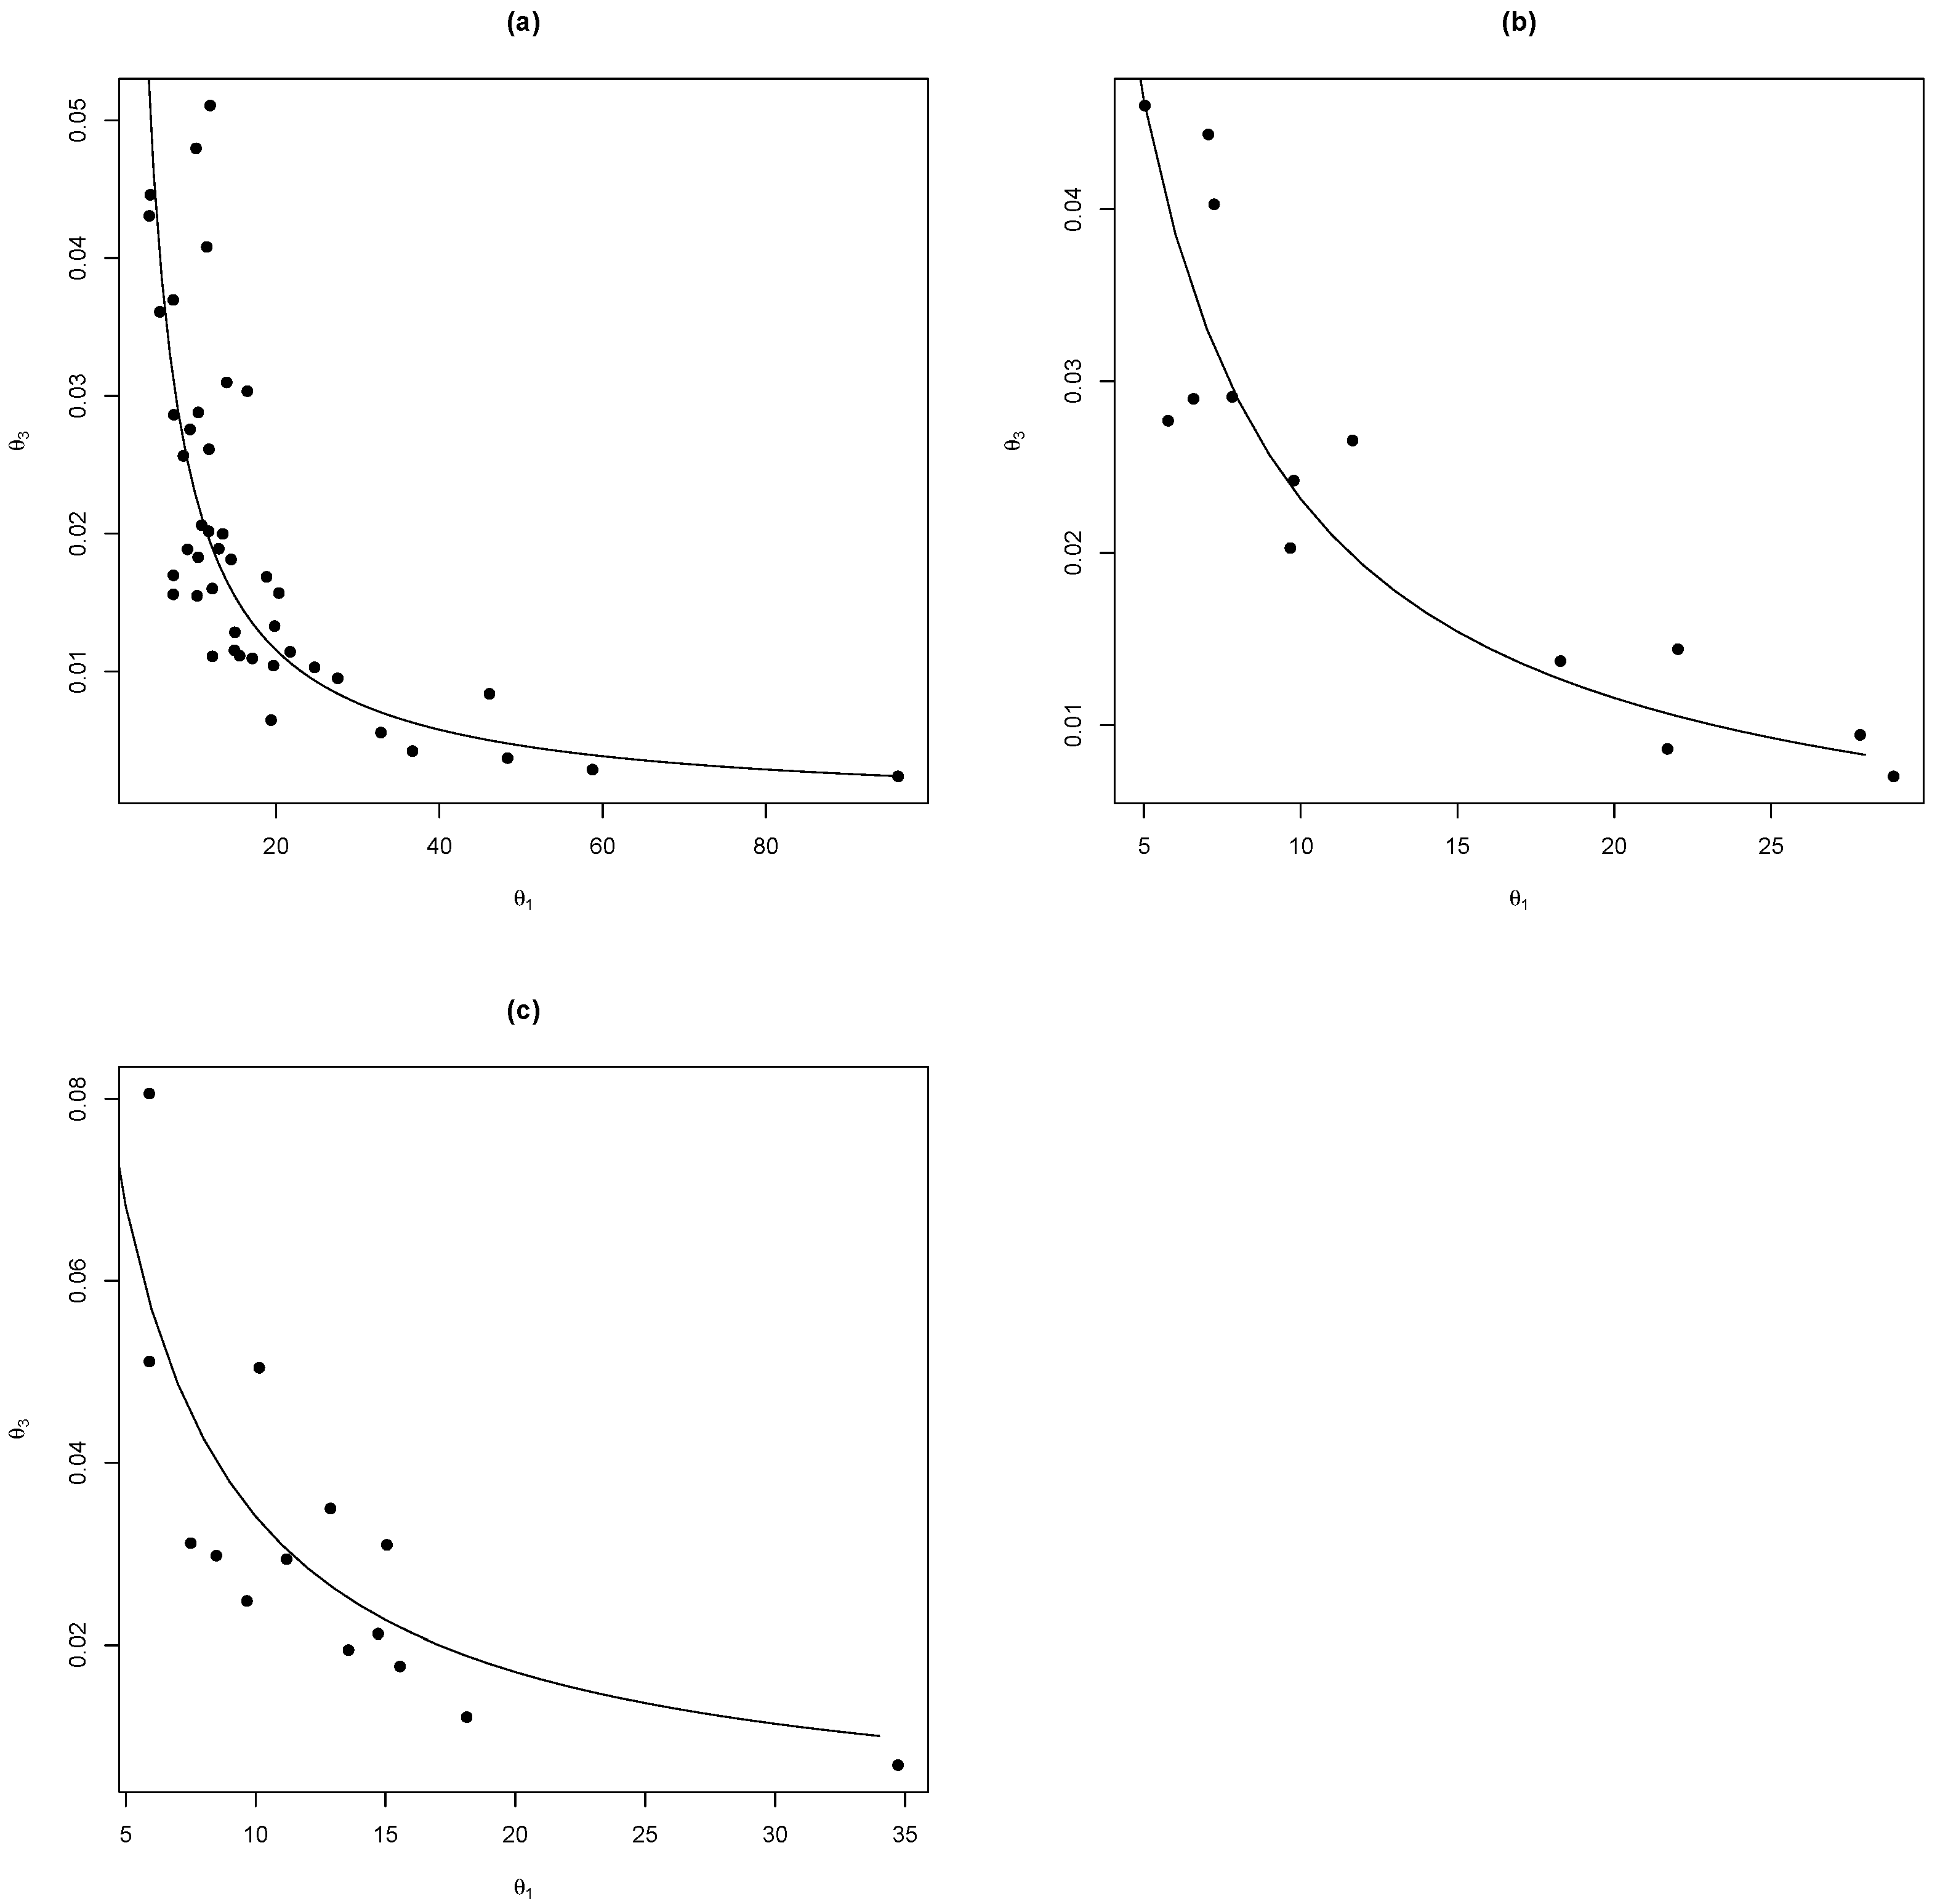
We can see (Figure 3) that it is possible to write as a function of of the form . Then, using nonlinear regression methods with the nlsLM function on R [10], we estimated the parameters for each species and model analysed in this study and presented in summary in Table 2.
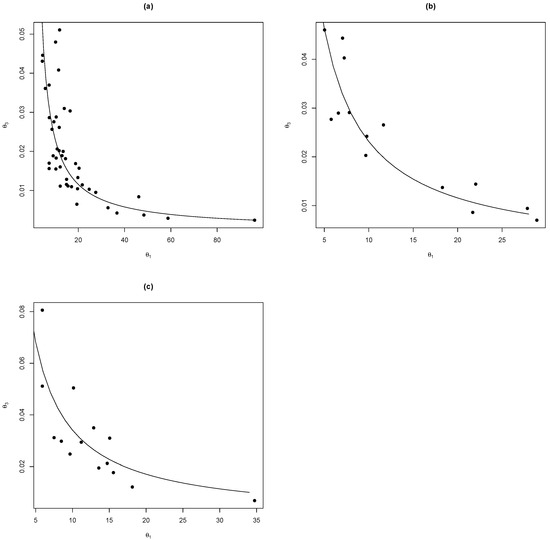
Figure 3.
The relationship between the parameters and adjusted for the model , for the species (a) Pinus engelmannii (, ), (b) Pinus strobiformis (, ), and (c) Pinus arizonica (, ).
Table 2.
Parameters ajusted for each species and model analysed in this study.
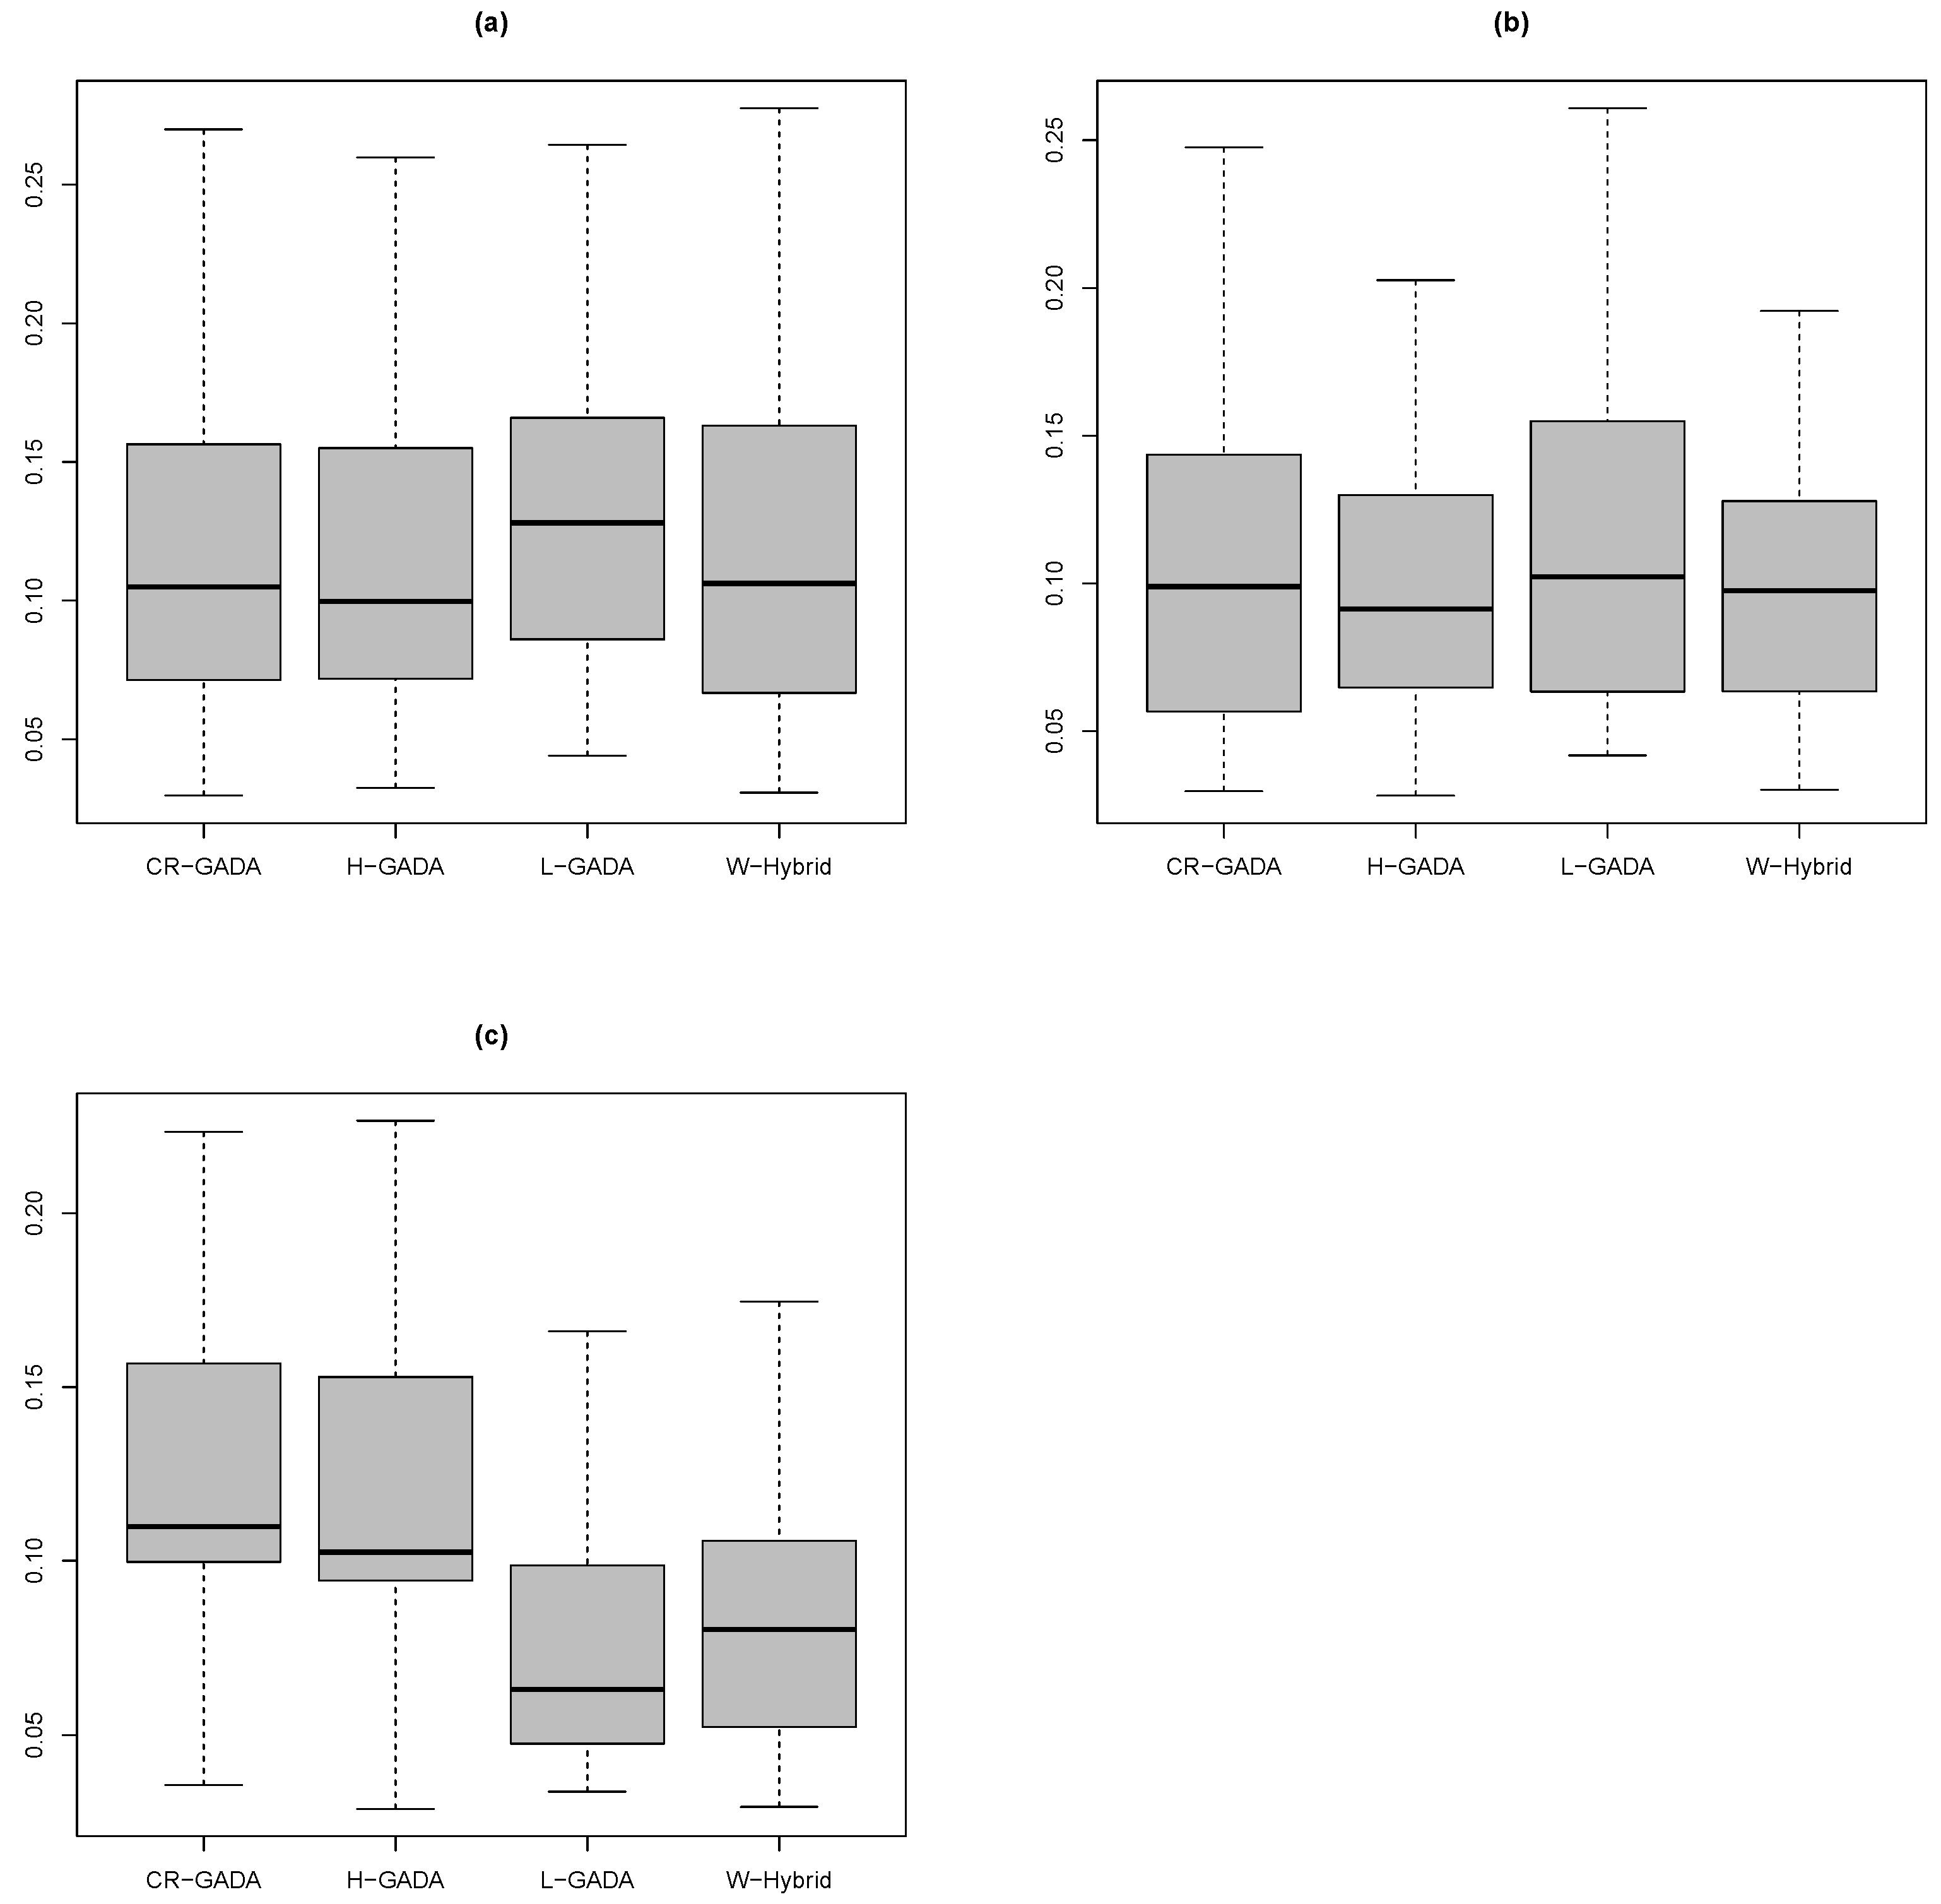
The tests show that the results for the MAPE function calculated for the C-R GADA, Hossfeld GADA and the proposed methodology were equivalent (Figure 4), considering each of the species analysed in this study. The results were: Pinus engelmannii (Wilcoxon–Mann–Whitney test, p-value ), Pinus strobiformis (Wilcoxon–Mann–Whitney test, p-value ), and Pinus arizonica (Wilcoxon–Mann–Whitney test, p-value ). There are small advantages for the proposed methodology for the species Pinus engelmannii () and Pinus arizonica (), if we are considering only the mean MAPE (Table 3).

Figure 4.
Boxplot of the MAPE function calculated for the species (a) P. engelmannii, (b) P. strobiformis, and (c) P. arizonica.
Table 3.
Basic statistics calculated for the MAPE function for each species and model of the study.
4. Conclusions
The results unambiguously show, at least for the population analyzed, the accuracy and feasibility of the proposed methodology presented in this study. Although this methodology cannot be classified as completely dynamic, such as the ADA or GADA methodologies, we consider it as semi-dynamic, since it will always need to estimate the parameter for each of individual and assumes that one of the parameters is site-specific.
However, if this behavior presented by the parameters and can be reproduced in other data sets, this will greatly reduce the computational effort in obtaining the parameters of the models, because the parameter space is smaller.
It would be interesting in a future study to test the same hypothesis with other growth models and also see whether this behavior repeats, and still further try to understand from the biological point of view the reasons of such behavior.
Author Contributions
Conceptualization, J.M.B.-P. and C.W.; methodology, M.d.A.S., C.W.; software, M.d.A.S. and J.M.B.-P.; validation, C.W., J.C.H.-D. and J.G.E.-F.; formal analysis, C.W. and J.M.B.-P.; investigation, J.M.T.-V.; resources, C.W.; data curation, C.W.; writing—original draft preparation, J.M.B.-P.; writing—review and editing, C.W. and C.A.L.-S.; visualization, J.C.H.-D.; supervision, C.W.; project administration, C.W.; funding acquisition, C.W. All authors have read and agreed to the published version of the manuscript.
Funding
This material is based on work supported by the Consejo Nacional de Ciencia y Tecnología of Mexico (CONACYT) and the Comisión Nacional Forestal (CONAFOR). Moreover, CONACYT provided financial support to Marcos de Almeida Souza for his master’s studies.
Data Availability Statement
Not available.
Acknowledgments
We are grateful to the anonymous reviewers of this document.
Conflicts of Interest
The authors declare no conflict of interest.
References
- Vanclay, J.K. Modelling Forest Growth and Yield: Applications to Mixed Tropical Forests; CAB International: Wallingford, UK, 1994; p. 537. [Google Scholar]
- Mitchell, K.J. Sylver: Modelling the impact of silviculture on yield, lumber value, and economic return. For. Chron. 1988, 64, 127–131. [Google Scholar] [CrossRef]
- Richards, F.J. A flexible growth function for empirical use. J. Exp. Botany 1959, 10, 290–300. [Google Scholar] [CrossRef]
- Hossfeld, J.W. Mathematik für Forstmänner, Ökonomen und Cameralisten. Gotha 1822, 4, 310. [Google Scholar]
- Weibull, W. A Statistical Distribution Function of Wide Applicability. J. Appl. Mech. 1951, 18, 293–297. [Google Scholar] [CrossRef]
- Cieszewski, C.J. Comparing Fixed- and Variable-Base-Age Site Equations Having Single Versus Multiple Asymptotes. For. Sci. 2002, 48, 7–23. [Google Scholar]
- Tofallis, C. A Better Measure of Relative Prediction Accuracy for Model Selection and Model Estimation. J. Oper. Res. Soc. 2015, 66, 1352–1362. [Google Scholar] [CrossRef]
- Bailey, R.L.; Clutter, J.L. Base-Age Invariant Polymorphic Site Curves. For. Sci. 1974, 20, 155–159. [Google Scholar]
- Bailey, R.L.; Clutter, J.L. Modeling and Prediction of Forest Growth Variables based on Multilevel nonlinear Mixed Models. For. Sci. 2001, 47, 311–321. [Google Scholar]
- R Core Team. R: A Language and Environment for Statistical Computing; R Foundation for Statistical Computing: Vienna, Austria, 2017. [Google Scholar]

Disclaimer/Publisher’s Note: The statements, opinions and data contained in all publications are solely those of the individual author(s) and contributor(s) and not of MDPI and/or the editor(s). MDPI and/or the editor(s) disclaim responsibility for any injury to people or property resulting from any ideas, methods, instructions or products referred to in the content. |
© 2020 by the authors. Licensee MDPI, Basel, Switzerland. This article is an open access article distributed under the terms and conditions of the Creative Commons Attribution (CC BY) license (https://creativecommons.org/licenses/by/4.0/).