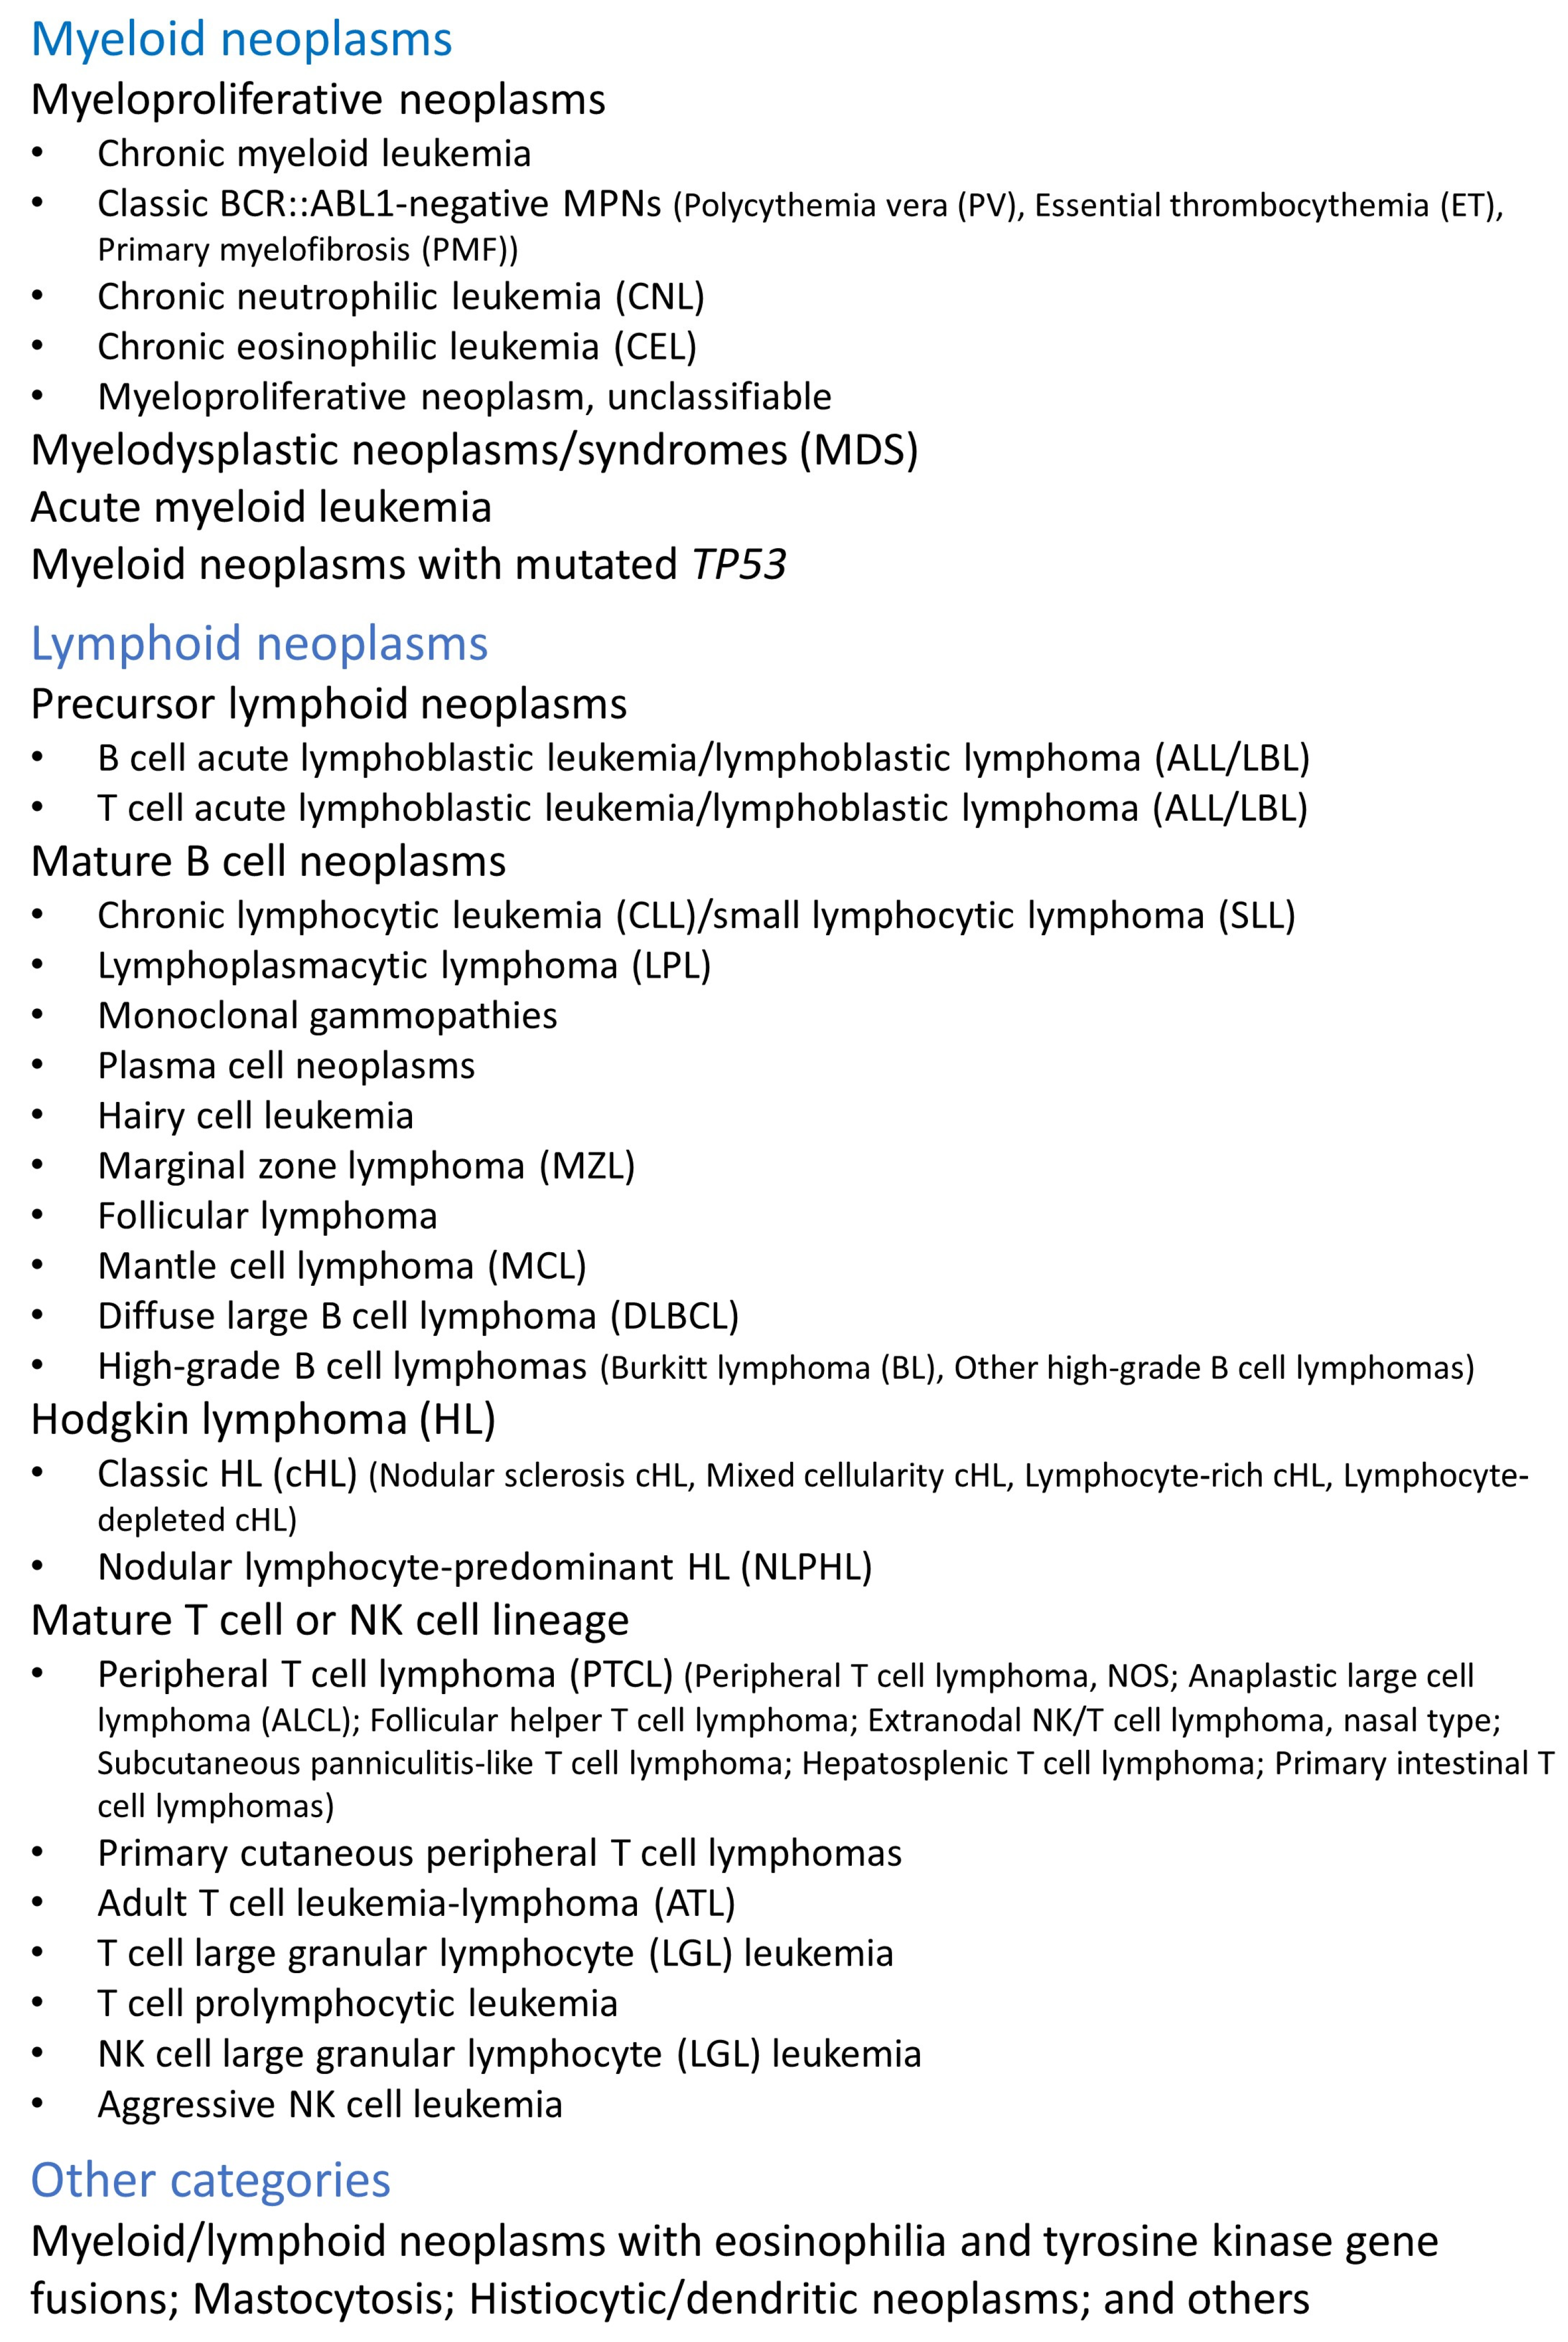
Article

Artificial Intelligence, Lymphoid Neoplasms, and Prediction of MYC, BCL2, and BCL6 Gene Expression Using a Pan-Cancer Panel in Diffuse Large B-Cell Lymphoma

Department of Pathology, School of Medicine, Tokai University, 143 Shimokasuya, Isehara 259-1193, Kanagawa, Japan
*
Author to whom correspondence should be addressed.
Hemato 2024, 5(2), 119-143; https://doi.org/10.3390/hemato5020011
Submission received: 30 December 2023 / Revised: 11 March 2024 / Accepted: 27 March 2024 / Published: 9 April 2024
(This article belongs to the Section Lymphomas)

Abstract

:
Background: Artificial intelligence in medicine is a field that is rapidly evolving. Machine learning and deep learning are used to improve disease identification and diagnosis, personalize disease treatment, analyze medical images, evaluate clinical trials, and speed drug development. Methods: First, relevant aspects of AI are revised in a comprehensive manner, including the classification of hematopoietic neoplasms, types of AI, applications in medicine and hematological neoplasia, generative pre-trained transformers (GPTs), and the architecture and interpretation of feedforward neural net-works (multilayer perceptron). Second, a series of 233 diffuse large B-cell lymphoma (DLBCL) patients treated with rituximab-CHOP from the Lymphoma/Leukemia Molecular Profiling Project (LLMPP) was analyzed. Results: Using conventional statistics, the high expression of MYC and BCL2 was associated with poor survival, but high BCL6 was associated with a favorable overall survival of the patients. Then, a neural network predicted MYC, BCL2, and BCL6 with high accuracy using a pan-cancer panel of 758 genes of immuno-oncology and translational research that includes clinically relevant actionable genes and pathways. A comparable analysis was performed using gene set enrichment analysis (GSEA). Conclusions: The mathematical way in which neural networks reach conclusions has been considered a black box, but a careful understanding and evaluation of the architectural design allows us to interpret the results logically. In diffuse large B-cell lymphoma, neural networks are a plausible data analysis approach.

1. Introduction

1.1. Classification of Hematopoietic Neoplasms

The current classification of hematopoietic neoplasms integrates data from several sources, including histological features, immunophenotype, molecular pathology, and clinical features [1]. Therefore, there is a consensus between pathologists, hematologists, oncologists, geneticists, and bioinformaticians [1,2,3,4]. The classification can be divided into myeloid neoplasms, lymphoid neoplasms, and other categories, such as mastocytosis and histiocytic/dendritic neoplasms [1,5].
Myeloid neoplasms derive from progenitor cells from the bone marrow and can differentiate into erythrocytes, granulocytes, monocytes, and megakaryocytes. They include myeloproliferative neoplasms, such as chronic myeloid leukemia, acute myeloid leukemia, and myelodysplastic syndromes [1,5].
Lymphoid neoplasms originate from B lymphocytes and T lymphocytes. They include precursor B- and T-cell lymphoid neoplasms (acute lymphoblastic leukemia/lymphoma), mature B-cell neoplasms, such as chronic lymphocytic leukemia, follicular lymphoma, diffuse large B-cell lymphoma, and multiple myeloma; mature T or natural killer (NK) cell neoplasms, such as peripheral T-cell lymphoma (PTCL); and Hodgkin lymphoma. Hodgkin lymphoma is characterized by a mixed inflammatory cell background that includes a minority of neoplastic cells, known as Reed–Sternberg cells, and their variants, which are derived from germinal or post-germinal centers [1,5]. Figure 1 and Figure 2 show a summarized version of the classification of hematopoietic neoplasms and characteristic histological images.

1.2. Diffuse Large B-Cell Lymphoma

Diffuse large B-cell lymphoma (DLBCL) is one of the most frequent non-Hodgkin lymphomas (NHLs) and mature B-cell neoplasms, accounting for around 20–25% of NHLs. DLBCL is a heterogeneous disease and has morphologic, genetic, and biologic characteristics [1,5].
The typical clinical presentation is a rapidly enlarging mass in the neck or abdomen. Extranodal involvement is common with high LDH levels, and “B” symptoms are present in 30% of the patients. Advanced stage III/IV is found in 60% of cases [1,5].
DLBCL arises from B lymphocytes of the germinal center of follicles or the post-germinal zone [1,5]. The pathogenesis is multifactorial and includes aberrant BCL6 expression, TP53 downregulation, somatic hypermutation, BCL2 and MYC overexpression, immune evasion by changes in the tumor immune microenvironment and immune checkpoint, and abnormal lymphocyte trafficking [5]. Based on the cell of origin classification and gene expression profiling, DLBCL can be divided into germinal center B-cell type (GCB), activated B-cell type (ABC), and unclassified (UNC) [5,6,7,8,9,10,11,12].
This diagnostic category includes other separate subtypes, such as T-cell/histiocyte-rich large B-cell lymphoma, primary DLBCL of the mediastinum, intravascular large B-cell lymphoma, Epstein–Barr virus-positive large B-cell lymphoma, primary DLBCL of the central nervous system, etc. [1]. Therefore, DLBCL is not a single disease but a collection of morphologically, genetically, and clinically different diseases [3].
The category high-grade B-cell lymphomas (HGBCLs) included the HGBCL, NOS, and HGBCL with MYC and BCL2 and/or BCL6 rearrangements (DH or triple-hit [TH]) [1]. Further studies have supported the differentiation between HGBCL-DH-BCL2, GCB-DLBCL, NOS, and HGBCL-DH-BCL6 [3]. HGBCL and NOS remain a diagnosis of exclusion of cases that are not HGBCL-DH and have intermediate-size cells, often with blastoid or Burkitt-like cytology, but they lack characteristics of DLBCL or Burkitt lymphoma [3]. Of note, more detailed descriptions are found in the publications of the currently updated lymphoma classification [3,4].
This histological variability of DLBCL is shown in Figure 3.

1.3. Types of Artificial Intelligence

Artificial intelligence (AI) is a discipline of data analysis that combines the information present in datasets with information technology and data processing methodology to solve problems. AI includes machine learning and deep learning methods that can make predictions (outputs) based on several predictors (inputs).
There are several definitions and subtypes of AI. The most commonly used AI is weak AI or narrow AI (ANI), which aims to solve specific and concrete problems, such as autonomous driving vehicles. Conversely, strong AI emulates the human mind. Within strong AI, two subtypes are defined. (1) Artificial general intelligence (AGI) equals the human mind, including awareness of oneself and the environment. AGI manages to identify problems, learn how to solve them, and make early plans to recognize and address emerging issues. (2) Artificial superintelligence (ASI) is more advanced than human intellect (Figure 4).

1.4. Applications of Artificial Intelligence in Medicine

Nowadays, there are many applications of AI, the most common being speech recognition that transforms human speech into text, virtual agents that are usually used in customer portals and replace frequently asked questions (FAQs), computer vision that acquires information and meaningful data from images and visual inputs and utilizes convolutional neural networks, recommendation engines that analyze previously data by algorithms and identify data trends, and automated trading in stocks.
AI has numerous applications in the medical field, and in recent years, there has been an exponential increase in the number of publications about AI in medicine. If properly designed and implemented, AI can be beneficial in the practice of medicine, including disease detection and diagnosis, personalized medicine, medical imaging, clinical trial effectiveness, and drug development (Table 1).

1.5. Applications of Artificial Intelligence in Hematological Neoplasia

AI applications in the field of hematopathology have also been developed. An advanced PubMed search that focused on the title and abstracts with the keywords “artificial intelligence” and “lymphoma” resulted in 133 entries. Table 2 shows some of the most relevant studies (because of length restraints, not all valuable studies are shown). The types of AI-based analyses include the evaluation of clinicopathological features, gene expression, mutational landscapes using next-generation sequencing, histological characteristics, and PE/TC images. The types of hematological neoplasia ranged from leukemia to Hodgkin’s lymphoma and non-Hodgkin’s lymphoma (Table 2).

1.6. Paradigm of Generative Pretrained Transformers

Generative pretrained transformers (GPTs) are a type of language model that belongs to the field of generative artificial intelligence [45]. These types of neural networks handle natural language processing analyses and were introduced by Google in 2017 [46]. A transformer is a deep learning architecture based on the multihead self-attention mechanism that learns context and understanding through sequential data analysis. It can translate text and speech in near real time [46]. The architecture is shown in Appendix A.
Transformers have several applications. For example, they can be used to analyze organic molecules for designing antiviral candidate analogs, so this type of analysis can accelerate drug discovery [47]. GPT technology has been applied in the medical field as well, but with a focus on language model capabilities, for example, in radiology reporting. A GPT-4 model processed 100 anonymized radiology reports. For each report, an AI-generated report was created. The AI-generated reports are reliable [45]. GPT-4 was used in data mining and labeling oncologic phenotypes from CT reports [48] and in writing operative notes made by ophthalmic teams following ocular or ophthalmic surgery [49]. Of note, ChatGPT is open access but not open source; it is closed source. Therefore, it is not possible to access or modify the model’s source code and it cannot be subjected to peer review.

1.7. Function and Architecture of Multilayer Perceptron

Neural networks can be classified into feedforward neural networks, also known as multilayer perceptrons (MLPs), convolutional neural networks (CNNs), and recurrent neural networks (RNNs). MLPs are the primary focus of this article.
Physiological conditions and disease models can be described by numbers and relationships between numbers. The relationships between numbers are called functions [“f(x)”, “x” being the input variable]. The goal of artificial intelligence is to write programs that can understand and predict these models or functions, or rather have the programs write themselves so that they can build their own functions [50].
Function approximation is the process of selecting a defined function among those that are well characterized and that approximates (i.e., matches) a target function (Figure 5A) [50,51,52,53,54,55]. In computer science, function approximation is used to make predictions and is also used when theoretical models are unavailable and are difficult to compute. Two types of situations can be found. First, a known target function can be approximated by other specific classes of functions that have more advantageous properties. Second, a target function may be unknown and only a series of points are known, and by several techniques, a more appropriate function is approximated [50,51,52,53,54,55].
Artificial neural networks have the ability of function approximation and build their own functions to approximate physiological conditions and disease models. Functions are “input-output machines”, in which an input set of numbers (i.e., predictors, “x”) is taken, and the output (create) is a corresponding set of numbers (“y”). The function [f(x)] defines the relationship between these numbers [(x -> f(x) -> y)] [56]. Neural networks are used when the definition of the functions that we are trying to approximate is unknown and only the dataset points of inputs and outputs are known. Curve fitting approximates a function that fits the data points, making it possible to accurately predict outputs given inputs that are not in the dataset [57,58,59]. Therefore, neural networks (NNs) work as a universal function approximator for different curves of datasets [60]. In other words, a network itself is a function that approximates an unknown target function [f(x) ≈ NN(x)].
A simple form of a neural network is the fully connected feedforward network (also known as multilayer perceptron) (Figure 5B). The inputs (X) are called features, and the outputs (Y) are predictions and take the form of vectors (arrays of numbers). The network comprises several simple functions called neurons (Figure 6A). The dimension of a neural network refers to the number of neurons in each layer.
Neurons take many inputs (X) but only produce one output (Y). Each input is multiplied by its own weight (W), and in the equation, one extra weight known as bias is added (W4) [=W1X1 + W2X2 + W3X3 + W4 (Bias)] (Figure 6A). This weighted sum can be rewritten using linear algebra (Figure 6B). The inputs are included in a vector with an extra one for the bias. The weights are included in another vector. Figure 6(C1) shows an example of the dot product. After addition, the product is passed to an activation function to add nonlinearity to the neural network, such as ReLU. There are other types of activation functions, such as Leaky ReLU and sigmoid (Figure 6(C2)). In a neural network, the output vector is successively fed as inputs to the next layer until the final output. The point is that each neuron is responsible for learning a small piece or feature of the overall function, and a complicated function can be built by combining many neurons. Interestingly, with an infinite number of neurons, any function could be built. During the training of the network, the values of the weights (parameters) are determined. The aim of the training is to minimize the network’s error (loss), which is a measurement of the difference between the predicted outputs and the real (true) outputs. With time, the loss decreases. The backpropagation algorithm is used to achieve this optimization. Gradient descent is an optimization algorithm that is commonly used to train machine learning models and neural networks. The network improves its predictions until one or more of the stopping criteria are met.
Appendix B describes activation functions in more detail.

1.8. Performance Parameters

The confusion matrix summarizes the predictions of the neural network against the true values of the dataset (Table 3). Accuracy is the percentage of cases correctly classified. Precision determines how accurately the neural network determines the positive outputs; high-precision neural networks are characterized by low false positive percentages. Recall measures the ability to detect positive predictions.
Accuracy = (TP + TN)/(TP + TN + FP + FN).
Precision = TP/(TP + FP).
Recall/Sensitivity/True Positive Rate (TPR) = TP/(TP + FN).
False Positive Rate = FP/(FP + TN) = 1-Specificity.
Specificity = TN/(TN + FP).
F1 Score = TP/(TP + 0.5 (FP + FN) = 2/(1/Precision) + (1/Recall).
The receiver operating characteristic (ROC) curves are used to compare the performance of the deep learning models. The ROC curve shows the relationship between the true positive rate (sensitivity) and the false positive rate (1-specificity). The area under the curve (AUC) ranges from 0 to 1, and larger AUC values indicate better performance. An AUC of 0.5 indicates no discriminative power (Figure 7).

2. Material and Methods

This section shows an example of a feedforward neural network analysis using a diffuse large B-cell lymphoma dataset.
The diffuse large B-cell lymphoma (DLBCL) dataset GSE10846 from the Lymphoma/Leukemia Molecular Profiling Project (LLMPP) was downloaded from the National Center for Biotechnology Information (NCBI) webpage of the National Library of Medicine (https://www.ncbi.nlm.nih.gov/, last accessed on 25 December 2023).
This series is characterized by being very well annotated and reliable. It was last updated on 25 March 2019. This was a retrospective study that included 420 cases. For this study, 233 patients treated with rituximab-CHOP were selected, and 181 patients treated with CHOP were discarded.
RNA was extracted from frozen tissue samples and analyzed using the Affymetrix Human Genome U133 Plus 2.0 Array (HG-U133_Plus_2), which has 20,684 genes. It is a conventional series of DLBCL. All clinicopathological characteristics were described in our previous publication and the original LLMPP [61,62,63]. In summary, all cases were treated with R-CHOP, all were nodal biopsies, and the male/female ratio was 134/99. The mean age was 60.2 years (±16.2 STD), with a range from 17 to 92 years, and the cases with more than 60 years were 120/233 (51.5%). According to the cell of origin classification, 107 of 233 (45.9%) cases were germinal center B-cell-like (GCB), 93/233 (85.8%) were activated B-cell-like (ABC), and 33/233 (14.2%) were unclassified. According to the International Prognostic Index (IPI), the score was 1 in 32/164 (19.5%), 2 in 69/164 (42.1%), 3 in 52/164 (31.7%), and 4 in 11/164 (6.7%).
Bioinformatics analysis used normalized and log2-transformed data. It started by testing if the overall survival of the patients could be stratified using three relevant DLBCL pathogenic genes: MYC, BCL2, and BCL6. The survival of the patients was first tested using a Cox regression analysis. After searching for an adequate cutoff, the survival of the patients was tested using the Kaplan–Meier and log-rank tests.
A multilayer perceptron analysis was performed to predict the expression of MYC, BCL2, and BCL6 as qualitative variables (low vs. high, using the same cutoff as that of the Kaplan–Meier analysis). The predictors were a pan-cancer panel of 758 genes for immuno-oncology and translational research that included clinically relevant actionable genes and pathways (Appendix C Figure A2). The neural network used the 758 genes as inputs, and the gene expression values were rescaled using the standardized formula. The dataset partition was the conventional 70% of the training set and 30% of the testing set. The best architecture was searched with a minimum of units in the hidden layer of 1 to a maximum of 1000. The type of training was batch, and the scaled conjugate gradient was an optimization algorithm. More details are provided in the Results section.
The algorithms of MLP are shown in [64].

3. Results

3.1. Neural Networks

This series of R-CHOP-treated DLBCL is a conventional series because the overall survival of the patients can be stratified according to the IPI and clinical stage. The gene expression of MYC, BCL2, and BCL6 was correlated with overall survival.
The cutpoints of the gene expression values were searched, making equal percentiles on the scanned cases with two or three cutpoints and interval widths of 33% or 25%, and the survival analysis displayed three or four curves, respectively. Based on the plots, the most adequate cutpoint (i.e., cutoff) was defined as being the most statistically significant, but it also had a reasonable distribution of cases (Table 4).
High MYC expression was associated with unfavorable survival; Hazard Risk (HR) = 1.9 (95%CI 1.12–3.28); and p = 0.019 (Cox regression). High BCL2 was also associated with poor prognosis; HR = 1.8 (95%CI 1.0–2.9); and p = 0.036. Conversely, high BCL6 was associated with a favorable prognosis; HR = 0.4 (95%CI 0.2–0.6); and p < 0.001 (Figure 8).
A feedforward neural network was used to predict MYC, BCL2, and BCL6 expression using a pan-cancer panel of 758 genes for immuno-oncology and translational research that includes clinically relevant actionable genes and pathways. The characteristics and parameters of the different neural networks are detailed in Table 5. The network performance was realistic and between 70% and 90% accuracy. The performance for the prediction of BCL2 was moderate, with an area under the curve (AUC) of 0.783 and an accuracy of 73.4% for the training and 63.3% for the testing set. The performances of MYC and BCL6 were higher, with AUCs of 0.925 and 0.939, respectively. The accuracies for MYC were 86.3% (training) and 88.9% (testing). The accuracies for BCL6 were 88.2% (training) and 86.1% (testing). The first ten most relevant genes for the prediction of the marker, based on the sensitivity analysis, are also shown (Table 5, Table 6, Table 7 and Table 8, Figure 9 and Figure 10).
The parameter estimates of the neural network are shown in [65].
The independent variable importance analysis performs a sensitivity analysis, which calculates the relevance of each predictor in determining the neural network. The analysis is based on the combined training and testing samples, or only on the training sample if there is no testing sample. As a result, it creates a table and a chart displaying the importance and normalized importance of each predictor. The table has been uploaded to Zenodo repositories; please refer to the data availability statement.

3.2. Gene Set Enrichment Analysis (GSEA)

This study used a 758 gene pan-cancer panel of immuno-oncology and translational research, which included clinically relevant actionable genes and pathways as input variables to predict MYC, BCL2, and BCL6 expression. The prognostic relevance of this panel was also tested using other conventional bioinformatics techniques, such as GSEA [66,67,68]. The GSEA was performed on the following biological states (i.e., phenotypes): overall survival (dead vs. alive), MYC expression (high vs. low), BCL2 (high vs. low), and BCL6 (high vs. low) using the same cutoffs of the neural networks analyses. The primary result of the GSEA is the enrichment score (ES), which reflects the degree to which a gene set is overrepresented at the top or bottom of a ranked list of genes [68]. The leading-edge subset of a gene set is the subset of members that contribute most to the ES. For a positive ES, the leading-edge subset is the set of members that appear in the ranked list prior to the peak score. A negative ES is the set of members that appear subsequent to the peak score [68]. Figure 11 shows the results of the GSEA, with the genes of the leading edges. Additionally, due to the relevance of MYC, the GSEA of MYC included several gene sets in the molecular signatures database (MSigDB), including hallmark (H), positional (C1), and curated (C2) gene sets. Several associations were found. For example, high MYC expression correlated with a high expression of genes associated with protein response, MYC targets, DNA repair, oxidative phosphorylation pathways, and chromosome 3p25 locus-associated genes (Figure 12).

4. Discussion

Diffuse large B-cell lymphoma (DLBCL) is one of the most frequent non-Hodgkin lymphomas and mature B-cell hematological neoplasms. DLBCL is not a single disease but a group of different diseases that differ in terms of morphological, genetic, and clinical characteristics [1,3]. There are several morphological subtypes, such as centroblastic, immunoblastic, and anaplastic, but their identification by histopathologists suffers from reproducibility. There are other phenotypic variants, such as the CD5 positive, MYC positive, and BCL2 positive, which tend to be associated with a poor prognosis [1,2,3,69,70,71,72].
The classification using cell-of-origin markers that include germinal center B-cell-like, activated B-cell-like, and unspecified is clinically relevant. Cell-of-origin classification requires the use of gene expression data, which are not always available. However, cell-of-origin classification can also be achieved using immunohistochemistry combining the assessment of CD10, BCL6, and MUM-1 (IRF4) [1]. Recently, the lymphoma classification has been updated with the incorporation of additional molecular features [2,3,4,69,70,71,72,73,74,75,76].
The 2016 WHO classification included the category of high-grade B-cell lymphoma (HGBCL) with MYC, BCL2, and/or BCL6 rearrangements, which confer double-hit or triple-hit status and poor prognosis [1]. In this study, the gene expression of a large series of R-CHOP-treated DLBCL was analyzed, focusing on the expression of MYC, BCL2, and BCL6. The results showed that a high expression of MYC and BCL2 was associated with poor prognosis, and BCL6 with a favorable outcome. Importantly, the neural network was able to predict these genes using a pan-cancer panel of 758 genes for immuno-oncology and translational research that included clinically relevant actionable genes and pathways. For each marker, the most relevant cancer genes are different. For example, MTOR is associated with MYC, and CCND1 with BCL6. Of note, the accuracy for BCL2 prediction was moderate to low. Therefore, the results of BCL2 must be taken with more caution.
The neural network analysis was complemented with a gene set enrichment analysis (GSEA). The genes highlighted in the leading edges are the ones more relevant for the gene expression of MYC, BCL2, and BCL6 phenotypes (high vs. low). In a clinical setting, the simplest approach would be to look into MYC, BCL2, and BCL6 gene expression or protein levels, including the rearrangement by FISH. Additionally, as shown in Figure 8, relevant markers would be CD163, CD16, IL10, and IRF4, among others.
Neural networks are a subtype of machine learning and include deep learning algorithms. The architecture of the neural network comprises node layers, including an input layer, one or more hidden layers, and an output layer. When the output value of an individual node is above a specified threshold, the node is activated and sends data to the next layer. When the value is below the threshold, no data are passed. The principal focus of this study was feedforward networks, but there are other types of neural networks. For example, recurrent neural networks are used in natural language processing and speech recognition. Conversely, convolutional neural networks are often used in computer vision analysis. Convolutional neural networks have three main types of layers: a convolutional layer, a pooling layer, and a fully connected layer. There are many architectures, such as AlexNet, VGGNet, GoogleNET, ResNet, etc. This study focused on multilayer perceptron, which is a type of feedforward network, to analyze gene expression data, but the analysis of histological images could be performed in the future as well, focusing on lymphoma and other hematological diseases, such as leukemia, myeloma, and myelodysplastic syndromes.
The birth of artificial intelligence (AI) was denoted by Alan Turing’s seminal work “Computing Machinery and Intelligence”, which described AI as systems that act like humans. AI combines computer science and robust datasets to make predictions and classifications based on input data [77]. Our group has worked in predictive analytics and AI in recent years in the field of lymphoma [78] and other diseases, such as celiac disease [79] and ulcerative colitis [80]. In the lymphoma field, we identified several markers of relevance, such as ENO3 [28], TNFAIP8 [81], PD-L1 [81], CASP8 [82], CSF1R [61], immune response [83], RGS1 [26], FOXP3, PD-1, IL10, and CD163 [29,30,84], as well as BCL6 in DLBCL [85,86] and FL [87]. Therefore, we have proven that this technology is useful. A turning point in AI has been the release of OpenAI’s ChatGPT, which is a trained conversational model. However, it is important to point out that thinking and making our own decisions is what makes us human. Letting machines think for us makes us less free and less conscious. Therefore, no machine should be made in the likeness of the human mind [77].

5. Conclusions

Artificial intelligence in medicine uses machine learning and neural network models to improve disease identification and diagnosis, personalize disease treatment, analyze medical images, evaluate clinical trials, and speed up drug development.
The mathematical way in which neural networks reach conclusions has been considered a black box, but a careful understanding and evaluation of the architectural design allows us to interpret the results logically. In diffuse large B-cell lymphoma, neural networks are a plausible data analysis approach.

Author Contributions

Conceptualization, methodology, formal analysis, and writing: J.C. Supervision: N.N. All authors have read and agreed to the published version of the manuscript.

Funding

This research was funded by the Ministry of Education, Culture, Sports, Science and Technology (MEXT) and the Japan Society for the Promotion of Science (JSPS), grant number KAKEN 23K06454.

Institutional Review Board Statement

The study was conducted in accordance with the Declaration of Helsinki and was approved by the Institutional Review Board of Tokai University, School of Medicine (IRB20-156).

Informed Consent Statement

Not applicable.

Data Availability Statement

All data are available upon request to Joaquim Carreras ([email protected]). The algorithms of MLP are shown in Carreras, J. (2024). Multilayer perceptron (Version 1). Zenodo. https://doi.org/10.5281/zenodo.10727457. The parameter estimates of the MLPs are shown in Joaquim, C. (2024). MLP parameter estimates (Version 1) [Data set]. Zenodo. https://doi.org/10.5281/zenodo.10804249. The independent variable importance is in Joaquim, C. (2024). Independent variable importance (Version 1) [Data set]. Zenodo. https://doi.org/10.5281/zenodo.10805431, accessed on 29 December 2023.

Acknowledgments

We thank the creators of the LLMPP.

Conflicts of Interest

The author declares no conflicts of interest.

Appendix A

Figure A1: Model architecture of the transformer.
This figure depicts the general architecture of the transformer. It uses stacked self-attention and point-wise, fully connected layers for both the encoder (left) and the transformer (right) [46].
Figure A1. Usually, the guideline is to use ReLU first and later test the others.
Hemato 05 00011 g0a1

Appendix B

Activation functions
Neural networks use activation functions to add nonlinearity. There are three types of neural network activation functions: binary step function, linear activation function, and nonlinear activation function. Regarding nonlinear, the most frequent are the sigmoid/logistic activation function, Tanh function (hyperbolic tangent), ReLU function, leaky ReLU, parametric ReLU, ELU, softmax function, swish, GELU, and SELU [88,89,90,91].
Usually, the guideline is to use ReLU first and later test the others.
Additional guidelines are as follows. The ReLU activation function is used in hidden layers but the sigmoid/logistic and Tanh functions are not. The Swish function is used when the neural network depth is greater than 40 layers.
For the output layer, the type of activation function depends on the type of problem that the neural network is handling. Regression uses a linear activation function, binary classification of the sigmoid/logistic, and multiclass classification of the softmax. Multilabel classification is for the sigmoid [88,89,90,91].
In the hidden layer, the type of activation function also changes. Convolutional neural networks (CNNs) use ReLU and recurrent neural networks use Tanh and/or sigmoid.

Appendix C

Figure A2. Gene panel.
Hemato 05 00011 g0a2

References

  1. WHO. Classification of Tumours of Haematopoietic and Lymphoid Tissues. In WHO Classification of Tumours, 4th ed.; Swerdlow, S.H., Campo, E., Harris, N.L., Jaffe, E.S., Pileri, S.A., Stein, H., Thiele, J., Eds.; WHO: Geneva, Switzerland, 2017; Volume 2, ISBN 9789283244943. [Google Scholar]
  2. de Leval, L.; Jaffe, E.S. Lymphoma Classification. Cancer J. 2020, 26, 176–185. [Google Scholar] [CrossRef]
  3. Campo, E.; Jaffe, E.S.; Cook, J.R.; Quintanilla-Martinez, L.; Swerdlow, S.H.; Anderson, K.C.; Brousset, P.; Cerroni, L.; de Leval, L.; Dirnhofer, S.; et al. The International Consensus Classification of Mature Lymphoid Neoplasms: A report from the Clinical Advisory Committee. Blood 2022, 140, 1229–1253. [Google Scholar] [CrossRef]
  4. Alaggio, R.; Amador, C.; Anagnostopoulos, I.; Attygalle, A.D.; Araujo, I.B.O.; Berti, E.; Bhagat, G.; Borges, A.M.; Boyer, D.; Calaminici, M.; et al. The 5th edition of the World Health Organization Classification of Haematolymphoid Tumours: Lymphoid Neoplasms. Leukemia 2022, 36, 1720–1748. [Google Scholar] [CrossRef]
  5. Freedman, A.S.; Friedberg, J.W.; Aster, J.C.; Gurbuxani, S.; Sekeres, M.A. Classification of Hematopoietic Neoplasms. UpToDate, 12 January 2024. Available online: https://www.uptodate.com/contents/classification-of-hematopoietic-neoplasms (accessed on 19 February 2024).
  6. Thieblemont, C.; Briere, J.; Mounier, N.; Voelker, H.U.; Cuccuini, W.; Hirchaud, E.; Rosenwald, A.; Jack, A.; Sundstrom, C.; Cogliatti, S.; et al. The germinal center/activated B-cell subclassification has a prognostic impact for response to salvage therapy in relapsed/refractory diffuse large B-cell lymphoma: A bio-CORAL study. J. Clin. Oncol. 2011, 29, 4079–4087. [Google Scholar] [CrossRef]
  7. Staudt, L.M. Molecular diagnosis of the hematologic cancers. N. Engl. J. Med. 2003, 348, 1777–1785. [Google Scholar] [CrossRef]
  8. Shipp, M.A.; Ross, K.N.; Tamayo, P.; Weng, A.P.; Kutok, J.L.; Aguiar, R.C.; Gaasenbeek, M.; Angelo, M.; Reich, M.; Pinkus, G.S.; et al. Diffuse large B-cell lymphoma outcome prediction by gene-expression profiling and supervised machine learning. Nat. Med. 2002, 8, 68–74. [Google Scholar] [CrossRef]
  9. Rosenwald, A.; Wright, G.; Chan, W.C.; Connors, J.M.; Campo, E.; Fisher, R.I.; Gascoyne, R.D.; Muller-Hermelink, H.K.; Smeland, E.B.; Giltnane, J.M.; et al. The use of molecular profiling to predict survival after chemotherapy for diffuse large-B-cell lymphoma. N. Engl. J. Med. 2002, 346, 1937–1947. [Google Scholar] [CrossRef]
  10. Hans, C.P.; Weisenburger, D.D.; Greiner, T.C.; Gascoyne, R.D.; Delabie, J.; Ott, G.; Muller-Hermelink, H.K.; Campo, E.; Braziel, R.M.; Jaffe, E.S.; et al. Confirmation of the molecular classification of diffuse large B-cell lymphoma by immunohistochemistry using a tissue microarray. Blood 2004, 103, 275–282. [Google Scholar] [CrossRef]
  11. Alizadeh, A.A.; Gentles, A.J.; Alencar, A.J.; Liu, C.L.; Kohrt, H.E.; Houot, R.; Goldstein, M.J.; Zhao, S.; Natkunam, Y.; Advani, R.H.; et al. Prediction of survival in diffuse large B-cell lymphoma based on the expression of 2 genes reflecting tumor and microenvironment. Blood 2011, 118, 1350–1358. [Google Scholar] [CrossRef]
  12. Alizadeh, A.A.; Eisen, M.B.; Davis, R.E.; Ma, C.; Lossos, I.S.; Rosenwald, A.; Boldrick, J.C.; Sabet, H.; Tran, T.; Yu, X.; et al. Distinct types of diffuse large B-cell lymphoma identified by gene expression profiling. Nature 2000, 403, 503–511. [Google Scholar] [CrossRef]
  13. Deng, Z.; Ji, Y.; Han, B.; Tan, Z.; Ren, Y.; Gao, J.; Chen, N.; Ma, C.; Zhang, Y.; Yao, Y.; et al. Early detection of hepatocellular carcinoma via no end-repair enzymatic methylation sequencing of cell-free DNA and pre-trained neural network. Genome Med. 2023, 15, 93. [Google Scholar] [CrossRef]
  14. Yu, X.; Srivastava, S.; Huang, S.; Hayden, E.Y.; Teplow, D.B.; Xie, Y.H. The Feasibility of Early Alzheimer’s Disease Diagnosis Using a Neural Network Hybrid Platform. Biosensors 2022, 12, 753. [Google Scholar] [CrossRef]
  15. Hossain, I.; Maruf, M.H.; Khan, A.R.; Prity, F.S.; Fatema, S.; Ejaz, S.; Khan, A.S. Heart disease prediction using distinct artificial intelligence techniques: Performance analysis and comparison. Iran. J. Comput. Sci. 2023, 6, 397–417. [Google Scholar] [CrossRef]
  16. Upton, R.; Mumith, A.; Beqiri, A.; Parker, A.; Hawkes, W.; Gao, S.; Porumb, M.; Sarwar, R.; Marques, P.; Markham, D.; et al. Automated Echocardiographic Detection of Severe Coronary Artery Disease Using Artificial Intelligence. JACC Cardiovasc. Imaging 2022, 15, 715–727. [Google Scholar] [CrossRef] [PubMed]
  17. Cikes, M.; Sanchez-Martinez, S.; Claggett, B.; Duchateau, N.; Piella, G.; Butakoff, C.; Pouleur, A.C.; Knappe, D.; Biering-Sorensen, T.; Kutyifa, V.; et al. Machine learning-based phenogrouping in heart failure to identify responders to cardiac resynchronization therapy. Eur. J. Heart Fail. 2019, 21, 74–85. [Google Scholar] [CrossRef]
  18. Jacobson, N.C.; Nemesure, M.D. Using Artificial Intelligence to Predict Change in Depression and Anxiety Symptoms in a Digital Intervention: Evidence from a Transdiagnostic Randomized Controlled Trial. Psychiatry Res. 2021, 295, 113618. [Google Scholar] [CrossRef] [PubMed]
  19. Sasaki, K.; Jabbour, E.J.; Ravandi, F.; Konopleva, M.; Borthakur, G.; Wierda, W.G.; Daver, N.; Takahashi, K.; Naqvi, K.; DiNardo, C.; et al. The LEukemia Artificial Intelligence Program (LEAP) in chronic myeloid leukemia in chronic phase: A model to improve patient outcomes. Am. J. Hematol. 2021, 96, 241–250. [Google Scholar] [CrossRef]
  20. Dembrower, K.; Crippa, A.; Colon, E.; Eklund, M.; Strand, F.; the ScreenTrustCAD Trial Consortium. Artificial intelligence for breast cancer detection in screening mammography in Sweden: A prospective, population-based, paired-reader, non-inferiority study. Lancet Digit. Health 2023, 5, e703–e711, Correction in Lancet Digit. Health 2023, 5, e646. [Google Scholar] [CrossRef]
  21. Abadia, A.F.; Yacoub, B.; Stringer, N.; Snoddy, M.; Kocher, M.; Schoepf, U.J.; Aquino, G.J.; Kabakus, I.; Dargis, D.; Hoelzer, P.; et al. Diagnostic Accuracy and Performance of Artificial Intelligence in Detecting Lung Nodules in Patients with Complex Lung Disease: A Noninferiority Study. J. Thorac. Imaging 2022, 37, 154–161. [Google Scholar] [CrossRef]
  22. Lang, K.; Josefsson, V.; Larsson, A.M.; Larsson, S.; Hogberg, C.; Sartor, H.; Hofvind, S.; Andersson, I.; Rosso, A. Artificial intelligence-supported screen reading versus standard double reading in the Mammography Screening with Artificial Intelligence trial (MASAI): A clinical safety analysis of a randomised, controlled, non-inferiority, single-blinded, screening accuracy study. Lancet Oncol. 2023, 24, 936–944. [Google Scholar] [CrossRef]
  23. Wallace, M.B.; Sharma, P.; Bhandari, P.; East, J.; Antonelli, G.; Lorenzetti, R.; Vieth, M.; Speranza, I.; Spadaccini, M.; Desai, M.; et al. Impact of Artificial Intelligence on Miss Rate of Colorectal Neoplasia. Gastroenterology 2022, 163, 295–304.e295. [Google Scholar] [CrossRef]
  24. Wu, L.; He, X.; Liu, M.; Xie, H.; An, P.; Zhang, J.; Zhang, H.; Ai, Y.; Tong, Q.; Guo, M.; et al. Evaluation of the effects of an artificial intelligence system on endoscopy quality and preliminary testing of its performance in detecting early gastric cancer: A randomized controlled trial. Endoscopy 2021, 53, 1199–1207. [Google Scholar] [CrossRef] [PubMed]
  25. Bobee, V.; Drieux, F.; Marchand, V.; Sater, V.; Veresezan, L.; Picquenot, J.M.; Viailly, P.J.; Lanic, M.D.; Viennot, M.; Bohers, E.; et al. Combining gene expression profiling and machine learning to diagnose B-cell non-Hodgkin lymphoma. Blood Cancer J. 2020, 10, 59. [Google Scholar] [CrossRef] [PubMed]
  26. Carreras, J.; Nakamura, N.; Hamoudi, R. Artificial Intelligence Analysis of Gene Expression Predicted the Overall Survival of Mantle Cell Lymphoma and a Large Pan-Cancer Series. Healthcare 2022, 10, 155. [Google Scholar] [CrossRef]
  27. Zhang, H.; Qureshi, M.A.; Wahid, M.; Charifa, A.; Ehsan, A.; Ip, A.; De Dios, I.; Ma, W.; Sharma, I.; McCloskey, J.; et al. Differential Diagnosis of Hematologic and Solid Tumors Using Targeted Transcriptome and Artificial Intelligence. Am. J. Pathol. 2023, 193, 51–59. [Google Scholar] [CrossRef]
  28. Carreras, J.; Hamoudi, R.; Nakamura, N. Artificial Intelligence Analysis of Gene Expression Data Predicted the Prognosis of Patients with Diffuse Large B-Cell Lymphoma. Tokai J. Exp. Clin. Med. 2020, 45, 37–48. [Google Scholar] [PubMed]
  29. Carreras, J.; Roncador, G.; Hamoudi, R. Artificial Intelligence Predicted Overall Survival and Classified Mature B-Cell Neoplasms Based on Immuno-Oncology and Immune Checkpoint Panels. Cancers 2022, 14, 5318. [Google Scholar] [CrossRef] [PubMed]
  30. Carreras, J.; Hiraiwa, S.; Kikuti, Y.Y.; Miyaoka, M.; Tomita, S.; Ikoma, H.; Ito, A.; Kondo, Y.; Roncador, G.; Garcia, J.F.; et al. Artificial Neural Networks Predicted the Overall Survival and Molecular Subtypes of Diffuse Large B-Cell Lymphoma Using a Pancancer Immune-Oncology Panel. Cancers 2021, 13, 6384. [Google Scholar] [CrossRef]
  31. Xu-Monette, Z.Y.; Zhang, H.; Zhu, F.; Tzankov, A.; Bhagat, G.; Visco, C.; Dybkaer, K.; Chiu, A.; Tam, W.; Zu, Y.; et al. A refined cell-of-origin classifier with targeted NGS and artificial intelligence shows robust predictive value in DLBCL. Blood Adv. 2020, 4, 3391–3404. [Google Scholar] [CrossRef]
  32. Bucinski, A.; Marszall, M.P.; Krysinski, J.; Lemieszek, A.; Zaluski, J. Contribution of artificial intelligence to the knowledge of prognostic factors in Hodgkin’s lymphoma. Eur. J. Cancer Prev. 2010, 19, 308–312. [Google Scholar] [CrossRef]
  33. Zhang, W.; Peng, J.; Zhao, S.; Wu, W.; Yang, J.; Ye, J.; Xu, S. Deep learning combined with radiomics for the classification of enlarged cervical lymph nodes. J. Cancer Res. Clin. Oncol. 2022, 148, 2773–2780. [Google Scholar] [CrossRef] [PubMed]
  34. Torrente, M.; Sousa, P.A.; Hernandez, R.; Blanco, M.; Calvo, V.; Collazo, A.; Guerreiro, G.R.; Nunez, B.; Pimentao, J.; Sanchez, J.C.; et al. An Artificial Intelligence-Based Tool for Data Analysis and Prognosis in Cancer Patients: Results from the Clarify Study. Cancers 2022, 14, 4041. [Google Scholar] [CrossRef] [PubMed]
  35. Girum, K.B.; Rebaud, L.; Cottereau, A.S.; Meignan, M.; Clerc, J.; Vercellino, L.; Casasnovas, O.; Morschhauser, F.; Thieblemont, C.; Buvat, I. 18F-FDG PET Maximum-Intensity Projections and Artificial Intelligence: A Win-Win Combination to Easily Measure Prognostic Biomarkers in DLBCL Patients. J. Nucl. Med. 2022, 63, 1925–1932. [Google Scholar] [CrossRef] [PubMed]
  36. Sadik, M.; Lopez-Urdaneta, J.; Ulen, J.; Enqvist, O.; Krupic, A.; Kumar, R.; Andersson, P.O.; Tragardh, E. Artificial intelligence could alert for focal skeleton/bone marrow uptake in Hodgkin’s lymphoma patients staged with FDG-PET/CT. Sci. Rep. 2021, 11, 10382. [Google Scholar] [CrossRef] [PubMed]
  37. Gozzi, F.; Bertolini, M.; Gentile, P.; Verzellesi, L.; Trojani, V.; De Simone, L.; Bolletta, E.; Mastrofilippo, V.; Farnetti, E.; Nicoli, D.; et al. Artificial Intelligence-Assisted Processing of Anterior Segment OCT Images in the Diagnosis of Vitreoretinal Lymphoma. Diagnostics 2023, 13, 2451. [Google Scholar] [CrossRef] [PubMed]
  38. El Hussein, S.; Chen, P.; Medeiros, L.J.; Wistuba, I.; Jaffray, D.; Wu, J.; Khoury, J.D. Artificial intelligence strategy integrating morphologic and architectural biomarkers provides robust diagnostic accuracy for disease progression in chronic lymphocytic leukemia. J. Pathol. 2022, 256, 4–14. [Google Scholar] [CrossRef] [PubMed]
  39. Swiderska-Chadaj, Z.; Hebeda, K.M.; van den Brand, M.; Litjens, G. Artificial intelligence to detect MYC translocation in slides of diffuse large B-cell lymphoma. Virchows Arch. 2021, 479, 617–621. [Google Scholar] [CrossRef]
  40. Mohlman, J.S.; Leventhal, S.D.; Hansen, T.; Kohan, J.; Pascucci, V.; Salama, M.E. Improving Augmented Human Intelligence to Distinguish Burkitt Lymphoma from Diffuse Large B-Cell Lymphoma Cases. Am. J. Clin. Pathol. 2020, 153, 743–759. [Google Scholar] [CrossRef]
  41. Miyoshi, H.; Sato, K.; Kabeya, Y.; Yonezawa, S.; Nakano, H.; Takeuchi, Y.; Ozawa, I.; Higo, S.; Yanagida, E.; Yamada, K.; et al. Deep learning shows the capability of high-level computer-aided diagnosis in malignant lymphoma. Lab. Investig. 2020, 100, 1300–1310. [Google Scholar] [CrossRef]
  42. Steinbuss, G.; Kriegsmann, M.; Zgorzelski, C.; Brobeil, A.; Goeppert, B.; Dietrich, S.; Mechtersheimer, G.; Kriegsmann, K. Deep Learning for the Classification of Non-Hodgkin Lymphoma on Histopathological Images. Cancers 2021, 13, 2419. [Google Scholar] [CrossRef]
  43. El Hussein, S.; Chen, P.; Medeiros, L.J.; Hazle, J.D.; Wu, J.; Khoury, J.D. Artificial intelligence-assisted mapping of proliferation centers allows the distinction of accelerated phase from large cell transformation in chronic lymphocytic leukemia. Mod. Pathol. 2022, 35, 1121–1125. [Google Scholar] [CrossRef]
  44. Zini, G.; Mancini, F.; Rossi, E.; Landucci, S.; d’Onofrio, G. Artificial intelligence and the blood film: Performance of the MC-80 digital morphology analyzer in samples with neoplastic and reactive cell types. Int. J. Lab. Hematol. 2023, 45, 881–889. [Google Scholar] [CrossRef]
  45. Haupt, C.E.; Marks, M. AI-Generated Medical Advice-GPT and Beyond. JAMA 2023, 329, 1349–1350. [Google Scholar] [CrossRef]
  46. Vaswani, A.; Shazeer, N.; Parmar, N.; Uszkoreit, J.; Jones, L.; Gomez, A.N.; Kaiser, L.; Polosukhin, I. Attention Is All You Need. arXiv 2023, arXiv:1706.03762v7. [Google Scholar] [CrossRef]
  47. Mao, J.; Wang, J.; Zeb, A.; Cho, K.-H.; Jin, H.; Kim, J.; Lee, O.; Wang, Y.; No, K.T. Transformer-Based Molecular Generative Model for Antiviral Drug Design. J. Chem. Inf. Model. 2023. [Google Scholar] [CrossRef] [PubMed]
  48. Fink, M.A.; Bischoff, A.; Fink, C.A.; Moll, M.; Kroschke, J.; Dulz, L.; Heussel, C.P.; Kauczor, H.U.; Weber, T.F. Potential of ChatGPT and GPT-4 for Data Mining of Free-Text CT Reports on Lung Cancer. Radiology 2023, 308, e231362. [Google Scholar] [CrossRef]
  49. Waisberg, E.; Ong, J.; Masalkhi, M.; Kamran, S.A.; Zaman, N.; Sarker, P.; Lee, A.G.; Tavakkoli, A. GPT-4 and Ophthalmology Operative Notes. Ann. Biomed. Eng. 2023, 51, 2353–2355. [Google Scholar] [CrossRef]
  50. Xu, Y.; Liu, X.; Cao, X.; Huang, C.; Liu, E.; Qian, S.; Liu, X.; Wu, Y.; Dong, F.; Qiu, C.W.; et al. Artificial intelligence: A powerful paradigm for scientific research. Innovation 2021, 2, 100179. [Google Scholar] [CrossRef]
  51. Shen, Z.; Yang, H.; Zhang, S. Nonlinear approximation via compositions. Neural Netw. 2019, 119, 74–84. [Google Scholar] [CrossRef] [PubMed]
  52. Polak, E.; Gonzalez-Espinoza, C.E.; Gander, M.J.; Wesolowski, T.A. A non-decomposable approximation on the complete density function space for the non-additive kinetic potential. J. Chem. Phys. 2022, 156, 044103. [Google Scholar] [CrossRef]
  53. Song, L.; Liu, Y.; Fan, J.; Zhou, D.X. Approximation of smooth functionals using deep ReLU networks. Neural Netw. 2023, 166, 424–436. [Google Scholar] [CrossRef]
  54. Gelenbe, E.; Mao, Z.H.; Li, Y.D. Function approximation with spiked random networks. IEEE Trans. Neural. Netw. 1999, 10, 3–9. [Google Scholar] [CrossRef]
  55. Petersen, P.; Voigtlaender, F. Optimal approximation of piecewise smooth functions using deep ReLU neural networks. Neural Netw. 2018, 108, 296–330. [Google Scholar] [CrossRef]
  56. Chartrand, G.; Cheng, P.M.; Vorontsov, E.; Drozdzal, M.; Turcotte, S.; Pal, C.J.; Kadoury, S.; Tang, A. Deep Learning: A Primer for Radiologists. Radiographics 2017, 37, 2113–2131. [Google Scholar] [CrossRef]
  57. Ehlen, F.; Fromm, O.; Vonberg, I.; Klostermann, F. Overcoming duality: The fused bousfieldian function for modeling word production in verbal fluency tasks. Psychon. Bull. Rev. 2016, 23, 1354–1373. [Google Scholar] [CrossRef]
  58. Heltberg, M.L.; Michelsen, C.; Martiny, E.S.; Christensen, L.E.; Jensen, M.H.; Halasa, T.; Petersen, T.C. Spatial heterogeneity affects predictions from early-curve fitting of pandemic outbreaks: A case study using population data from Denmark. R. Soc. Open Sci. 2022, 9, 220018. [Google Scholar] [CrossRef]
  59. Tang, M.; Dudas, G.; Bedford, T.; Minin, V.N. Fitting stochastic epidemic models to gene genealogies using linear noise approximation. Ann. Appl. Stat. 2023, 17, 1–22. [Google Scholar] [CrossRef]
  60. Silva, F.; Sanz, M.; Seixas, J.; Solano, E.; Omar, Y. Perceptrons from memristors. Neural Netw. 2020, 122, 273–278. [Google Scholar] [CrossRef]
  61. Carreras, J.; Kikuti, Y.Y.; Miyaoka, M.; Roncador, G.; Garcia, J.F.; Hiraiwa, S.; Tomita, S.; Ikoma, H.; Kondo, Y.; Ito, A.; et al. Integrative Statistics, Machine Learning and Artificial Intelligence Neural Network Analysis Correlated CSF1R with the Prognosis of Diffuse Large B-Cell Lymphoma. Hemato 2021, 2, 182–206. [Google Scholar] [CrossRef]
  62. Lenz, G.; Wright, G.; Dave, S.S.; Xiao, W.; Powell, J.; Zhao, H.; Xu, W.; Tan, B.; Goldschmidt, N.; Iqbal, J.; et al. Stromal gene signatures in large-B-cell lymphomas. N. Engl. J. Med. 2008, 359, 2313–2323. [Google Scholar] [CrossRef]
  63. Cardesa-Salzmann, T.M.; Colomo, L.; Gutierrez, G.; Chan, W.C.; Weisenburger, D.; Climent, F.; Gonzalez-Barca, E.; Mercadal, S.; Arenillas, L.; Serrano, S.; et al. High microvessel density determines a poor outcome in patients with diffuse large B-cell lymphoma treated with rituximab plus chemotherapy. Haematologica 2011, 96, 996–1001. [Google Scholar] [CrossRef]
  64. Carreras, J. “Multilayer Perceptron”. Zenodo, 29 February 2024. Available online: https://doi.org/10.5281/zenodo.10727457 (accessed on 10 March 2024).
  65. Carreras, J. “MLP Parameter Estimates”. Zenodo, 11 March 2024. Available online: https://doi.org/10.5281/zenodo.10804249 (accessed on 10 March 2024).
  66. Subramanian, A.; Tamayo, P.; Mootha, V.K.; Mukherjee, S.; Ebert, B.L.; Gillette, M.A.; Paulovich, A.; Pomeroy, S.L.; Golub, T.R.; Lander, E.S.; et al. Gene set enrichment analysis: A knowledge-based approach for interpreting genome-wide expression profiles. Proc. Natl. Acad. Sci. USA 2005, 102, 15545–15550. [Google Scholar] [CrossRef]
  67. Mootha, V.K.; Lindgren, C.M.; Eriksson, K.F.; Subramanian, A.; Sihag, S.; Lehar, J.; Puigserver, P.; Carlsson, E.; Ridderstrale, M.; Laurila, E.; et al. PGC-1alpha-responsive genes involved in oxidative phosphorylation are coordinately downregulated in human diabetes. Nat. Genet. 2003, 34, 267–273. [Google Scholar] [CrossRef]
  68. Broad Institute; Massachusetts Institute of Technology; Regents of the University of California. Gene Set Enrichment Analysis (GSEA). Available online: https://www.gsea-msigdb.org/gsea/index.jsp (accessed on 11 March 2024).
  69. Campo, E. The 2022 classifications of lymphoid neoplasms: Keynote. Pathologie 2023, 44, 121–127. [Google Scholar] [CrossRef]
  70. de Leval, L.; Alizadeh, A.A.; Bergsagel, P.L.; Campo, E.; Davies, A.; Dogan, A.; Fitzgibbon, J.; Horwitz, S.M.; Melnick, A.M.; Morice, W.G.; et al. Genomic profiling for clinical decision making in lymphoid neoplasms. Blood 2022, 140, 2193–2227. [Google Scholar] [CrossRef]
  71. Carreras, J.; Kikuti, Y.Y.; Miyaoka, M.; Hiraiwa, S.; Tomita, S.; Ikoma, H.; Kondo, Y.; Ito, A.; Nagase, S.; Miura, H.; et al. Mutational Profile and Pathological Features of a Case of Interleukin-10 and RGS1-Positive Spindle Cell Variant Diffuse Large B-Cell Lymphoma. Hematol. Rep. 2023, 15, 188–200. [Google Scholar] [CrossRef]
  72. Cazzola, M.; Sehn, L.H. Developing a classification of hematologic neoplasms in the era of precision medicine. Blood 2022, 140, 1193–1199. [Google Scholar] [CrossRef]
  73. King, R.L.; Hsi, E.D.; Chan, W.C.; Piris, M.A.; Cook, J.R.; Scott, D.W.; Swerdlow, S.H. Diagnostic approaches and future directions in Burkitt lymphoma and high-grade B-cell lymphoma. Virchows Arch. 2023, 482, 193–205. [Google Scholar] [CrossRef]
  74. Song, J.Y.; Dirnhofer, S.; Piris, M.A.; Quintanilla-Martinez, L.; Pileri, S.; Campo, E. Diffuse large B-cell lymphomas, not otherwise specified, and emerging entities. Virchows Arch. 2023, 482, 179–192. [Google Scholar] [CrossRef]
  75. Arber, D.A.; Campo, E.; Jaffe, E.S. Advances in the Classification of Myeloid and Lymphoid Neoplasms. Virchows Arch 2023, 482, 1–9. [Google Scholar] [CrossRef]
  76. Duncavage, E.J.; Bagg, A.; Hasserjian, R.P.; DiNardo, C.D.; Godley, L.A.; Iacobucci, I.; Jaiswal, S.; Malcovati, L.; Vannucchi, A.M.; Patel, K.P.; et al. Genomic profiling for clinical decision making in myeloid neoplasms and acute leukemia. Blood 2022, 140, 2228–2247. [Google Scholar] [CrossRef]
  77. Carreras, J. The pathobiology of follicular lymphoma. J. Clin. Exp. Hematop. 2023, 63, 152–163. [Google Scholar] [CrossRef]
  78. Carreras, J.; Yukie Kikuti, Y.; Miyaoka, M.; Miyahara, S.; Roncador, G.; Hamoudi, R.; Nakamura, N. Artificial Intelligence Analysis and Reverse Engineering of Molecular Subtypes of Diffuse Large B-Cell Lymphoma Using Gene Expression Data. BioMedInformatics 2024, 4, 295–320. [Google Scholar] [CrossRef]
  79. Carreras, J. Artificial Intelligence Analysis of Celiac Disease Using an Autoimmune Discovery Transcriptomic Panel Highlighted Pathogenic Genes including BTLA. Healthcare 2022, 10, 1550. [Google Scholar] [CrossRef]
  80. Carreras, J. Artificial Intelligence Analysis of Ulcerative Colitis Using an Autoimmune Discovery Transcriptomic Panel. Healthcare 2022, 10, 1476. [Google Scholar] [CrossRef]
  81. Carreras, J.; Kikuti, Y.Y.; Miyaoka, M.; Hiraiwa, S.; Tomita, S.; Ikoma, H.; Kondo, Y.; Ito, A.; Shiraiwa, S.; Hamoudi, R.; et al. A Single Gene Expression Set Derived from Artificial Intelligence Predicted the Prognosis of Several Lymphoma Subtypes; and High Immunohistochemical Expression of TNFAIP8 Associated with Poor Prognosis in Diffuse Large B-Cell Lymphoma. AI 2020, 1, 342–360. [Google Scholar] [CrossRef]
  82. Carreras, J.; Kikuti, Y.Y.; Roncador, G.; Miyaoka, M.; Hiraiwa, S.; Tomita, S.; Ikoma, H.; Kondo, Y.; Ito, A.; Shiraiwa, S.; et al. High Expression of Caspase-8 Associated with Improved Survival in Diffuse Large B-Cell Lymphoma: Machine Learning and Artificial Neural Networks Analyses. BioMedInformatics 2021, 1, 18–46. [Google Scholar] [CrossRef]
  83. Carreras, J.; Kikuti, Y.Y.; Miyaoka, M.; Hiraiwa, S.; Tomita, S.; Ikoma, H.; Kondo, Y.; Ito, A.; Nakamura, N.; Hamoudi, R. Artificial Intelligence Analysis of the Gene Expression of Follicular Lymphoma Predicted the Overall Survival and Correlated with the Immune Microenvironment Response Signatures. Mach. Learn. Knowl. Extr. 2020, 2, 647–671. [Google Scholar] [CrossRef]
  84. Carreras, J.; Kikuti, Y.Y.; Miyaoka, M.; Hiraiwa, S.; Tomita, S.; Ikoma, H.; Kondo, Y.; Ito, A.; Hamoudi, R.; Nakamura, N. The Use of the Random Number Generator and Artificial Intelligence Analysis for Dimensionality Reduction of Follicular Lymphoma Transcriptomic Data. BioMedInformatics 2022, 2, 268–280. [Google Scholar] [CrossRef]
  85. Kunstner, A.; Witte, H.M.; Riedl, J.; Bernard, V.; Stolting, S.; Merz, H.; Olschewski, V.; Peter, W.; Ketzer, J.; Busch, Y.; et al. Mutational landscape of high-grade B-cell lymphoma with MYC-, BCL2 and/or BCL6 rearrangements characterized by whole-exome sequencing. Haematologica 2022, 107, 1850–1863. [Google Scholar] [CrossRef]
  86. Carreras, J.; Ikoma, H.; Kikuti, Y.Y.; Miyaoka, M.; Hiraiwa, S.; Tomita, S.; Kondo, Y.; Ito, A.; Nagase, S.; Miura, H.; et al. Mutational, immune microenvironment, and clinicopathological profiles of diffuse large B-cell lymphoma and follicular lymphoma with BCL6 rearrangement. Virchows Arch. 2024. [Google Scholar] [CrossRef] [PubMed]
  87. Ikoma, H.; Miyaoka, M.; Hiraiwa, S.; Yukie Kikuti, Y.; Shiraiwa, S.; Hara, R.; Kojima, M.; Ohmachi, K.; Ando, K.; Carreras, J.; et al. Clinicopathological analysis of follicular lymphoma with BCL2, BCL6, and MYC rearrangements. Pathol. Int. 2022, 72, 321–331. [Google Scholar] [CrossRef] [PubMed]
  88. Bingham, G.; Miikkulainen, R. Discovering Parametric Activation Functions. Neural Netw. 2022, 148, 48–65. [Google Scholar] [CrossRef] [PubMed]
  89. Nanni, L.; Brahnam, S.; Paci, M.; Ghidoni, S. Comparison of Different Convolutional Neural Network Activation Functions and Methods for Building Ensembles for Small to Midsize Medical Data Sets. Sensors 2022, 22, 6129. [Google Scholar] [CrossRef] [PubMed]
  90. Costarelli, D.; Spigler, R. Multivariate neural network operators with sigmoidal activation functions. Neural Netw. 2013, 48, 72–77. [Google Scholar] [CrossRef]
  91. Siegel, J.W.; Xu, J. Approximation rates for neural networks with general activation functions. Neural Netw. 2020, 128, 313–321. [Google Scholar] [CrossRef]
Figure 1. Classification of hematopoietic neoplasms. This figure shows a simplified version of the classification with the most frequent and/or characteristic lymphoma subtypes.
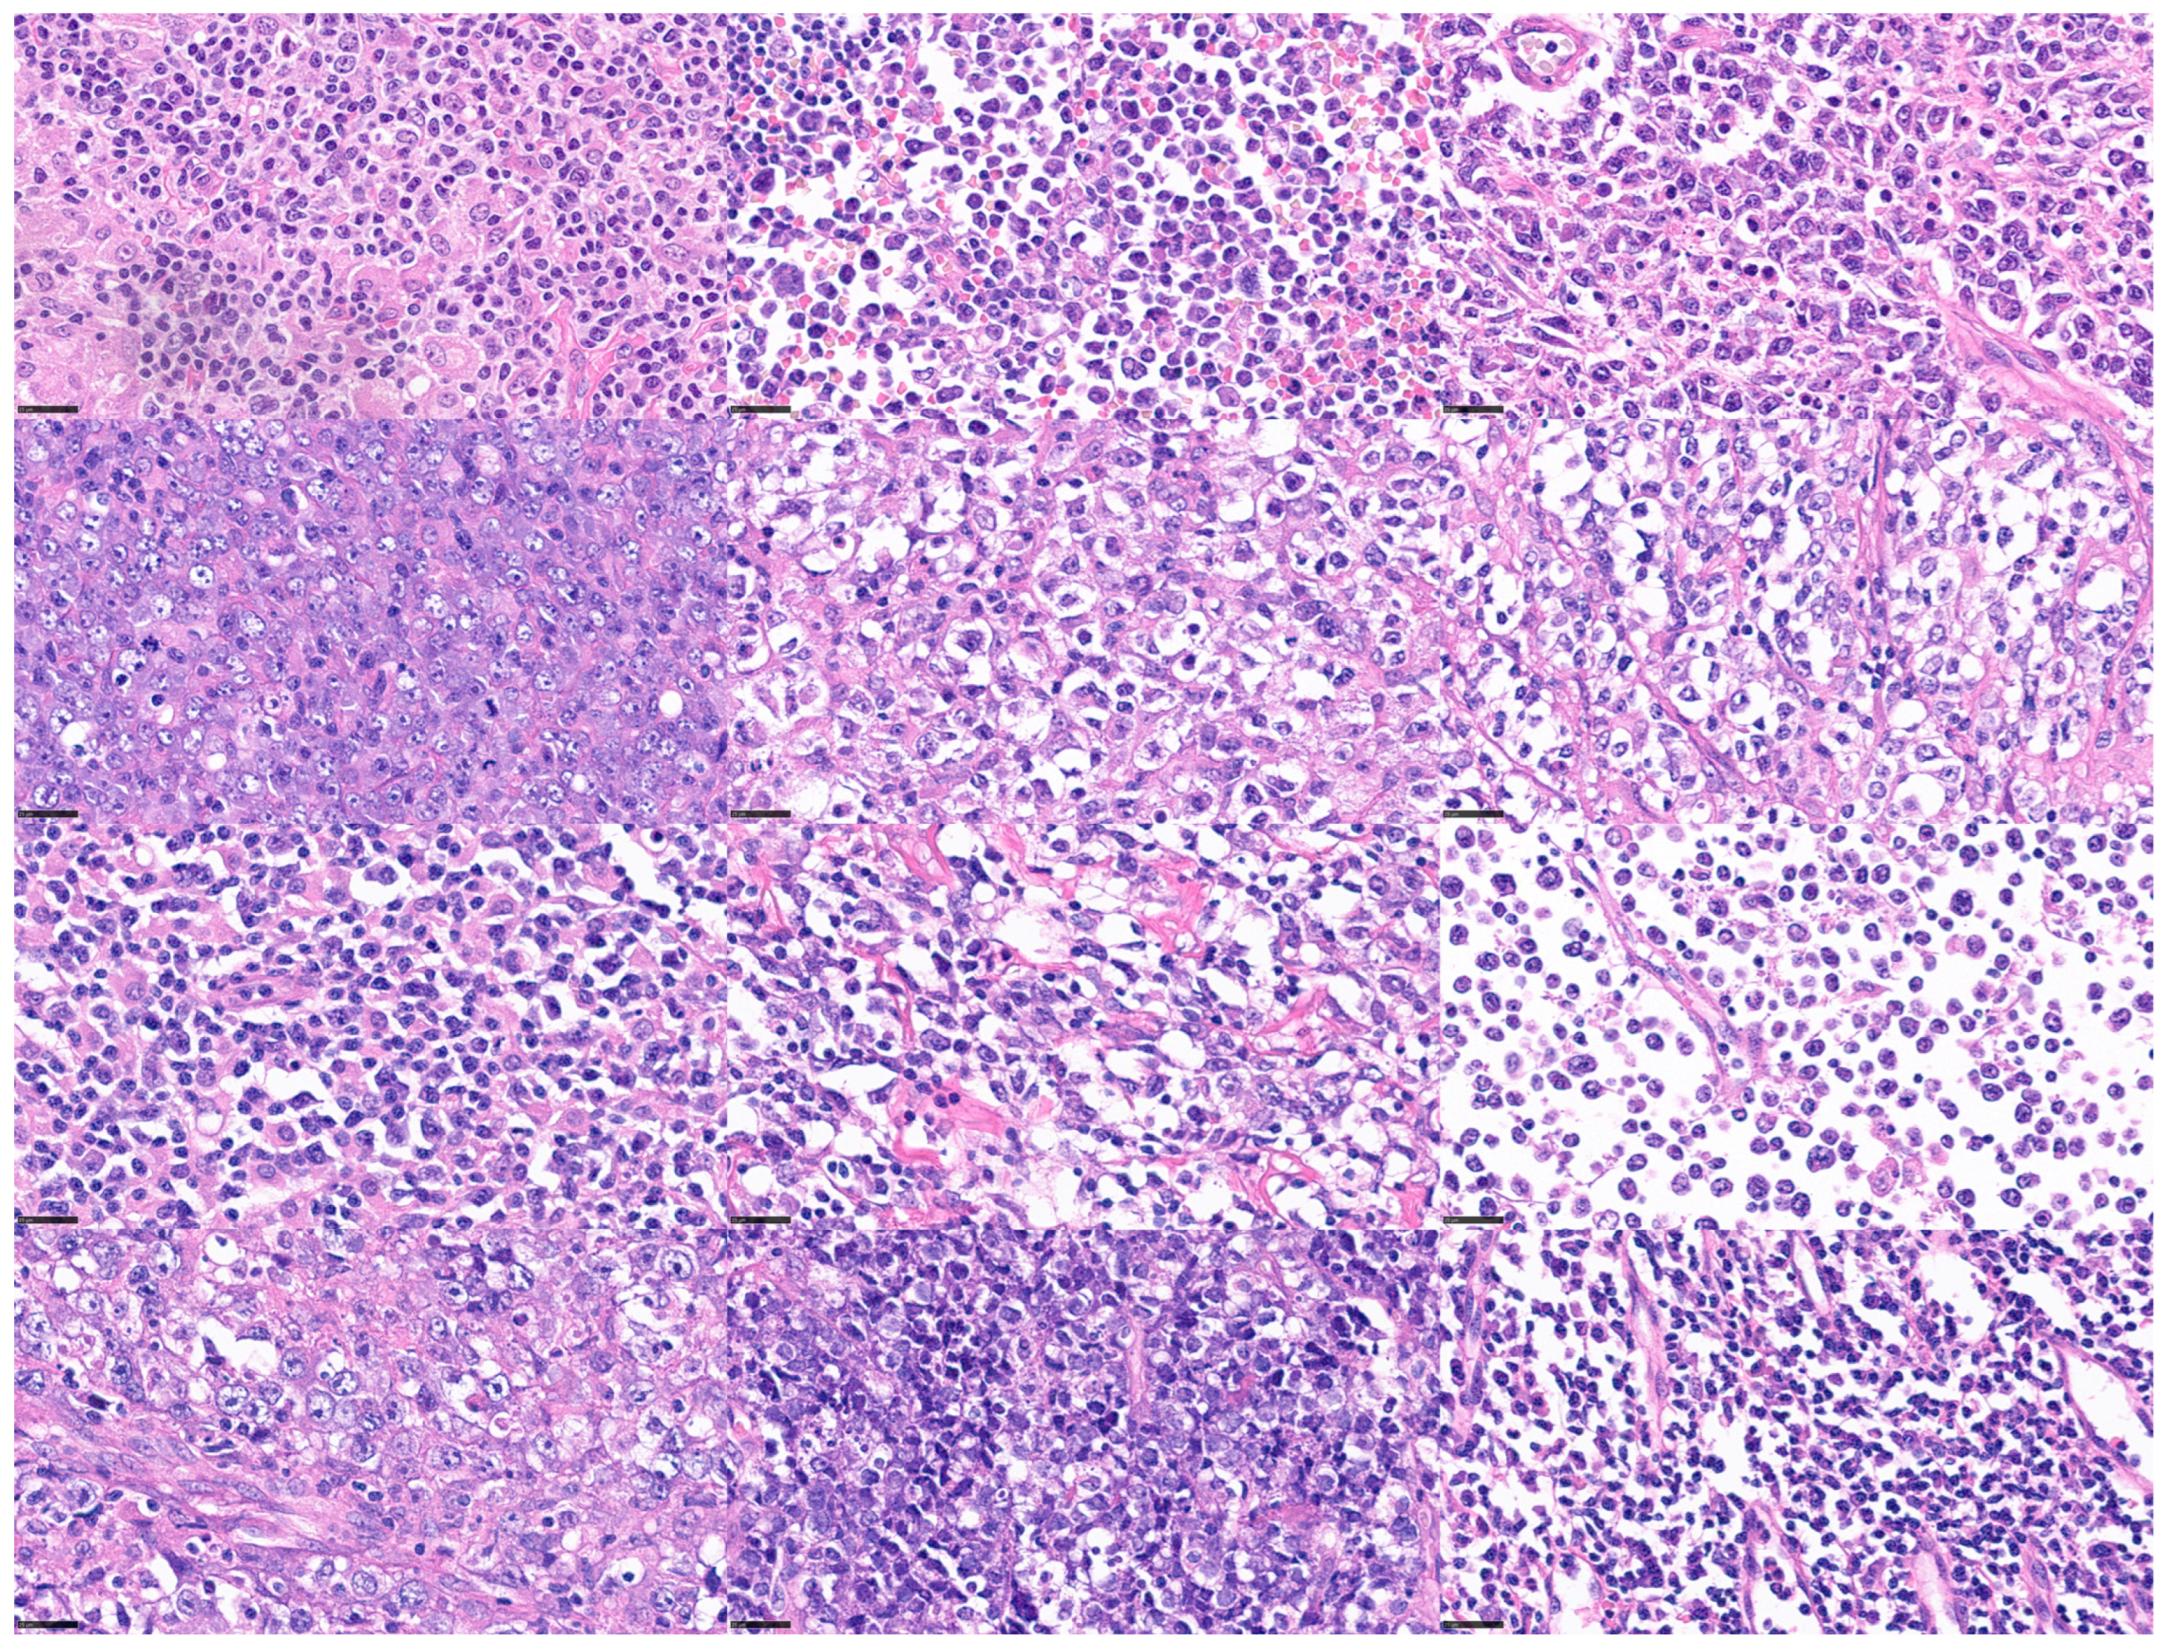
Hemato 05 00011 g001
Figure 2. Histological images of lymphoma subtypes (Hematoxylin and Eosin staining; original magnification 400×). Chronic myeloid leukemia (CML), acute myeloid leukemia (AML), B lymphoblastic lymphoma (B-LBL), chronic lymphocytic leukemia/small lymphocytic lymphoma (CLL/SLL), lymphoplasmacytic lymphoma (LPL), plasma cell myeloma (PCM), mucosa-associated lymphoid tissue (MALT) lymphoma, follicular lymphoma (FL), mantle cell lymphoma (MCL), Burkitt lymphoma (BL), diffuse large B-cell lymphoma (DLBCL) with MYC rearrangement (MYC-R+), high-grade B-cell lymphoma with MYC, BCL2, and BCL6 rearrangement (triple-hit lymphoma (THL)), classical Hodgkin lymphoma (cHL), peripheral T-cell lymphoma (PTCL), not otherwise specified (NOS), and monomorphic epitheliotropic intestinal T-cell lymphoma (MEITL).
Hemato 05 00011 g002
Figure 3. Histological variability of diffuse large B-cell lymphoma (DLBCL). DLBCL is one of the most frequent mature B-cell neoplasms. DLBCL is a heterogeneous disease with differentmorphologic, genetic, and biologic characteristics. scale bar = 25 μm.
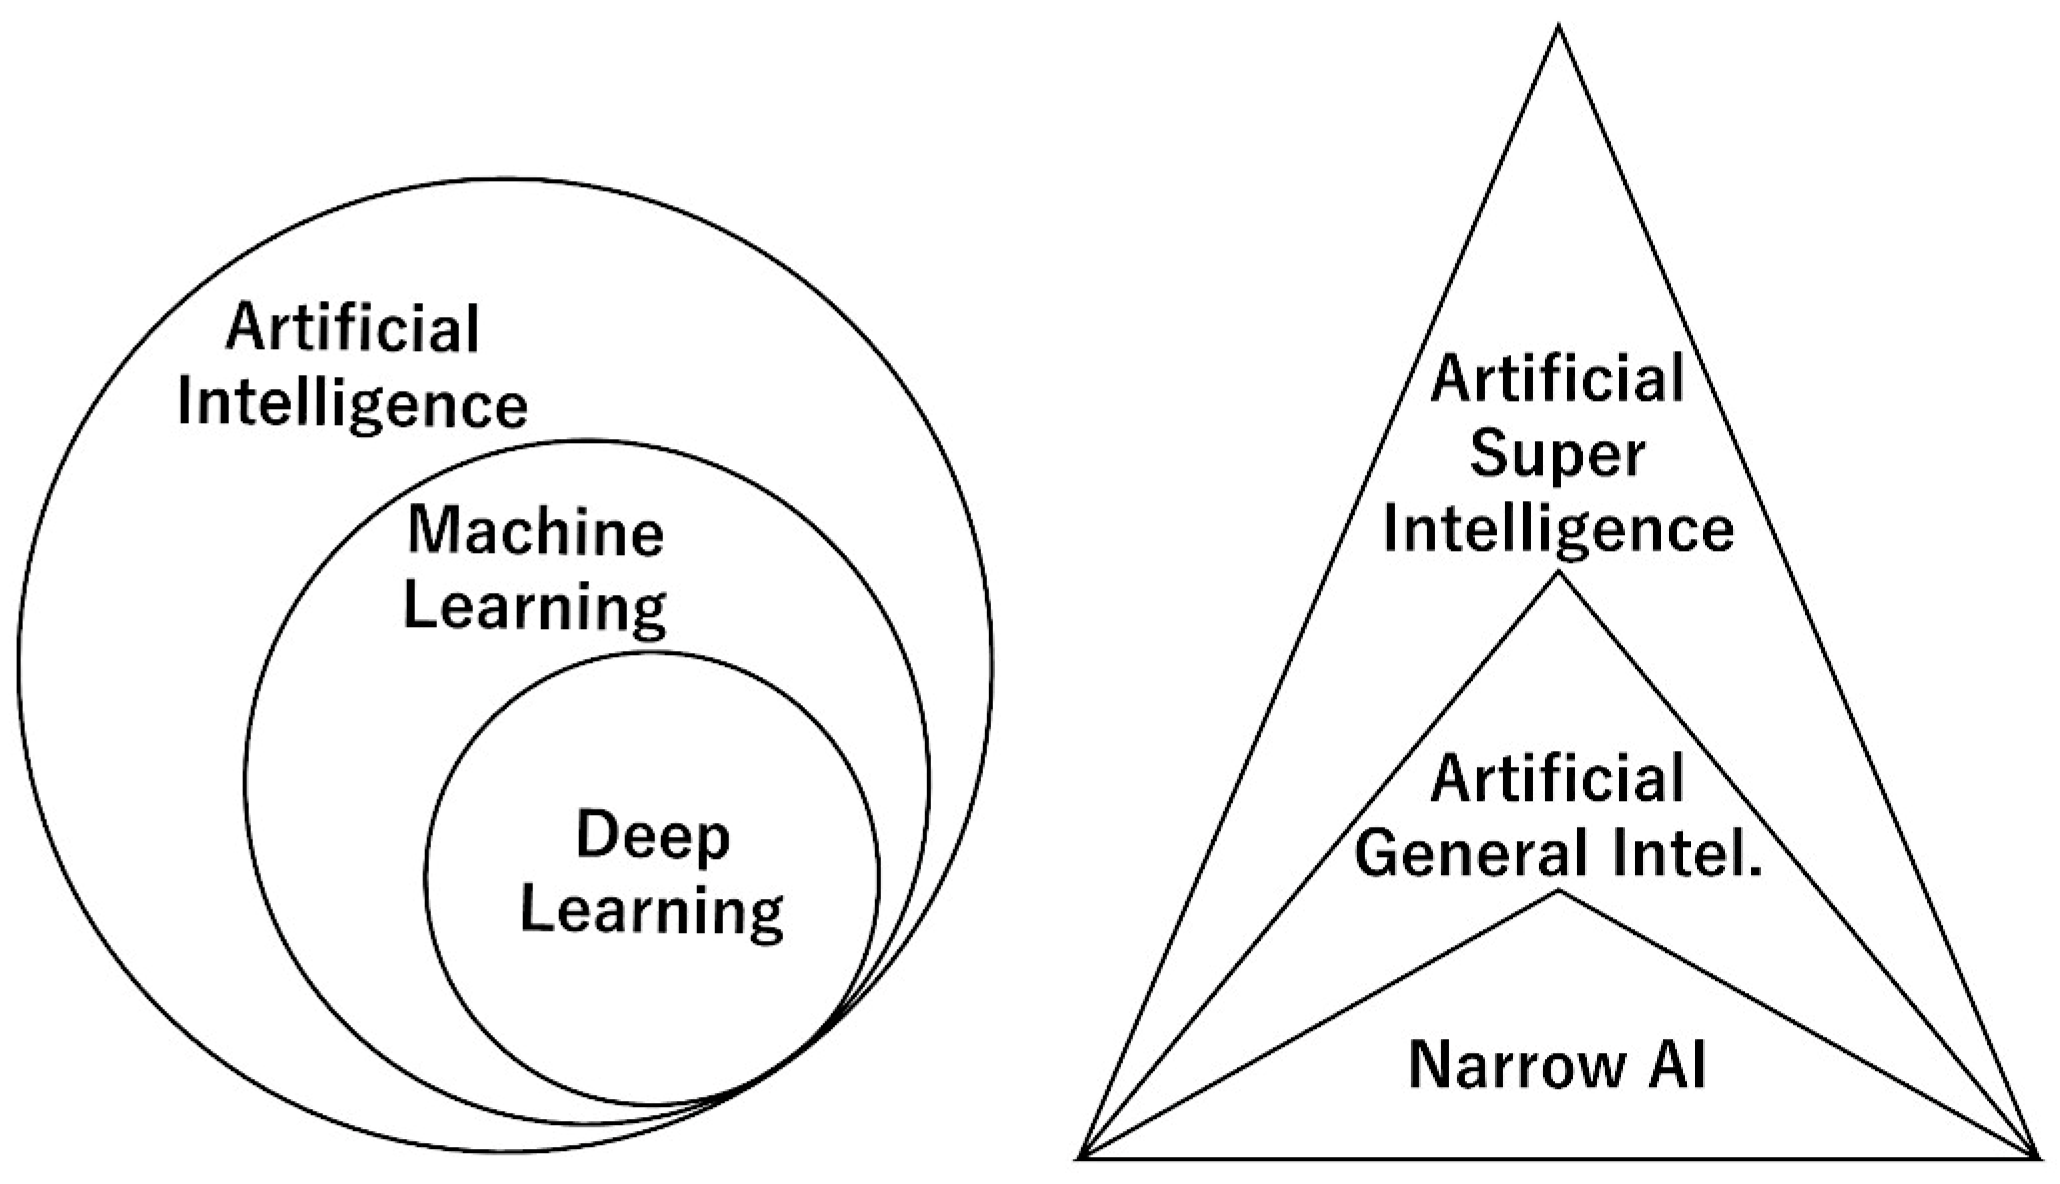
Hemato 05 00011 g003
Figure 4. Types of artificial intelligence. Artificial intelligence (AI) is a broad term that includes several analytical techniques, such machine learning and deep learning (artificial neural networks). AI can also be classified according to comparison with the human intellect, which is also based on an organic neural network, such as narrow AI, artificial general intelligence (AGI), and artificial superintelligence (ASI).
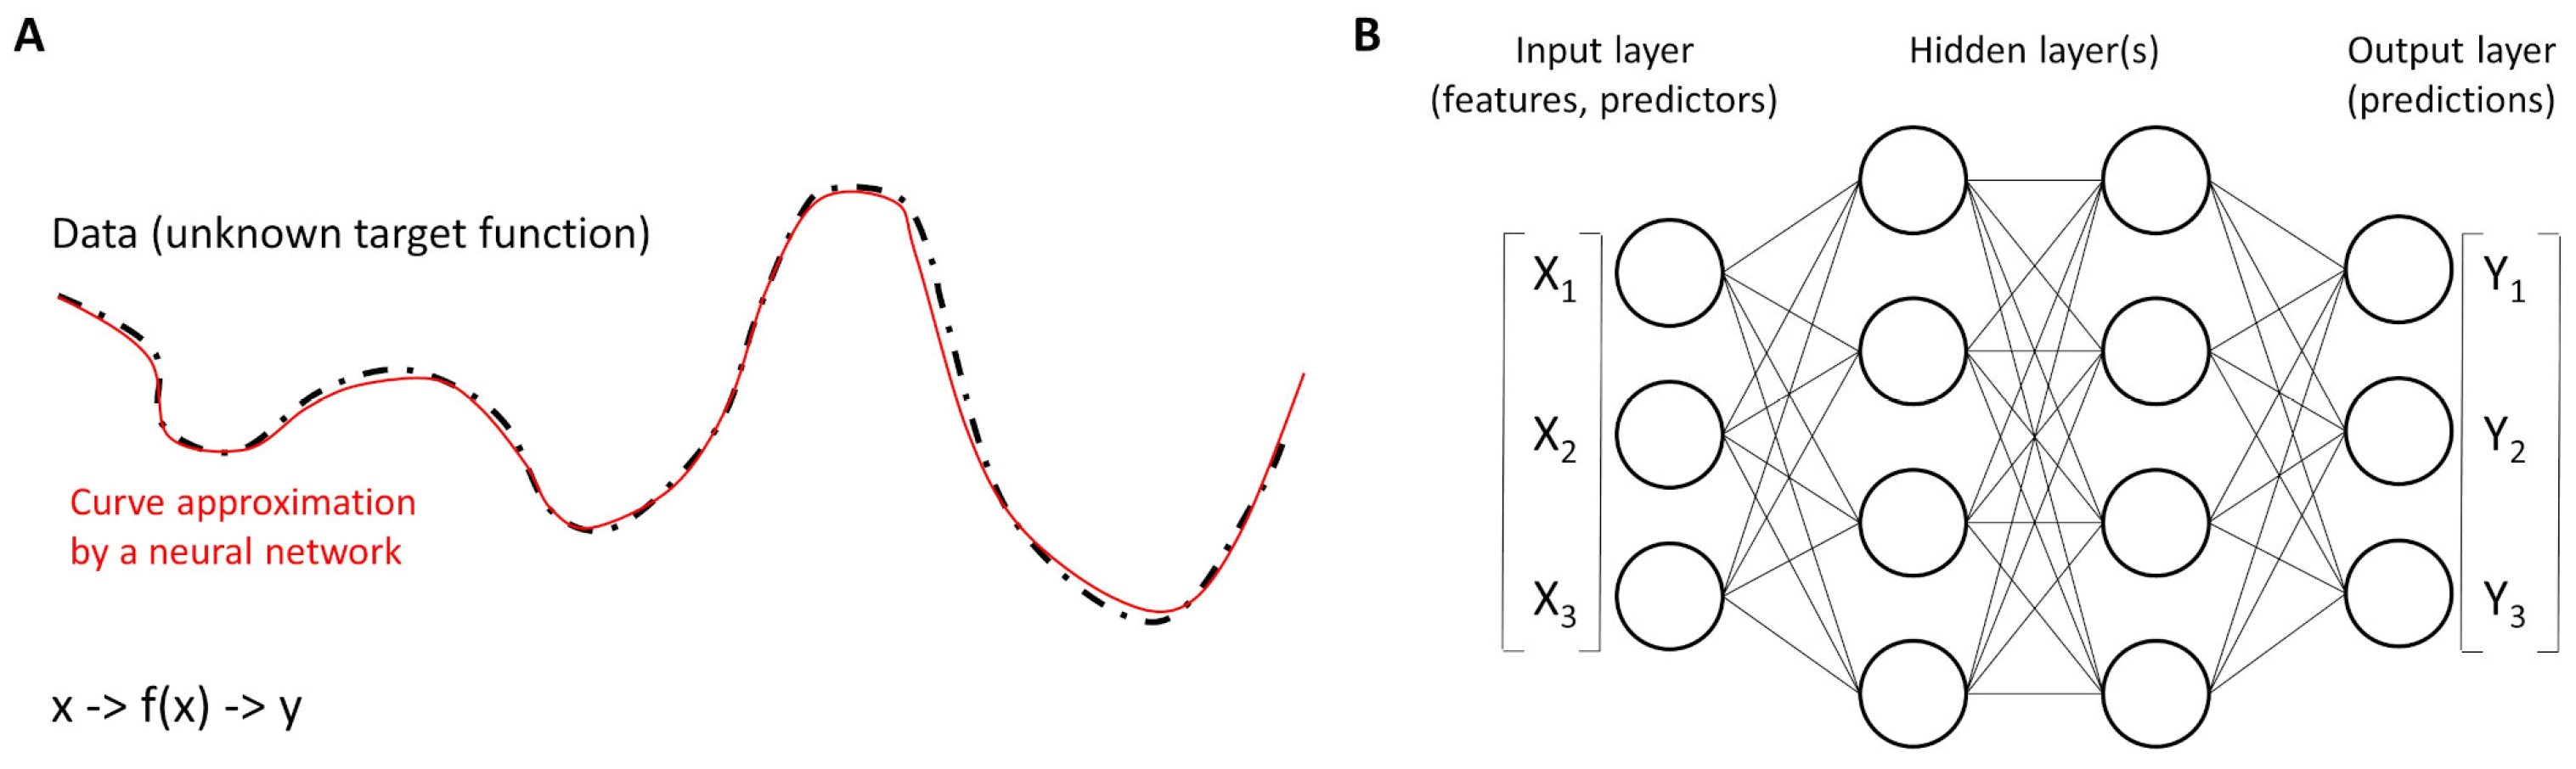
Hemato 05 00011 g004
Figure 5. Functions and neural networks. (A) Neural networks work as universal function approximators to different curves of the dataset. In other words, a neural network is a function that approximates an unknown target function. (B) The basic units are called neurons and are organized into layers. The structure of a neural network is characterized by three parts: the input layer that contains the input fields (variables), one or more hidden layers, and an output layer (with a unit or units that represent the target fields). The units are connected by different connection strengths (weights).
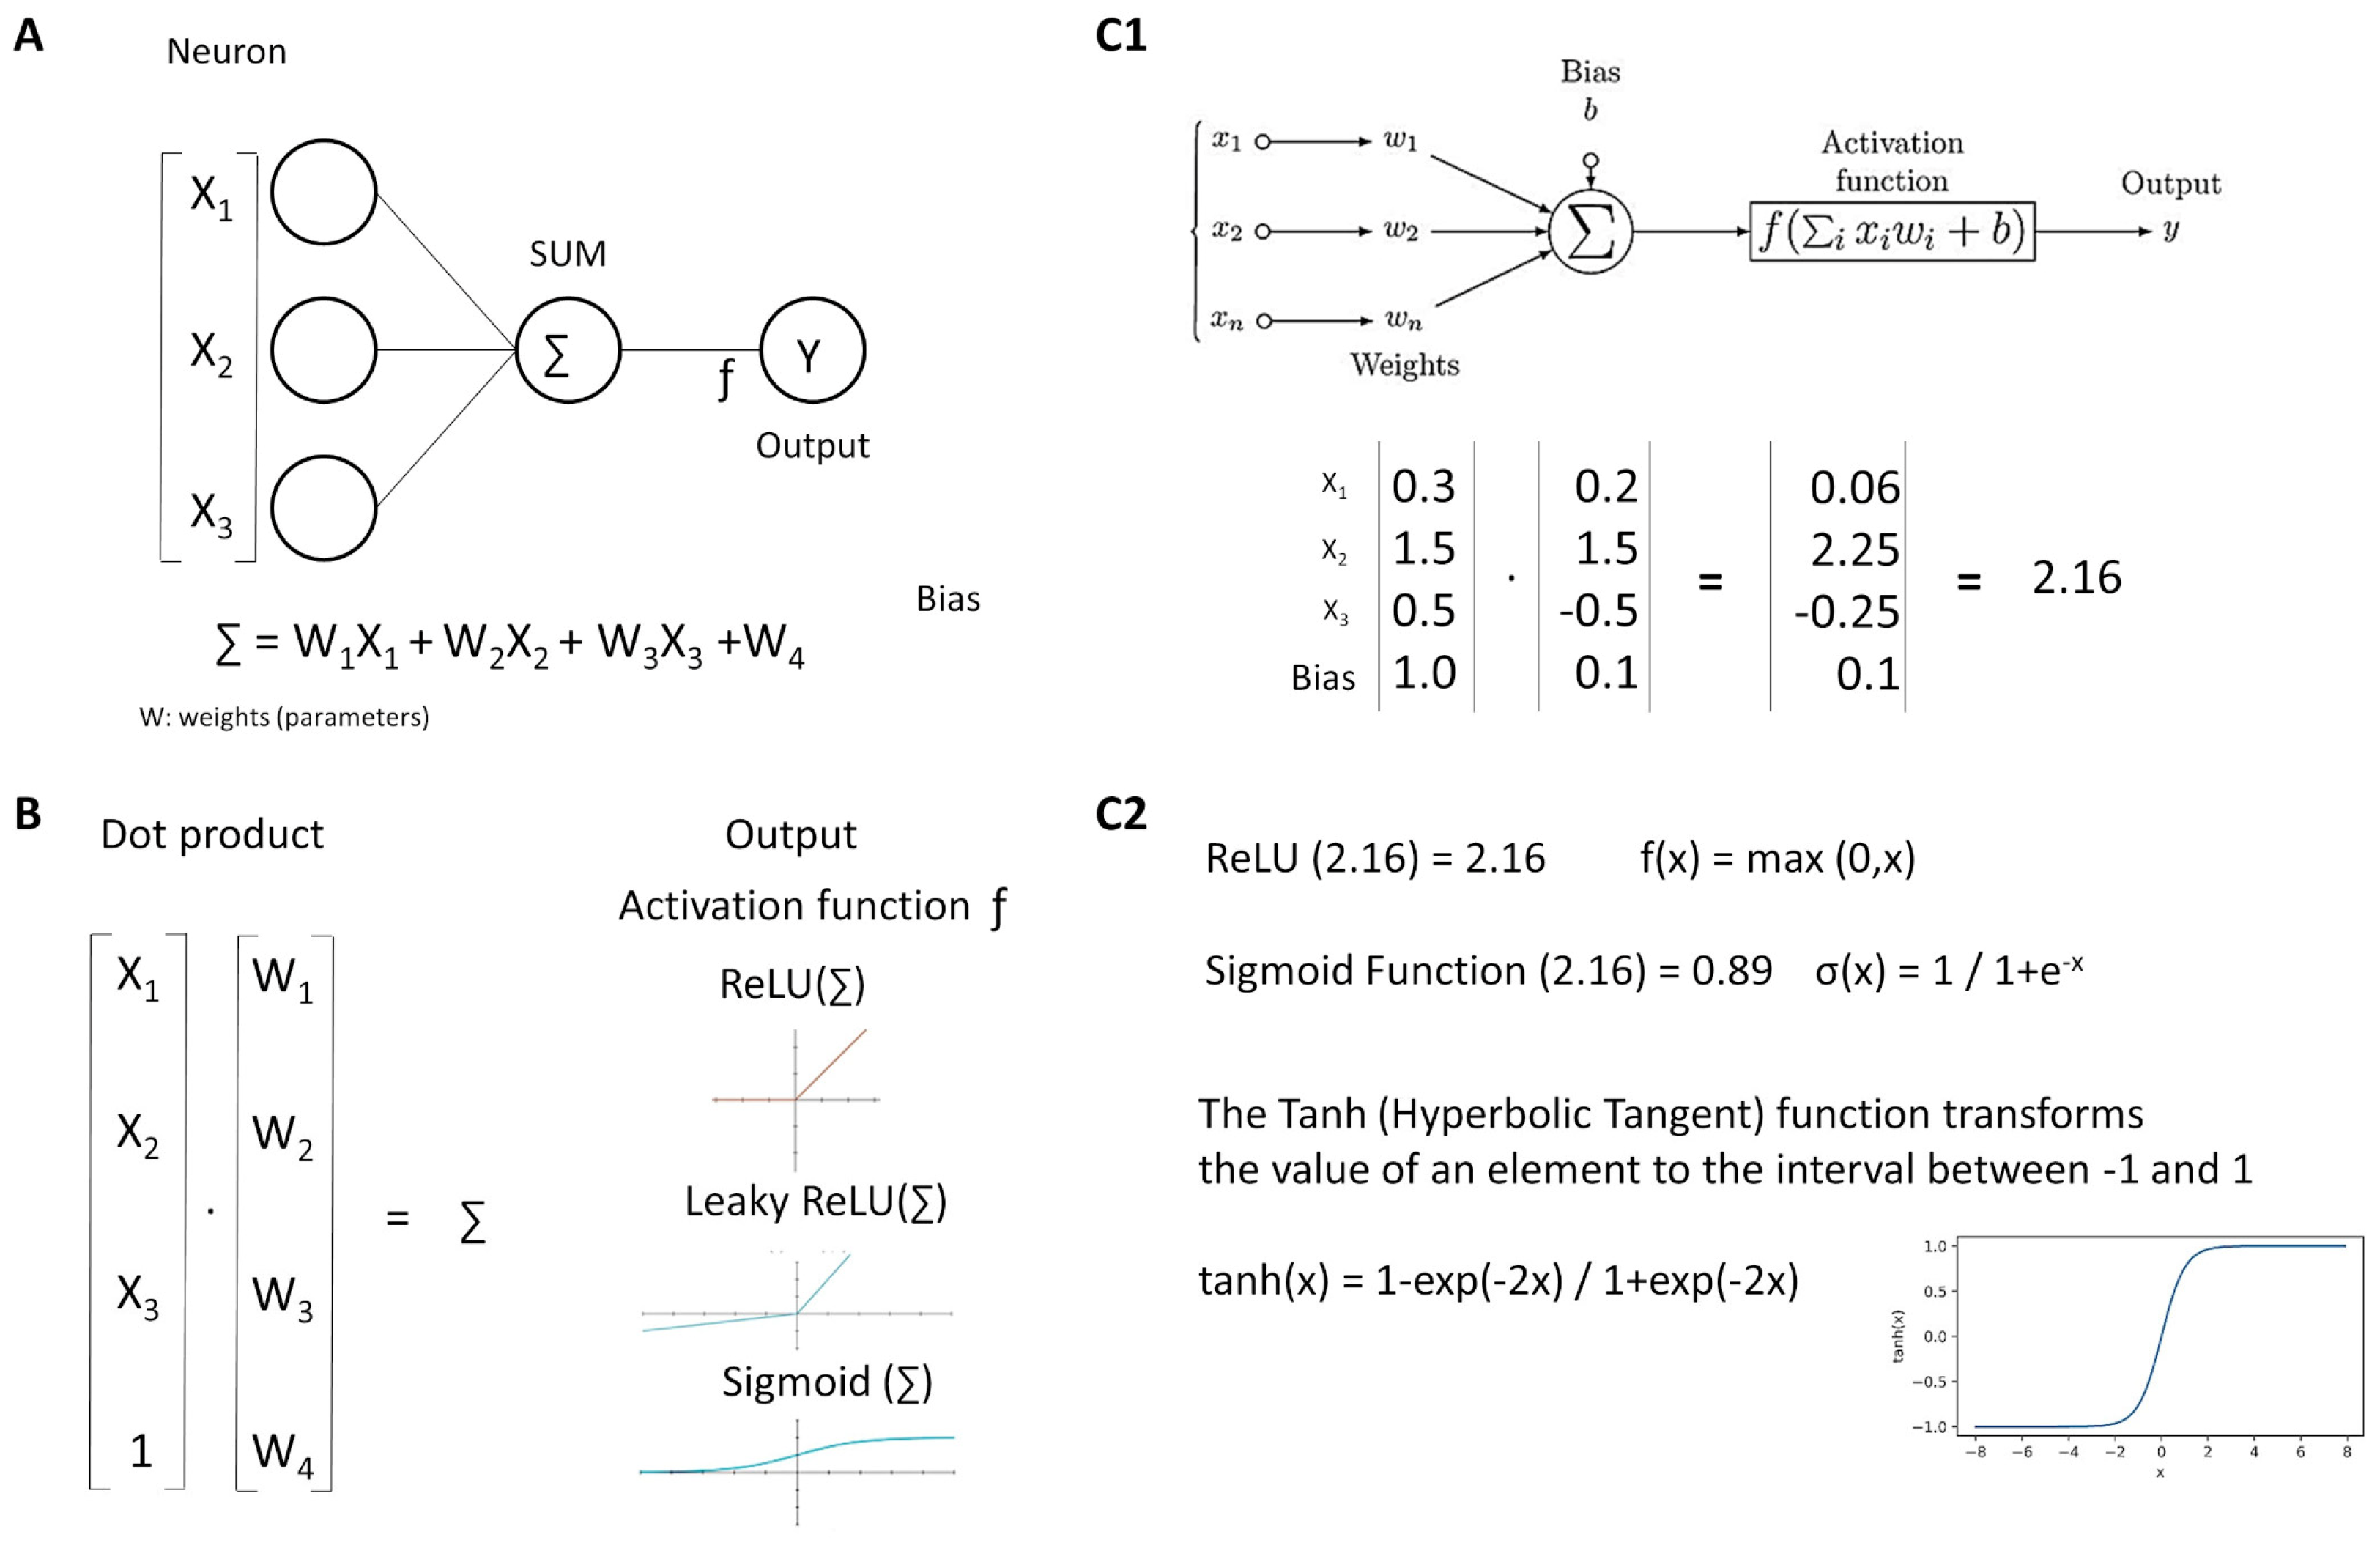
Hemato 05 00011 g005
Figure 6. Neurons. Neural networks comprise several simple functions called neurons (A). Each input is multiplied by its weight, all values (including the bias) are added, and the product is transformed by the activation function (B). An example is shown (C1,C2).
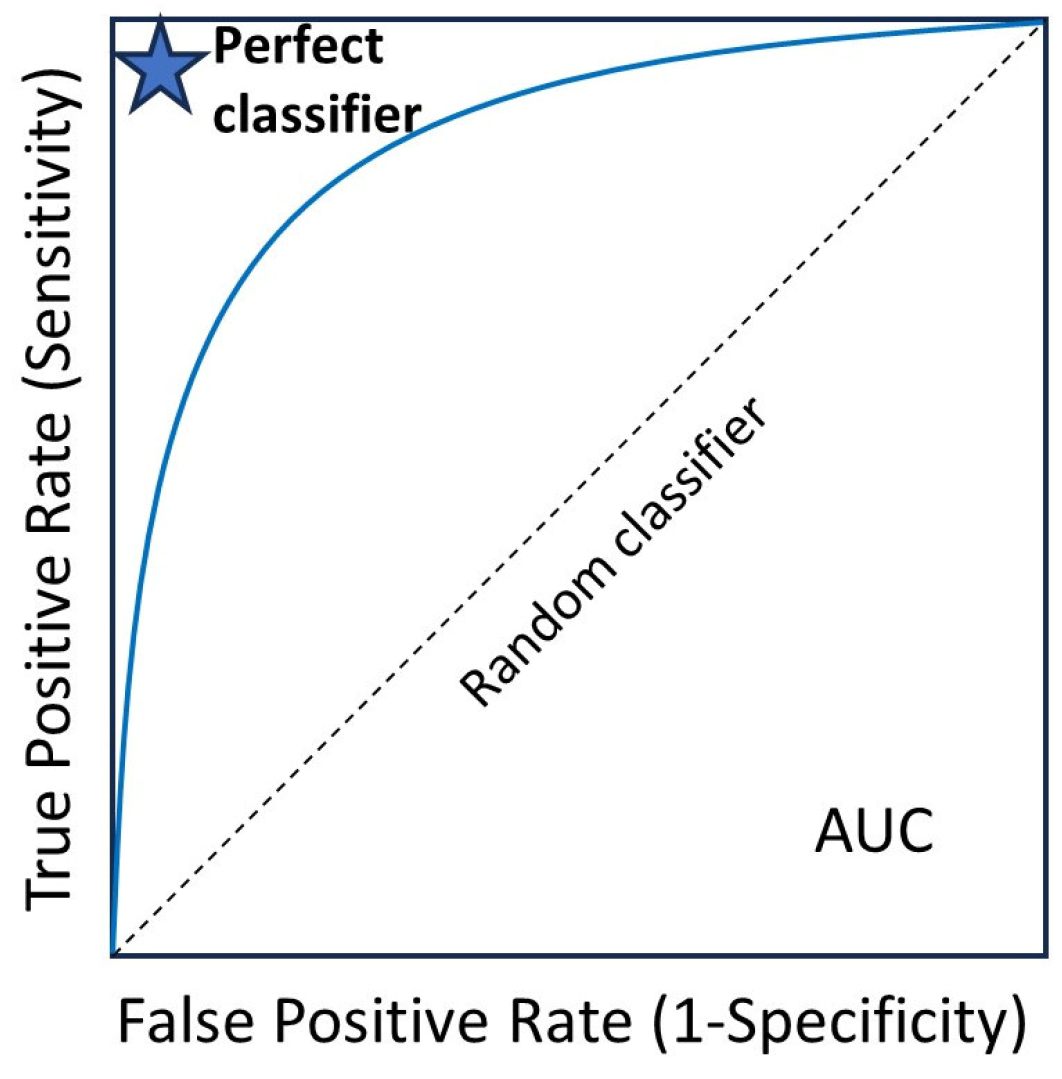
Hemato 05 00011 g006
Figure 7. Receiver operating characteristic (ROC) curve. The area under the curve (AUC) ranges from 0 to 1, and larger AUC values indicate better performance. An AUC of 0.5 indicates no discriminative power. The “blue star” indicates the position of the AUC of 1.0.
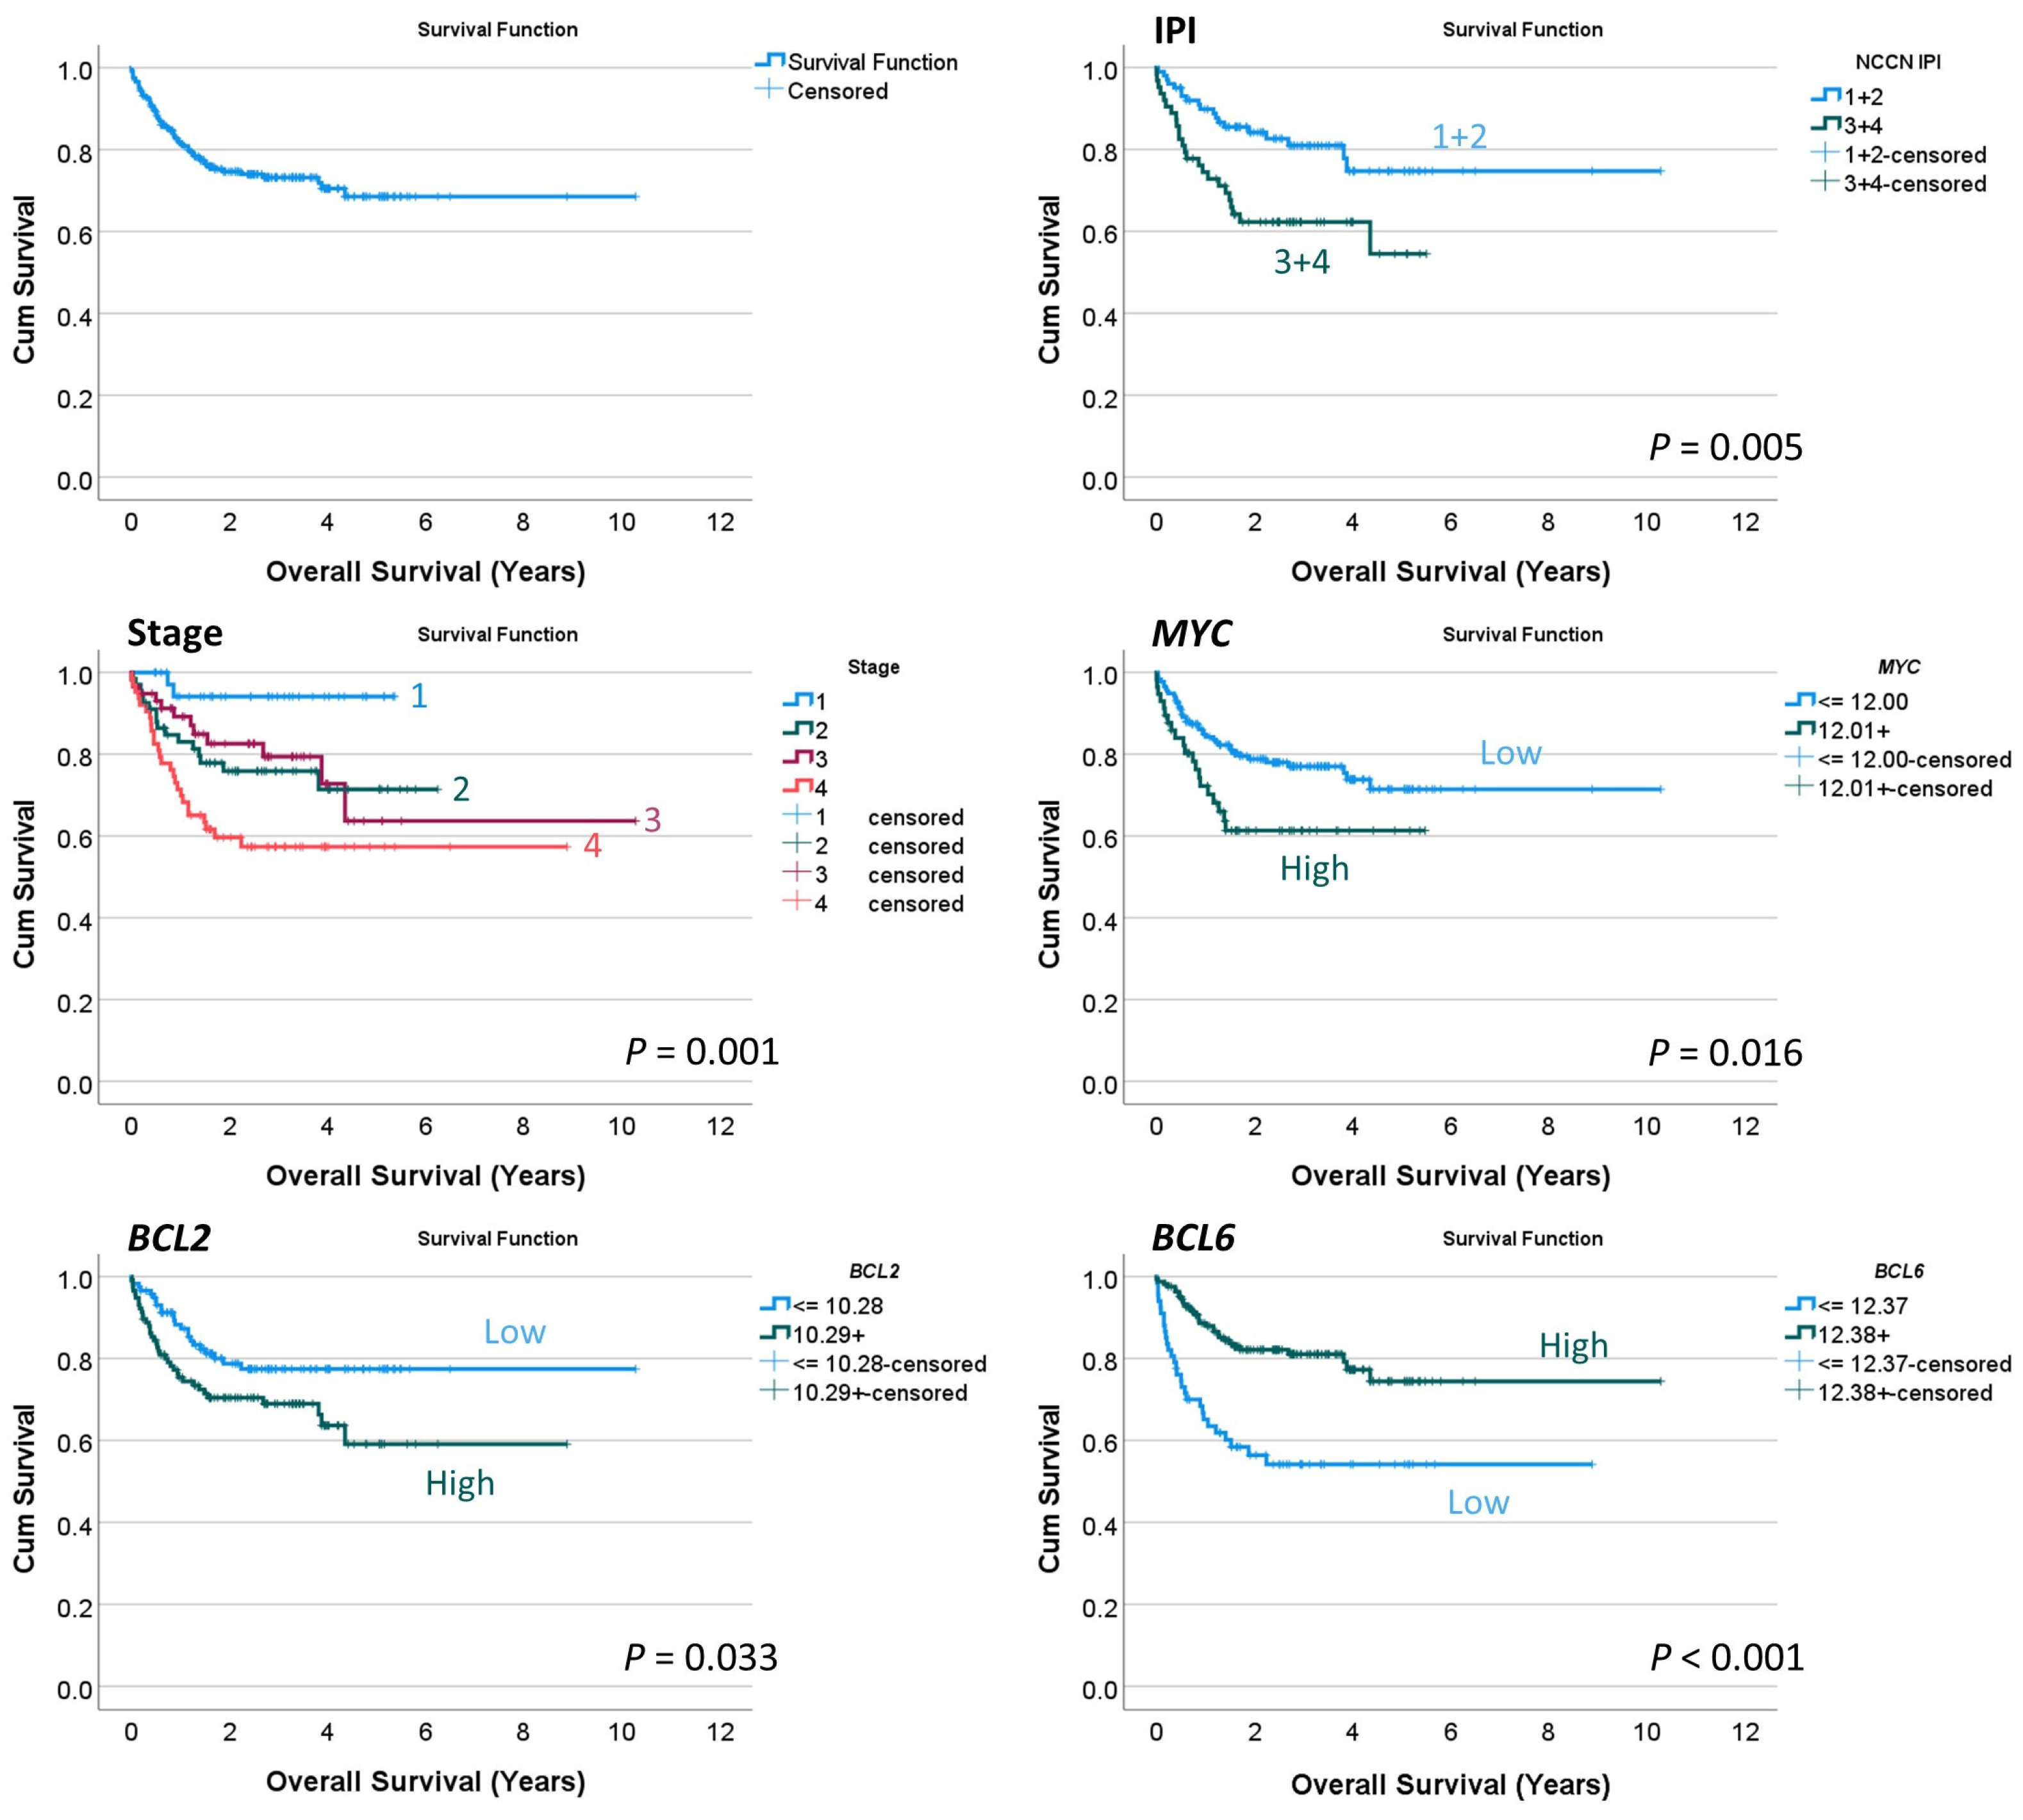
Hemato 05 00011 g007
Figure 8. Overall survival analysis. This study used a conventional series of diffuse large B-cell lymphoma (DLBCL), as shown by the International Prognostic Index (IPI) and clinical stage that stratified patients according to survival. By gene expression, high MYC and BCL2 levels were associated with poor overall survival. Conversely, high BCL6 levels were associated with a favorable outcome.
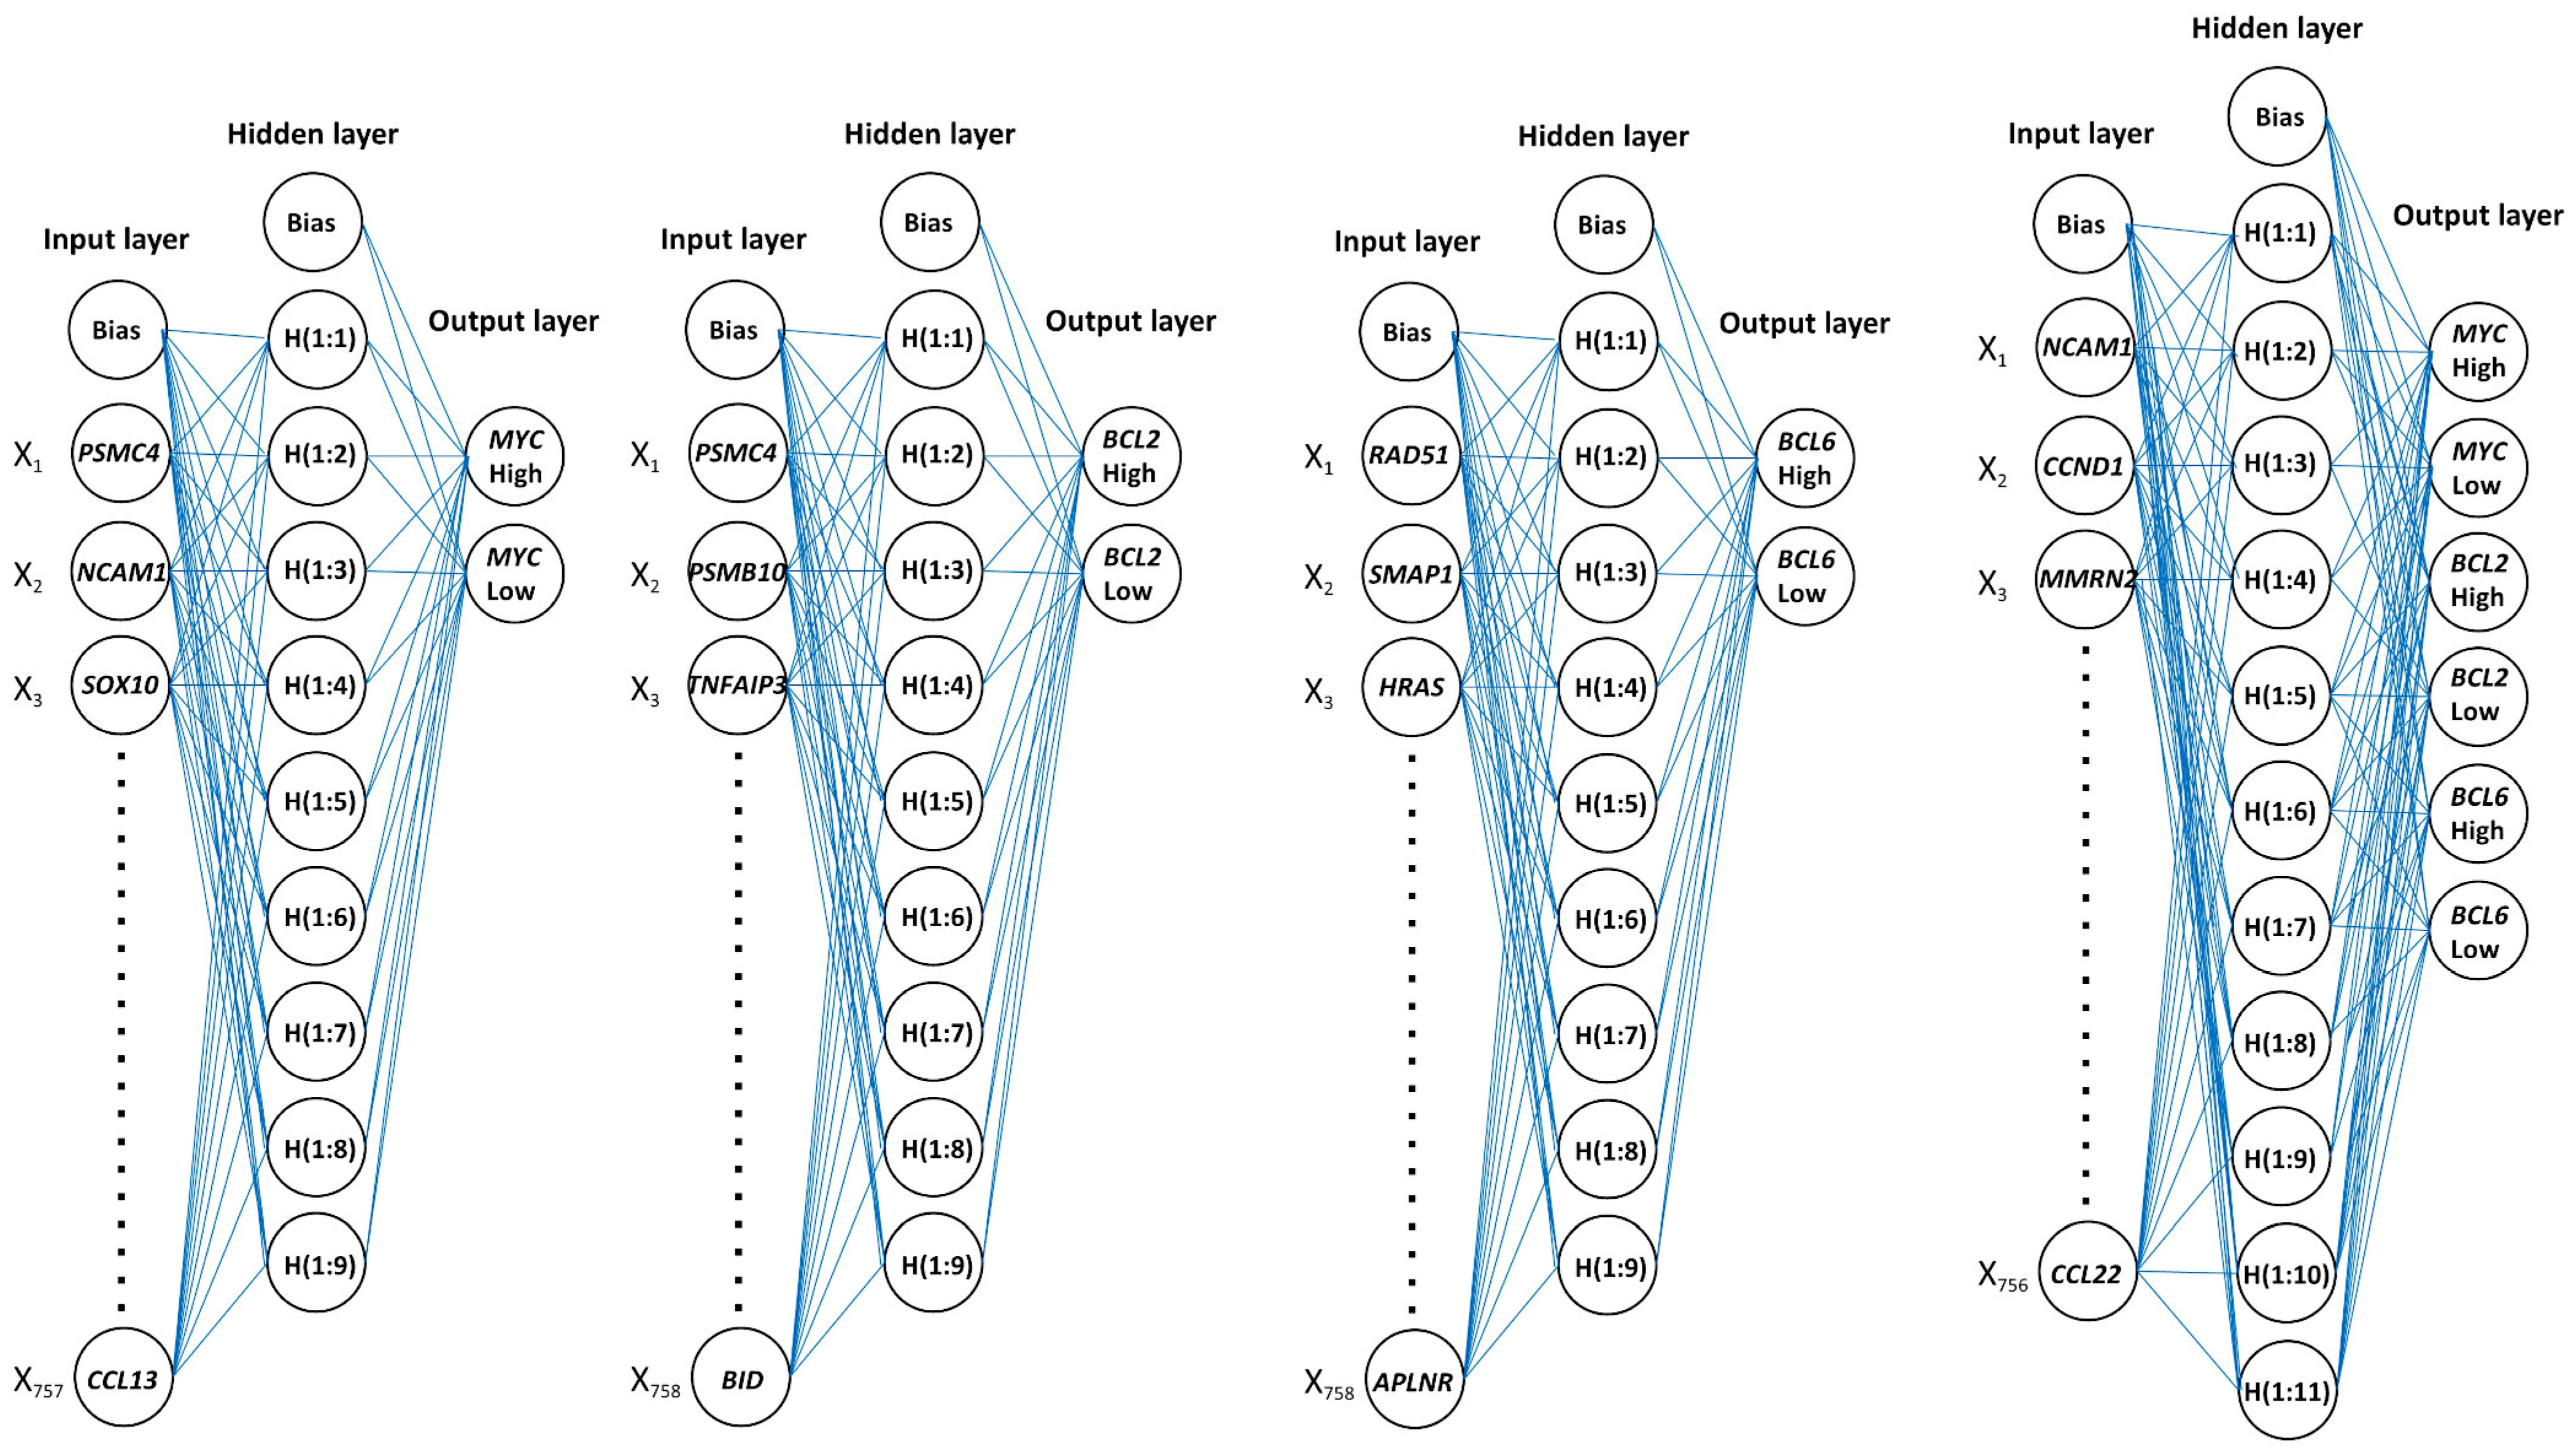
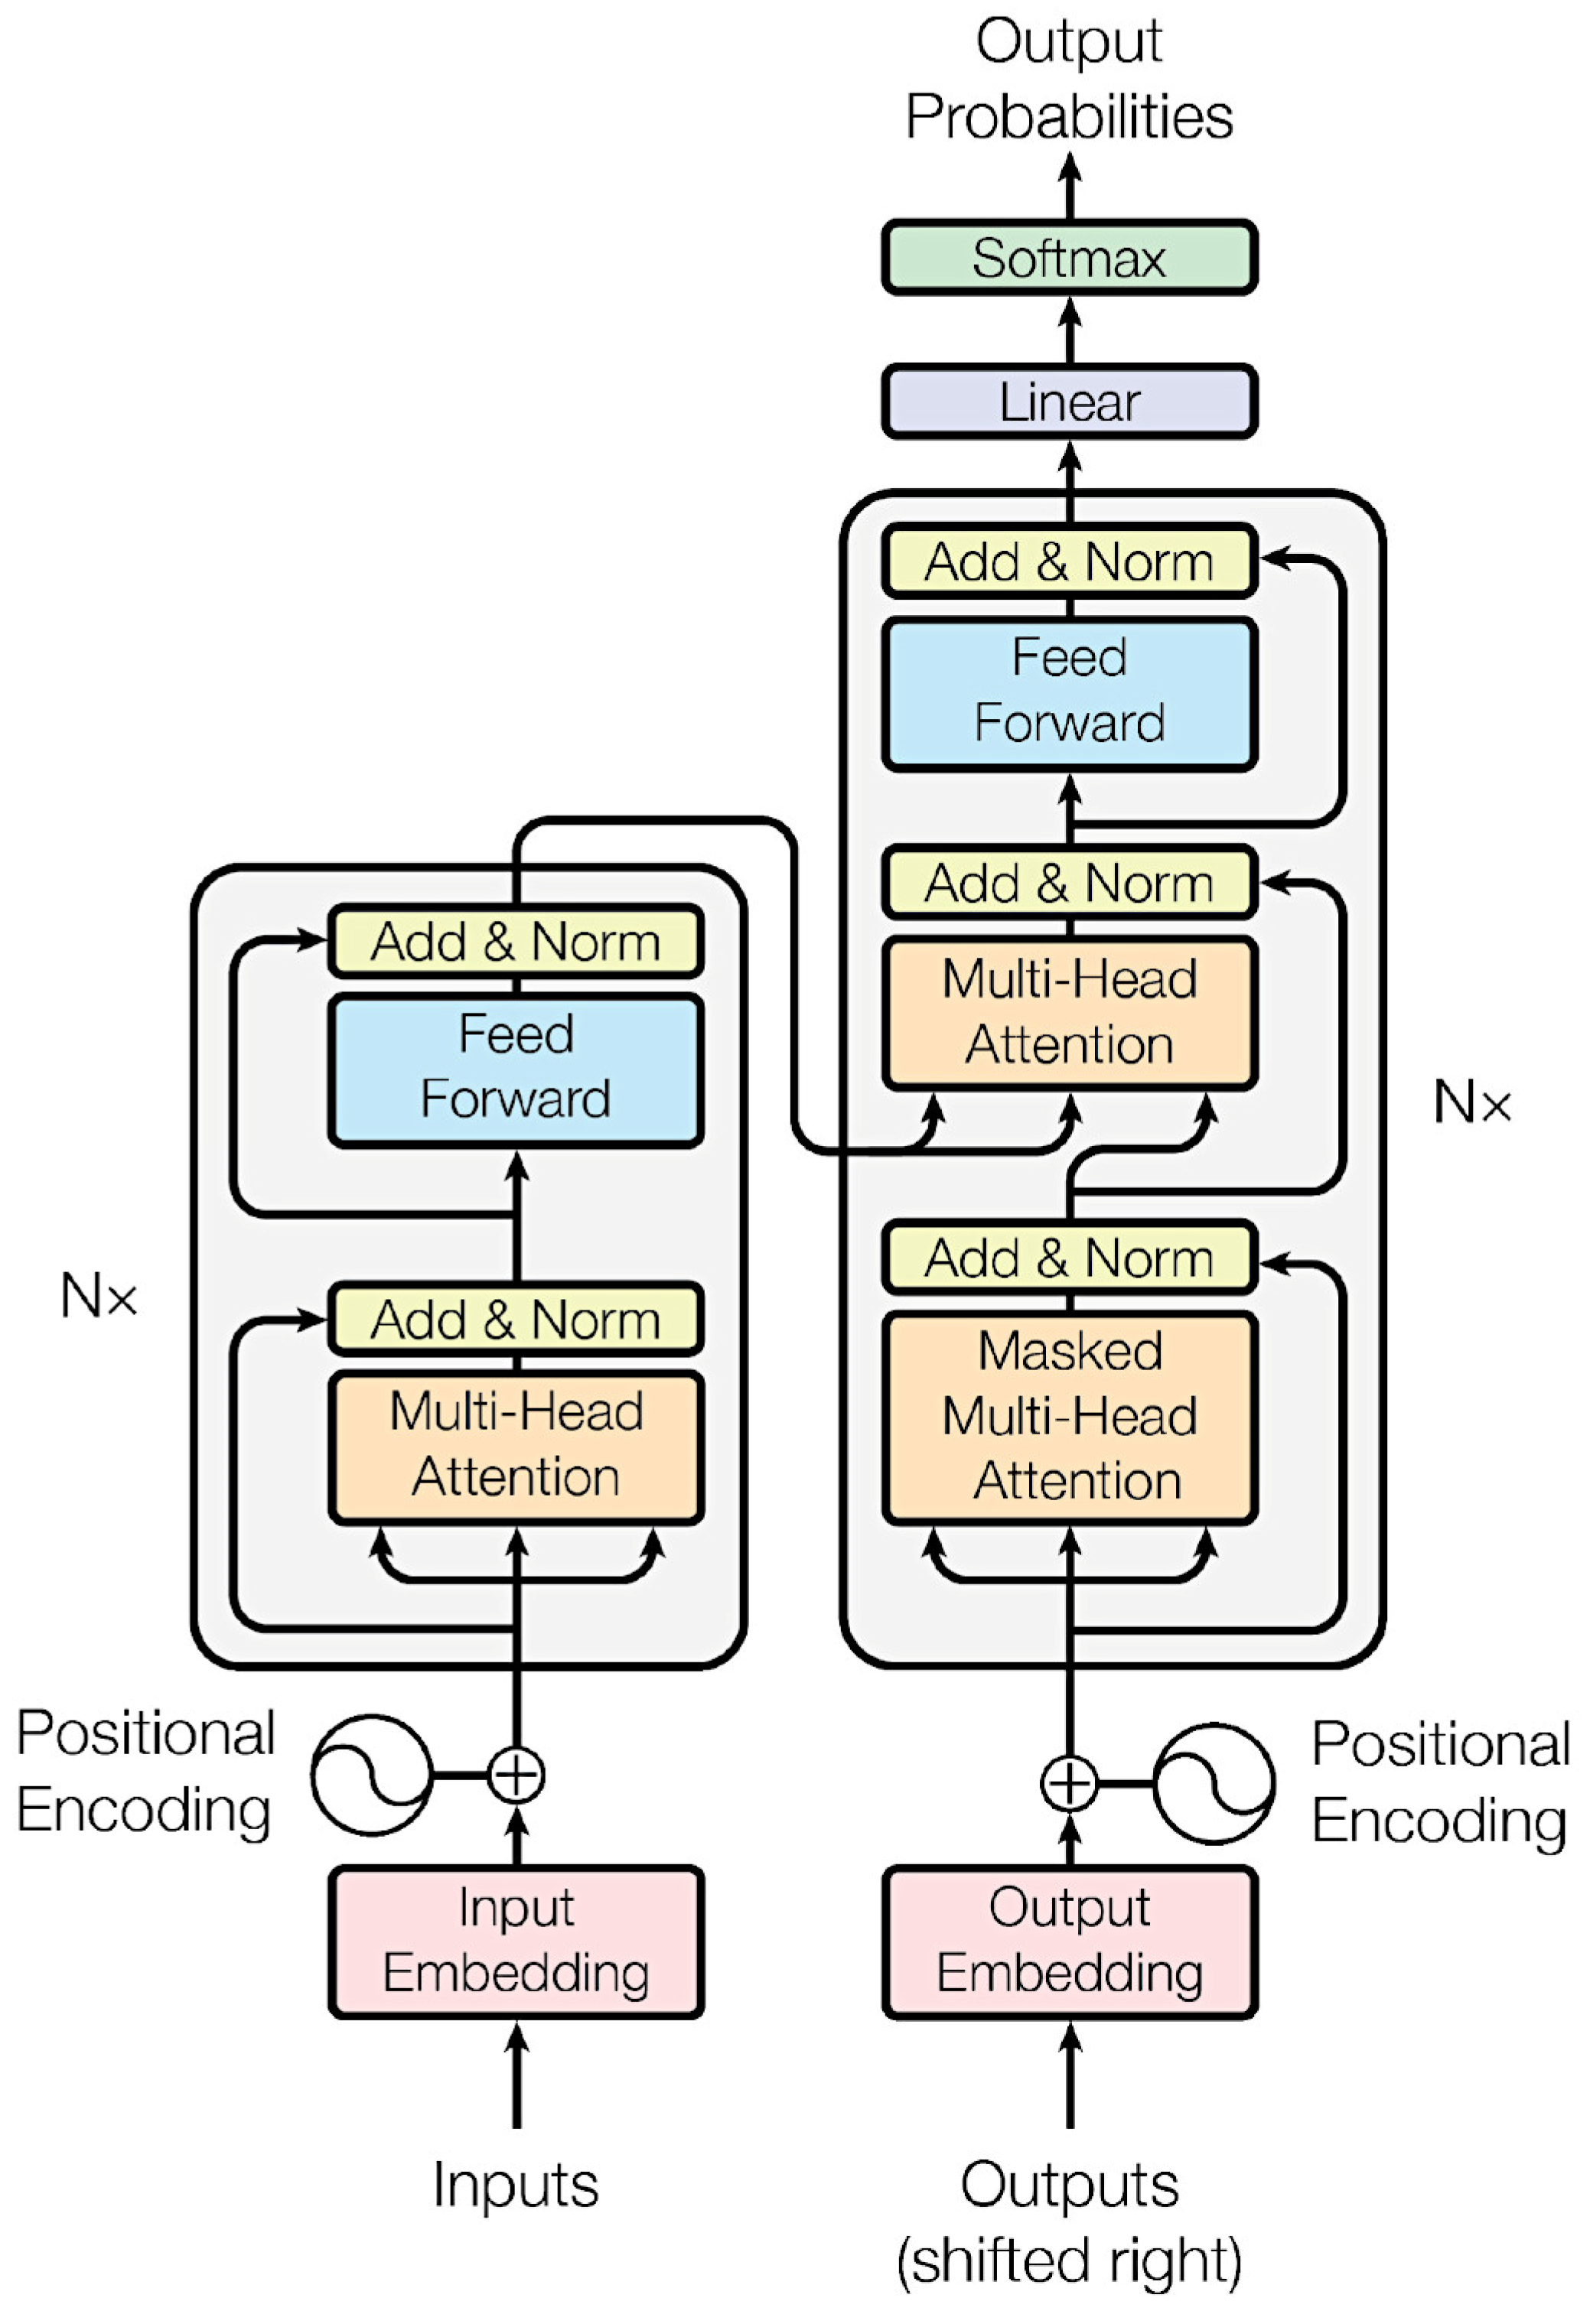
Hemato 05 00011 g008
Figure 9. Architecture of neural networks.
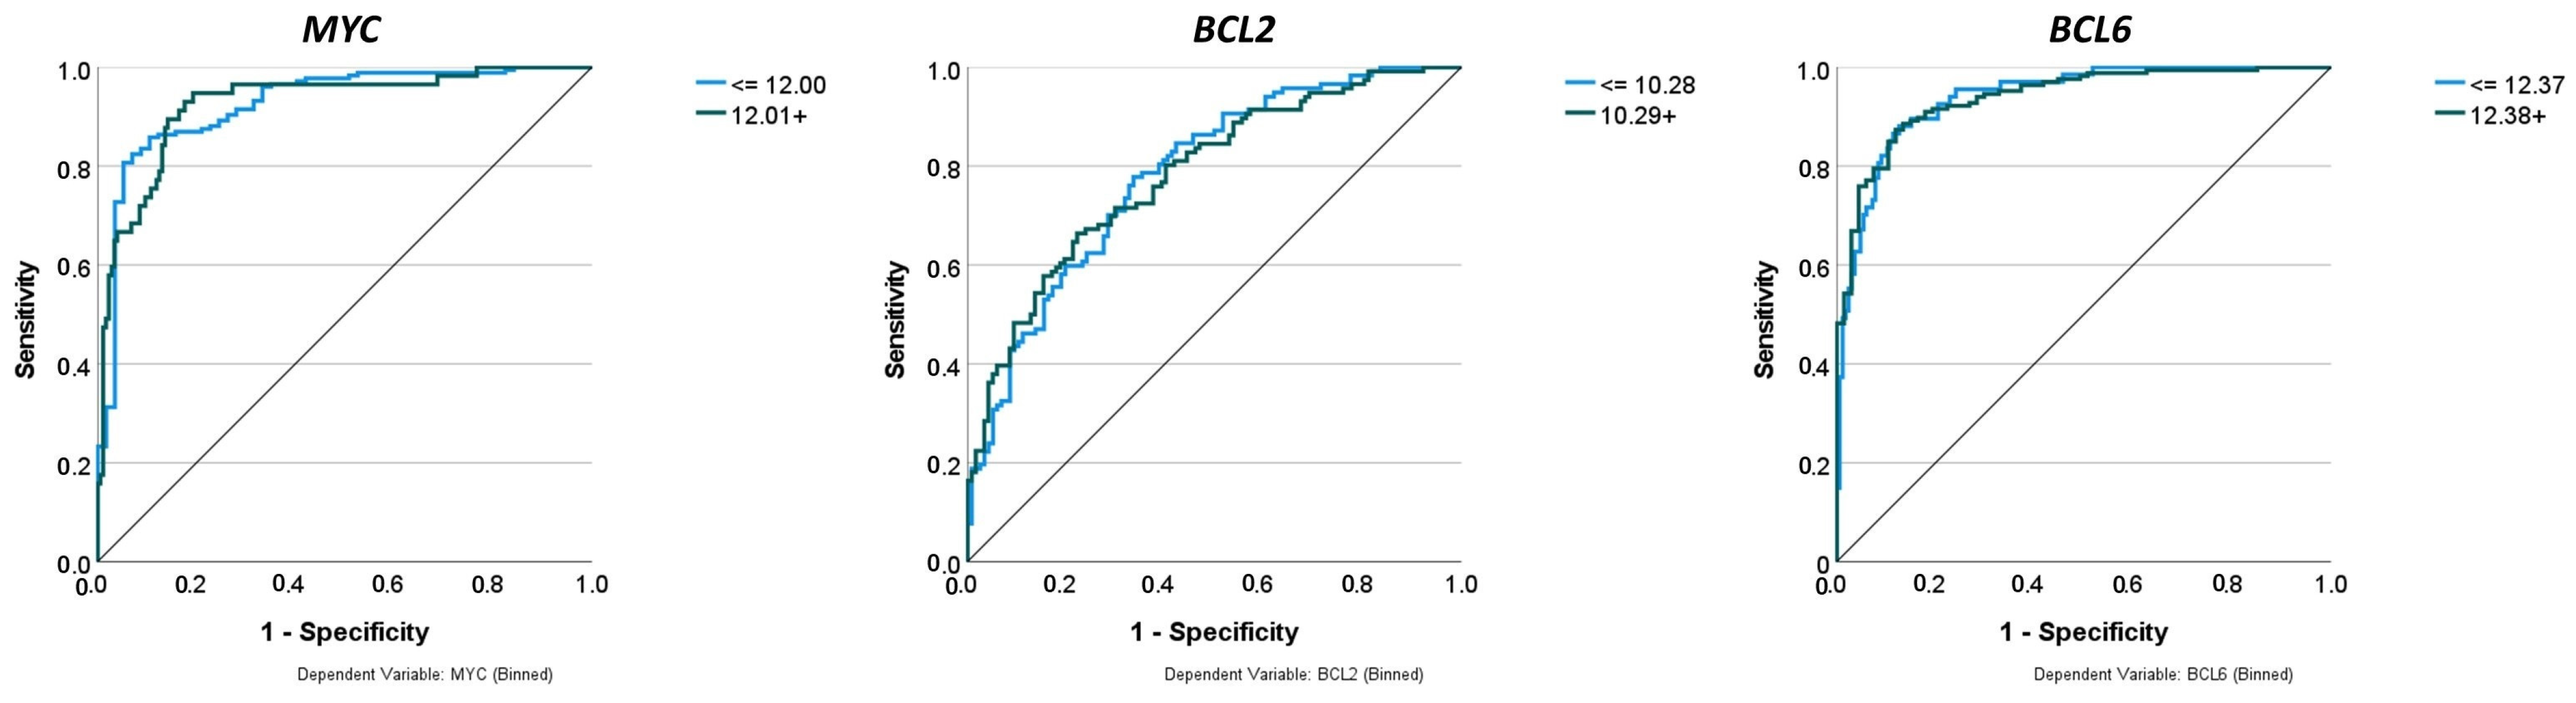
Hemato 05 00011 g009
Figure 10. 
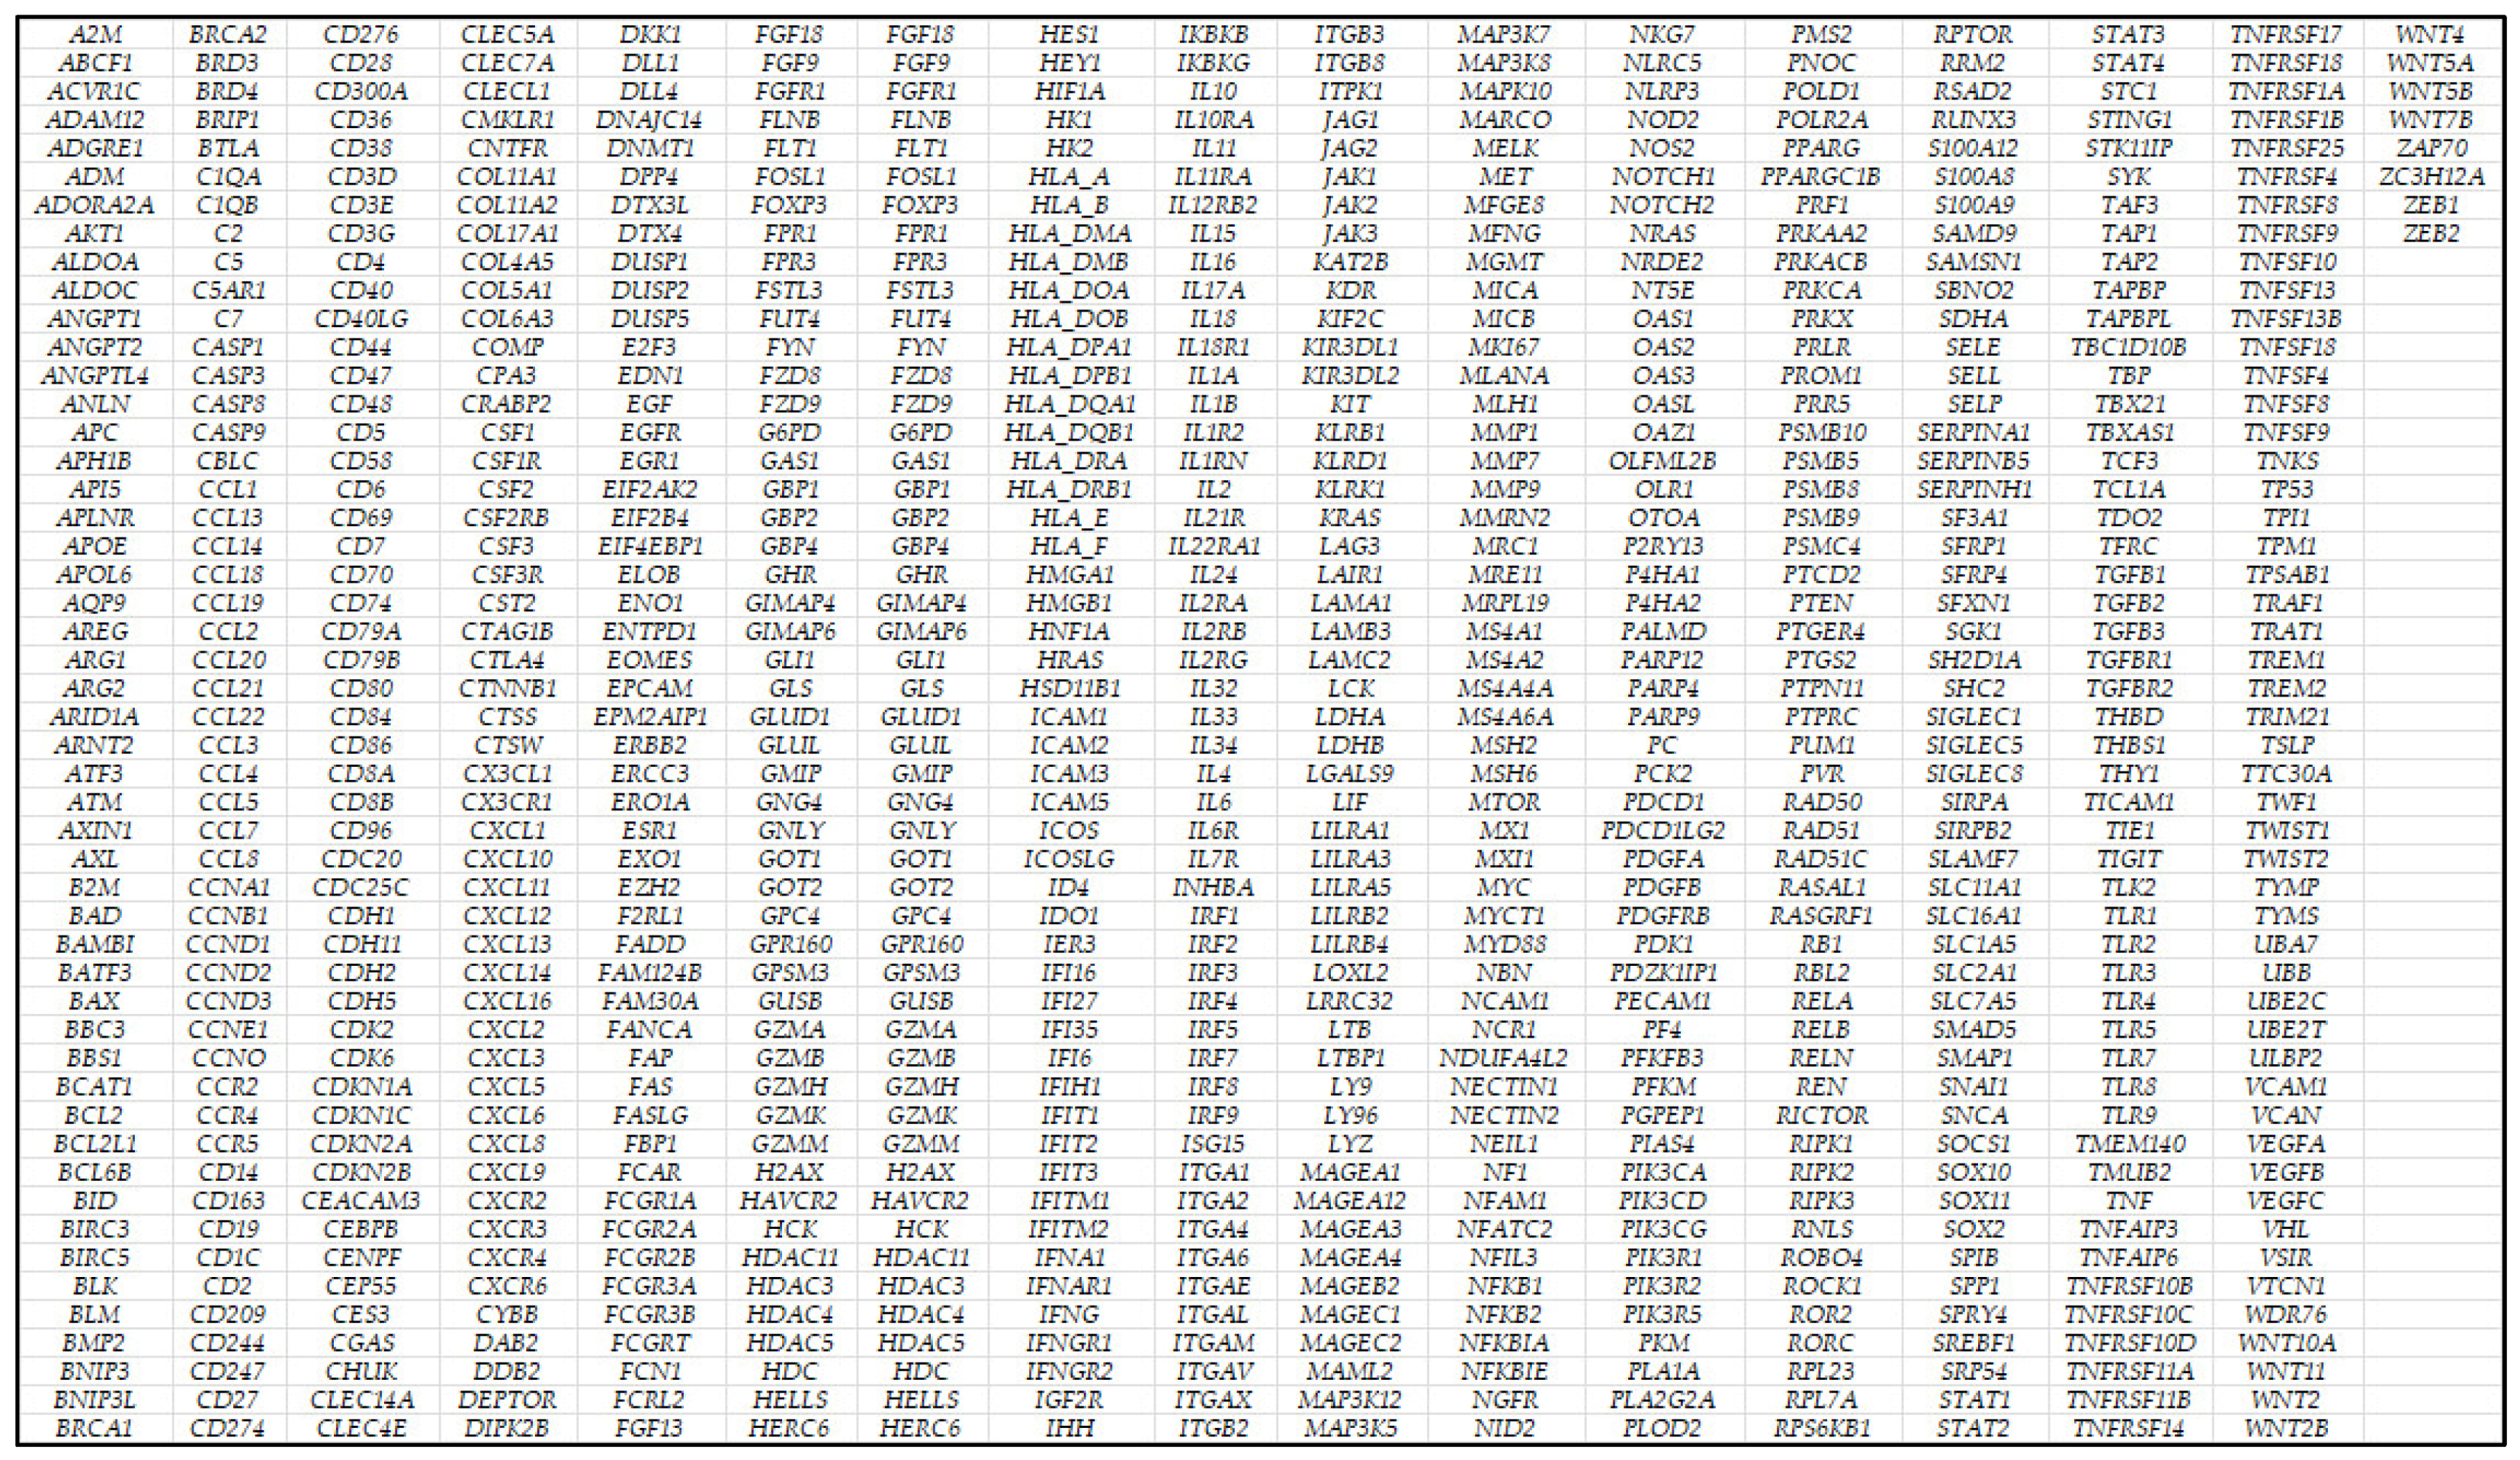
Comparison of performance using receiver operating characteristic (ROC) curves. The neural networks predicted the gene expression of MYC, BCL2, and BCL6 as binary variables (high vs. low). The predictors were 758 genes of a pan-cancer panel of immuno-oncology and translational research that includes clinically relevant actionable genes and pathways. The areas under the ROC curves were 0.925, 0.783, and 0.939, respectively.
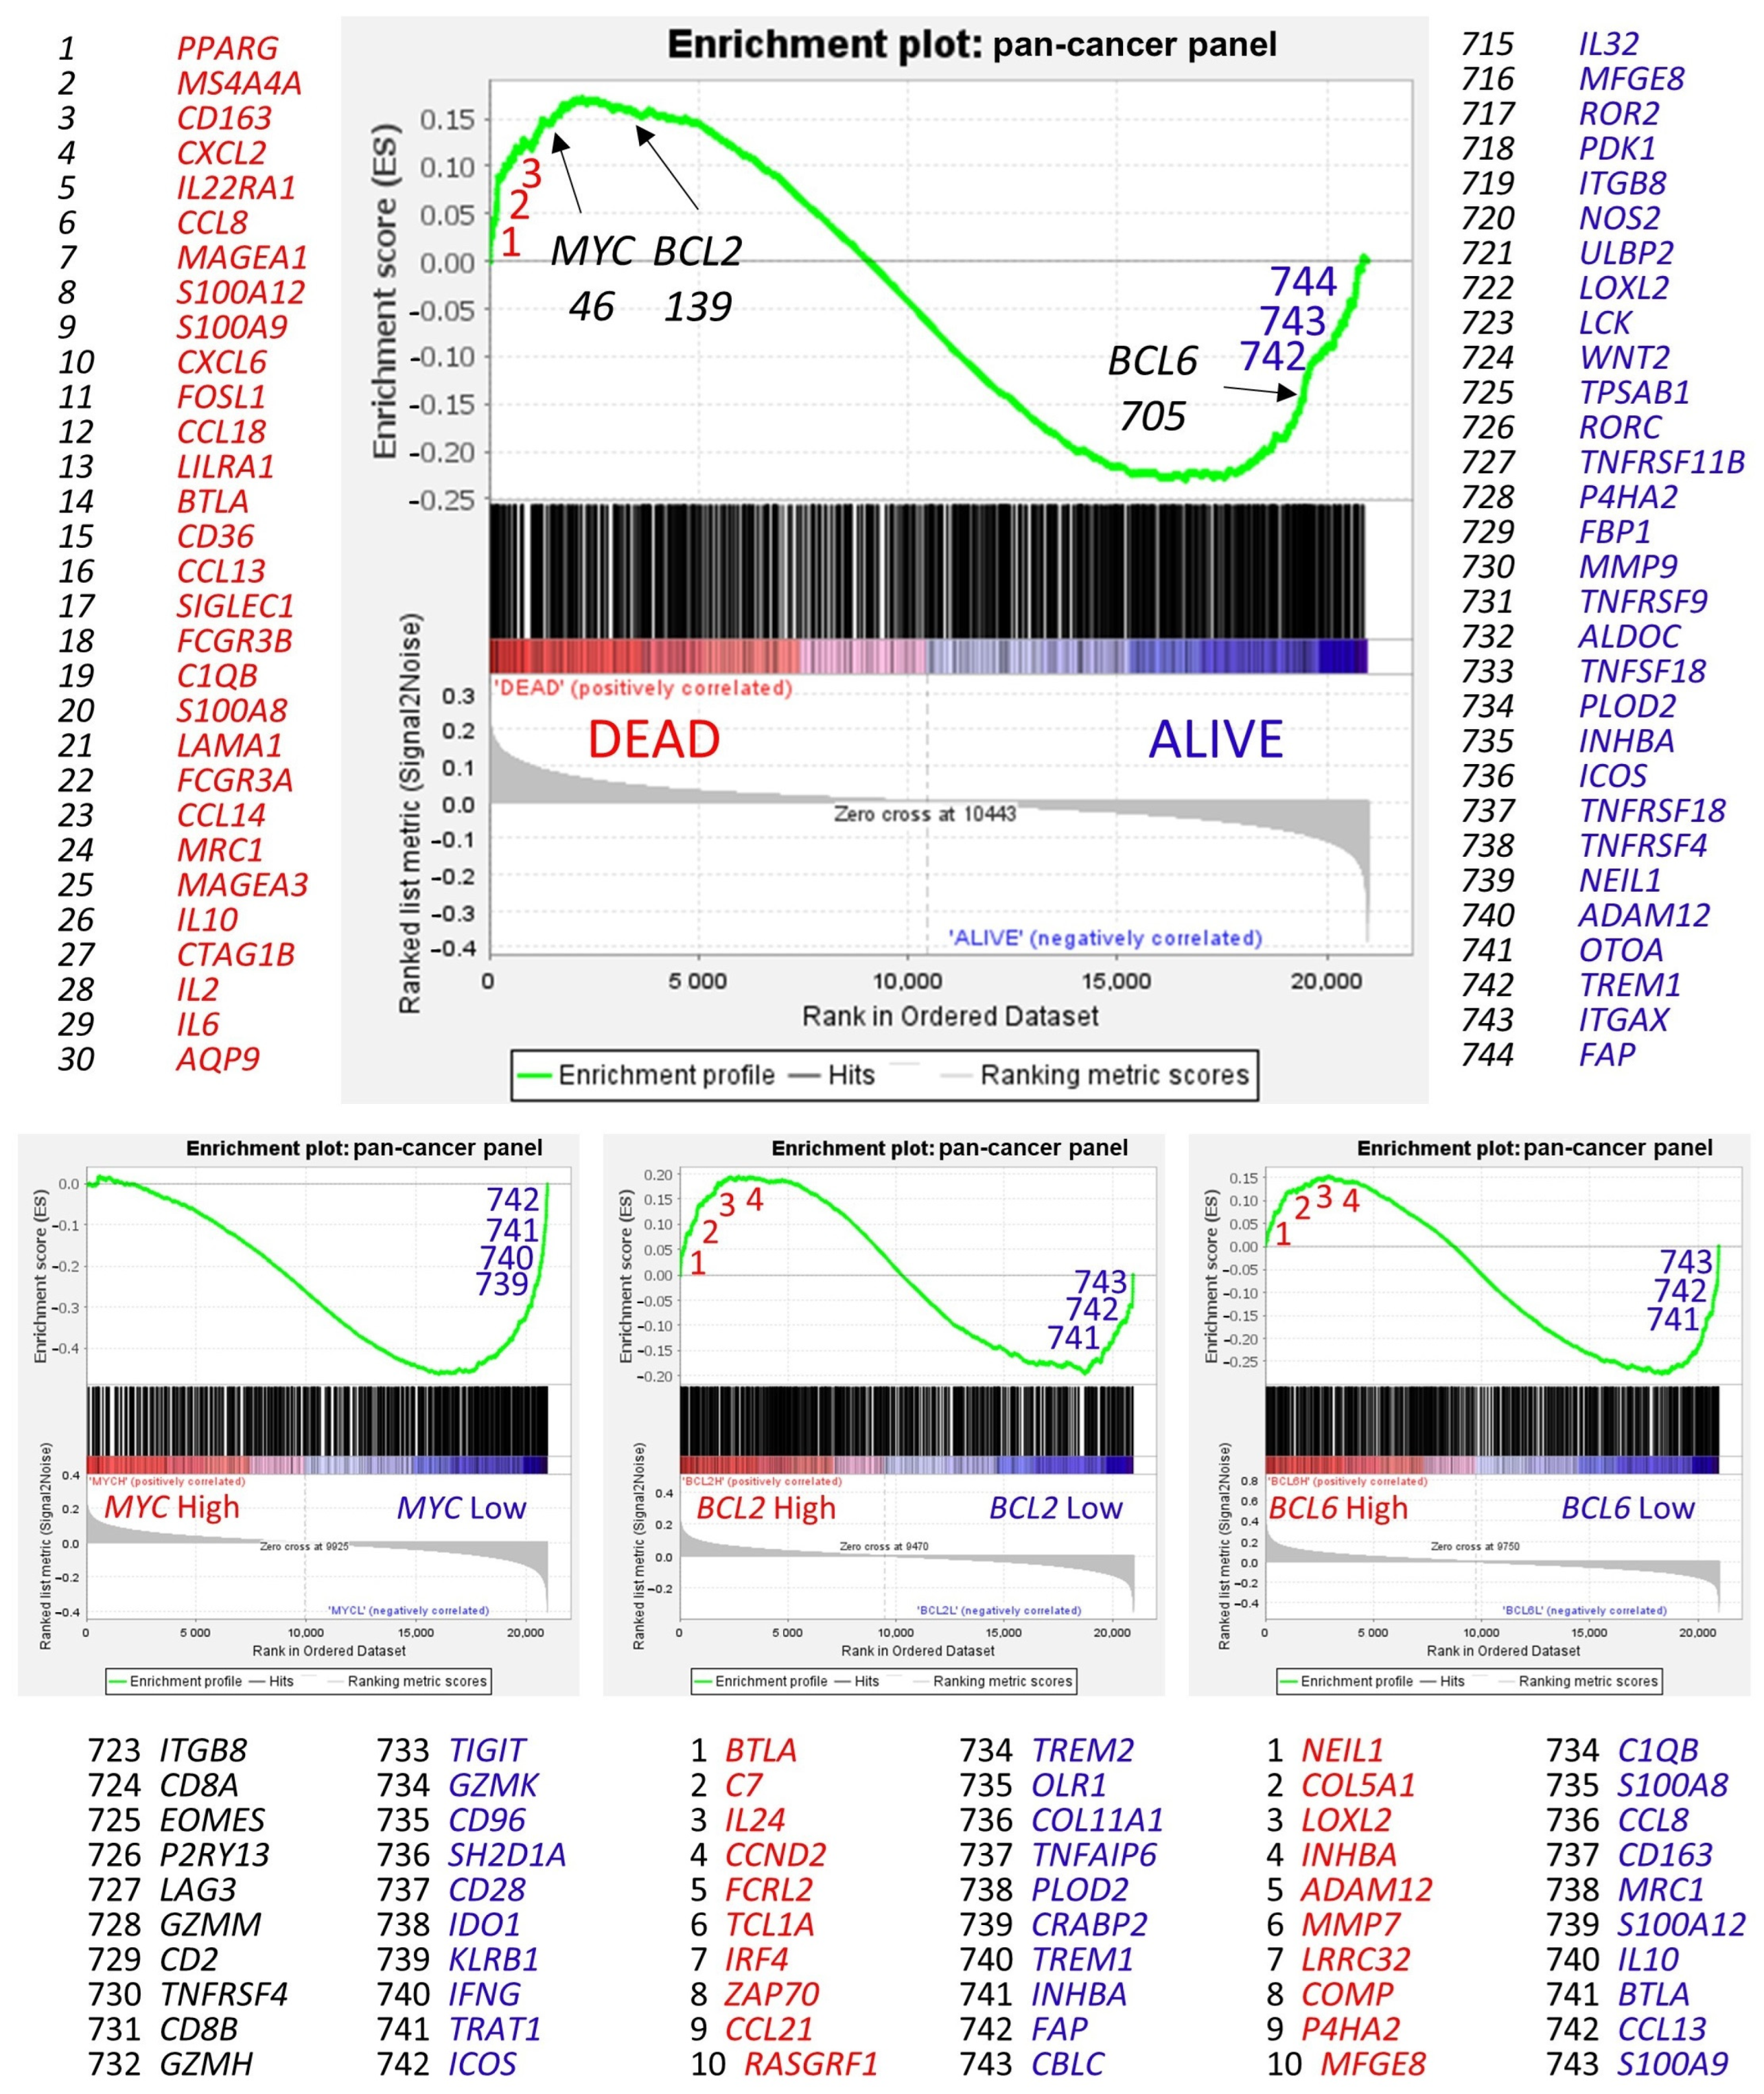
Hemato 05 00011 g010
Figure 11. Gene set enrichment analysis (GSEA). Gene set enrichment analysis (GSEA) is a computational method that determines whether an a priori defined set of genes shows statistically significant, concordant differences between two biological states (e.g., phenotypes) [66,67,68]. GSEA was performed using (i.e., the priori-defined set of genes) the 758 genes of the pan-cancer panel of immuno-oncology and translational research as predictors, which includes clinically relevant actionable genes and pathways. The predicted variables (i.e., phenotypes) were the overall survival outcome, such as dead vs. alive, and the MYC, BCL2, and BCL6 expression (high vs. low groups, the same as the neural networks). In the GSEA, the genes are ranked based on their rank metric score and running enrichment score (ES). The ES reflects the degree to which a gene set is overrepresented at the top or bottom of a ranked list of genes [66,67,68], for example, the gene expression profile of patients who died.
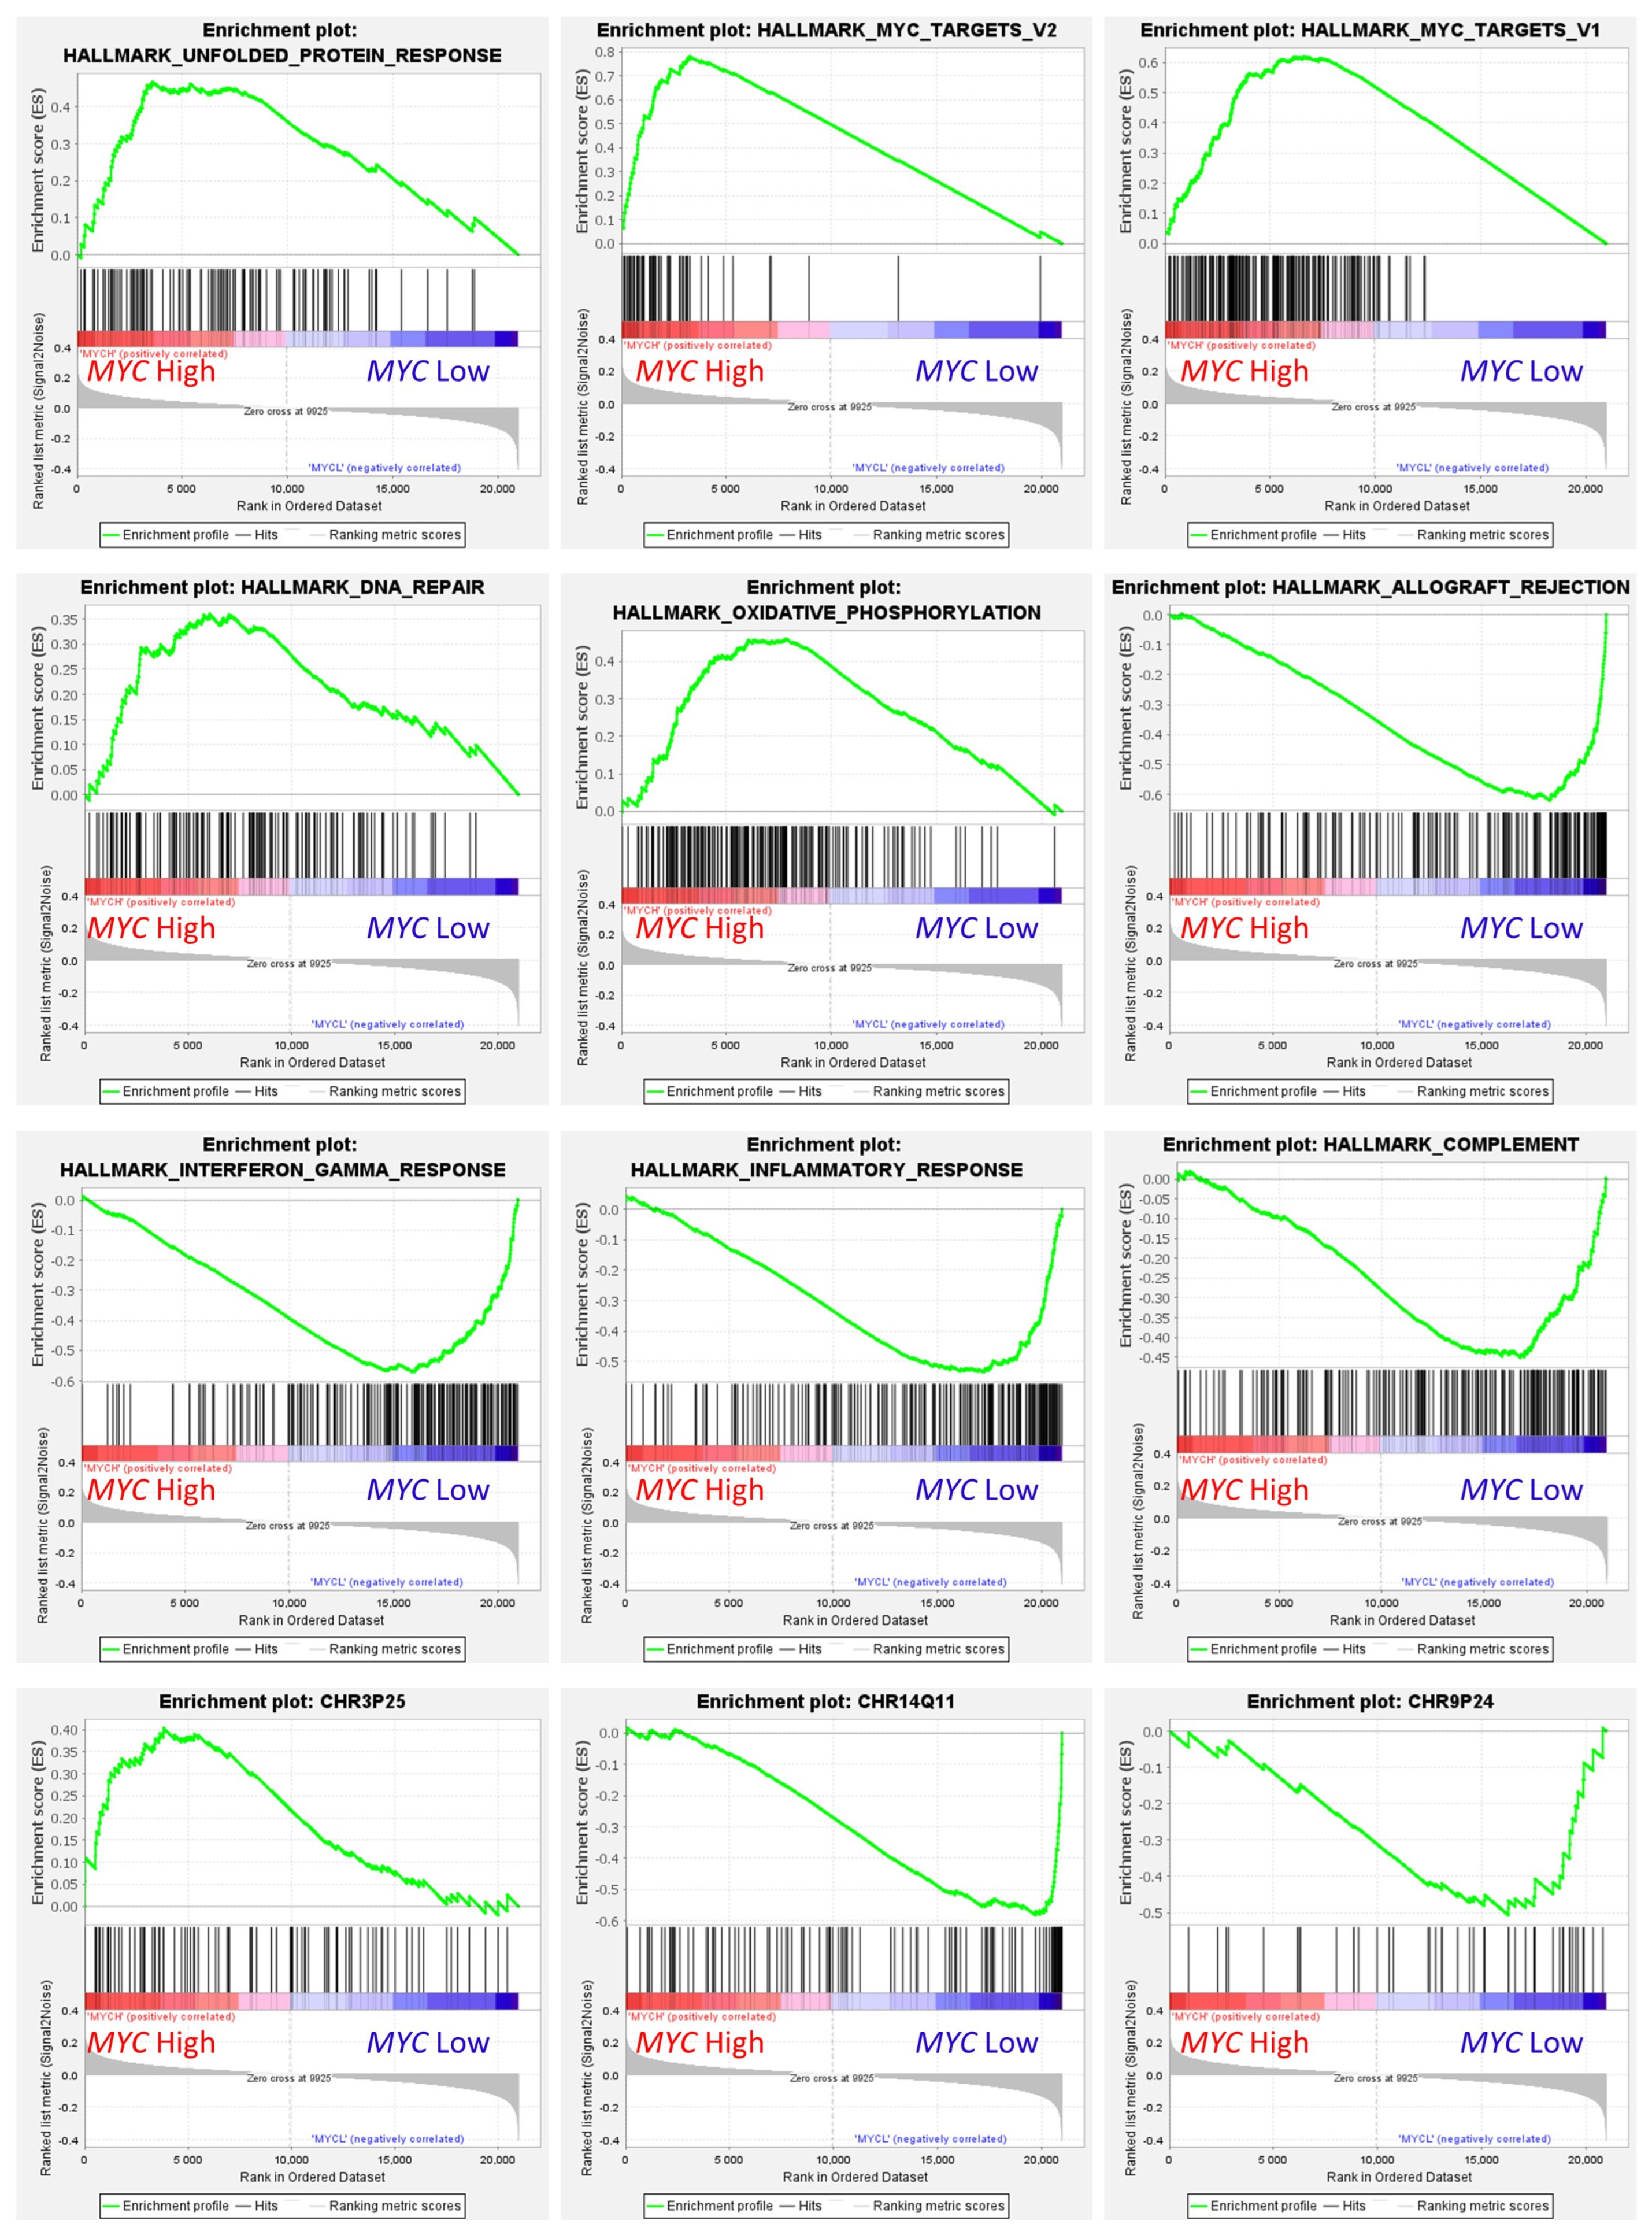
Hemato 05 00011 g011
Figure 12. Gene set enrichment analysis (GSEA) on MYC expression groups. GSEA analysis was performed using as predictors several gene sets of the Molecular signatures database (MSigDB), including hallmark (H), positional (C1), and curated (C2) gene sets. The predicted variable (phenotype) was the MYC expression (high vs. low groups), the same as the neural networks. This figure shows some of the most relevant GSEA plots. High MYC expression correlated with high expression of genes associated with protein response, MYC targets, DNA repair, oxidative phosphorylation pathways, and chromosome 3p25 locus-associated genes. Low MYC expression correlated with allograft rejection, interferon gamma response, inflammatory response, complement, and chromosome 1q11 and 8p24.
Hemato 05 00011 g012
Table 1. Applications of artificial intelligence in the medical field.
1. 
Disease detection
1.1.
Using DNA methylation analysis, a neural network was used for the early detection of hepatocellular carcinoma [13].
1.2.
Several biochemical parameters from the cerebrospinal fluid were evaluated using Raman spectroscopy and convolutional neural networks for the early diagnosis of Alzheimer’s disease. The study achieved a good classification accuracy of around 90% and a good correlation with the clinical dementia rating score [14].
1.3.
Several machine learning techniques and artificial neural networks were used to predict heart disease at an early stage using clinical, biochemical, and ECG data. In this study, the highest accuracy was achieved using random forests [15].
1.4.
A machine learning algorithm was used to classify patients with coronary disease based on 31 features. The classification had an acceptable accuracy for the identification of severe disease [16].
2. 
Personalized medicine
2.1.
A proof-of-concept analysis based on machine learning algorithms was used to classify patients with similar clinical and echocardiographic parameters to optimize the rate of responders to specific cardiac resynchronization therapies [17].
2.2.
Several machine learning algorithms were used to identify patients with a higher probability of major depression and anxiety disorder and who would benefit from digital psychiatric interventions [18].
2.3.
The Leukemia Artificial Intelligence Program (LEAP) used a machine learning method for the optimal treatment of tyrosine kinase inhibitors in patients with chronic myeloid leukemia [19].
3. 
Medical imaging
3.1.
Mammogram images were evaluated by two radiologists using an AI-assisted method. The study showed that both methods provided comparable results [20].
3.2.
Convolutional neural networks were used to detect lung nodules on chest computed tomography in patients with complex lung disease. The accuracy of the neural network was similar to that of experienced radiologists [21].
4. 
Clinical trials
4.1.
A randomized, controlled clinical trial (NCT0438756) used an AI-based system to assist in the evaluation of mammography images. The study concluded that AI-supported screening was comparable to standard double reading [22].
4.2.
The clinical trial NCT03954548 compared the evaluation of colonoscopy between a deep learning-assisted method and the standard method in patients undergoing colorectal cancer screening or surveillance. The study found that the AI method had a 2-fold lower misrate of colorectal cancer [23].
4.3.
The clinical trial ChiCTR1800018403 used an AI-based system to evaluate endoscopic images for the early detection of gastric cancer. The study showed that the deep convolutional neural network and deep reinforcement learning method correctly predicted cancer lesions but with less performance than the human-based method [24]
Table 2. Applications of artificial intelligence in hematological neoplasia.
1. 
Molecular pathology
1.1.
More than 130 genetic markers, gene expression, and microenvironment data were used to classify the seven most frequent non-Hodgkin B-cell lymphomas (B-NHLs) [25].
1.2.
A supervised machine learning method used the expression of 6817 genes to predict the overall survival of patients with diffuse large B-cell lymphoma [8].
1.3.
A series of 123 cases of mantle cell lymphoma were analyzed using gene expression data and several machine learning and artificial neural networks. This research highlighted pathogenic genes and immune–oncology pathways [26].
1.4.
Based on the RNA expression of 1408 genes, next-generation profiling, and machine learning (geometric mean naïve Bayesian algorithm), several diagnostic entities, including carcinomas and lymphoma, were classified with good performance [27].
1.5.
The prognosis of diffuse large B-cell lymphoma was predicted using a feedforward neural network in a series of 414 cases and gene expression data, which correlated to other prognostic markers, including MYC and BCL2 [28].
1.6.
Several mature B-cell neoplasms were analyzed using gene expression, immunohistochemical markers, machine learning, and neural networks. The study managed to classify the patients according to their lymphoma subtype and predict their survival. Pan-cancer analysis was also performed [29].
1.7.
Based on 730 immune–oncology genes, overall survival and cell-of-origin subtypes were predicted in a series of 106 cases of diffuse large B-cell lymphoma. The analysis included several machine learning and neural networks [30].
1.8.
Targeted RNA sequencing data obtained from a next-generation sequencing analysis platform were used to classify 418 cases of diffuse large B-cell lymphoma using AI and to predict the survival of the patients [31].
2. 
Medical imaging
2.1.
A total of 31 variables were used by an artificial neural network to predict the 5-year recurrence after treatment of 114 patients with Hodgkin’s lymphoma [32].
2.2.
A discrimination method that includes convolution and a neural network combined with the least absolute shrinkage and selection operator (LASSO) model was used to analyze the computed tomography data of 276 patients with enlarged cervical lymph nodes. The accuracy of this method was above 86% for lymphoma cases [33].
2.3.
The data of 5275 patients with lung and breast cancer and non-Hodgkin lymphoma were analyzed using an AI-based tool to create a predictive model of risk stratification and early disease detection [34].
2.4.
AI was used to analyze PET/CT images of 382 cases of diffuse large B-cell lymphoma (DLBCL) using only 2 maximum-intensity projection (MIP) images, and it correlated with the prognosis of the patients [35].
2.5.
The focal skeleton/bone marrow uptake (BMU) of FDG-PET/CT images was analyzed using an AI-based method in 201 patients with Hodgkin’s lymphoma [36].
2.6.
Anterior segment optical coherence tomography (AS-OCT) images were used to classify between vitreoretinal lymphoma and uveitis in 28 patients using the xgboost python function with good performance (AUC 0.84–0.94) [37].
3. 
Histological and cytological images
3.1.
Several artificial intelligence-based tools (Phyton SciPy package) were used to model several morphological biomarkers (nuclear size, cell density, and cell distance) to distinguish 125 tissue samples of chronic lymphocytic leukemia (CLL) progression to accelerated CLL (aCLL) or transformation to diffuse large B-cell lymphoma (Richter transformation; RT). The performance of the method was moderate, with an area under the curve (AUC) ranging from 0.66 to 0.94 [38].
3.2.
A series of 287 samples from several hospitals were used to predict MYC rearrangement using histological slides of diffuse large B-cell lymphoma. The analysis had a good sensitivity of 0.93 but a low specificity of 0.52 [39].
3.3.
Neural networks were used to differentiate between diffuse large B-cell lymphoma and Burkitt lymphoma in a series of 70 cases, including 10,818 images [40].
3.4.
Hematoxylin and eosin (H&E) images of 388 cases were analyzed by AI to classify the samples into diffuse large B-cell lymphoma, follicular lymphoma, and reactive lymphoid tissue with high accuracy [41].
3.5.
The images of 629 patients with non-Hodgkin lymphoma were analyzed using a convolutional neural network to stratify the patients according to different lymphoma subtypes. The algorithm had an accuracy of 96% [42].
3.6.
Histological images of chronic lymphocytic leukemia were analyzed using AI in proliferation centers to identify the accelerated phase and Richter transformation based on nuclear characteristics [43].
3.7.
Blood films from 591 samples were used to identify circulating abnormal cells (leukemic and dysplastic cells) [44].
Table 3. Confusion matrix.
Confusion MatrixTrue Class
PositiveNegative
Predicted classPositiveTrue Positive (TP)False Positive (FP)
NegativeFalse Negative (FN)True Negative (TN)
Table 4. Cutpoints of MYC, BCL2, and BCL6 genes.
GeneCutpointDistribution
MYC≤12.0176/233 (75.5%)
12.01+57/233 (24.5%)
BCL2≤10.28117/233 (50.2%)
10.29+116/233 (49.8%)
BCL6≤12.3767/233 (28.8%)
12.38+166/233 (71.2%)
Table 5. Neural network characteristics.
MYCBCL2BCL6MYC, BCL2, and BCL6
Training set161/233 (69.1%)173/233 (74.2%)161/233 (69.1%)159/233 (68.2%)
Testing set72/233 (30.9%)60/233 (35.8%)72/233 (30.9%)74/233 (31.8%)
Input layer
Units757757758756
RescalingStandardizedStandardizedStandardizedStandardized
Hidden layer
Number1111
Units991011
Activation functionHyperbolic tangentHyperbolic tangentHyperbolic tangentHyperbolic tangent
Output layer
Predicted variables1113
Units2226
Activation functionSoftmaxSoftmaxSoftmaxSoftmax
Error functionCross-entropyCross-entropyCross-entropyCross-entropy
Classification percentage correct
Training set86.3%82.2%88.2%76.7%, 81.1%, and 83.6%
Testing set88.9%63.3%86.1%83.8%, 67.6%, and 77.0%
Area under the curve (AUC)0.9250.7830.9390.81, 0.86, and 0.86
First and most relevant predictorsPSMC4, NCAM1, SOX10, PTPRC, PSMB10, C5AR1, IL6, CBLC, FCGR3B, and MTORPSMC4, CNTFR, PSMB10, TNFAIP3, MLH1, CXCR2, FADD, CD7, AREG, and TBXAS1RAD51, SMAP1, HRAS, SFRP1, LAG3, BTLA, TICAM1, BCL2L1, G6PD, and ICAM2NCAM1, CCND1, MMRN2, RAD51, TIGIT, THY1, BTLA, ITGA2, HCK, and SFRP1
Table 6. Confusion matrix for MYC prediction.
TrainingPredictedTestingPredicted
ObservedLowHighObservedLowHigh
Low1157Low504
High1524High414
Accuracy: 86.3% (training), 88.9% (testing).
Table 7. Confusion matrix for BCL2 prediction.
TrainingPredictedTestingPredicted
ObservedLowHighObservedLowHigh
Low7416Low207
High3053High1518
Accuracy: 73.4% (training), 63.3% (testing).
Table 8. Confusion matrix for BCL6 prediction.
TrainingPredictedTestingPredicted
ObservedLowHighObservedLowHigh
Low3115Low174
High4111High645
Accuracy: 88.2% (training), 86.1% (testing).
Disclaimer/Publisher’s Note: The statements, opinions and data contained in all publications are solely those of the individual author(s) and contributor(s) and not of MDPI and/or the editor(s). MDPI and/or the editor(s) disclaim responsibility for any injury to people or property resulting from any ideas, methods, instructions or products referred to in the content.

