Article

Proteomic Blueprint of Atlantic Cod (Gadus morhua) Otoliths Revealing Environmental Stress Insights through Label-Free Quantitative Shotgun Proteomics

1
Biochemistry Department, Memorial University of Newfoundland, St. John’s, NL A1B 3X9, Canada
2
Fisheries and Oceans Canada, Northwest Atlantic Fisheries Centre, St. John’s, NL A1C 5X1, Canada
3
Department of Medicine, University of Montreal, Montreal, QC H3C 3J7, Canada
4
Institute for Research in Immunology and Cancer (IRIC), University of Montreal, Montreal, QC H3T 1J4, Canada
5
Department of Chemistry, University of Montreal, Montreal, QC H3A 0B8, Canada
6
Chemistry Department, Memorial University of Newfoundland, St. John’s, NL A1B 3X7, Canada
*
Author to whom correspondence should be addressed.
BioChem 2024, 4(2), 144-165; https://doi.org/10.3390/biochem4020008
Submission received: 15 May 2024 / Revised: 11 June 2024 / Accepted: 14 June 2024 / Published: 19 June 2024
(This article belongs to the Special Issue Feature Papers in BioChem)

Abstract

:
Otoliths of the fish’s inner ear serve as a natural chronological recorder because of their continuous formation marked by daily, monthly, and annual increments. Despite their importance, the comprehensive protein content of otoliths remains not fully identified. Using the label-free shotgun proteomics method with one-dimensional liquid chromatography coupled to electrospray ionization-orbitrap tandem mass spectrometry, we quantified a broad range of proteins, with individual otoliths containing between 1341 and 1839 proteins. The identified proteins could potentially serve as a blueprint for fish growth from embryo to adult. We quantified eleven heat-shock proteins (HSPs) in both sexes and several proteins impacted by endocrine disruptors, indicating the otolith’s capacity to reflect environmental stress, potentially linked to climate change effects and altering of hormonal and neuroendocrine functions. Our bioinformatic ontology analysis confirmed the presence of proteins critical for various biological processes, including structural and enzymatic proteins. Protein–protein interaction (PPI) mapping also identified key interactions between the identified proteins. These findings significantly advance our understanding of otolith proteomics, offering a solid foundation for future work. Most of the identified proteins deposited daily and influenced by the environment were not implicated in the biomineralization of otolith, raising the potential for the otolith proteome to recreate details of fish life history at previously unrealized levels.

Graphical Abstract

1. Introduction

Atlantic cod (Gadus morhua) fishing is a significant economic resource in Canada, impacted by both overfishing and climate change [1,2,3]. The cod’s inner ear plays a crucial role in its balance and auditory functions. It consists of three semicircular canals that detect head movements and are essential for orientation; these canals are filled with endolymph fluid and contain a crista, which is a sensor for rotational and angular motions. Additionally, the inner ear includes three otolithic organs, the saccule, lagena, and utricle, each containing a unique otolith or ear stone (sagitta, lapillus, and asteriscus) vital for auditory and equilibrium processes [4,5,6].
Otoliths are composed of calcium carbonate (CaCO3) embedded with organic molecules such as complex polysaccharides and proteins, and are metabolically inert. They grow continuously through the daily accretion of concentric layers of the otolith matrix [7,8,9]. Otoliths are important tools in fisheries research, offering a window into the life history and ecological dynamics of fish species. Their multifaceted study includes macroscopic analyses, from shape and size, to microscopic examinations, such as growth increments and inorganic chemical composition, reflecting the fish’s environment and behaviours [10]. The analysis of the otolith composition can reveal the existence of common environmental factors that influence fish growth, help uncover past climate conditions, and predict future environmental impacts on marine ecosystems [11,12]. Fish growth is a complex biological process influenced by a combination of intrinsic and extrinsic factors. The intrinsic, such as ontogeny and sex, and extrinsic, such as abiotic conditions of the environment or intra-specific interactions, may complicate inferences about climatic impact [11].
A notable study created a century-long growth biochronology (1908–2014) for Atlantic Cod growth in Icelandic waters from otoliths, and demonstrated that temperature variations significantly influenced growth, with younger fish benefiting from warmer temperatures while older fish experienced negative growth effects under similar conditions [11].
The sagitta, the largest otolith, has garnered significant attention in research due to its size and detailed information about the fish’s age and growth patterns. Larger otoliths provide clearer and more distinct growth rings, offering accurate inter-specific morphological diversity [13,14].
Daily growth layers of otolith structures, formed by the gradual accumulation of new material, vary in thickness and composition depending on environmental conditions, some associated with proteins and some with the CaCO3 component. This continuous addition from hatching to death provides a valuable record of various aspects of fish life history, and serves as a potential environmental record [15,16]. Proteins constitute a small portion of the otolith, estimated at around 2–3% [17,18]. As most of these proteins are unlikely to be directly involved in biomineralization, it suggests that a diversity of proteins present in the endolymph are trapped in the otolith during increment formation [17]. This raises the intriguing possibility that the otolith is not only archiving elemental markers of environmental history, but also protein markers of development and physiological change over an individual’s lifetime [17,19]. Previous research has highlighted the significant roles of fifteen identified proteins in otolith formation and maintenance within vertebrates, focusing on three main groups: otolith matrix proteins, otolith anchoring proteins, and otolith regulatory proteins [15,20,21]. However, the comprehensive understanding of the otolith’s whole protein composition has not yet been investigated.
The advancement in proteomics has been propelled by innovations in protein separation, mass spectrometry (MS) establishing the identification and analytical composition, and data analysis through bioinformatics. MS is central to extensive protein studies. The “bottom-up” approach dissects proteins into peptides via proteolysis for analysis, termed “shotgun proteomics”, when applied to protein mixtures. This method assesses proteins indirectly by analyzing peptides from proteolytic digestion. In shotgun proteomics, peptides are fractionated, analyzed via LC-ESI-MS/MS, and identified by matching the characterized peptide sequences with the mass spectra against predicted spectra from a protein database [22,23,24,25,26,27].
We have recently demonstrated the feasibility of employing a shotgun proteomics approach to study the proteome of Atlantic Cod otolith key structures located in the fish’s inner ears [17]. The data suggested that the otolith proteins could be used to discover the whole fish protein profile ranging from embryo to adult. We have shown that most of these proteins were not implicated in the biomineralization of otoliths, raising the potential for the otolith proteome to help recreate details of fish life history at previously unrealized levels [17]. This initial qualitative investigation of otolith proteins allowed the identification of two primary functional categories, significantly broadening our comprehension of their roles beyond mere biomineralization. The first category involved proteins integral to biochemical processes, primarily in synthesizing and degrading proteins. The second category included proteins that were instrumental in physiological processes. This data significantly broadened our understanding of the roles of otolith proteins beyond mere biomineralization. These recently identified proteins appear to have a significant influence on essential life processes, including but not limited to growth, development, metabolism, and the reproductive system within the otolith framework.
In this work, we present our current efforts to quantify the proteins of the cod otolith proteome from ten fish quantitatively, aiming to address the following objectives: (A) determine the quantity of either different, similar, or absent proteins present in the make-up of the otoliths obtained from both sexes, (B) establishment of the presence of indicators of heat stress present in the otoliths of both sexes, as a possible indicators of global warming of the Atlantic Ocean, and (C) establishment of the presence of endocrine disruptor protein bioindicators that can indicate the alternation of the hormonal and neuroendocrine fish functions.

2. Materials and Methods

2.1. Otoliths

The archived otolith collection at the Northwest Atlantic Fisheries Centre (St. John’s, NL, Canada) contains thousands of Atlantic cod otoliths collected over several decades. The methods used to collect otoliths can vary slightly with the individual technician, but in general, otoliths were exposed via a dorsal incision in the fish’s skull and were removed using forceps. Otoliths were blotted dry with paper towels and stored in small paper envelopes. For this study, we selected ten otoliths (five males and five females) collected in 2019 from the northeast coast of Newfoundland, Canada. Otoliths were washed several times with deionized water before protein extraction, as previously described [17]. Finally, each individual otolith was ground in a mortar using a pestle and then added to a fine powder.

2.2. Chemicals and Standards

All standards, samples, and buffers were prepared using ultra-pure Milli-Q H2O (18.2 MΩ·cm, Merck Millipore, Darmstadt, Germany). All chemicals were purchased from Sigma Aldrich (Castle Hill, NSW, Australia) and were of the highest available purity. Mass spectrometric grade trypsin was obtained from Promega (Madison, WI, USA). MS-grade solvents for chromatography were obtained from Canadian Life Science (Peterborough, ON, Canada).

2.3. Otolith Protein Extraction

The sagitta otoliths were washed, cleaned, and dried as previously described [17]. Full powdered otoliths (2 mg) were suspended in 20% w/v trichloroacetic acid (TCA) (10 mL) and incubated overnight at room temperature. Samples were then centrifuged at 10,000× g for 10 min, and the supernatant was discarded. The crystals were washed with 100 µL of ice-cold acetone and recentrifuged. The supernatant and any remaining undissolved otolith were discarded, and the vacuum-dried pellet was processed for in-solution digestion. Briefly, 0.1 mg of the pellet was resuspended in denaturing buffer containing 8 M urea and 0.4 M ammonium bicarbonate (NH4HCO3). Then, 10 µL of 0.5 M dithiothreitol (DTT) was added and incubated for 30 min at 60 °C. After cooling for 5 min at room temperature, 20 µL of 0.7 M iodoacetamide (IAcNH2) was added and incubated for 30 min. Next, the sample was diluted with 1.2 mL of H2O followed by 10 µL of 0.1 M CaCl2. For enzymatic digestion, 100 µL of 0.02 µg/µL trypsin (Promega Trypsin Gold, Mass Spectrometry Grade, Promega) prepared in 50 mM NH4HCO3 was added to each sample. The samples were incubated overnight at 37 °C in a shaker. The trypsin activity was inhibited by adding 1 µL of trifluoroacetic acid (TFA), and the samples were acidified to a pH below 3 with formic acid.
The samples were then desalted using Oasis HLB 3cc Extraction Cartridges (Waters, MA, USA) connected to a SuperlcoVisiprep DL manifold (Sigma-Aldrich, Darmstadt, Germany). The column was conditioned using 0.5 mL methanol followed by 1 mL of an elution buffer containing 50% ACN and 0.1% TFA, and then with 2 mL wash buffer prepared with 0.1% TFA. After loading the sample, the column was washed with 5 mL of wash buffer and eluted twice with 0.5 mL of 50% acetonitrile-0.1% TFA and once with 0.5 mL of 80% ACN-0.1% TFA. The eluant was dried using a vacuum concentrator (SpeedVac Concentrator, Thermo Electron Corp., Waltham, MA, USA). The dried peptide was reconstituted in 12 µL of resuspension buffer containing 5% acetonitrile and 0.1% formic acid.

2.4. Shotgun Proteomics by LC-ESI-MS/MS

The LC separation was carried out using the Ultimate 3000RSLCnano system (Dionex/Thermo Fisher Scientific, Waltham, MA, USA). For analysis, 2 µL (1 mg/mL) of the sample was injected onto an in-house packed capillary column (50 cm × 75 µm, pulled tip, ESI source solutions) packed with Jupiter C18 4 µm chromatographic media (Phenomenex, Torrance, CA, USA) at a flow rate of 300 nL/min. Chromatographic separation was performed by a 120 min method using solvent A (0.1% formic acid in MS-grade water) and solvent B (0.1% formic acid in MS-grade acetonitrile) from 5% to 30% for 90 min, then increasing to 55% for the next 12 min, and then to 95% for 8 min before being reduced to 5% B for the remainder of the 120 min run. The column oven temperature was set at 40 ºC.
The ESI-MS and MS/MS spectra were obtained using an Orbitrap Fusion Lumos Tribrid Mass Spectrometer (ThermoScientific, Waltham, MA, USA) fitted with a Nanospray Flex Ion source and a FAIMSpro source. The detailed acquisition parameters for mass spectrometry analysis were as follows: For ionization, the spray voltage was 1.8 kV, and the ion transfer tube temperature was 300 °C. The data were acquired in data-dependent acquisition (DDA) mode with a full scan using Orbitrap at a resolution of 120,000 over a mass range of 400–2000 m/z. The FAIMS source was operated at three different compensation voltages (CV = 40, 60 and 80). The auto gain control (AGC) was set in standard mode, and maximum injection time at Auto mode for each MS/MS, acquisition of peaks with intensities above 5.0 e3 were performed using normalized HCD collision energy of 35%. The cycle time was set at 1 s. The isolation window for MS/MS was set at 1.6 Da. The AGC target was set at standard mode with the maximum injection time mode as Auto. The precursor ions with positive charges 2 to 5 were selected for MS/MS analysis. After every single MS/MS acquisition, the dynamic exclusion time was set at 60 s with a mass tolerance of ±10 ppm.
The MS/MS raw files were acquired using Thermo Scientific Xcalibur 4.5 and Tune 3.5 (Waltham, MA, USA) and searched against the Gadus morhua protein database (Taxon ID 8049) downloaded from Uniport using Proteome Discoverer 2.5 (ThermoFisher, Waltham, MA, USA). The SequestHT search engine node was used for peptide and protein identification. Two missed cleavages for trypsin digestion were allowed with a 10 ppm precursor mass tolerance and fragment mass tolerance of 0.6 Da. Oxidization of methionine and N-terminal acetylation were set as dynamic modification, and carbamidomethyl cysteine was selected as a static modification.

2.5. Quantitative Analysis

This study was done using label-free proteomics quantification. The peptides are identified and searched against the Gadus morhua protein database (Taxon ID 8049) and searched for the MS2 acquired during the DDA acquisition. The peptide quantification was performed by integrating the area under the curve of the MS1 of the identified peptides using Proteome Discoverer 2.5 (ThermoFisher, Waltham, MA, USA). This was followed by populating the total area of all the identified peptides within a protein to derive protein abundances. The ratio of these abundances is then used to compare the different samples. This approach allows for relative quantitative analysis, comparing protein levels across samples (0.1 mg/mL), with careful standardization ensuring comparability despite not measuring absolute protein quantities.
To ensure precise comparisons in label-free proteomics quantification, this study implemented consistent protocols across all procedures, from sample prep to analysis.

Quantitative Expressed Protein Intensities Accuracy

The variance stabilization normalization (VSN) is a transformation technique employed in mass spectrometry data analysis to maintain consistent variance across the intensity spectrum [28]. VSN serves the dual purpose of background noise subtraction and data normalization, facilitating a clear relationship between mass spectrometry (MS) peak intensity and variance. Consequently, this enhances the accuracy of the analytical results by stabilizing variance. The missing value imputations were performed by replacing missing values with random values picked in the 5% lower end of the normal distribution of intensities. VSN was performed using Proteome Discoverer 2.5 (ThermoFisher, Waltham, MA, USA). Additionally, a p-value ≤ 0.05 was considered significant.

2.6. Statistical Analysis

The quantitative evaluation of the total number of protein expression differences between male and female groups was conducted using two-sample t-tests and then the calculation of 95% confidence intervals (CIs). The statistical analyses were carried out using various R software packages. These included tidyr [29], magrittr [30], plyr [31], dplyr [32], and ggplot2 [33], facilitating the creation of comparison tables to present the findings. Further normalization analysis, generation of heat maps, and creation of volcano plots (abundance ratio Adjusted p-Value: (Female)/(Male) by Benjamini-Hochberg procedure) were performed using Proteome Discoverer 2.5 (ThermoFsher, Waltham, MA, USA). A p-value ≤ 0.05 was considered significant.

2.7. Bioinformatics Analyses

Gene ontology (GO) functional analyses for the extracted otolith proteins from Atlantic cod (Gadus morhua) were performed using the ClueGO plugin (version 2.5.9) within Cytoscape software (version 3.9.1). Due to the absence of cod organisms in the ClueGO plugin program, Atlantic salmon (Salmo Salar) was used for analysis to obtain the conserved functional analysis with Atlantic cod (Gadus morhua). Biological functions, cellular components, immune system processes, molecular functions, and KEGG provide specific gene annotations with their corresponding functions within identified biological pathways. Finally, the STRING database was used to visualize the protein–protein interactions within Atlantic cod (Gadus morhua) (https://string-db.org/cgi/network?taskId=bybNmeXaeGFU&sessionId=boleulT8hMV6, accessed on 14 May 2024). To identify the top 20 proteins based on their degree of connectivity, the cytoHubba plugin was used.

3. Results and Discussion

The main purpose of this work was to provide a comprehensive analysis of the whole protein content of ten otoliths. As mentioned, we have formerly conducted a qualitative analysis of twelve otoliths [17], which helped us understand the composition of otolith proteins. We compared the total number of proteins identified in the previous study to those in the current study. We found differences in the total numbers; we speculate that this discrepancy is due to the ages of the samples. The previous study analyzed samples that were approximately 12 years old, while our current study includes samples ranging from 8 to 11 years old (Figure 1). However, the eleven HSPs were identified in both studies.
In the current research, we presented the quantitative results of the proteins identified in our previous qualitative study [17]. We focused on ten samples obtained from five males and five females collected in 2019 (Table S1, Supplementary Excel sheet), and we report interesting novel protein biomarkers obtained during this global quantitative analysis of either different, similar, or absent proteins in the make-up of the otoliths obtained from either sex. We highlight that the presence and variation of HSPs in marine organisms could potentially help predict how global climate change might impact species’ metabolic costs [34]. Accordingly, in this manuscript, we suggest that the presence of HSPs in the otoliths of both sexes can be used as an indicator of global warming of the Atlantic Ocean. Furthermore, we quantified the proteins that could potentially be influenced by endocrine disruptors that can indicate alterations in the hormonal and neuroendocrine function of fish.
Analysis of our dataset revealed a range in the number of proteins per individual, varying from 1341 to 1839. Utilizing a two-sample t-test to compare the mean number of proteins between males and females, we found that there was no significant difference in the total number of proteins (Figure 2). This finding is supported by the 95% confidence intervals for females (1366.121, 1805.479) and for males (1327.221, 1700.779).
In the following, we will describe the intensities of the protein blueprint of Atlantic cod otoliths that will reveal the different biological processes. It is out of the realm of possibility to discuss all of the quantified proteins in this rationale. For this reason, we shall deliberate about a few selected protein models that represent physiological, ontogenetic, evolutionary, and environmental processes.

3.1. Protein Expression between Sexes

In our study employing ESI-MS/MS with DDA, we conducted a comprehensive proteomic analysis across ten individuals (Table S2, Supplementary Excel sheet). We identified significantly upregulated and downregulated proteins in females compared to males with an abundance ratio (Female/Male) range of 0.000911165–401.7070581 through the volcano plot visualization (Figure 3 and Table S3, Supplementary Excel Sheet). Proteins with high abundance ratios (fold change > 2) and low adjusted p-values < 0.05 were considered significantly more abundant in females than males. A subset of these proteins exhibiting sex-specific expression differences (differentially expressed proteins between sexes), as visualized in the heatmap (Figure 4), which may have crucial roles in fish’s physiological and reproductive processes.

3.1.1. Otolith Proteins with Substantial Female-Biased Expression

Among the proteins with substantial female-biased expression in otoliths, zona pellucida sperm-binding protein 4-like was notable for its high log2 intensity, as visualized in the heatmap (Figure 4) that showed ≥ 2-fold change in abundance between sexes with p-values ≤ 0.05. There is evidence that this protein, which is essential in forming the egg membrane and sperm–egg recognition, represents a key component of female fertilization [35]. In addition, the high presence of catenin (cadherin-associated protein), alpha 1, which is responsible for the conserved, calcium-dependent module crucial for cell–cell adhesion. Furthermore, it also plays a vital role in normal developmental processes and in maintaining tissue structure [36], which is likely related to its essential functions in reproductive processes.
Myosin heavy chain a is a key contractile protein of the muscular system, and its expression is often a reliable indicator of muscle development and growth. In Atlantic salmon, as in many other species, the mRNA expression levels of myosin heavy chain correlate with the muscle’s ability to grow and accrue protein rather than just increase in size [37]. It is expressed with a higher intensity in female otoliths, possibly indicating differences in muscle physiology or energy demands between the sexes (Figure 4). Tropomyosin alpha-1 chain-like is thought to be the master regulator of actin filament functions in the cytoskeleton. Coagulation factor XIII A chain-like protein (Figure 4) is important for blood coagulation and wound healing [38]. The vitellogenin-2-like proteins, a female marker, are phosphoglycolipoproteins synthesized in the livers of oviparous animals in response to circulating estrogens [17,39]. Serine/threonine-protein phosphatase is one of the key enzymes responsible for dephosphorylation in vertebrates involved in various cellular processes, including the cell cycle and signal transduction [40]. It also displayed varying expression levels, indicating potential differences in cell regulation. The expression of the XPG N-terminal domain-containing protein is a critical part of the XPG protein involved in DNA repair [41]. All these proteins display differential expression to support the unique physiological demands of females.

3.1.2. Otolith Proteins with Substantial Male-Biased Expression

Among the proteins with substantial male-biased expression, we identified protocadherin and protein-tyrosine-phosphatase (Figure 4). Protocadherins are cell adhesion molecules that belong to the cadherin superfamily and are expressed most prominently within the central nervous system, which suggests important neurobiological roles for these molecules [42]. A recent study suggested that genetic factors like protocadherins, which are expressed more in male cell lines, play a crucial role in the molecular basis of sex differences in the nervous system [43]. Protein-tyrosine-phosphatase is an enzyme that functions in a coordinated manner with protein tyrosine kinases to control signalling pathways that underlie a broad spectrum of fundamental physiological processes [44].
The plectstrin homology domain-containing protein, which is part of signal transduction in cells, exhibited a significant difference in expression, pointing to potential variances in cellular communication processes between genders [45]. Tubulin polymerization-promoting protein family member 3 is an intrinsically unstructured protein that induces tubulin polymerization [46]. It has a role in microtubule stabilization, cell division, and developmental processes [47]. Microtubule-associated protein 1Ab, comprising distantly related protein complexes with heavy and light chains, is believed to be involved in the regulation of the neuronal cytoskeleton [48]. Pleckstrin homology domain-containing family H (with MyTH4 Domain) member 2 is involved in crucial interactions with membranes and proteins, characterized by pleckstrin homology (PH) and MyTH4 domains crucial for cellular signalling. These domains aid in organizing the cytoskeleton, affecting cell shape, movement, and interactions between cell membranes and the cytoskeleton across various cellular activities [45]. These proteins’ high expression reflects their importance in supporting the cellular processes specific to male Atlantic cod.

3.2. Quantitative Analysis of the Total Protein Profile

The comprehensive proteomic analysis across several individuals (Table S2, Supplementary Excel sheet) yielded 802 proteins consistently found across all individuals (Table S4, Supplementary Excel sheet), 202 highly abundant that were more than 2-fold increased in females (Table S5, Supplementary Excel sheet), and 90 proteins highly abundant that were more than 2-fold increased in males (Table S6, Supplementary Excel sheet). Furthermore, we also identified 81 proteins common only to males (Table S7, Supplementary Excel sheet) and 196 common only to females (Table S8, Supplementary Excel sheet), with 92 proteins exclusive to one individual, defined by sex (Table S9, Supplementary Excel sheet), which need further investigation, including genetic analysis, to understand the underlying reasons behind their expression. Therefore, we highlighted five proteins present within all males that were unique to males with high abundance (Table 1), and nine proteins unique to females with high abundance (Table 2). Lastly, our shotgun analysis also uncovered 214 uncharacterized proteins (Table S10, Supplementary Excel sheet).

3.2.1. Identified Otolith Protein Profile Common in Both Sexes

Some common abundant protein families were quantified in both sexes. In this study, among the proteins recognized, actins, were ubiquitous between sexes. α-actins are found in muscle tissues and are a significant constituent of the contractile apparatus. Developmental stage-specific muscle protein isoforms have also been reported for several fish species during the development [49,50,51]. Sixteen proteins related to the actin family were detected in this study (Table S11, Supplementary Excel sheet).
In addition, we quantified tropomyosins, which are actin-binding proteins that play a crucial role in regulating the actin cytoskeleton and muscle contraction [49,52]. Six proteins (tropomyosin 1 (alpha), tropomyosin alpha-3 chain-like, tropomyosin 4a, tropomyosin alpha-1 chain-like, tropomyosin 3, tropomyosin 2 (beta)) were detected in this study (Table S12, Supplementary Excel sheet).
We also detected that the tubulin proteins, which are the principal component of microtubules, are a heterodimer of two closely related proteins, α- and β-tubulin [49,53]. α- and β-tubulin were detected in this study (Table S13, Supplementary Excel sheet).
Similarly, we detected that the tyrosine 3-monooxygenase/tryptophan activation protein β-polypeptide belongs to the 14–3–3 family and plays a critical role in signal transduction by attaching to proteins containing phosphoserine. These are involved in different cellular processes, including cell cycle progression, survival pathways, and metabolic regulation [49,54,55]. Three proteins (tyrosine 3-monooxygenase/tryptophan 5-monooxygenase activation protein, beta polypeptide a, tyrosine 3-monooxygenase/tryptophan 5-monooxygenase activation protein, eta polypeptide, and Tyrosine 3-monooxygenase/tryptophan 5-monooxygenase activation protein, theta polypeptide b) were detected in this study (Table S14, Supplementary Excel sheet).
The keratin proteins were consistently present across all individuals. Keratin proteins are ubiquitous and varied in their types between different age groups. Specifically, type II keratins were predominantly observed in the younger group, whereas type I keratins were more prevalent in the older group [49,56,57,58]. Both types were detected in our data (Table S15, Supplementary Excel sheet).

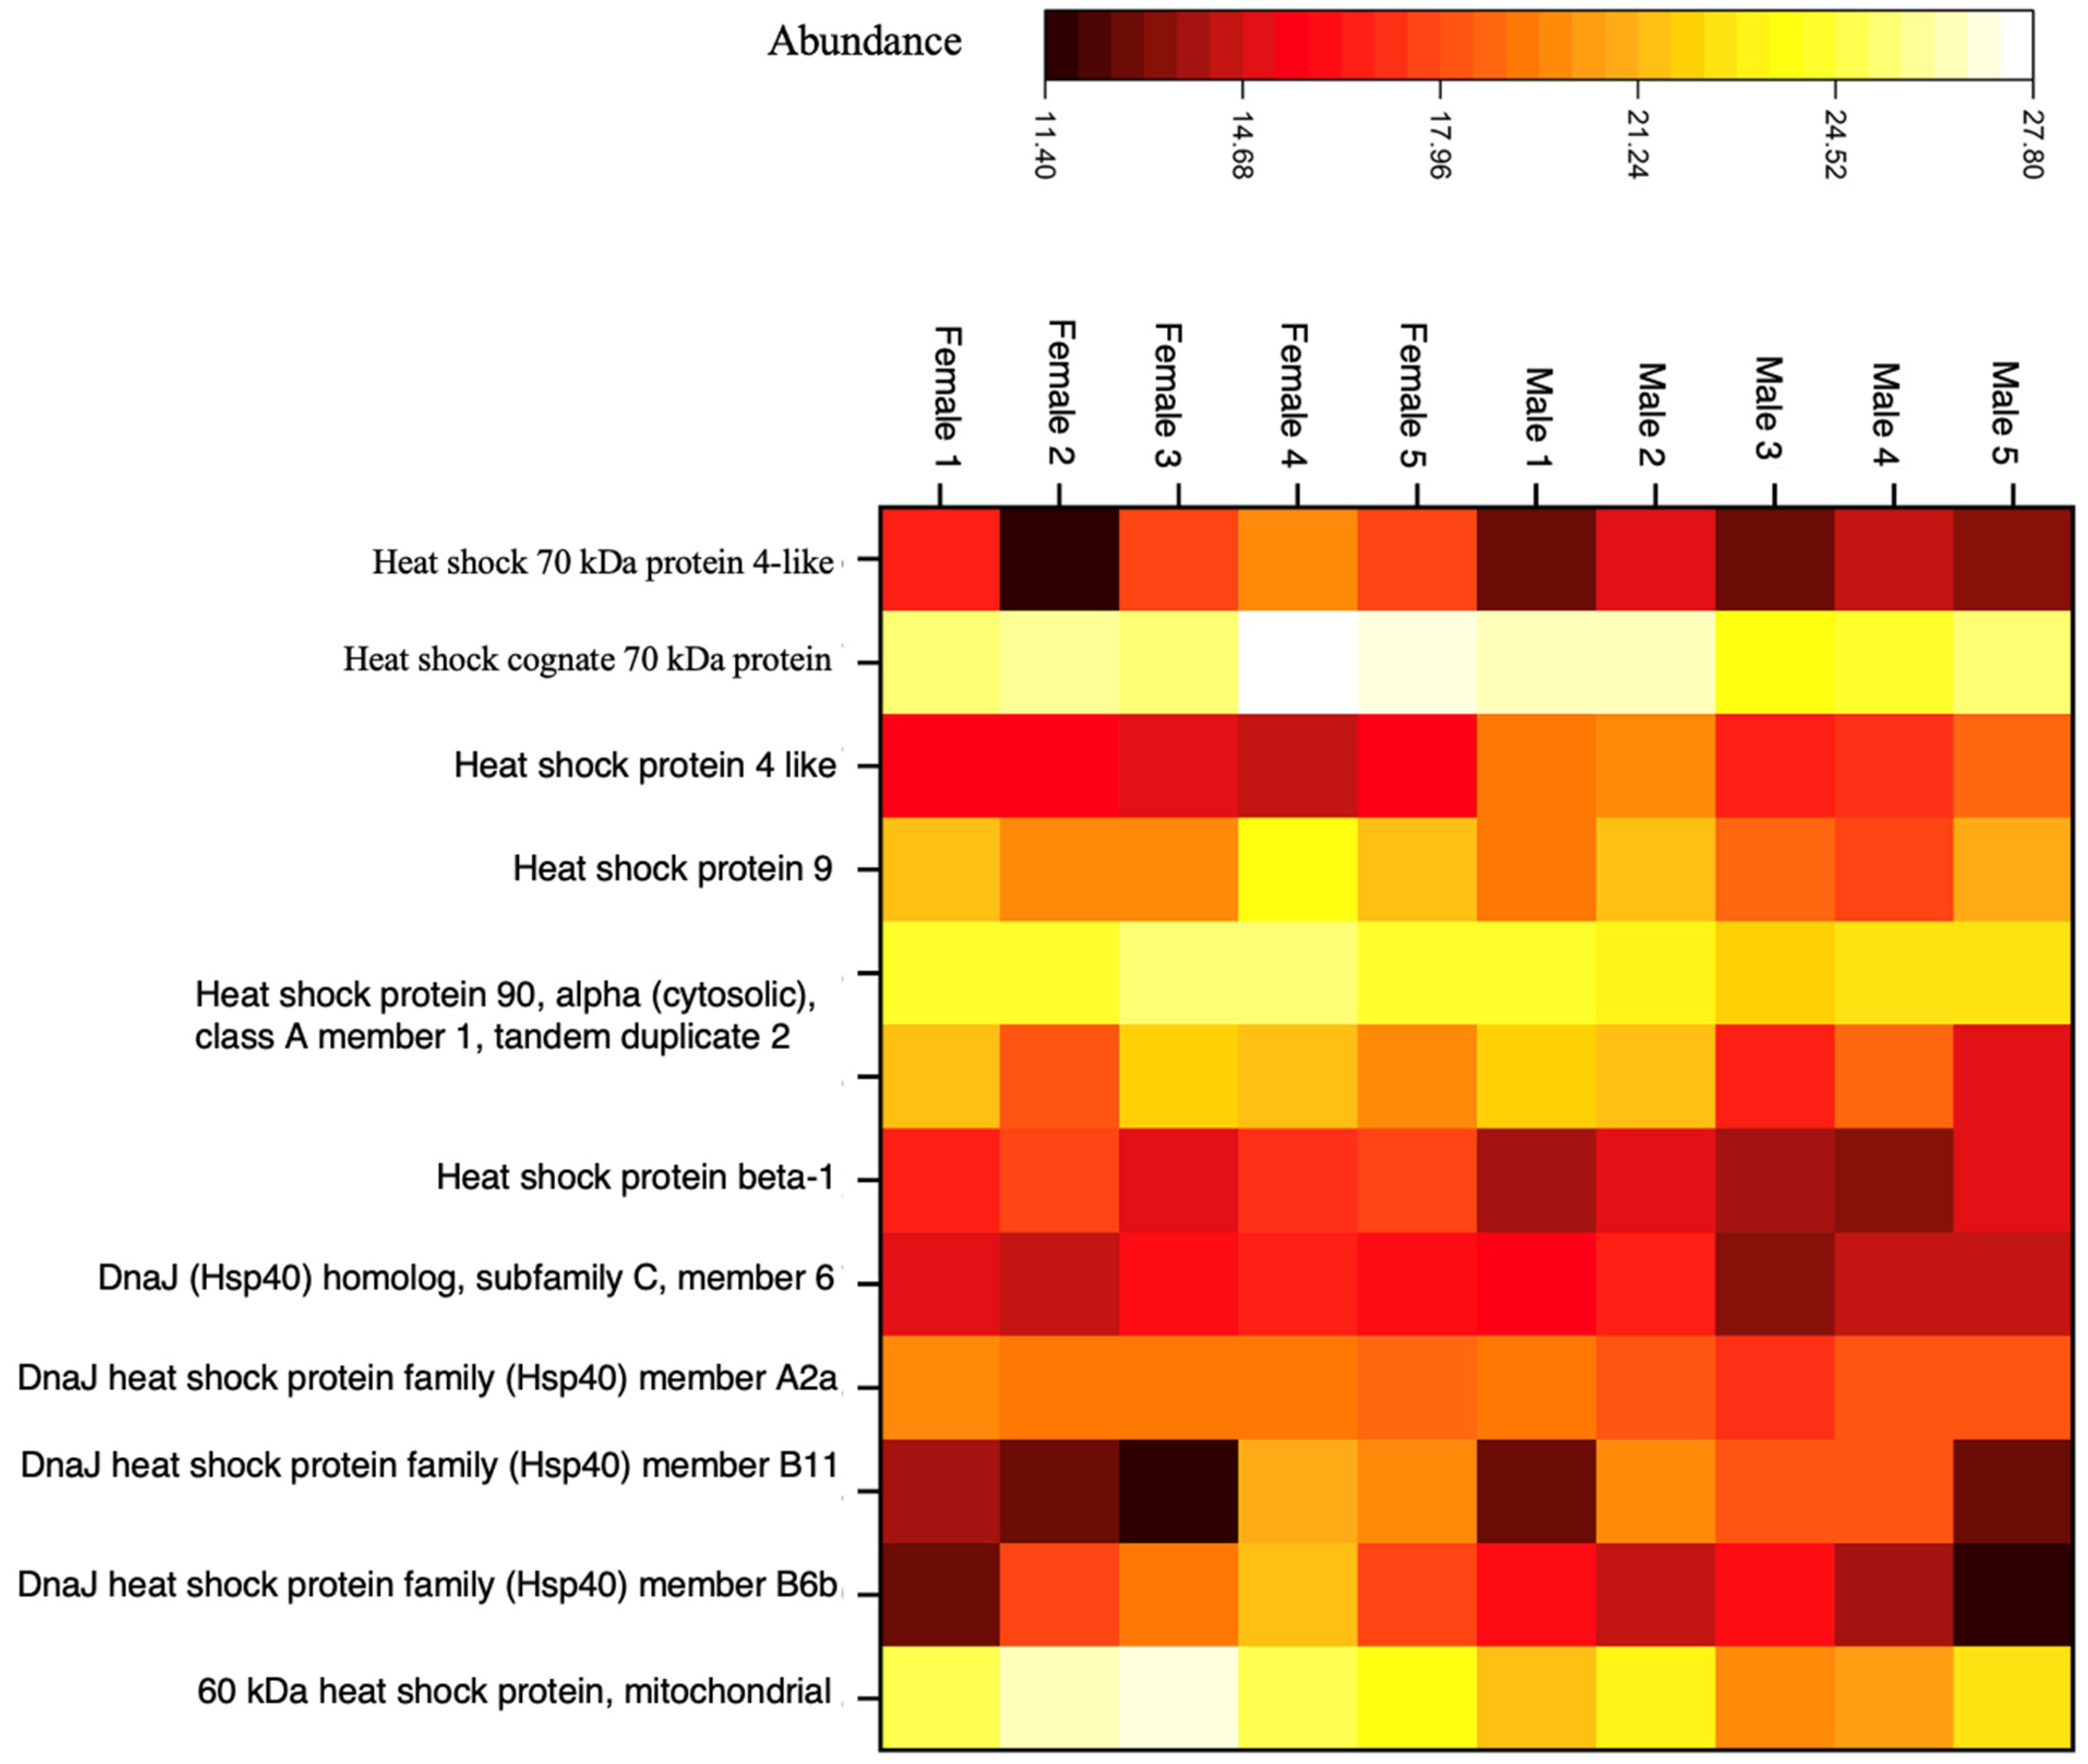
Otolith Heat Shock Proteins

HSPs are expressed in response to various types of stress. This includes thermal, anoxia, acidosis, hypoxia, exposure to toxins, intense protein breakdown, and microbial infections [59,60]. They are classified into five families based on molecular weight as well as domain structures and functions: Hsp110, Hsp90, Hsp70, Hsp60, Hsp40, Hsp10, and small HSP families [60,61]. We identified and quantified eleven proteins belonging to the Hsp90, Hsp70, Hsp60, and Hsp40 families, as shown in the heatmap (Figure 5) and listed in Table S16, Supplementary Excel sheet.
Hsp90 can suppress thermal aggregation and facilitate protein folding by reducing misfolding via interactions with aggregation-prone unfolding intermediates [60,62,63,64]. Hsp70 assists in folding newly synthesized polypeptides, refolding of misfolded proteins, protein transport across organelles, and degradation of proteins. This protein is essential for maintaining cellular protein homeostasis, especially under stress conditions [65,66]. HSP60 proteins play a critical role in regulating mitochondrial protein homeostasis. HSP60 has been primarily considered to reside in the mitochondria, where HSP60 and HSP10 form a complex and facilitate mitochondrial protein folding. Studies on channel catfish have shown that HSP60 is implicated in the immune response to bacterial infections, suggesting it may be crucial for disease defense in fish [60,67]. Hsp40 proteins specifically interact with Hsp70, regulating its activity by stimulating ATP hydrolysis, which is essential for the chaperone’s function in binding and releasing unfolded or misfolded protein substrates. This interaction is vital for maintaining cellular protein homeostasis, particularly under stress conditions that lead to protein damage [68].
As a result, HSPs are very crucial in maintaining cellular protein homeostasis through their chaperone functions. The presence of HSPs in both male and female fish reflects their fundamental role in cellular processes that are essential for the survival of all organisms, regardless of sex. These proteins are part of the cell’s response to stress, assisting in protein folding, repair, and protection against damage caused by various stressors. Consequently, they play a crucial role in protecting the cod from the harmful effects of stress. [69,70,71,72,73,74,75,76]. Therefore, we predict that the presence of the eleven detected HSP chaperone proteins in our otolith samples could indicate climate change impacts.

Identification of Otolith Protein Bioindicators of Endocrine Disruptors

As mentioned in Section 3.1, a notable finding is the presence of vitellogenin-2-like protein, which directs egg development, showing a marked increase in abundance (193.2) in all female quantitative measurements [39]. However, its presence, albeit in lower abundance in males (38.1), indicates potential exposure to exogenous estrogens or estrogen mimics in aquatic environments [77,78,79,80]. This has been confirmed by previous studies of vitellogenin-2-like plasma levels in male vertebrates exposed to certain xenobiotic endocrine disruptors with estrogen-mimicking activity [81,82,83,84].
The zona pellucida sperm binding protein, which shows a focal role in the oocyte and gamete development, is the main predictor of fertilization capacity. Although the zona pellucida sperm binding protein-specific marker is present in higher abundance in females (192.4), it was also detected in males in low abundance (7.6) [79,80]. We speculate that the presence of vitellogenin-2-like protein and the zona pellucida sperm-binding protein in males is due to exposure to endocrine disruptors.

3.3. Bioinformatics Analyses

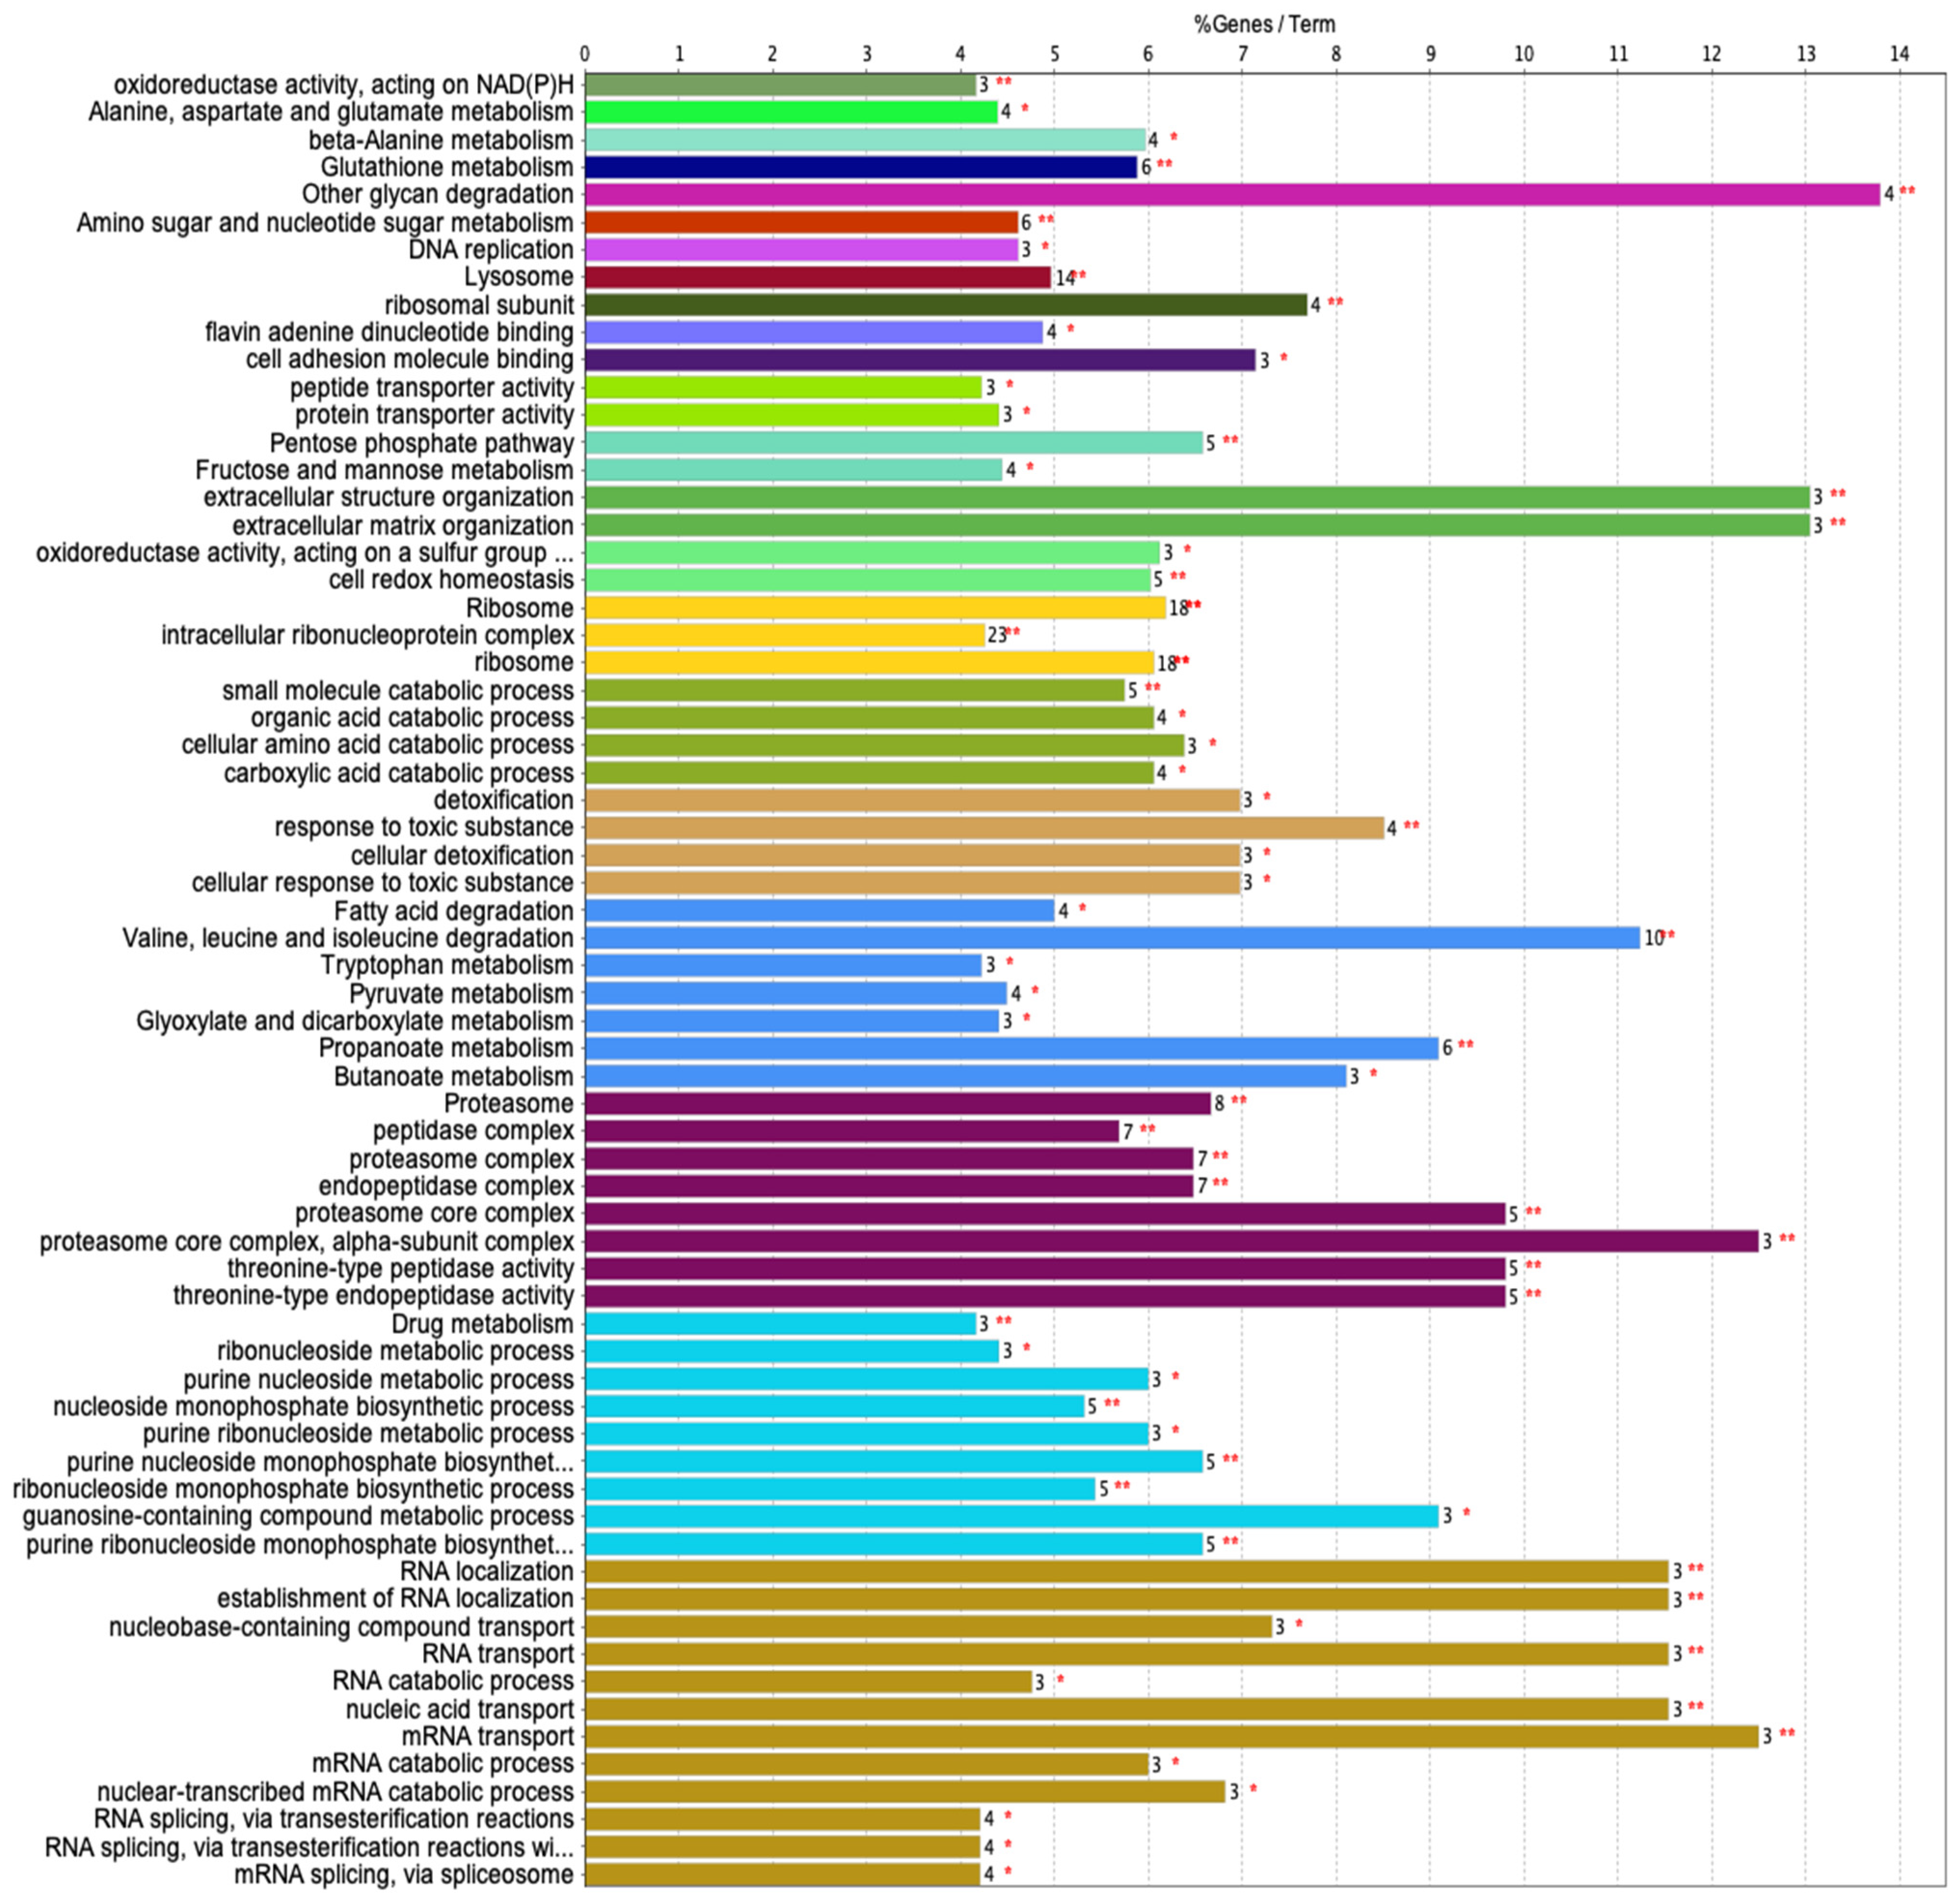
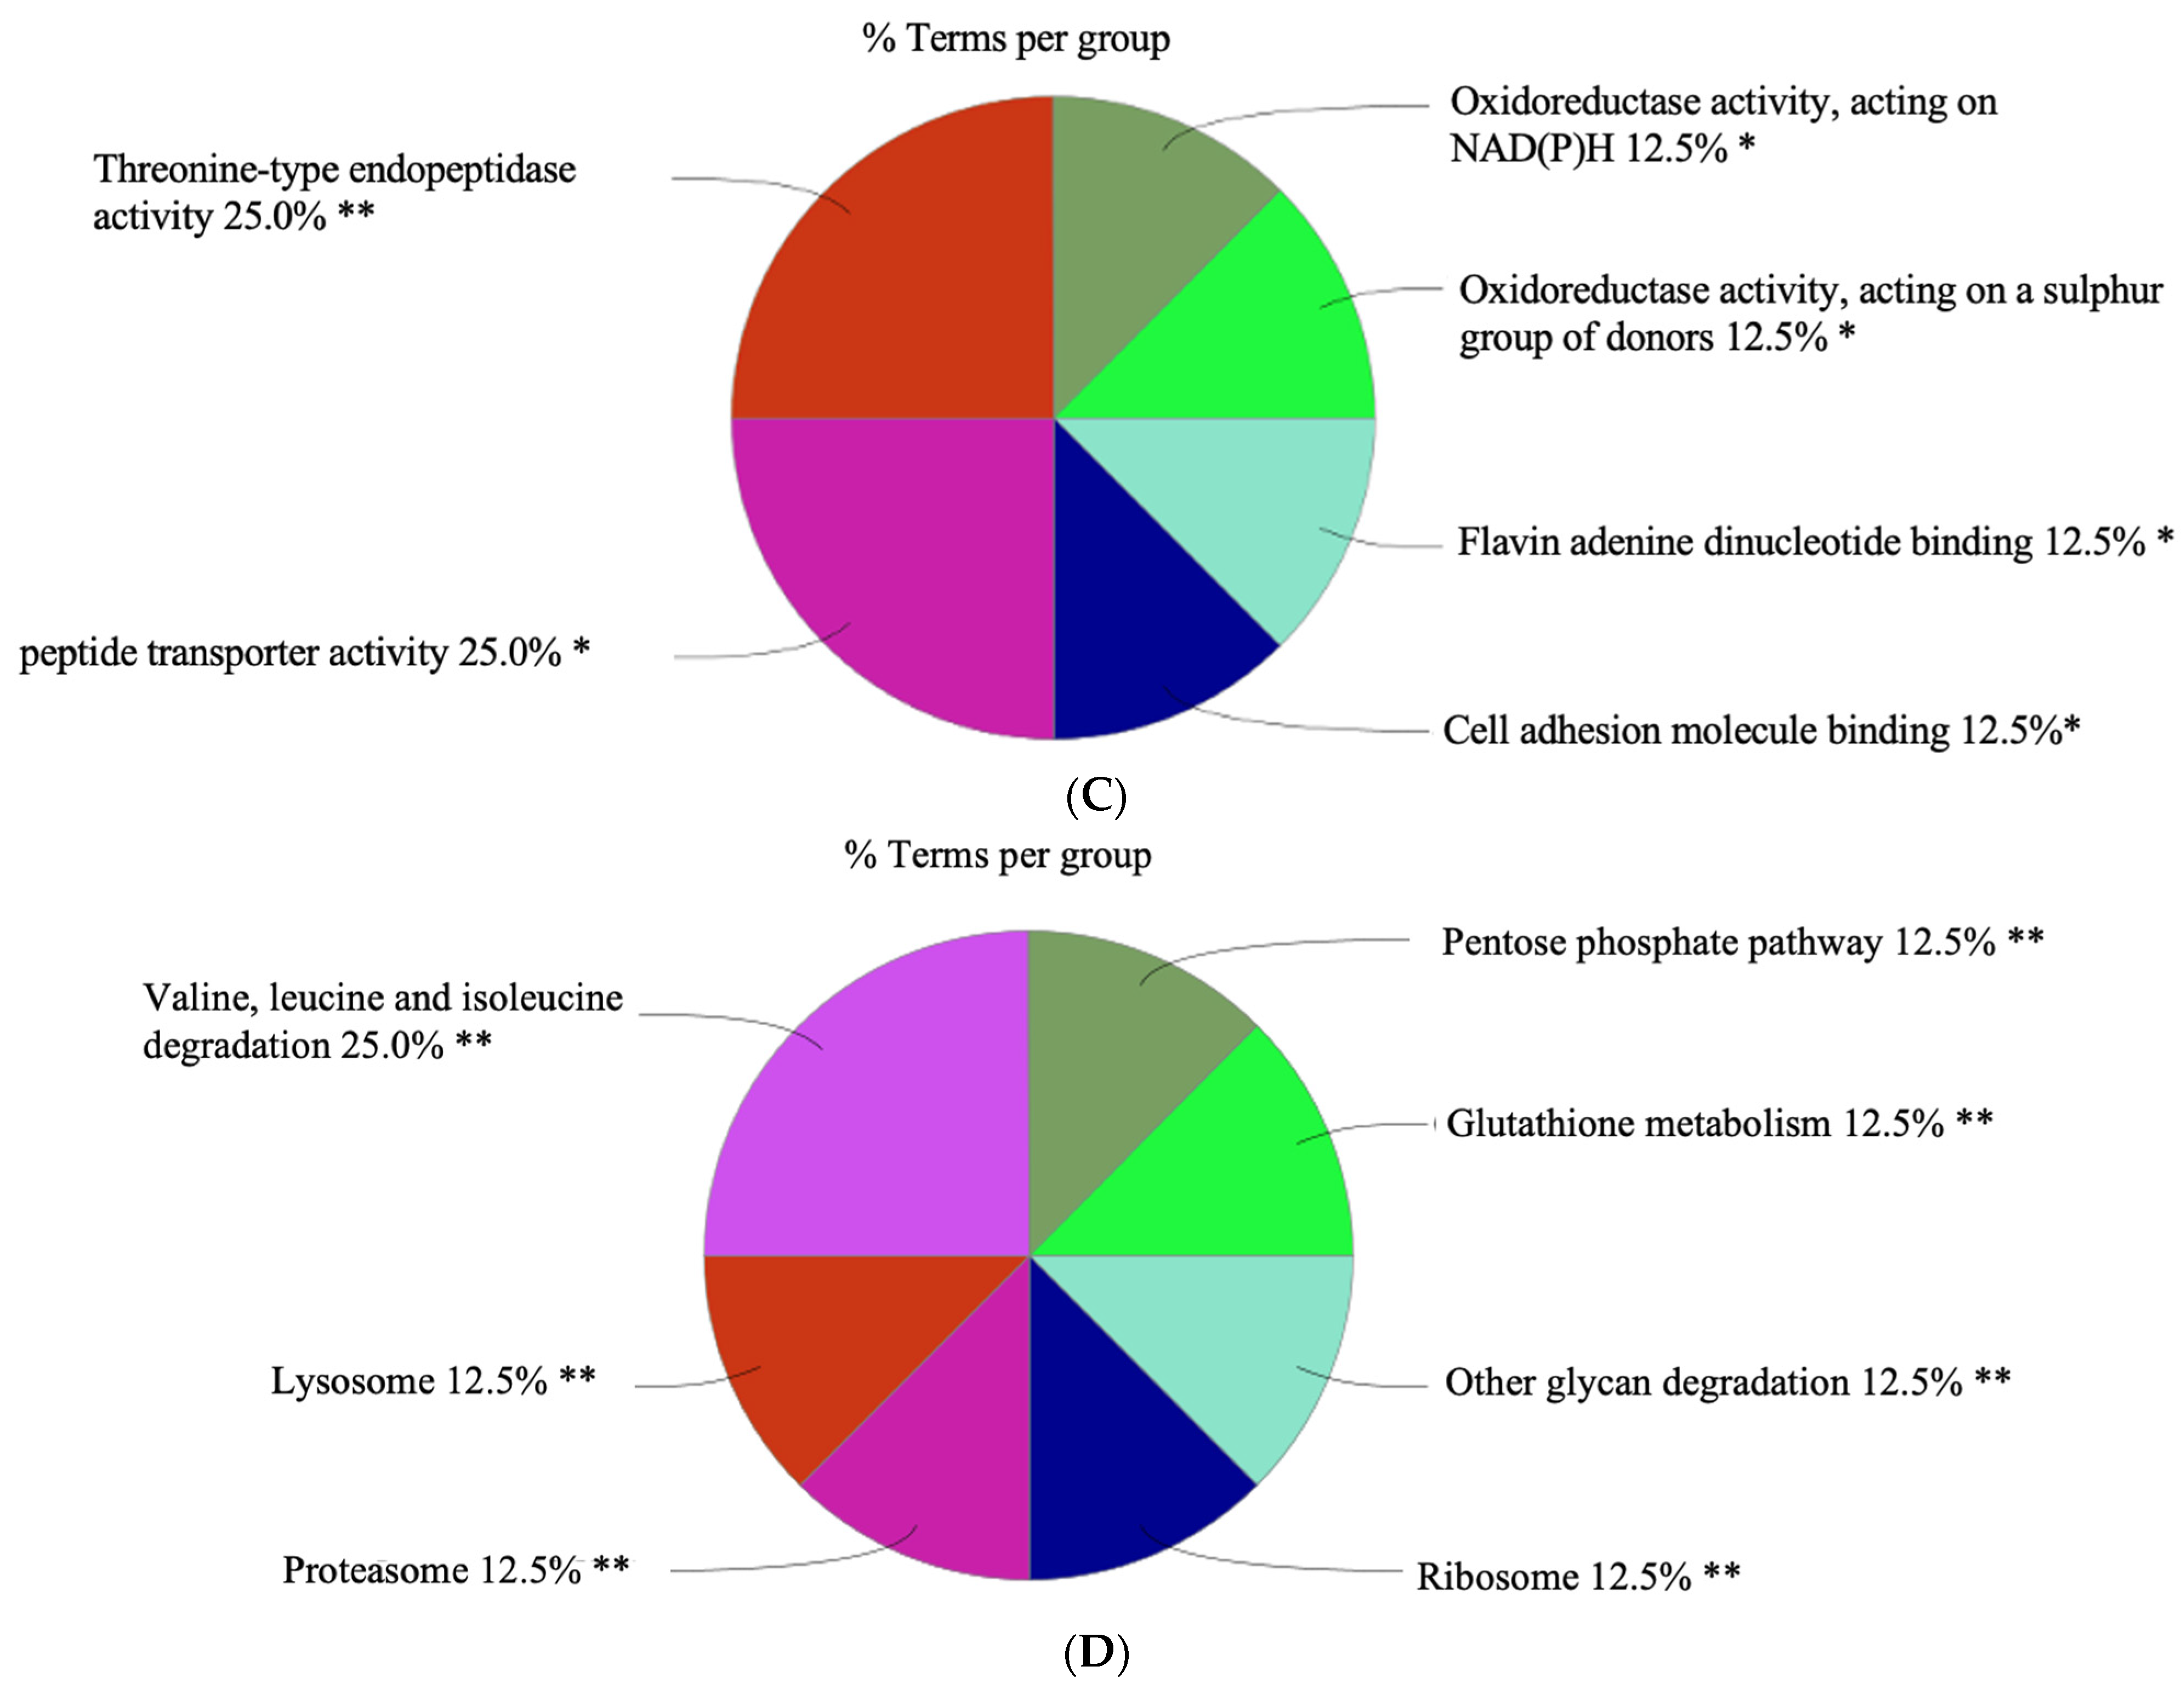
3.3.1. Gene Ontology (GO)

Next, we analyzed the proteins in both males and females based on annotated functions. Out of 1416 gene symbols, 328 genes had associated annotations from both sexes. We provide a conclusion chart (Figure 6), showing the visualization representing the number of genes associated with specific terms and functional groups.
A large portion of the biological function identified is mRNA transport (38.71%) (Figure 7A), [85]. The next most common biological process is the purine nucleoside monophosphate biosynthetic process (25.81%) [86].
A large portion of the cellular components (Figure 7B) is composed of genes that encode proteins associated with the proteasome complex (62.5%) [87]. Genes associated with the ribosomal subunits (12.5%) are critical for protein translation [88]. The smallest slice shown represents genes linked to intracellular ribonucleoprotein complexes (2.5%), which are involved in gene transcription [89].
A significant portion of the molecular functions of the proteins (Figure 7C) are associated with threonine-type endopeptidases (25.0%). Enzymes are vital in breaking down proteins by cutting internal peptide bonds in polypeptide chains. Another quarter of the genes is involved in the transport of peptides across cellular membranes. Oxidoreductase activity, acting on NAD(P)H (12.5%) and oxidoreductase activity, acting on a sulphur group of donors (12.5%); each category accounts for an equal proportion of the genes and indicates a significant role for oxidoreductase enzymes. Flavin adenine dinucleotide (FAD) binding (12.5%), this group of genes is associated with binding FAD, a cofactor involved in key metabolites for the maintenance of life and is involved in a wide range of physiological processes [90]. Cell adhesion molecule binding comprises 12.5%.
A significant proportion of proteins is involved in the catabolism of branched-chain amino acids (valine, leucine, and isoleucine) (25.0%) (Figure 7D), which not only act as building blocks for tissue protein (accounting for 35% of the essential amino acids in muscle), but also have other metabolic functions [91]. Lysosomes (12.5%), genes associated with lysosomal function, suggest involvement in degrading and recycling cellular waste, cellular signalling, and energy metabolism [92,93]. Proteasome (12.5%) indicates a notable representation of genes involved in the proteasome pathway, which is critical for the cell cycle, cell survival, and cellular homeostasis [94]. Pentose phosphate pathway (12.5%), a significant number of genes are involved in this pathway, which is crucial for nucleotide synthesis and the generation of NADPH for reductive biosynthesis [95]. Glutathione metabolism (12.5%) reflects genes involved in the synthesis and metabolism of glutathione, a major antioxidant that is critical in the regulation of the redox state of cells [96]. Glycan degradation (12.5%) genes are associated with the degradation of various glycans, complex carbohydrates that play major metabolic, structural, and physical roles in biological systems [97]. The ribosome comprises 2.5%, and a portion of the genes is related to the ribosome, indicating the importance of protein synthesis machinery in the cell [98].

3.3.2. Protein–Protein Interaction (PPI) Analysis

Our research used the STRING database to construct a comprehensive map of the PPI of the common otolith proteins within the Gadus morhua, listed in Table S17, Supplementary Excel sheet. This network elucidates potential key proteins in Atlantic cod biological processes and predicted PPIs, substantiated by evidence such as genetic co-occurrence and experimental validations [99]. Due to the complexity of our dataset, this study will focus on the top 20 proteins with the highest score, suggesting robust evidence from multiple sources, including experimental data and literature support [100] (Figure 8).
Key proteins identified include structural proteins such as Actin and Alpha Cardiac and enzymatic proteins like Citrate synthase and Glyceraldehyde-3-phosphate dehydrogenase (Table S18, Supplementary Excel Sheet). The category of ribosomal proteins includes Ribosomal protein S14 and Ribosomal protein L4. Additionally, signalling proteins like RAN binding protein 2, and heat shock proteins like Heat shock protein 9. Lastly, proteins such as the Eukaryotic translation elongation factor 2 are involved in the translation process.
This analysis enriches functional proteomic research in Gadus morhua and illustrates the potential to chronicle the extensive protein interactions that underpin vital physiological processes.

4. Conclusions and Future Directions

We have shown in this study the presence of five proteins within all males that represent uniqueness to males and nine proteins unique to females. In addition, 802 proteins were consistently found across all individuals.
In 2019, the bottom temperatures in NAFO Subarea 3K were significantly above normal, reflecting the broader impacts of global warming. The fall bottom temperatures in Subarea 3K were recorded to be between +0.5 °C and +2.5 °C above the long-term average of around 4 °C, marking a return to warmer anomalies not seen since 2011 [101,102,103]. This warming trend is consistent with the global patterns of ocean warming due to climate change [104]. Temperature variations in aquaculture environments can be substantial and can approach the upper critical thermal limits of 8–12 °C for Atlantic cod, which are lethal. These shifts can occur quickly, such as an ~8 °C increase in less than 12 h during thermocline inversions, particularly at depths where Atlantic cod tend to gather (≥5 m) [69,70]. Fish are unable to escape temperature fluctuations, inevitably facing stressful environments completely. This thermal stress profoundly affects gene transcription, targeting genes linked to oxidative stress response, apoptosis, protein folding, energy metabolism, synthesis, membrane fluidity, and immune functions [69,70,71,72,73,74,75,76]. The proteins encoded by these genes include some of the elements that regulate both the organismal and cellular stress responses. As a result, HSPs play a crucial role in protecting the fish against the deleterious effects of stress [69,70,71,72,73,74,75,76]. This is why we predict that the eleven HSP chaperone proteins detected in otolith could be an indicator of climate change (Table S19, Supplementary Excel sheet); however, this needs to be empirically determined.
Recent studies have brought to light significant evidence regarding the stress conditions in fish, focusing on the impact of endocrine-disrupting chemicals (EDCs), treated sewage, and other environmental factors [77,78]. This was discussed in the otolith’s proteins of egg yolk precursors section. Although the zona pellucida sperm-binding protein-specific marker is present in higher abundance in females, it was also detected in males [79,80]. Likewise, environmental effluence and exposure to EDCs and other contaminants can be likely factors contributing to these observations [77,78,79,80].
Further comprehensive research is needed to elucidate the full range of influences that are central to the alteration of sex markers in fish, ensuring that we consider all possible sources of stress, whether they are pollutants or other environmental variables. This evidence collectively indicates a significant stress response in fish to environmental pollutants, warranting further investigation into the mechanisms of action and long-term consequences of these exposures on aquatic life. It is also vital to conduct further studies on the PPIs and their functional overlaps, to explore their evolutionary significance.
Finally, this study employs a quantitative shotgun proteomics approach and bioinformatic analysis to discover the unidentified proteins present in cod otoliths. Our results show that diverse proteins are stored in otolith that were accumulated, thereby enabling the discernment of both differences and similarities across protein profiles between sexes. We speculate that circulating proteins released by various cells in the body into the endolymph are captured by the otolith. In the future, we will explore the prospect of monitoring the growth of the fish by investigating the proteins present in each separate concentric layer of the otolith matrix.
In conclusion, this study suggests a broader applicative potential of otolith proteomics in marine research. By transcending traditional views of otoliths solely as chronometers, this study illuminates their capacity to provide invaluable insights into the proteomic profiles reflective of varying life stages and environmental interactions of cod. Despite these advances, our understanding of the otolith proteome remains nascent, with much terrain still to explore. Future endeavours will focus on comparing protein profiles of otoliths from different NAFO zones, trip, and depths. In the future, we plan to monitor the growth protein of the fish by investigating the presence of the protein concentric layers of the otolith matrix to follow the growth of the fish from embryo to adult. Such comparisons will be expected to substantially enrich our comprehension of the otolith proteome, opening new avenues for research and offering profound implications for marine and environmental science.

Supplementary Materials

The following supporting information can be downloaded at: https://www.mdpi.com/article/10.3390/biochem4020008/s1, Table S1: Overview of sample used in the current study.; Table S2 (1): 10 Otolith protein; Table S2 (2). 10 Otolith protein with protein sequences (Full data). Table S3: Volcano Plot; Table S4: 802 Proteins are always common between individuals.; Table S5: 202 Highly abundance proteins for female; Table S6: 90 Highly abundance proteins for males; Table S7: 81 Proteins Present in ≥X Males and zero females; Table S8: 196 Proteins Present in ≥X Males and zero females; Table S9: 92 Proteins identified in individual, either male or female; Table S10: 214 Uncharacterized proteins identified in our dataset.; Table S11: Sixteen proteins related to the actin family identified in this study; Table S12: Six proteins related to tropomyosins identified in this study; Table S13: α- and β-Tubulin identified in this study; Table S14: Three proteins related to the 14–3–3 family identified in this study; Table S15: Both keratin proteins types identified in our data; Table S16: List of heat-shocked proteins identified in our study; Table S17: The full Protein-Protein Interaction- STRING network in Figure S1.; Table S18: Top 20 in network ranked by Degree method; Figure S1: The full Protein-Protein Interaction- STRING network.

Author Contributions

Conceptualization, J.B., T.N.Y., R.R. and A.A.; methodology, J.B., S.L.C., P.T. and T.N.Y.; formal analysis, J.B., S.L.C., T.N.Y., P.T. and E.B.; writing—original draft preparation, J.B. and T.N.Y.; writing—review and editing, S.L.C., P.T., T.D.F., R.R., A.A. and T.D.F.; funding acquisition, J.B. and T.D.F. All authors have read and agreed to the published version of the manuscript.

Funding

This research received funding from DFO and MUN. Title—Protein Extractions of Atlantic Cod Otoliths. Contract No.—4500008253. Destination of Goods and Services: Fisheries and Oceans, Northwest Atlantic Fisheries Centre, East White Hills Road, A1C 5X1, St. John’s, NL. Currency—CAD.

Institutional Review Board Statement

Not applicable.

Informed Consent Statement

Not applicable.

Data Availability Statement

The data presented in this study are available in the Supplementary Materials.

Acknowledgments

The authors would like to thank Atef Mansour, DFO NL. Science Branch, for his continuing encouragement and for providing financial support for this proteomics project. The particular otoliths used in this study were collected as part of the sentinel cod sampling program.

Conflicts of Interest

The authors declare no conflicts of interest.

References

  1. Norin, T.; Canada, P.; Bailey, J.A.; Gamperl, A.K. Thermal biology and swimming performance of Atlantic cod (Gadus morhua) and haddock (Melanogrammus aeglefinus). PeerJ 2019, 7, e7784. [Google Scholar] [CrossRef]
  2. Pinhorn, A.T. Fishery and biology of Atlantic cod (Gadus morhua) off the Southwest coast of Newfoundland. J. Fish. Res. Board. Can. 1969, 26, 3133–3164. [Google Scholar] [CrossRef]
  3. Meidell, L.S.; Carvajal, A.K.; Rustad, T.; Falch, E. Upgrading marine oils from cod (Gadus morhua) on-board the deep-sea vessels-from waste to value. Foods 2023, 12, 1659. [Google Scholar] [CrossRef]
  4. Hawkins, A.D.; Popper, A.N. Sound detection by Atlantic cod: An overview. J. Acoust. Soc. Am. 2020, 148, 3027. [Google Scholar] [CrossRef]
  5. Dauphin, Y.; Dufour, E. Composition and properties of the soluble organic matrix of the otolith of a marine fish: Gadus morhua Linne, 1758 (Teleostei, Gadidae). Comp. Biochem. Physiol. A Mol. Integr. Physiol. 2003, 134, 551–561. [Google Scholar] [CrossRef]
  6. Murayama, E.; Takagi, Y.; Ohira, T.; Davis, J.G.; Greene, M.I.; Nagasawa, H. Fish otolith contains a unique structural protein, otolin-1. Eur. J. Biochem. 2002, 269, 688–696. [Google Scholar] [CrossRef]
  7. Lewis, L.S.; Huang, J.L.; Willmes, M.; Fichman, R.A.; Hung, T.-C.; Ellison, L.T.; Stevenson, T.A.; Teh, S.J.; Hammock, B.G.; Schultz, A.A.; et al. Visual, spectral, and microchemical quantification of crystalline anomalies in otoliths of wild and cultured delta smelt. Sci. Rep. 2022, 12, 1–12. [Google Scholar]
  8. Degens, E.T.; Deuser, W.G.; Haedrich, R.L. Molecular structure and composition of fish otoliths. Mar. Biol. 1969, 2, 105–113. [Google Scholar] [CrossRef]
  9. Payan, P.; De Pontual, H.; Bœuf, G.; Mayer-Gostan, N. Endolymph chemistry and otolith growth in fish. Comptes Rendus. Palevol. 2004, 3, 535–547. [Google Scholar] [CrossRef]
  10. Ferri, J. Otoliths and Their Applications in Fishery Science. Fishes 2023, 8, 35. [Google Scholar] [CrossRef]
  11. Smolinski, S.; Deplanque-Lasserre, J.; Hjorleifsson, E.; Geffen, A.J.; Godiksen, J.A.; Campana, S.E. Century-long cod otolith biochronology reveals individual growth plasticity in response to temperature. Sci. Rep. 2020, 10, 16708. [Google Scholar] [CrossRef]
  12. Smoliński, S.; Mirny, Z. Otolith biochronology as an indicator of marine fish responses to hydroclimatic conditions and ecosystem regime shifts. Ecol. Indic. 2017, 79, 286–294. [Google Scholar] [CrossRef]
  13. D’Iglio, C.; Albano, M.; Famulari, S.; Savoca, S.; Panarello, G.; Di Paola, D.; Perdichizzi, A.; Rinelli, P.; Lanteri, G.; Spano, N.; et al. Intra- and interspecific variability among congeneric Pagellus otoliths. Sci. Rep. 2021, 11, 16315. [Google Scholar] [CrossRef]
  14. Santos, L.; Vaz-dos-Santos, A.M. Insights of otoliths morphology to reveal patterns of Teleostean fishes in the southern Atlantic. Fishes 2022, 8, 21. [Google Scholar] [CrossRef]
  15. Lundberg, Y.W.; Xu, Y.; Thiessen, K.D.; Kramer, K.L. Mechanisms of otoconia and otolith development. Dev. Dyn. 2015, 244, 239–253. [Google Scholar] [CrossRef]
  16. Serre, S.H.; Nielsen, K.E.; Thomsen, T.B.; Hüssy, K. Analysis of cod otolith microchemistry by continuous line transects using LA-ICP-MS. Geol. Surv. Den. Greenl. Bull. 2018, 41, 91–94. [Google Scholar] [CrossRef]
  17. Rideout, R.M.; Youssef, T.N.; Adamack, A.T.; John, R.; Cohen, A.M.; Fridgen, T.D.; Banoub, J.H. Qualitative shotgun proteomics strategy for protein expression profiling of fish otoliths. BioChem 2023, 3, 102–117. [Google Scholar] [CrossRef]
  18. Campana, S.E. Chemistry and composition of fish otoliths:pathways, mechanisms and applications. Mar. Ecol. Prog. Ser. 1999, 188, 263–297. [Google Scholar] [CrossRef]
  19. Thomas, O.R.B.B.; Swearer, S.E.; Kapp, E.A.; Peng, P.; Tonkin-Hill, G.Q.; Papenfuss, A.; Roberts, A.; Bernard, P.; Roberts, B.R.; Tonkin-Hill, G.Q.; et al. The inner ear proteome of fish. FEBS J. 2019, 286, 66–81. [Google Scholar] [CrossRef]
  20. Huang, S.; Qian, S. Advances in otolith-related protein research. Front. Neurosci. 2022, 16, 1–9. [Google Scholar]
  21. Bielak, K.; Benkowska-Biernacka, D.; Ptak, M.; Stolarski, J.; Kalka, M.; Ozyhar, A.; Dobryszycki, P. Otolin-1, an otolith- and otoconia-related protein, controls calcium carbonate bioinspired mineralization. Biochim. Biophys. Acta Gen. Subj. 2023, 1867, 130327. [Google Scholar] [CrossRef]
  22. Zhang, Y.; Fonslow, B.R.; Shan, B.; Baek, M.C.; Yates, J.R., 3rd. Protein analysis by shotgun/bottom-up proteomics. Chem. Rev. 2013, 113, 2343–2394. [Google Scholar] [CrossRef]
  23. Wolters, D.A.; Washburn, M.P.; Yates, J.R. An automated multidimensional protein identification technology for shotgun proteomics. Anal. Chem. 2001, 73, 5683–5690. [Google Scholar] [CrossRef]
  24. Yates, J.R., 3rd. Mass spectral analysis in proteomics. Annu. Rev. Biophys. Biomol. Struct. 2004, 33, 297–316. [Google Scholar] [CrossRef]
  25. Link, A.J.; Eng, J.; Schieltz, D.M.; Carmack, E.; Mize, G.J.; Morris, D.R.; Garvik, B.M.; Yates, J.R., 3rd. Direct analysis of protein complexes using mass spectrometry. Nat. Biotechnol. 1999, 17, 676–682. [Google Scholar] [CrossRef]
  26. Yates, J.R., 3rd. Mass spectrometry and the age of the proteome. J. Mass. Spectrom. 1998, 33, 1–19. [Google Scholar] [CrossRef]
  27. Banoub, J.H.; Youssef, T.; Mikhael, A.; Mikhae, A. Proteomic technology applications for fisheries. Tech. Report. Fish. Aquat. Sci. 2022, 3465, xi + 668 p. [Google Scholar]
  28. Valikangas, T.; Suomi, T.; Elo, L.L. A systematic evaluation of normalization methods in quantitative label-free proteomics. Brief. Bioinform. 2018, 19, 1–11. [Google Scholar] [CrossRef]
  29. Wickham, H.; Henry, L. tidyr: Tidy Messy Data. R Package Version 1.1.3. 2021. Available online: https://CRAN.R-project.org/package=tidyr (accessed on 14 May 2024).
  30. Bache, S.M.; Wickham, H. magrittr: A Forward-Pipe Operator for R. R Package Version 2.0.1. 2021. Available online: https://CRAN.R-project.org/package=magrittr (accessed on 14 May 2024).
  31. Wickham, H. The Split-Apply-Combine Strategy for Data Analysis. J. Stat. Softw. 2011, 40, 1–29. [Google Scholar] [CrossRef]
  32. Wickham, H.; François, R.; Henry, L.; Müller, K. dplyr: A Grammar of Data Manipulation. R Package Version 1.1.4. 2023. Available online: https://github.com/tidyverse/dplyr (accessed on 14 May 2024).
  33. Hadley, W. ggplot2: Elegant Graphics for Data Analysis; Springer: New York, NY, USA, 2016. [Google Scholar]
  34. Tomanek, L. Variation in the heat shock response and its implication for predicting the effect of global climate change on species’ biogeographical distribution ranges and metabolic costs. J. Exp. Biol. 2010, 213, 971–979. [Google Scholar] [CrossRef]
  35. Litscher, E.S.; Wassarman, P.M. The fish egg’s zona pellucida. Curr. Top. Dev. Biol. 2018, 130, 275–305. [Google Scholar]
  36. Nathaniel Clarke, D.; Lowe, C.J.; James Nelson, W. The cadherin-catenin complex is necessary for cell adhesion and embryogenesis in Nematostella vectensis. Dev. Biol. 2019, 447, 170–181. [Google Scholar] [CrossRef]
  37. Hevrøy, E.M.; Jordal, A.E.O.; Hordvik, I.; Espe, M.; Hemre, G.I.; Olsvik, P.A. Myosin heavy chain mRNA expression correlates higher with muscle protein accretion than growth in Atlantic salmon, Salmo salar. Aquaculture 2006, 252, 453–461. [Google Scholar] [CrossRef]
  38. Casas, L.; Saborido-Rey, F.; Ryu, T.; Michell, C.; Ravasi, T.; Irigoien, X. Sex change in Clownfish: Molecular insights from transcriptome analysis. Sci. Rep. 2016, 6, 35461. [Google Scholar] [CrossRef]
  39. Cohen, A.M.; Mansour, A.A.H.; Banoub, J.H. ‘De novo’ sequencing of Atlantic cod vitellogenin tryptic peptides by matrix-assisted laser desorption/ionization quadrupole time-of-flight tandem mass spectrometry: Similarities with haddock vitellogenin. Rapid Commun. Mass. Spectrom. 2005, 19, 2454–2460. [Google Scholar] [CrossRef]
  40. Liu, W.B.; Yan, Q.; Liu, F.Y.; Tang, X.C.; Chen, H.G.; Liu, J.; Nie, L.; Zhang, X.W.; Ji, W.K.; Hu, X.H.; et al. Protein serine/threonine phosphotase-1 is essential in governing normal development of vertebrate eye. Curr. Mol. Med. 2012, 12, 1361–1371. [Google Scholar] [CrossRef]
  41. Schärer, O.D. XPG: Its Products and Biological Roles. In Molecular Mechanisms of Xeroderma Pigmentosum; Advances in Experimental Medicine and Biology; Springer: New York, NY, USA, 2009; pp. 83–92. [Google Scholar]
  42. Pancho, A.; Aerts, T.; Mitsogiannis, M.D.; Seuntjens, E. Protocadherins at the crossroad of signaling pathways. Front. Mol. Neurosci. 2020, 13, 117. [Google Scholar] [CrossRef]
  43. Pottmeier, P.; Nikolantonaki, D.; Lanner, F.; Peuckert, C.; Jazin, E. Sex-biased gene expression during neural differentiation of human embryonic stem cells. Front. Cell Dev. Biol. 2024, 12, 1341373. [Google Scholar] [CrossRef]
  44. Tonks, N.K. Protein tyrosine phosphatases: From genes, to function, to disease. Nat. Rev. Mol. Cell Biol. 2006, 7, 833–846. [Google Scholar] [CrossRef]
  45. Lenoir, M.; Kufareva, I.; Abagyan, R.; Overduin, M. Membrane and protein interactions of the Pleckstrin homology domain superfamily. Membr. 2015, 5, 646–663. [Google Scholar] [CrossRef]
  46. Staverosky, J.A.; Pryce, B.A.; Watson, S.S.; Schweitzer, R. Tubulin polymerization-promoting protein family member 3, Tppp3, is a specific marker of the differentiating tendon sheath and synovial joints. Dev. Dyn. 2009, 238, 685–692. [Google Scholar] [CrossRef]
  47. Orosz, F. On the tubulin polymerization promoting proteins of zebrafish. Biochem. Biophys. Res. Commun. 2015, 457, 267–272. [Google Scholar] [CrossRef]
  48. Noiges, R.; Eichinger, R.; Kutschera, W.; Fischer, I.; Nemeth, Z.; Wiche, G.; Propst, F. Microtubule-associated protein 1A (MAP1A) and MAP1B: Light chains determine distinct functional properties. J. Neurosci. 2002, 22, 2106–2114. [Google Scholar] [CrossRef]
  49. Sveinsdóttir, H.; Vilhelmsson, O.; Gudmundsdóttir, Á. Proteome analysis of abundant proteins in two age groups of early Atlantic cod (Gadus morhua) larvae. Comp. Biochem. Physiol. Part. D Genom. Proteom. 2008, 3, 243–250. [Google Scholar] [CrossRef]
  50. Focant, B.; Huriaux, F.; Baras, E.; Vandewalle, P. Expression of myofibrillar proteins and parvalbumin isoforms in white muscle of the developing turbot Scophthalmus maximus (Pisces, Pleuronectiformes). Basic. Appl. Myol. 2000, 10, 269–278. [Google Scholar]
  51. Huriaux, F.; Baras, E.; Vandewalle, P.; Focant, B. Expression of myofibrillar proteins and parvalbumin isoforms in white muscle of dorada during development. J. Fish. Biol. 2003, 62, 774–792. [Google Scholar] [CrossRef]
  52. Perry, S.V. Vertebrate tropomyosin: Distribution, properties and function. J. Muscle Res. Cell Motil. 2001, 22, 5–49. [Google Scholar] [CrossRef]
  53. Oehlmann, V.D.; Berger, S.; Sterner, C.; Korsching, S.I. Zebrafish beta tubulin 1 expression is limited to the nervous system throughout development, and in the adult brain is restricted to a subset of proliferative regions. Gene Expr. Patterns 2004, 4, 191–198. [Google Scholar]
  54. Meek, S.E.; Lane, W.S.; Piwnica-Worms, H. Comprehensive proteomic analysis of interphase and mitotic 14-3-3-binding proteins. J. Biol. Chem. 2004, 279, 32046–32054. [Google Scholar] [CrossRef]
  55. Van Hemert, M.J.; Steensma, H.Y.; van Heusden, G.P. 14-3-3 proteins: Key regulators of cell division, signalling and apoptosis. Bioessays 2001, 23, 936–946. [Google Scholar] [CrossRef]
  56. Suzuki, K.; Sato, K.; Katsu, K.; Hayashita, H.; Kristensen, D.B.; Yoshizato, K. Novel Rana keratin genes and their expression during larval to adult epidermal conversion in bullfrog tadpoles. Differentiation 2001, 68, 44–54. [Google Scholar] [CrossRef]
  57. Suzuki, K.; Utoh, R.; Kotani, K.; Obara, M.; Yoshizato, K. Lineage of anuran epidermal basal cells and their differentiation potential in relation to metamorphic skin remodeling. Dev. Growth Differ. 2002, 44, 225–238. [Google Scholar] [CrossRef]
  58. Ishida, Y.; Suzuki, K.; Utoh, R.; Obara, M.; Yoshizato, K. Molecular identification of the skin transformation center of anuran larval skin using genes of Rana adult keratin (RAK) and SPARC as probes. Dev. Growth Differ. 2003, 45, 515–526. [Google Scholar] [CrossRef]
  59. Jeyachandran, S.; Chellapandian, H.; Park, K.; Kwak, I.-S. A Review on the involvement of heat shock proteins (Extrinsic Chaperones) in response to stress conditions in aquatic organisms. Antioxidants 2023, 12, 1444. [Google Scholar] [CrossRef]
  60. Xie, Y.; Song, L.; Weng, Z.; Liu, S.; Liu, Z. Hsp90, Hsp60 and sHsp families of heat shock protein genes in channel catfish and their expression after bacterial infections. Fish. Shellfish. Immunol. 2015, 44, 642–651. [Google Scholar] [CrossRef]
  61. Song, L.; Li, C.; Xie, Y.; Liu, S.; Zhang, J.; Yao, J.; Jiang, C.; Li, Y.; Liu, Z. Genome-wide identification of Hsp70 genes in channel catfish and their regulated expression after bacterial infection. Fish. Shellfish. Immunol. 2016, 49, 154–162. [Google Scholar] [CrossRef]
  62. Chiosis, G.; Digwal, C.S.; Trepel, J.B.; Neckers, L. Structural and functional complexity of HSP90 in cellular homeostasis and disease. Nat. Rev. Mol. Cell Biol. 2023, 24, 797–815. [Google Scholar] [CrossRef]
  63. Didenko, T.; Duarte, A.M.; Karagoz, G.E.; Rudiger, S.G. Hsp90 structure and function studied by NMR spectroscopy. Biochim. Biophys. Acta 2012, 1823, 636–647. [Google Scholar] [CrossRef]
  64. Street, T.O.; Lavery, L.A.; Agard, D.A. Substrate binding drives large-scale conformational changes in the Hsp90 molecular chaperone. Mol. Cell 2011, 42, 96–105. [Google Scholar] [CrossRef]
  65. Rosenzweig, R.; Nillegoda, N.B.; Mayer, M.P.; Bukau, B. The Hsp70 chaperone network. Nat. Rev. Mol. Cell Biol. 2019, 20, 665–680. [Google Scholar] [CrossRef]
  66. Roberts, R.J.; Agius, C.; Saliba, C.; Bossier, P.; Sung, Y.Y. Heat shock proteins (chaperones) in fish and shellfish and their potential role in relation to fish health: A review. J. Fish. Dis. 2010, 33, 789–801. [Google Scholar] [CrossRef]
  67. Duan, Y.; Tang, H.; Mitchell-Silbaugh, K.; Fang, X.; Han, Z.; Ouyang, K. Heat shock protein 60 in cardiovascular physiology and diseases. Front. Mol. Biosci. 2020, 7, 73. [Google Scholar] [CrossRef]
  68. Song, L.; Zhang, J.; Li, C.; Yao, J.; Jiang, C.; Li, Y.; Liu, S.; Liu, Z. Genome-wide identification of hsp40 genes in channel catfish and their regulated expression after bacterial infection. PLoS ONE 2014, 9, e115752. [Google Scholar] [CrossRef]
  69. Hori, T.S.; Gamperl, A.K.; Afonso, L.O.; Johnson, S.C.; Hubert, S.; Kimball, J.; Bowman, S.; Rise, M.L. Heat-shock responsive genes identified and validated in Atlantic cod (Gadus morhua) liver, head kidney and skeletal muscle using genomic techniques. BMC Genom. 2010, 11, 72. [Google Scholar] [CrossRef]
  70. Gollock, M.J.; Currie, S.; Petersen, L.H.; Gamperl, A.K. Cardiovascular and haematological responses of Atlantic cod (Gadus morhua) to acute temperature increase. J. Exp. Biol. 2006, 209, 2961–2970. [Google Scholar] [CrossRef]
  71. Perez-Casanova, J.C.; Rise, M.L.; Dixon, B.; Afonso, L.O.; Hall, J.R.; Johnson, S.C.; Gamperl, A.K. The immune and stress responses of Atlantic cod to long-term increases in water temperature. Fish. Shellfish. Immunol. 2008, 24, 600–609. [Google Scholar] [CrossRef]
  72. Kassahn, K.S.; Caley, M.J.; Ward, A.C.; Connolly, A.R.; Stone, G.; Crozier, R.H. Heterologous microarray experiments used to identify the early gene response to heat stress in a coral reef fish. Mol. Ecol. 2007, 16, 1749–1763. [Google Scholar] [CrossRef]
  73. Buckley, B.A.; Gracey, A.Y.; Somero, G.N. The cellular response to heat stress in the gobyGillichthys mirabilis: A cDNA microarray and protein-level analysis. J. Exp. Biol. 2006, 209, 2660–2677. [Google Scholar] [CrossRef]
  74. Podrabsky, J.E.; Somero, G.N. Changes in gene expression associated with acclimation to constant temperatures and fluctuating daily temperatures in an annual killifish Austrofundulus limnaeus. J. Exp. Biol. 2004, 207, 2237–2254. [Google Scholar] [CrossRef]
  75. Basu, N.; Todgham, A.E.; Ackerman, P.A.; Bibeau, M.R.; Nakano, K.; Schulte, P.M.; Iwama, G.K. Heat shock protein genes and their functional significance in fish. Gene 2002, 295, 173–183. [Google Scholar] [CrossRef]
  76. Yiangou, M.; Paraskeva, E.; Hsieh, C.C.; Markou, E.; Victoratos, P.; Scouras, Z.; Papaconstantinou, J. Induction of a subgroup of acute phase protein genes in mouse liver by hyperthermia. Biochim. Biophys. Acta 1998, 1396, 191–206. [Google Scholar] [CrossRef]
  77. Gross-Sorokin, M.Y.; Roast, S.D.; Brighty, G.C. Assessment of feminization of male fish in English rivers by the Environment Agency of England and Wales. Environ. Health Perspect. 2006, 114 (Suppl. S1), 147–151. [Google Scholar] [CrossRef]
  78. Mills, L.J.; Gutjahr-Gobell, R.E.; Horowitz, D.B.; Denslow, N.D.; Chow, M.C.; Zaroogian, G.E. Relationship between reproductive success and male plasma vitellogenin concentrations in cunner, Tautogolabrus adspersus. Env. Health Perspect. 2003, 111, 93–100. [Google Scholar] [CrossRef]
  79. Soffker, M.; Tyler, C.R. Endocrine disrupting chemicals and sexual behaviors in fish-a critical review on effects and possible consequences. Crit. Rev. Toxicol. 2012, 42, 653–668. [Google Scholar] [CrossRef]
  80. Montjean, D.; Neyroud, A.S.; Yefimova, M.G.; Benkhalifa, M.; Cabry, R.; Ravel, C. Impact of endocrine disruptors upon non-genetic inheritance. Int. J. Mol. Sci. 2022, 23, 3350. [Google Scholar] [CrossRef]
  81. Cohen, A.M.; Mansour, A.A.; Banoub, J.H. Absolute quantification of Atlantic salmon and rainbow trout vitellogenin by the ‘signature peptide’ approach using electrospray ionization QqToF tandem mass spectrometry. J. Mass. Spectrom. 2006, 41, 646–658. [Google Scholar] [CrossRef]
  82. Cohen, A.M.; Jahouh, F.; Sioud, S.; Rideout, R.M.; Morgan, M.J.; Banoub, J.H. Quantification of Greenland halibut serum vitellogenin: A trip from the deep sea to the mass spectrometer. Rapid Commun. Mass. Spectrom. 2009, 23, 1049–1060. [Google Scholar] [CrossRef]
  83. Banoub, J.; Thibault, P.; Mansour, A.; Cohen, A.; Heeley, D.H.; Jackman, D. Characterisation of the intact rainbow trout vitellogenin protein and analysis of its derived tryptic and cyanogen bromide peptides by matrix-assisted laser desorption/ionisation time-of-flight-mass spectrometry and electrospray ionisation quadrupole/time. Eur. J. Mass. Spectrom. 2003, 9, 509–524. [Google Scholar] [CrossRef]
  84. Cohen, A.M.; Banoub, J.H. Application of Mass Spectrometry for the Analysis of Vitellogenin, a Unique Biomarker for Xenobiotic Compounds. NATO Sci. Peace Secur. Ser. A: Chem. Biol. 2010, 301–318. [Google Scholar] [CrossRef]
  85. Katahira, J. Nuclear export of messenger RNA. Genes 2015, 6, 163–184. [Google Scholar] [CrossRef]
  86. Zhao, H.; Chiaro, C.R.; Zhang, L.; Smith, P.B.; Chan, C.Y.; Pedley, A.M.; Pugh, R.J.; French, J.B.; Patterson, A.D.; Benkovic, S.J. Quantitative analysis of purine nucleotides indicates that purinosomes increase de novo purine biosynthesis. J. Biol. Chem. 2015, 290, 6705–6713. [Google Scholar] [CrossRef]
  87. Tanaka, K. The proteasome: Overview of structure and functions. Proc. Jpn. Acad. Ser. B Phys. Biol. Sci. 2009, 85, 12–36. [Google Scholar] [CrossRef]
  88. Gregory, B.; Rahman, N.; Bommakanti, A.; Shamsuzzaman, M.; Thapa, M.; Lescure, A.; Zengel, J.M.; Lindahl, L. The small and large ribosomal subunits depend on each other for stability and accumulation. Life Sci. Alliance 2019, 2, e201800150. [Google Scholar] [CrossRef]
  89. Dreyfuss, G.; Philipson, L.; Mattaj, I.W. Ribonucleoprotein particles in cellular processes. J. Cell Biol. 1988, 106, 1419–1425. [Google Scholar] [CrossRef]
  90. Moreno, A.; Taleb, V.; Sebastian, M.; Anoz-Carbonell, E.; Martinez-Julvez, M.; Medina, M. Cofactors and pathogens: Flavin mononucleotide and flavin adenine dinucleotide (FAD) biosynthesis by the FAD synthase from Brucella ovis. IUBMB Life 2022, 74, 655–671. [Google Scholar] [CrossRef]
  91. Zhang, S.; Zeng, X.; Ren, M.; Mao, X.; Qiao, S. Novel metabolic and physiological functions of branched chain amino acids: A review. J. Anim. Sci. Biotechnol. 2017, 8, 10. [Google Scholar] [CrossRef]
  92. Moore, M.N.; Koehler, A.; Lowe, D.; Viarengo, A. Chapter thirty-three lysosomes and autophagy in aquatic animals. In Methods in Enzymology; Academic Press: Cambridge, MA, USA, 2008; pp. 581–620. [Google Scholar]
  93. Bonam, S.R.; Wang, F.; Muller, S. Lysosomes as a therapeutic target. Nat. Rev. Drug Discov. 2019, 18, 923–948. [Google Scholar] [CrossRef]
  94. Hu, G.; Shu, Y.; Luan, P.; Zhang, T.; Chen, F.; Zheng, X. Genomic analysis of the proteasome subunit gene family and their response to high density and saline-alkali stresses in grass carp. Fishes 2022, 7, 350. [Google Scholar] [CrossRef]
  95. Sharkey, T.D. Pentose phosphate pathway reactions in photosynthesizing cells. Cells 2021, 10, 1547. [Google Scholar] [CrossRef]
  96. Li, S.; Liu, Y.; Li, B.; Ding, L.; Wei, X.; Wang, P.; Chen, Z.; Han, S.; Huang, T.; Wang, B.; et al. Physiological responses to heat stress in the liver of rainbow trout (Oncorhynchus mykiss) revealed by UPLC-QTOF-MS metabolomics and biochemical assays. Ecotoxicol. Environ. Saf. 2022, 242, 113949. [Google Scholar] [CrossRef]
  97. Varki, A. Biological roles of glycans. Glycobiology 2017, 27, 3–49. [Google Scholar] [CrossRef]
  98. Wang, W.; Nag, S.; Zhang, X.; Wang, M.H.; Wang, H.; Zhou, J.; Zhang, R. Ribosomal proteins and human diseases: Pathogenesis, molecular mechanisms, and therapeutic implications. Med. Res. Rev. 2015, 35, 225–285. [Google Scholar] [CrossRef]
  99. Pattin, K.A.; Moore, J.H. Role for protein-protein interaction databases in human genetics. Expert. Rev. Proteom. 2009, 6, 647–659. [Google Scholar] [CrossRef]
  100. Wimalagunasekara, S.S.; Weeraman, J.; Tirimanne, S.; Fernando, P.C. Protein-protein interaction (PPI) network analysis reveals important hub proteins and sub-network modules for root development in rice (Oryza sativa). J. Genet. Eng. Biotechnol. 2023, 21, 69. [Google Scholar] [CrossRef]
  101. Cyr, F.; Snook, S.; Bishop, C.; Galbraith, P.S.; Pye, B.; Chen, N.; Han, G. Physical oceanographic conditions on the Newfoundland and Labrador shelf during 2019. DFO Can. Sci. Advis. Sec. Res. Doc. 2021, iv + 54. Available online: https://waves-vagues.dfo-mpo.gc.ca/library-bibliotheque/40960754.pdf (accessed on 14 May 2024).
  102. Cyr, F.; Colbourne, E.; Holden, J.; Snook, S.; Han, G.; Chen, N.; Bailey, W.; Higdon, J.; Lewis, S.; Pye, B.; et al. Physical oceanographic conditions on the Newfoundland and Labrador shelf during 2017. DFO Can. Sci. Advis. Sec. Res. 2019, iv + 58. Available online: https://waves-vagues.dfo-mpo.gc.ca/library-bibliotheque/40888113.pdf (accessed on 14 May 2024).
  103. Cyr, F.; Galbraith, P.S. A climate index for the Newfoundland and Labrador shelf. Earth Syst. Sci. Data 2021, 13, 1807–1828. [Google Scholar] [CrossRef]
  104. Alexander, M.A.; Shin, S.I.; Scott, J.D.; Curchitser, E.; Stock, C. The response of the Northwest Atlantic ocean to climate change. J. Clim. 2020, 33, 405–428. [Google Scholar] [CrossRef]
Figure 1. Comparison of the total number of otolith proteins between the current study and the previous one. This plot was generated by molbiotools online tools.
Biochem 04 00008 g001
Figure 2. The total number of otolith proteins is similar between the sexes. This plot shows the distribution of protein counts for males and females. Despite apparent differences in medians and variability, a two-sample t-test determined that there is no statistically significant difference in the mean protein counts between sexes (p-value > 0.05). This plot was generated by R Studio using the package ggplot2 retrieved from [33].
Biochem 04 00008 g002
Figure 3. Protein expression is different between the sexes. Each dot expresses a specific protein. Proteins that appear in red are significantly upregulated in female samples, whereas those in green are significantly upregulated in male sexes at p-value < 0.05. This plot was generated by Proteome Discoverer 2.5.
Biochem 04 00008 g003
Figure 4. The differentially expressed proteins between sexes. The heatmap highlights proteins that showed the highest abundance between sexes with p-values ≤ 0.05. This visualization allows us to observe intensities of protein expression, with a colour gradient from blue lower expression to red representing higher expression levels. Each row corresponds to a protein, and each column to a sample, allowing us to compare the expression across our samples generated by Proteome Discoverer 2.5 software.
Biochem 04 00008 g004
Figure 5. The expression of heat shock proteins within all individuals. Each column represents a sample, and each row corresponds to a specific protein, allowing us to compare the expressed protein absorbance across our samples. This figure was created by Proteome Discoverer 2.5 software.
Biochem 04 00008 g005
Figure 6. A conclusion chart provides a visualization representing the number of genes associated with specific terms and functional groups. Each bar represents a functional group, and the height of the bar corresponds to the number of genes related to the terms within that group. The label on each bar indicates the percentage of genes. * p < 0.05, ** p <0.01.
Biochem 04 00008 g006
Figure 7. The distribution of identified genes across various functional groups. (A) This pie chart represents the distribution of genes across biological processes. (B) This pie chart represents the distribution of genes associated with specific cellular components. (C) This pie chart represents the distribution of identified genes across molecular functions. (D) This pie chart represents the distribution of identified genes categorized by their molecular functions, according to Kyoto Encyclopedia of Genes and Genomes (KEGG). The sizes of the slices are proportional to the number of genes involved in each process. Significant level of enrichment ** p < 0.01and * p < 0.05. This figure was created by Cytoscape software.
Biochem 04 00008 g007aBiochem 04 00008 g007b
Figure 8. String network visualization of top 20 high-degree proteins in the otolith protein interaction map of Gadus morhua. This figure was created by Cytoscape software.
Biochem 04 00008 g008
Table 1. Five proteins that are unique in males.
DescriptionAccessionFemale
Count a
Male
Count b
Abundances (Average): Male c
Charged multivesicular body protein 2Ba OS = Gadus morhua OX = 8049 GN = chmp2ba PE = 3 SV = 1A0A8C4YUD605261,448.36432
DNA damage-binding protein 1 OS = Gadus morhua OX = 8049 GN = ddb1 PE = 3 SV = 1A0A8C5A9Z60598,004.482948
Fibroblast growth factor OS = Gadus morhua OX = 8049 PE = 3 SV = 1A0A8C4ZEA70524,497.65508
Microtubule-associated protein 1Ab OS = Gadus morhua OX = 8049 GN = map1ab PE = 4 SV = 1A0A8C5CU29053,458,736.85
Uncharacterized protein OS = Gadus morhua OX = 8049 PE = 3 SV = 1A0A8C5FA1405778,547.8001
a Female count: the count of females associated with each protein entry. b Male count: the count of males associated with each protein entry. c Abundances (average): quantitative protein abundance measurements were averaged for all-female groups.
Table 2. Nine proteins that are unique in females.
DescriptionAccessionFemale Count aMale Count bAbundances (Average): Female c
Dihydrolipoamide acetyltransferase component of pyruvate dehydrogenase complex OS = Gadus morhua OX = 8049 GN = dbt PE = 3 SV = 1A0A8C5C1K450108,232.639474
Galectin OS = Gadus morhua OX = 8049 GN = LOC115545324 PE = 4 SV = 1A0A8C5ACJ850489,972.337868
Heterogeneous nuclear ribonucleoprotein A/Ba OS = Gadus morhua OX = 8049 GN = hnrnpaba PE = 4 SV = 1A0A8C4YVY0501,301,640.954998
Myosin light chain, phosphorylatable, fast skeletal muscle a OS = Gadus morhua OX = 8049 GN = mylpfa PE = 4 SV = 1A0A8C5B8E250495,851.125408
Nidogen 2a (osteonidogen) OS = Gadus morhua OX = 8049 PE = 4 SV = 1A0A8C5D3Y0501,349,773.1182679997
Polypeptide N-acetylgalactosaminyltransferase OS = Gadus morhua OX = 8049 GN = galnt6 PE = 3 SV = 1A0A8C5BP605042,686.3808994
SRSF protein kinase 2 OS = Gadus morhua OX = 8049 GN = srpk2 PE = 4 SV = 1A0A8C5CES35020,084.879869999997
Uncharacterized protein OS = Gadus morhua OX = 8049 PE = 4 SV = 1A0A8C5CCX750211,271.979502
Vinculin OS = Gadus morhua OX = 8049 PE = 3 SV = 1A0A8C5A43050411,121.875006
a Female count: the count of females associated with each protein entry. b Male count: the count of males associated with each protein entry. c Abundances (average): quantitative protein abundance measurements were averaged for all-male groups.
Disclaimer/Publisher’s Note: The statements, opinions and data contained in all publications are solely those of the individual author(s) and contributor(s) and not of MDPI and/or the editor(s). MDPI and/or the editor(s) disclaim responsibility for any injury to people or property resulting from any ideas, methods, instructions or products referred to in the content.

