Article

Optimizing the Mechanical Properties and Corrosion Performance of Low-Alloyed Mg-Zn-Ca Alloy by Regulating Zn/Ca Atomic Ratios

1
School of Materials Science and Engineering, Tianjin University of Technology, Tianjin 300384, China
2
Key Laboratory of Display Materials and Photoelectric Device, Ministry of Education, Tianjin 300384, China
3
National Demonstration Center for Experimental Function Materials Education, Tianjin 300384, China
*
Authors to whom correspondence should be addressed.
Solids 2025, 6(2), 17; https://doi.org/10.3390/solids6020017
Submission received: 20 February 2025 / Revised: 13 March 2025 / Accepted: 9 April 2025 / Published: 14 April 2025

Abstract

:
The microstructural, mechanical and corrosion properties of low-alloyed Mg-Zn-Ca alloys with different Zn/Ca atomic ratios were investigated. The results show that the microstructure of the extruded Mg-1Zn-0.3Ca (ZX1.0) alloy mainly consists of α-Mg and Ca2Mg6Zn3 phases and a small amount of Mg2Ca phase. In contrast, the Mg2Ca phase disappears in the alloys Mg-1.4Zn-0.3Ca (ZX1.4), Mg-1.8Zn-0.3Ca (ZX1.8) and Mg-2.3Zn-0.5Ca (ZX2.3). The Ca2Mg6Zn3 phases are mainly distributed along the extrusion direction, showing irregular particle shapes and banded particles. Meanwhile, the grain size of the extruded Mg-Zn-Ca alloy is reduced gradually with the increase of the Zn and Ca contents, decreasing from 1.87 μm in ZX1.0 to 1.28 μm in ZX2.3 alloy. Fine grain strengthening and second-phase strengthening increase the yield strength and ultimate tensile strength of the alloy. In addition, when the Zn/Ca ratio is the same, the total elemental content dominates the effect on alloy properties. When increasing the Zn/Ca ratio, the potential difference between Ca2Mg6Zn3 and the Mg matrix increased, resulting in an increase in galvanic corrosion. The negative effect of the volume fraction of the second phase and the positive effect of the fine grain size determine the corrosion performance together. Therefore, ZX1.8 exhibits the best corrosion resistance, of 0.14 mm/y.

Graphical Abstract

1. Introduction

Magnesium (Mg) alloys are recognized as a revolutionary biodegradable metal material due to their excellent biodegradability, biocompatibility and close mechanical properties with human bone [1,2]. With the development of bone tissue engineering, the requirements for biodegradable Mg alloy implant materials are increasing. The mechanical properties and corrosion resistance of the materials must meet [3] a (1) yield strength (YS) greater than 200 MPa; (2) elongation (EL) greater than 10% for orthopedic applications and greater than 20% for cardiovascular applications; (3) corrosion rate of less than 0.5 mm/y and uniform corrosion [4]. However, pure Mg has a yield strength of only 69 MPa and a corrosion rate of 1.069 mm/y [5]. These properties are far below the requirements of biodegradable implant materials.
Alloying has been proven to be an effective method to solve the above problems of Mg alloy. Zn and Ca are essential elements for the human body [6]. Zn is involved in more than 300 enzymatic processes in the human body [7], and it has an antiproliferative effect and can also regulate inflammatory cytokines [8]. Ca is a key factor in bone formation and remodeling [8,9]. In addition, the increase in Zn and Ca contents contributes to the formation of fine precipitates and leads to a moderate reduction in grain size, which is conducive to the improvement of the mechanical properties of Mg alloys [10,11,12]. Therefore, Mg-Zn-Ca alloys have become a hotspot of concern.
It was reported that the yield strength of Mg-Zn-Ca alloys in the extruded state increases gradually from 238 MPa to 292 MPa with an increase in Zn content from 1 wt.% to 4.5 wt.% [13,14,15,16]. In contrast, Ma [17] et al. concluded that excessive Zn in Mg-xZn-0.2Ca alloys was detrimental to the corrosion resistance of the material. Hence, low-alloyed (total alloying element content < 3 wt.%) Mg-Zn-Ca alloys [5,6,18], with good corrosion resistance due to mild galvanic corrosion, have increasingly attracted more attention. For example, Jiang et al. [11] fabricated a low-alloyed Mg-0.5Zn-0.2Ca alloy, whose corrosion rate was 0.1 mm·y−1 in Hank’s solution. But its yield strength was only 120 MPa, which is far from the clinical requirements. Therefore, selecting an elemental content to balance mechanical properties and corrosion resistance is an important challenge for Mg-Zn-Ca alloy.
The kind of second phase had a great influence on the corrosion behavior of Mg-Zn-Ca alloy, especially when the total alloying element content was constant. Bakhsheshi-Rad et al. [19] investigated the corrosion performance of Mg-Zn-Ca alloys with different Zn/Ca mass ratios and found that when the Zn/Ca mass ratio exceeded 12, the alloy tended to preferentially form the Mg-Zn + Ca2Mg6Zn3 phases. Additionally, in the range of mass ratios from 2 to 12, the alloys preferred to form only the Ca2Mg6Zn3 phase. Furthermore, when the mass ratio fell below 2, the Mg-Ca + Ca2Mg6Zn3 phases were more likely to form. Ibrahim et al. [20] also found that both Mg2Ca and Ca2Mg6Zn3 phases precipitated at Zn/Ca atomic ratios of less than 1.2. In contrast, when the Zn/Ca atomic ratio exceeded 1.2, only the Ca2Mg6Zn3 phase was observed. A large number of research results showed that the MgZn second phase caused great damage to the corrosion resistance of Mg alloys due to its higher potential compared to the Mg matrix [21]. Meanwhile, the potential difference between MgCa or CaMgZn phases and the Mg matrix was much smaller than that of the MgZn phase [12,22].
Based on this, we want to develop a low-alloyed Mg-Zn-Ca alloy without a MgZn second phase by controlling the Zn/Ca atomic ratio so as to achieve a balanced mechanical and corrosion performance.

2. Experimental Section

2.1. Material Preparation

The Mg-xZn-yCa alloy was prepared from pure Mg (99.99%), pure Zn (99.99%) and Mg-25%Ca master alloy. After complete melting, the mixture was stirred at 400 r/min for 10 min and allowed to stand for 15 min. The melt was then cooled to 700 °C and cast into a preheated (150 °C) steel mold. The casting ingots (70 mm diameter) with nominal compositions of Mg-1Zn-0.3Ca, Mg-1.4Zn-0.3Ca, Mg-1.8Zn-0.3Ca and Mg-2.3Zn-0.5Ca (wt.%) were named ZX1.0, ZX1.4, ZX1.8 and ZX2.3, respectively. Their actual compositions were tested by the inductively coupled plasma (ICP) method and are provided in Table 1. The ingots underwent solution treatment at 420 °C for 16 h, followed by water quenching at 60 °C. They were then preheated at 300 °C for 2 h and extruded with an extrusion ratio of 33:1 and a ram speed of 0.2 mm/s. The final products were 8 mm diameter rods.

2.2. Microstructural Analysis

The extruded rods were machined into φ8 mm × 3 mm discs and ground with SiC sandpaper with a grit size of 320-5000#, and then the surface of the samples was polished with 0.5 μm diamond polish. The polished samples were etched in picric acid solution, consisting of 45 mL of anhydrous ethanol, 5 mL of deionized water, 2.5 mL of glacial acetic acid and 2.75 g of picric acid. The microstructure of the alloys was observed using an optical microscope (OM, GX51F, Tokyo, Japan) and scanning electron microscope (SEM, Quanta FEG 250) (Thermo Fisher Scientific, Waltham, MA, USA) combined with an energy spectrometer (EDS) (SEM model: Verios 460L). The phase of the alloys was analyzed by using an X-ray diffractometer (XRD, Philips-X′ Pert) (Rigaku Corporation, Tokyo, Japan) with a CuKa target. The volume fraction of the second phase was counted using ImageJ-win64 software.

2.3. Mechanical Performance

Disc-shaped specimens, of 8 mm in diameter and 3 mm in thickness, were subjected to uniform abrasion using sandpaper to align surface scratches. Subsequently, the hardness of the specimens was evaluated using a micro-Vickers hardness tester (HMV-2T) (Shimadzu, Kyoto, Japan). An indentation load of 490 mN was applied for a duration of 10 s. Twenty points were made along the central axis for each sample, and the average value represents the hardness of the alloy.
The tensile specimens had a gauge length of 25 mm and a diameter of 5 mm along the extrusion direction (ED). Tensile testing was conducted at ambient temperature utilizing a DDL10 universal testing machine (CIMACH, Chang Chun, China), with a tensile rate of 0.5 mm/min. To ensure the reliability of the results and minimize potential errors, three replicate tests were performed for each alloy.

2.4. Electrochemical Performance Testing

Electrochemical analyses, encompassing dynamic potential polarization and electrochemical impedance spectroscopy (EIS), were conducted on extruded Mg alloy discs (φ7 mm × 3 mm) utilizing a Zahner-Zennium X workstation (Zahner-Zennium, Kronach, Germany). Specimens were polished with SiC abrasive paper (grades 320# to 5000#), followed by degreasing in anhydrous ethanol. The electrochemical experiment was tested in Hank’s solution maintained at a pH of 7.4 ± 0.1 and a temperature of 37 °C. Hank’s solution compositions are provided in Table 2. The exposed specimen area was standardized to 0.2 cm2. A three-electrode configuration was employed, with the Mg alloy as the working electrode, a graphite electrode as the counter electrode and a saturated calomel electrode (SCE) serving as the reference. EIS measurements were initiated post a 40 min open circuit potential (OCP) stabilization period. The frequency spectrum for EIS spanned from 10−2 to 105 Hz, while the potential polarization scans were executed at a rate of 1 mV/s from the cathodic to anodic direction. Each alloy was subjected to at least three replicate tests. The corrosion rates were derived from Equation (1).
P i = 22.85 I c o r r
I c o r r is the corrosion current density. After testing, Zview 3.1 and ZSimpWin 3.6 software were used to fit the Tafel curve and impedance spectrum, respectively.

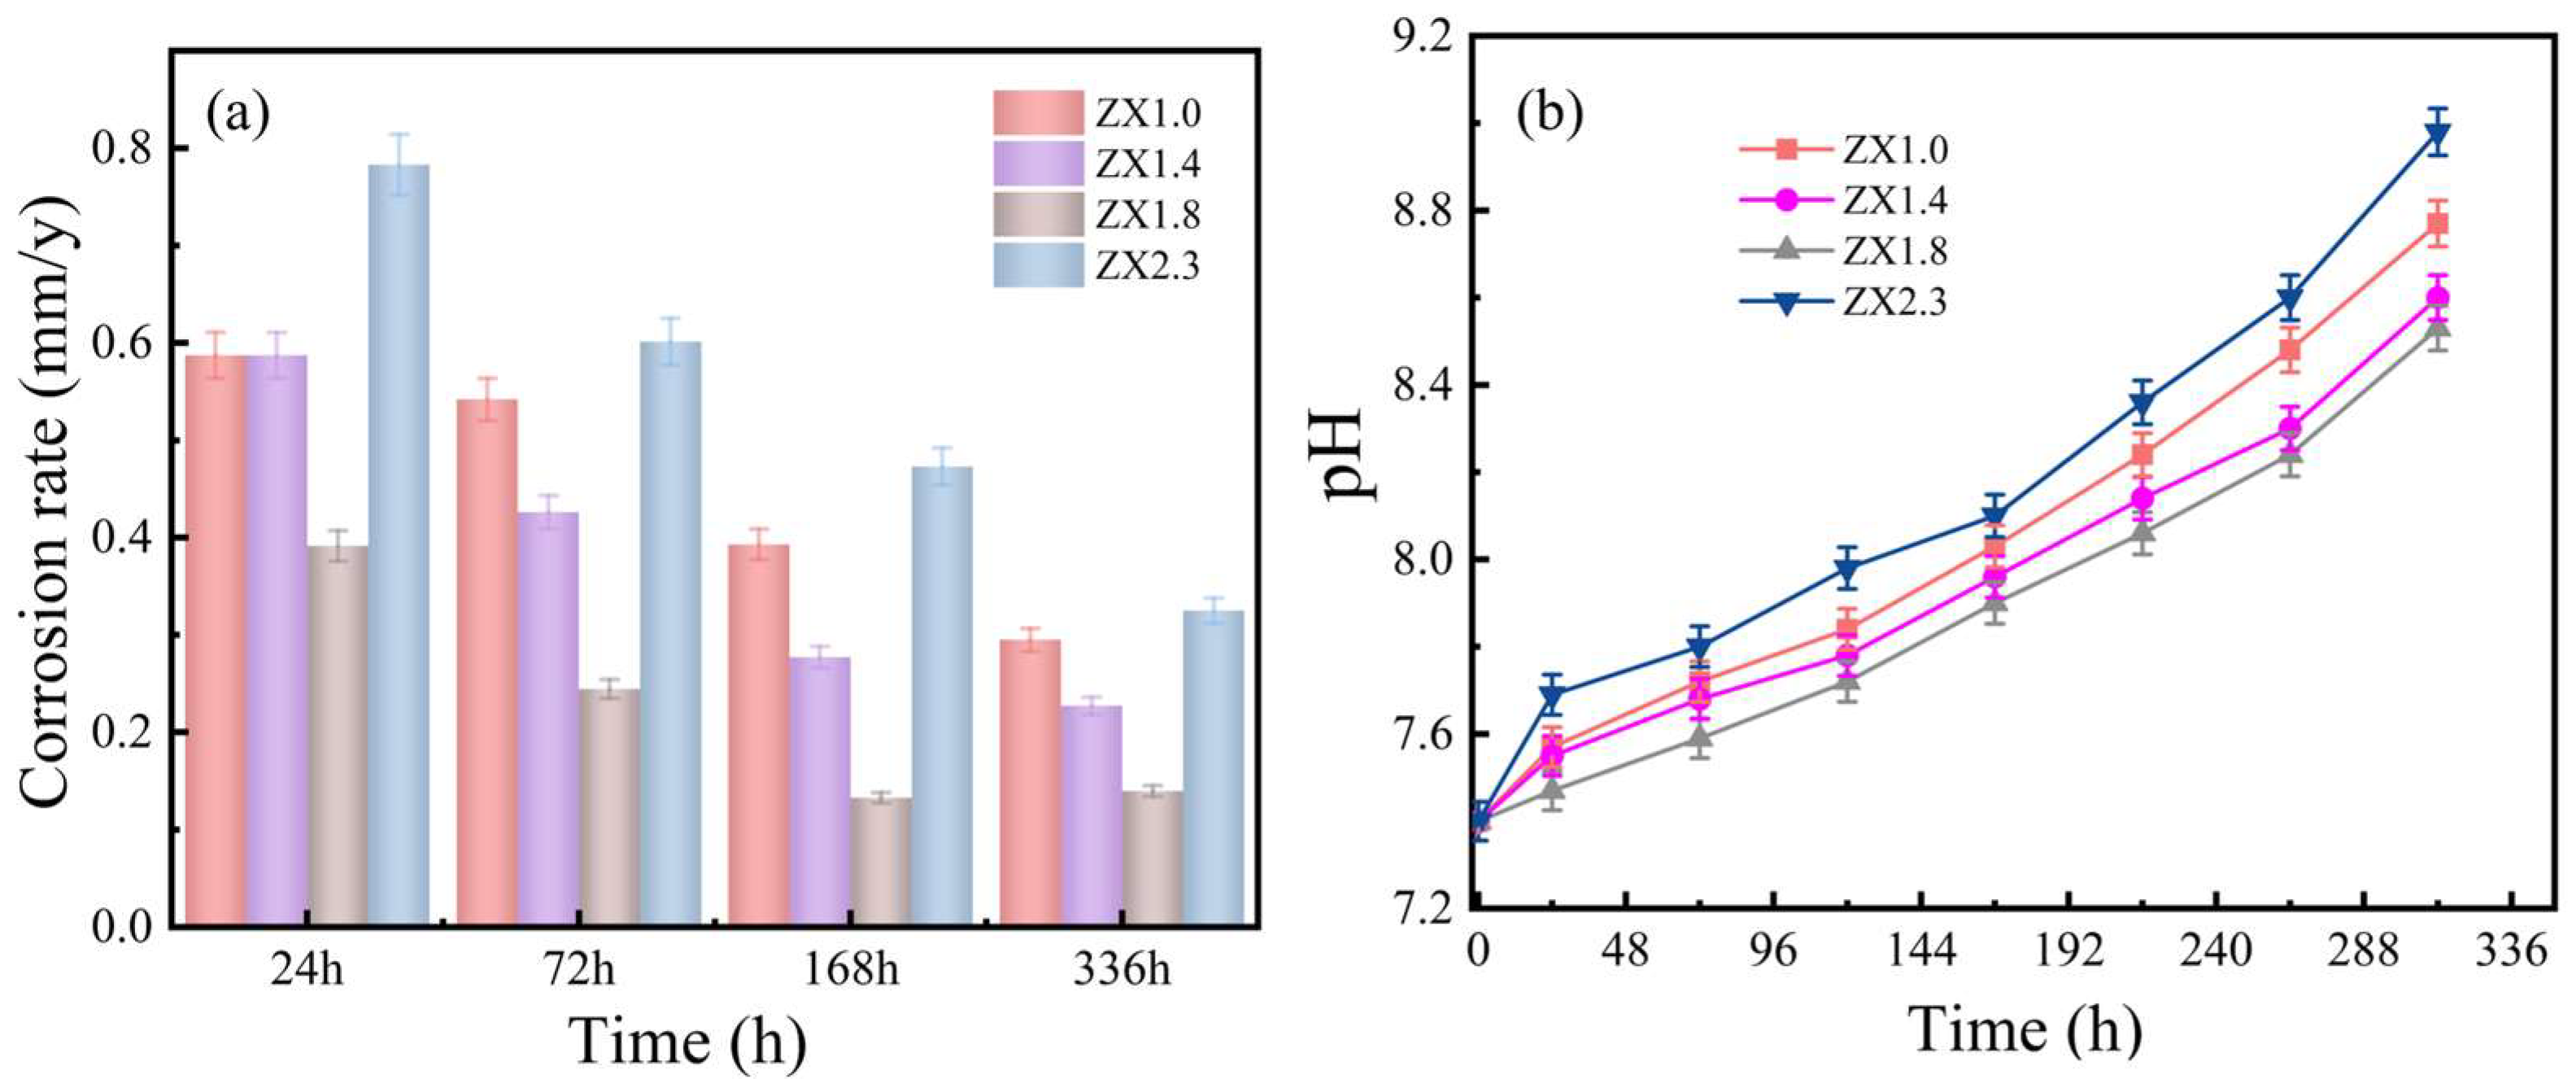
2.5. In Vitro Immersion Testing

Immersion tests were conducted in Hank’s solution with a water bath maintained at 37 °C. Hank’s solution was replenished every 48 h to simulate physiological conditions. Extruded specimens (φ7 mm × 3 mm) were subjected to ultrasonic cleaning for 5 min, followed by drying and initial weighing (m1). After immersion at intervals of 24, 72, 168 and 336 h, the specimens were decontaminated with deionized water and anhydrous ethanol, then dried. Subsequently, they were treated with a chromic acid solution (200 g/L Cr2O3, 10 g/L Ag (NO3)2, 10 g/L Ba (NO3)2) to remove surface corrosion products. The final weight (m2) was recorded after corrosion product removal. The corrosion rate was ascertained using the formula provided in Equation (2).
W L = K × m A × t
W L (mm/y) is the corrosion rate of Mg alloy during immersion, K is a constant of 8.76 × 10³, m ( m 1 m 2 ) (g) is the mass loss during immersion, A (mm2) is the surface area of the specimen and t (day) is the immersion time in Hank’s solution. Five samples were immersed at each time point, and the average of the corrosion rates of the three samples was taken as the final experimental result.
In order to further understand the corrosion state of the material, surface and cross-section morphologies with corrosion products as well as after removal of corrosion products were observed using SEM and a stereoscan microscope.

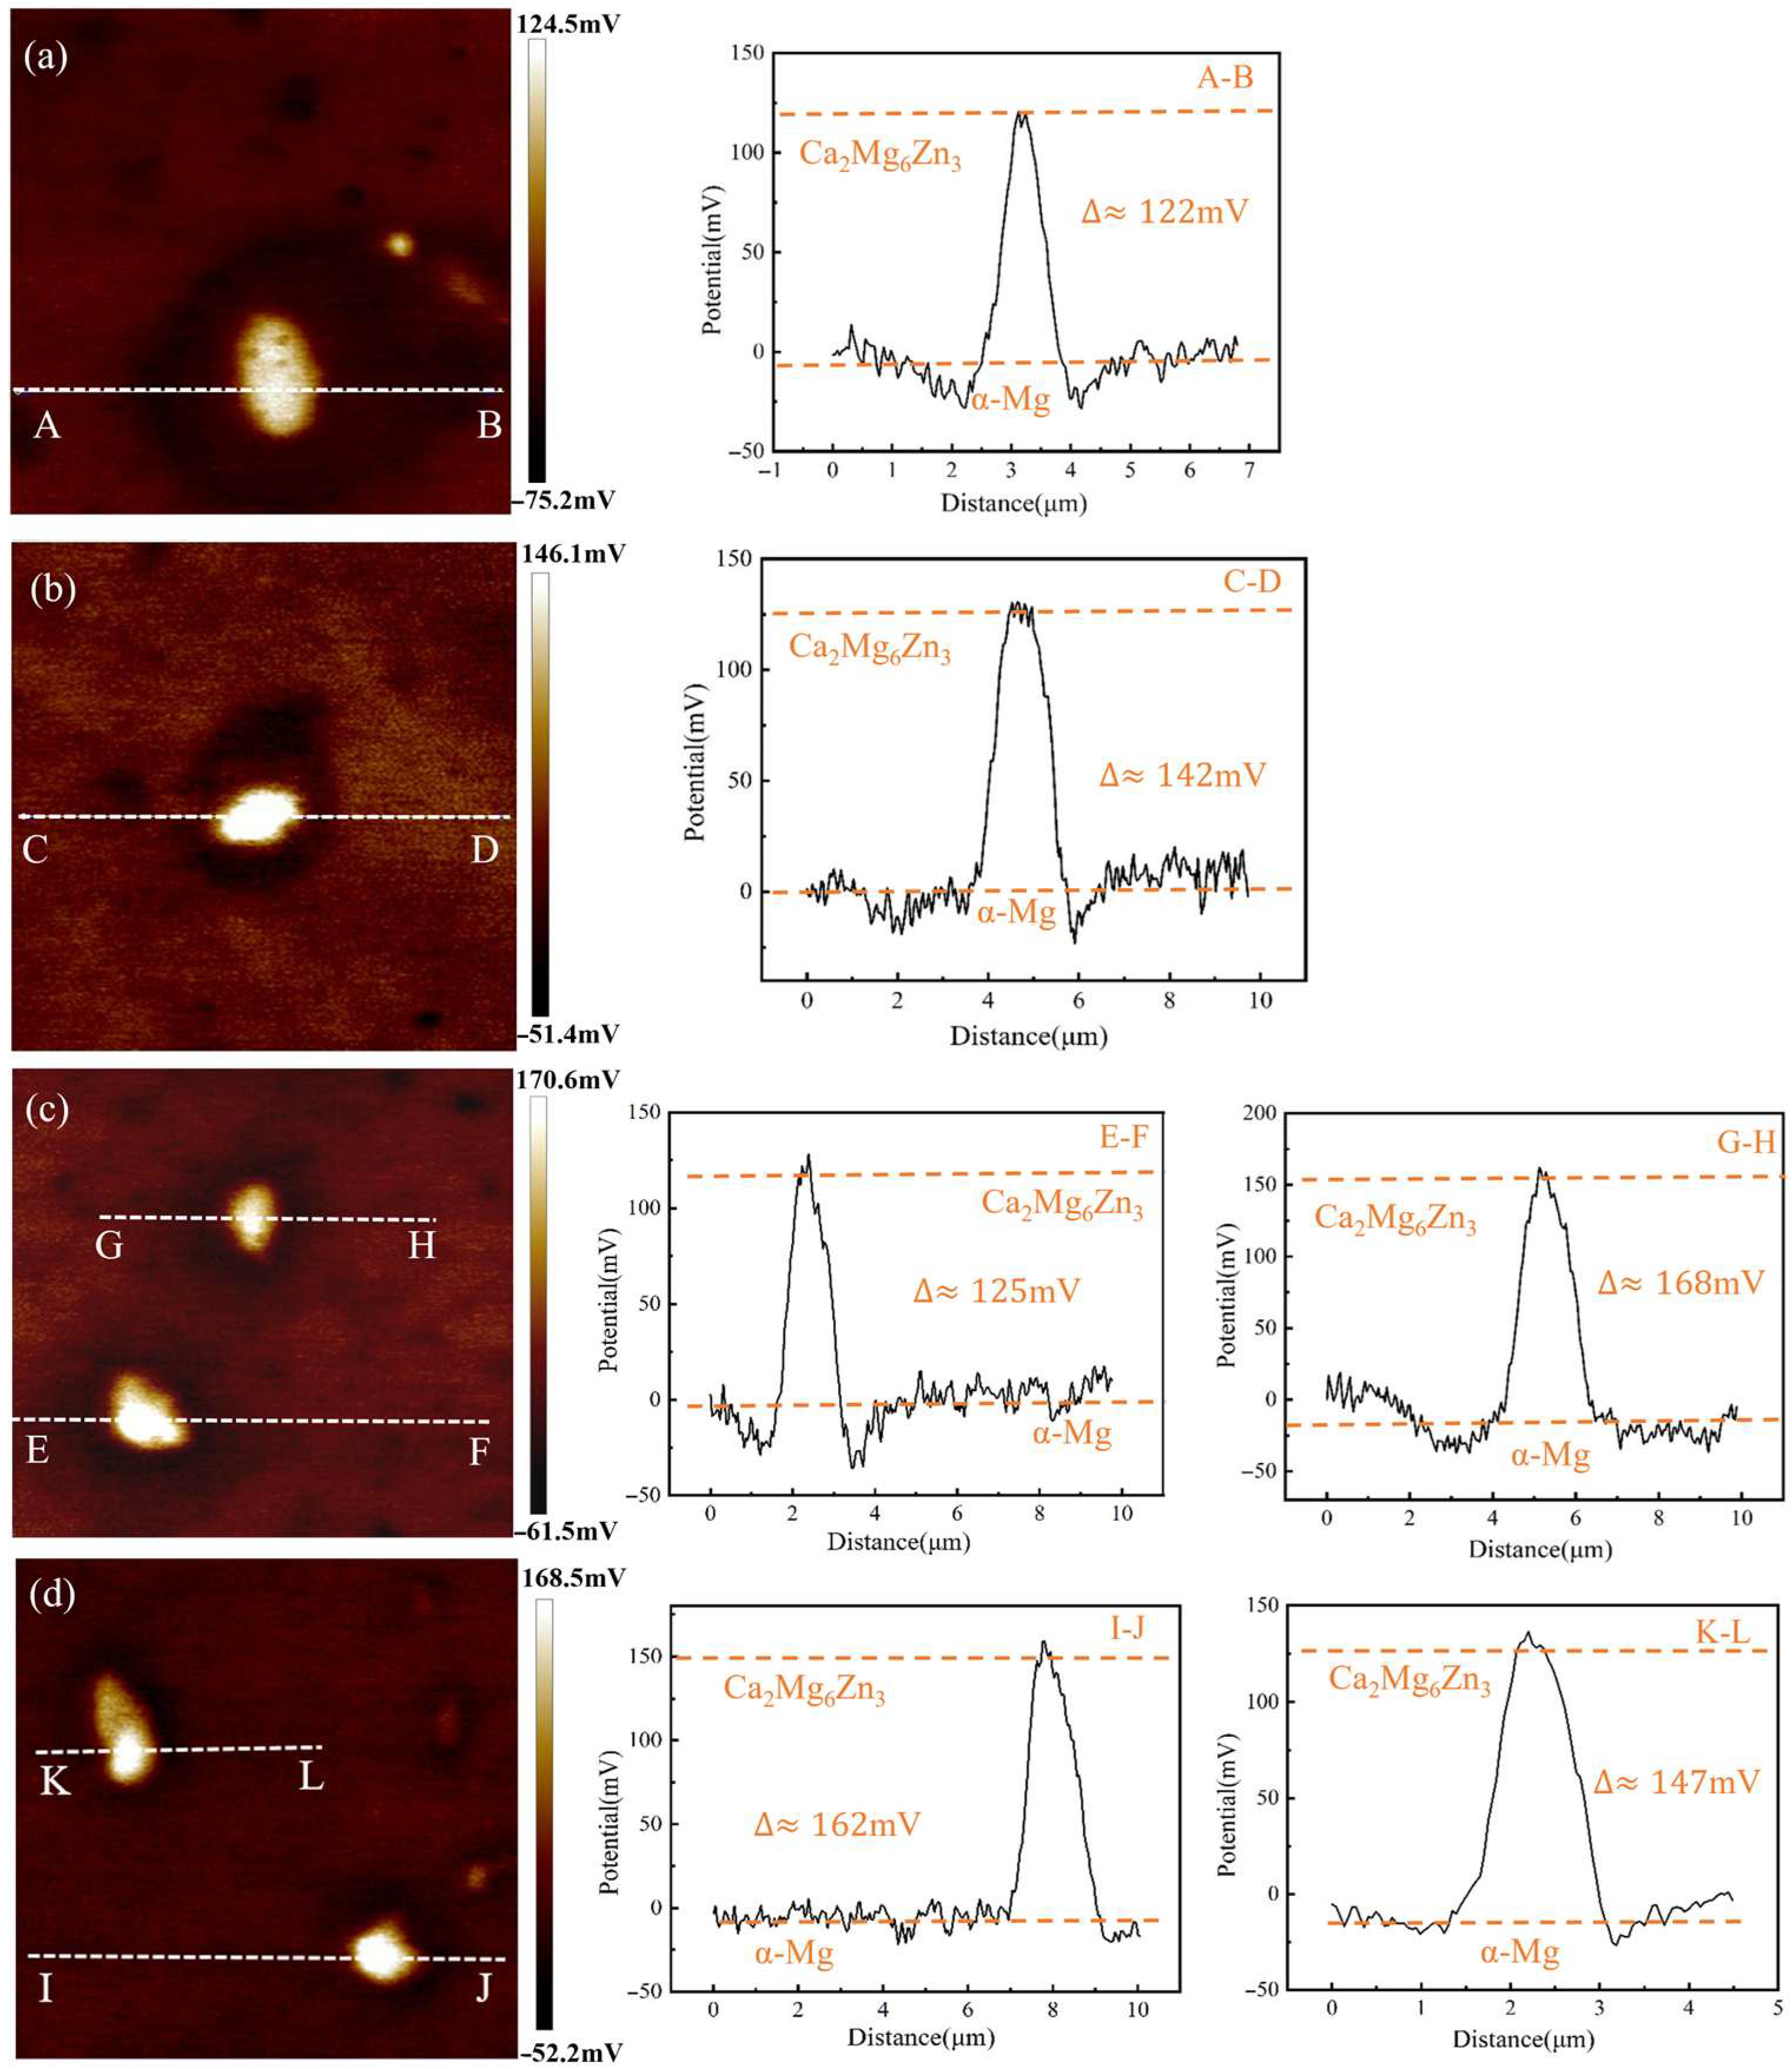
2.6. Second-Phase Potential Testing

The specimens for the second-phase potential assessment were prepared as small discs with a diameter of 7 mm and a thickness of 3 mm, subjected to polishing with silicon carbide abrasive paper. Subsequently, the surface was polished to a specular finish using a silica-based polishing compound with 50 nm particle size. The specimens were then ultrasonically decontaminated in anhydrous ethanol for three minutes to eliminate residual polishing compounds. The atomic force microscope (AFM, Bruker Dimension Icon) was used in the scanning Kelvin probe force microscopy (SKPFM) mode. The potential variation between the physical phase and the substrate was quantified by employing NanoScope Analysis 1.9 software.

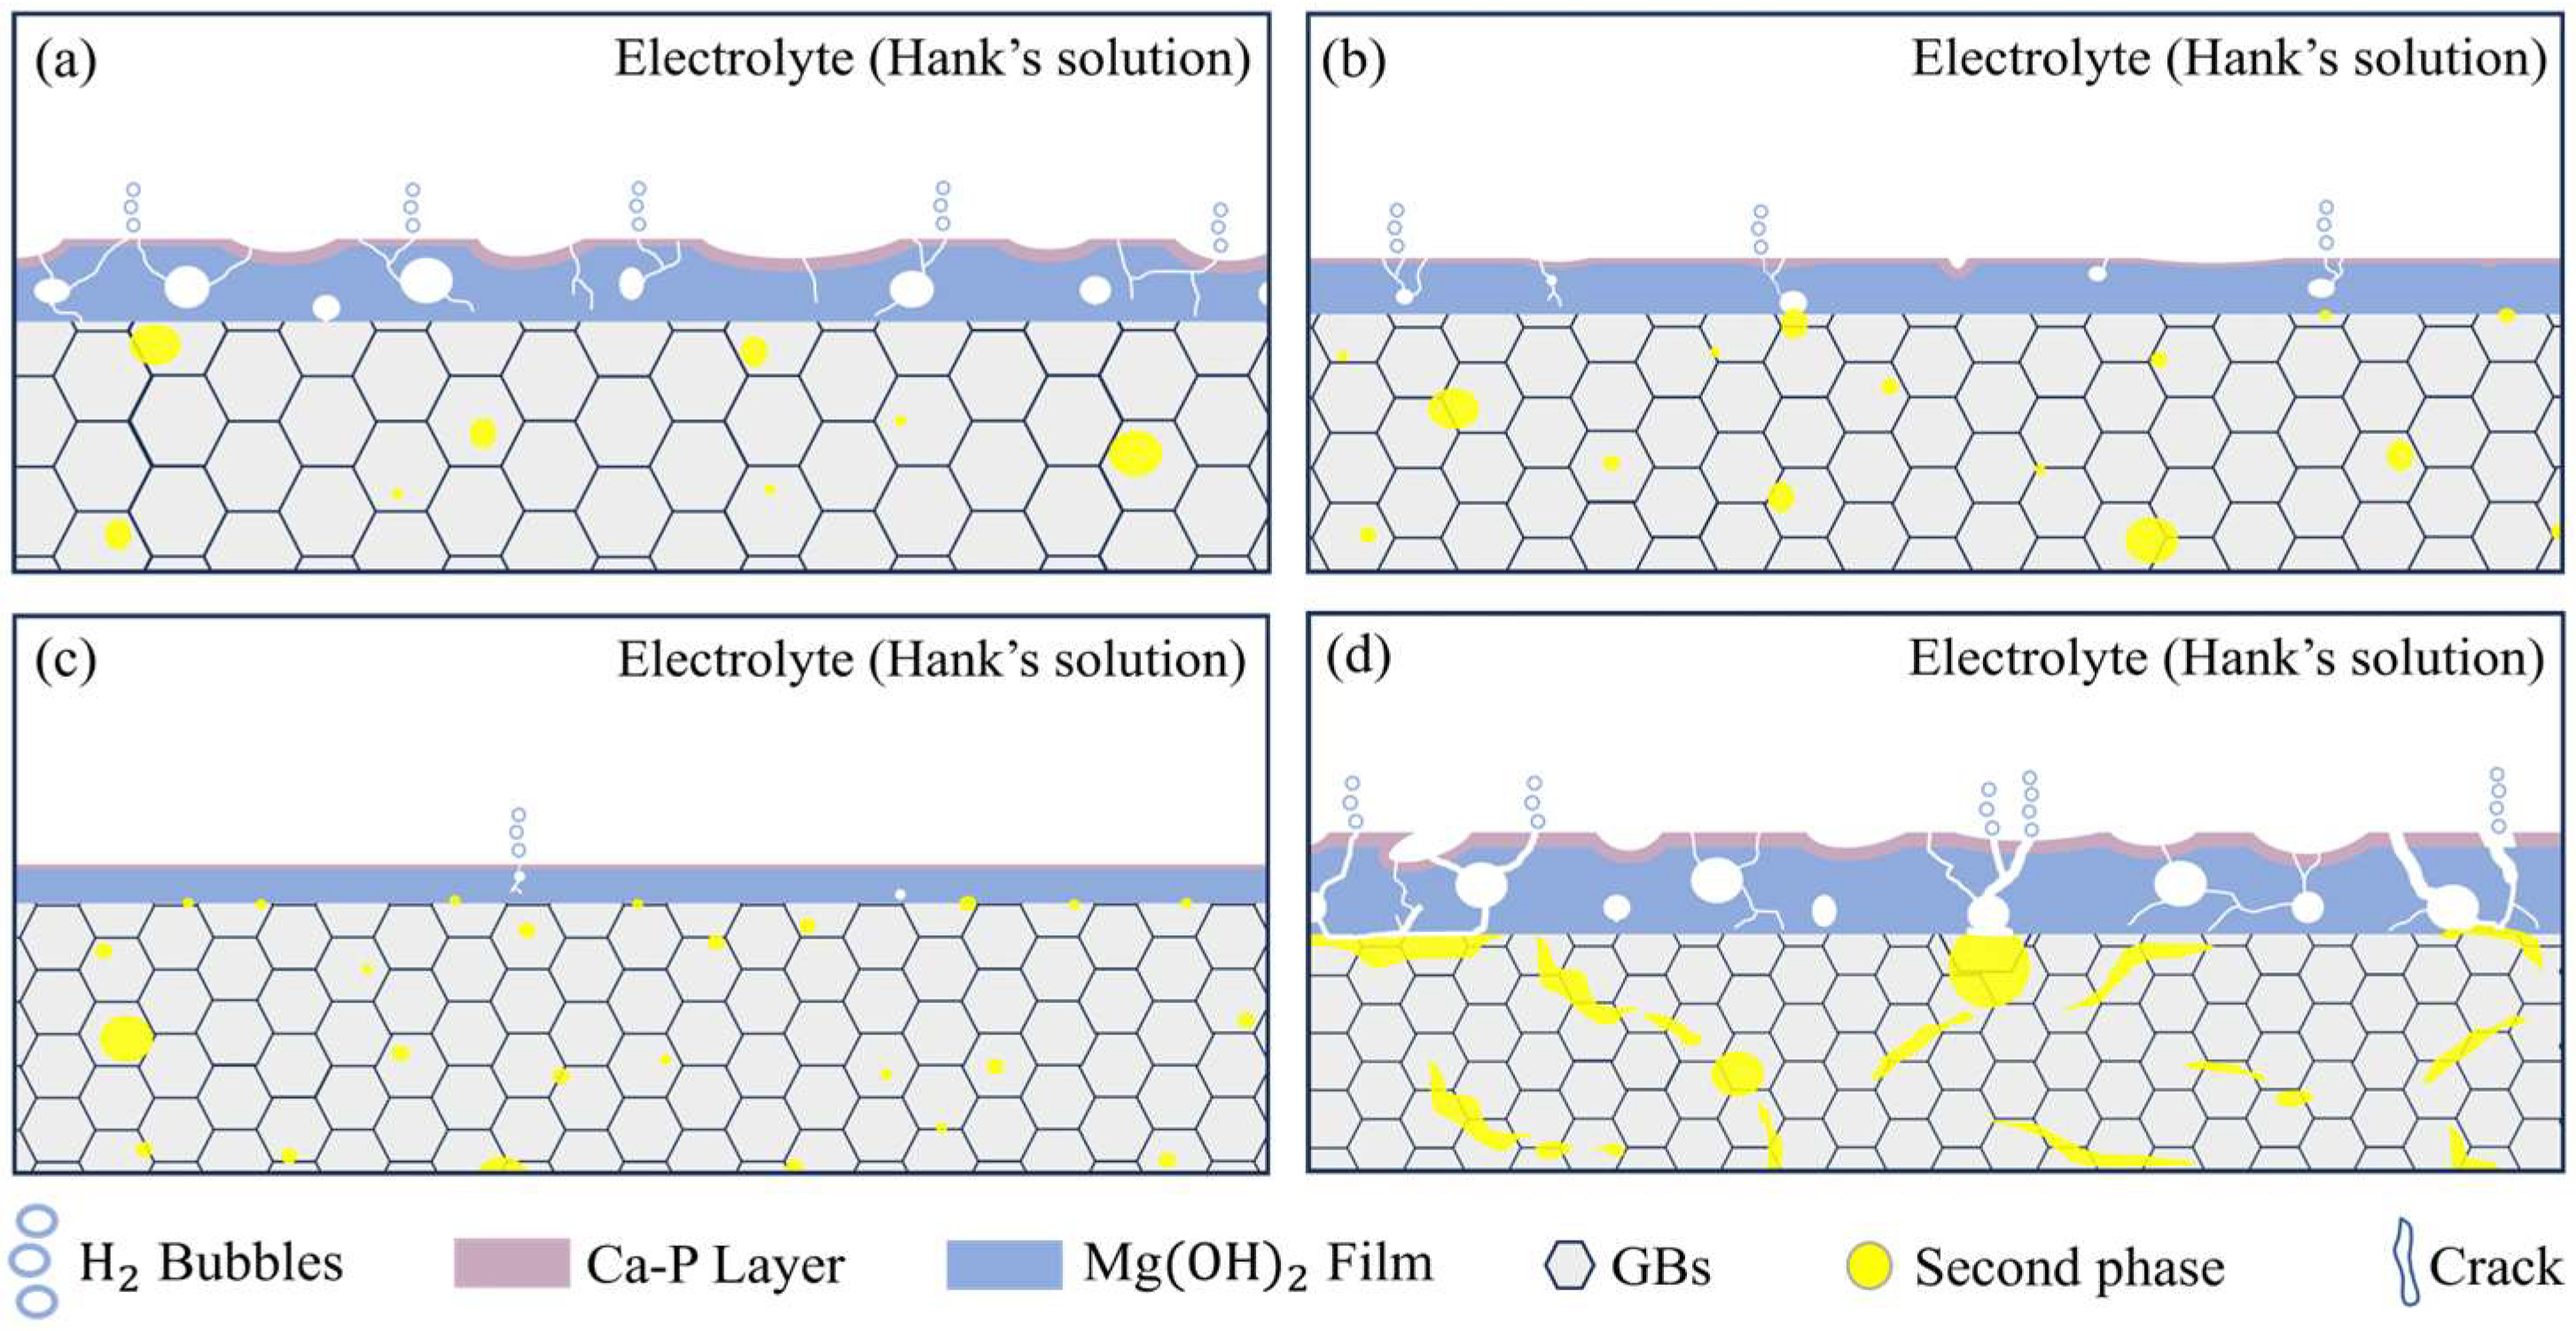
2.7. Quasi-In Situ Corrosion Testing

The specimens for quasi-in situ corrosion analysis were miniature discs of 7 mm in diameter and 3 mm in thickness. They were subjected to grinding and polishing, with a crosshatch inscribed on their surface to enable precise tracking of corrosion patterns at identical specimen sites. Following variable durations of immersion in Hank’s solution, the quasi-in situ corrosion specimens were extracted and their surfaces were decontaminated with ethanol and subsequently air-dried. The post-immersion morphologies of the samples were examined utilizing an optical microscope.

3. Results

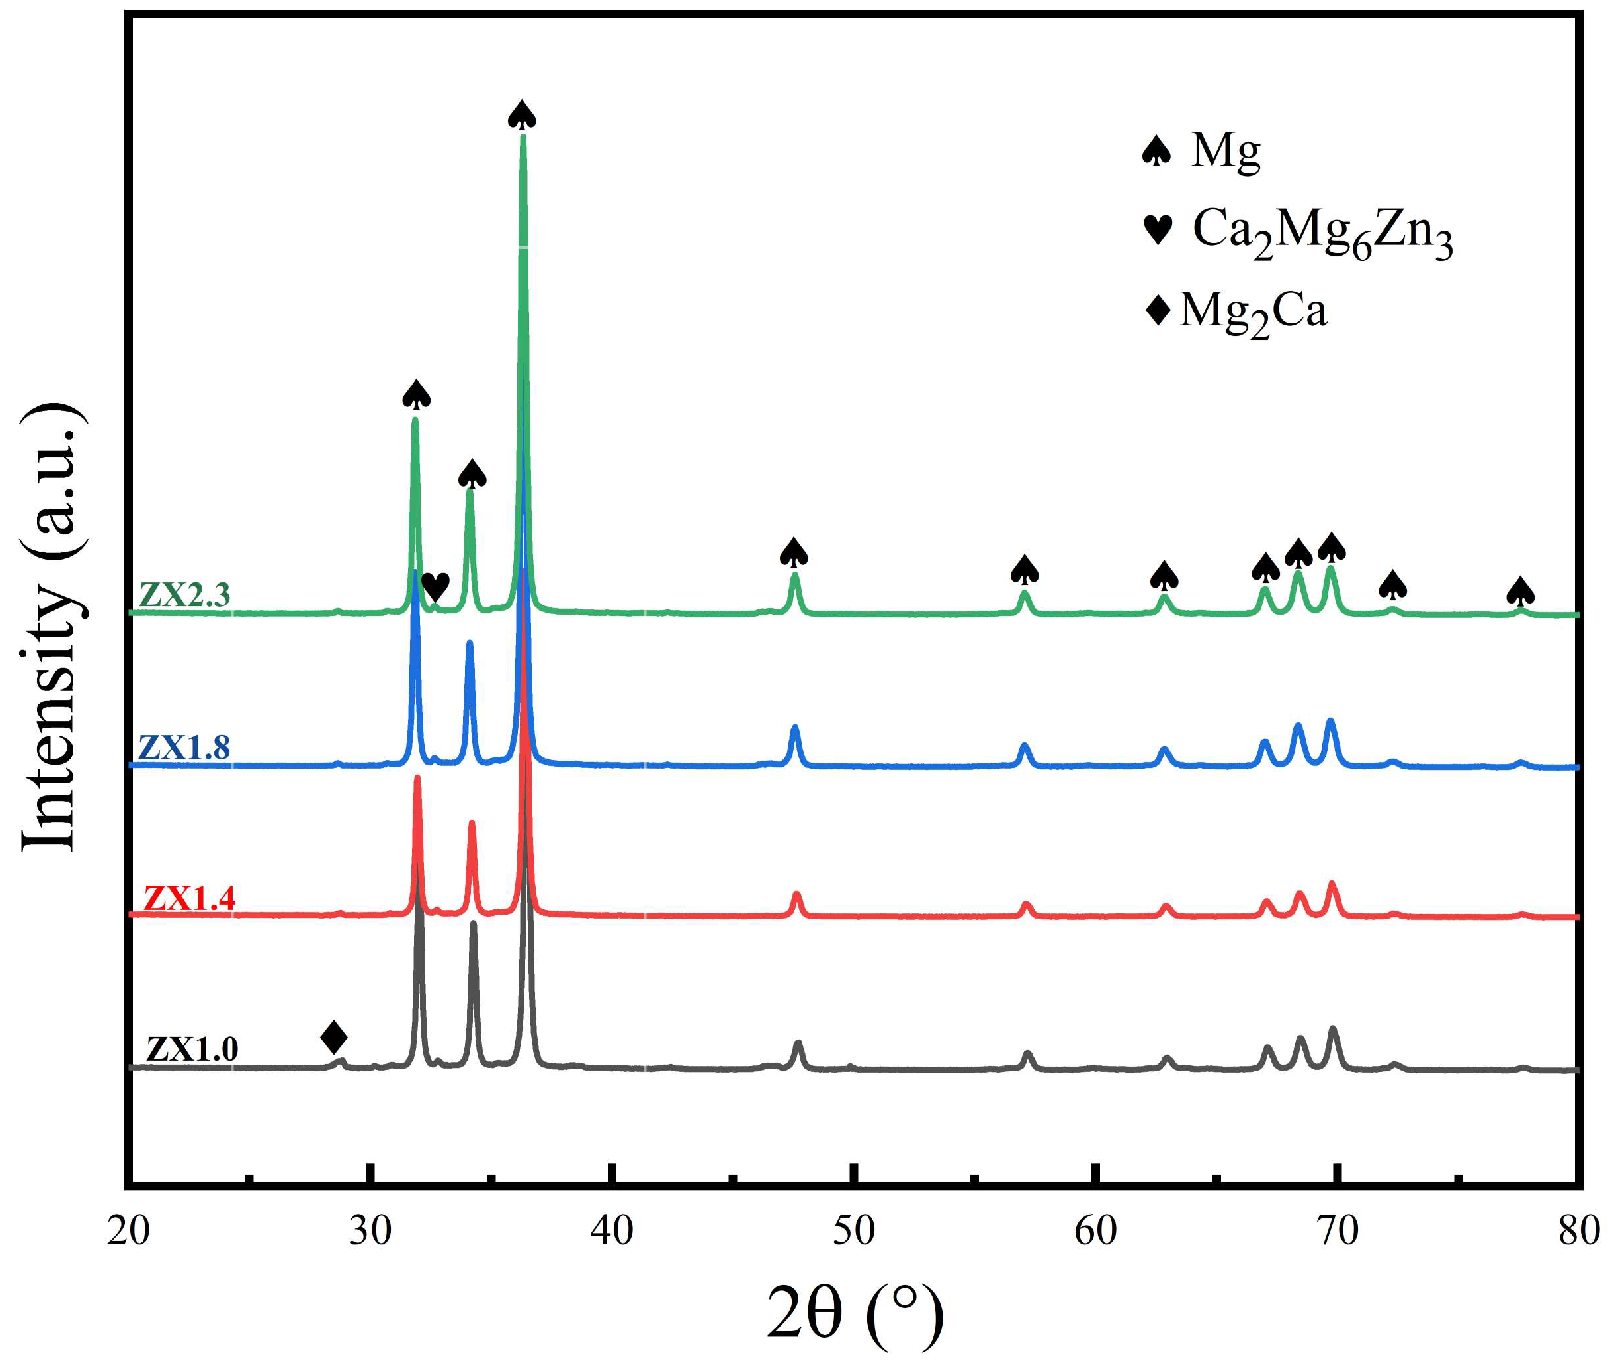
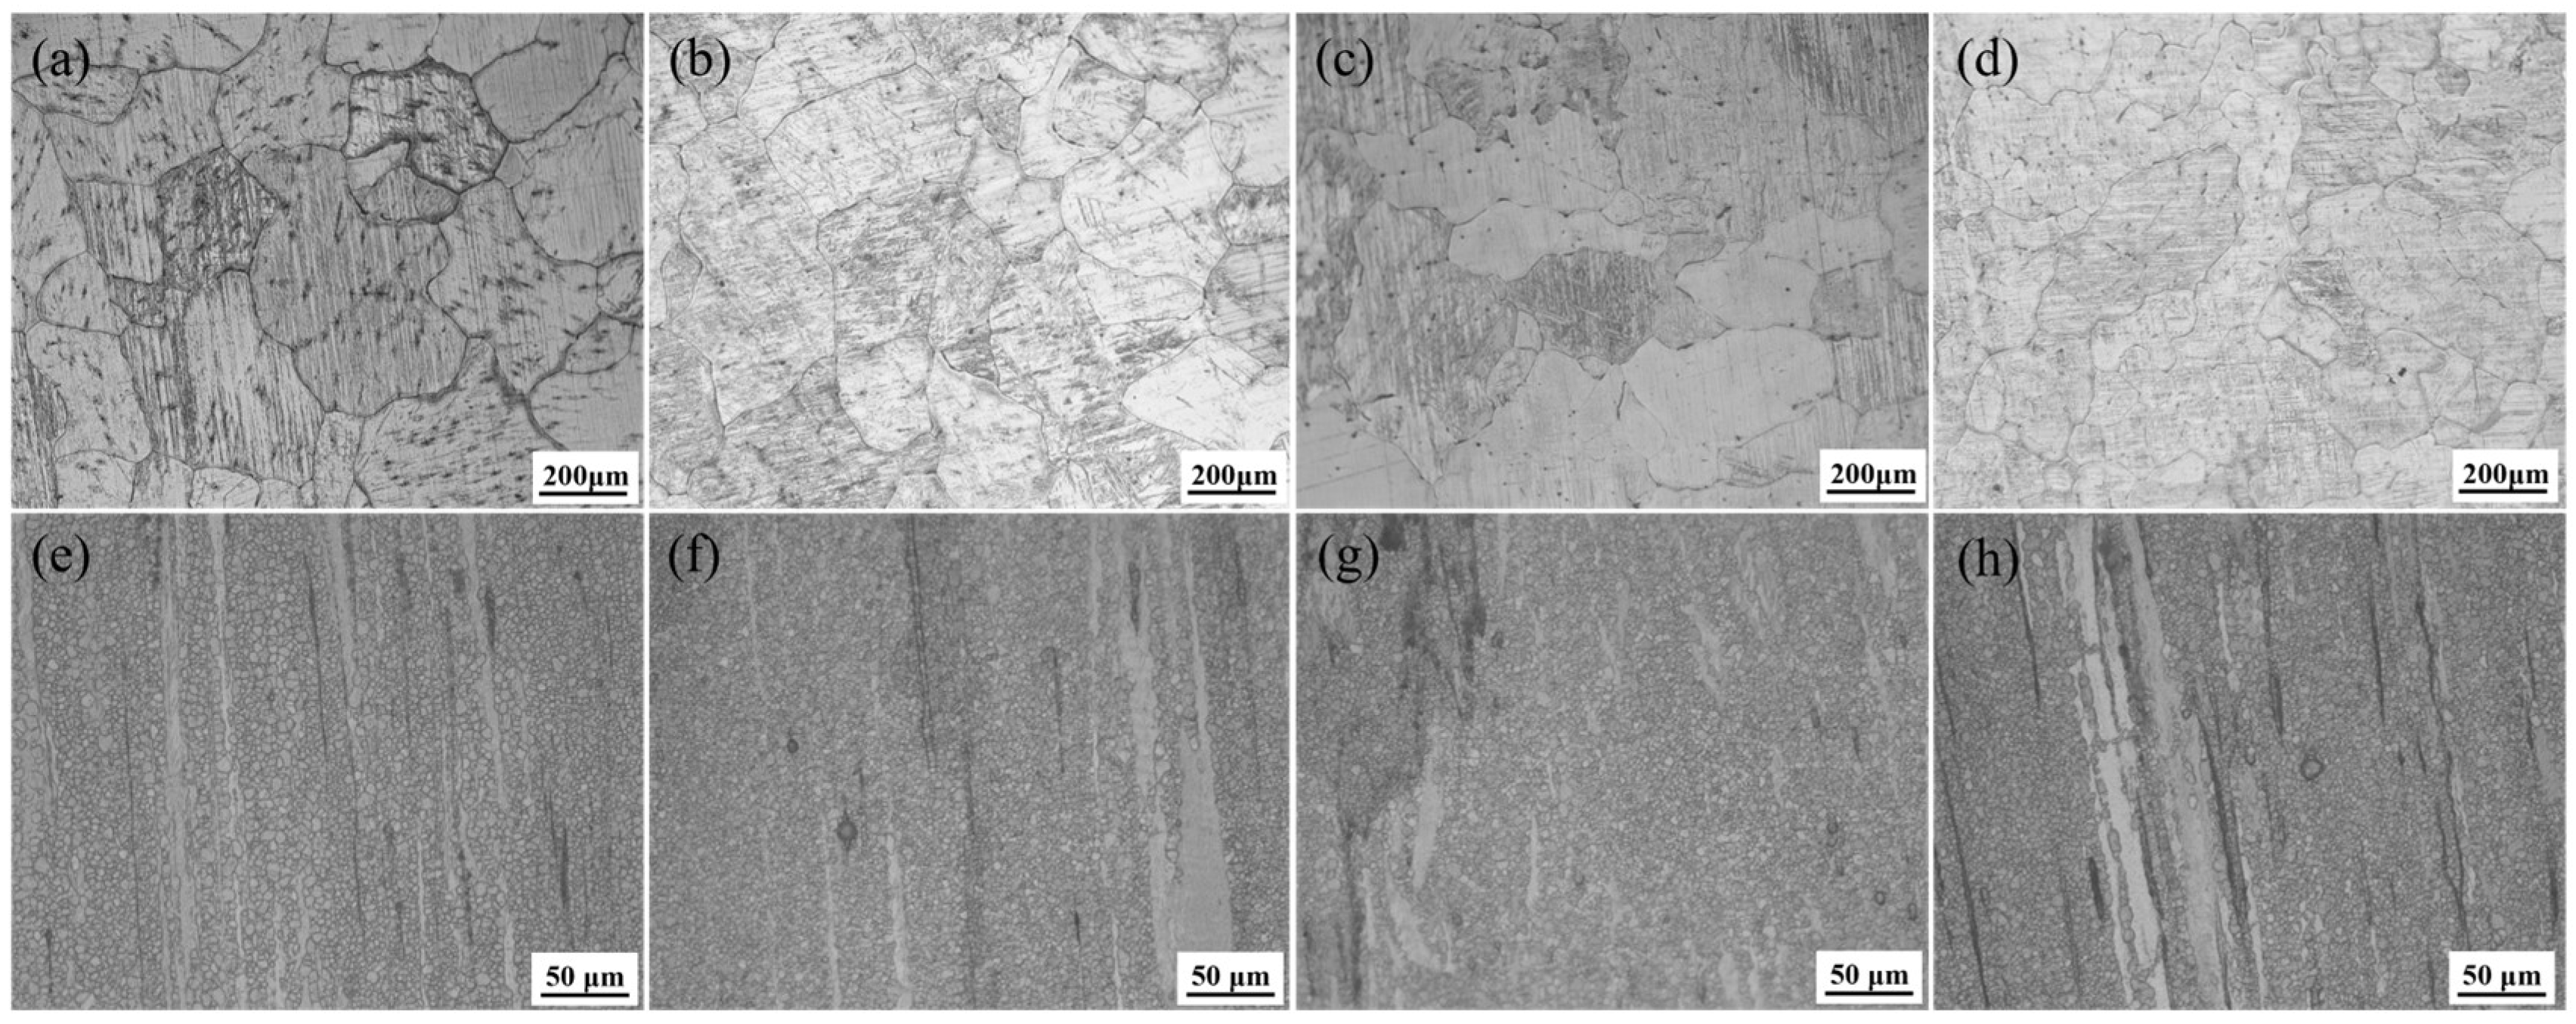
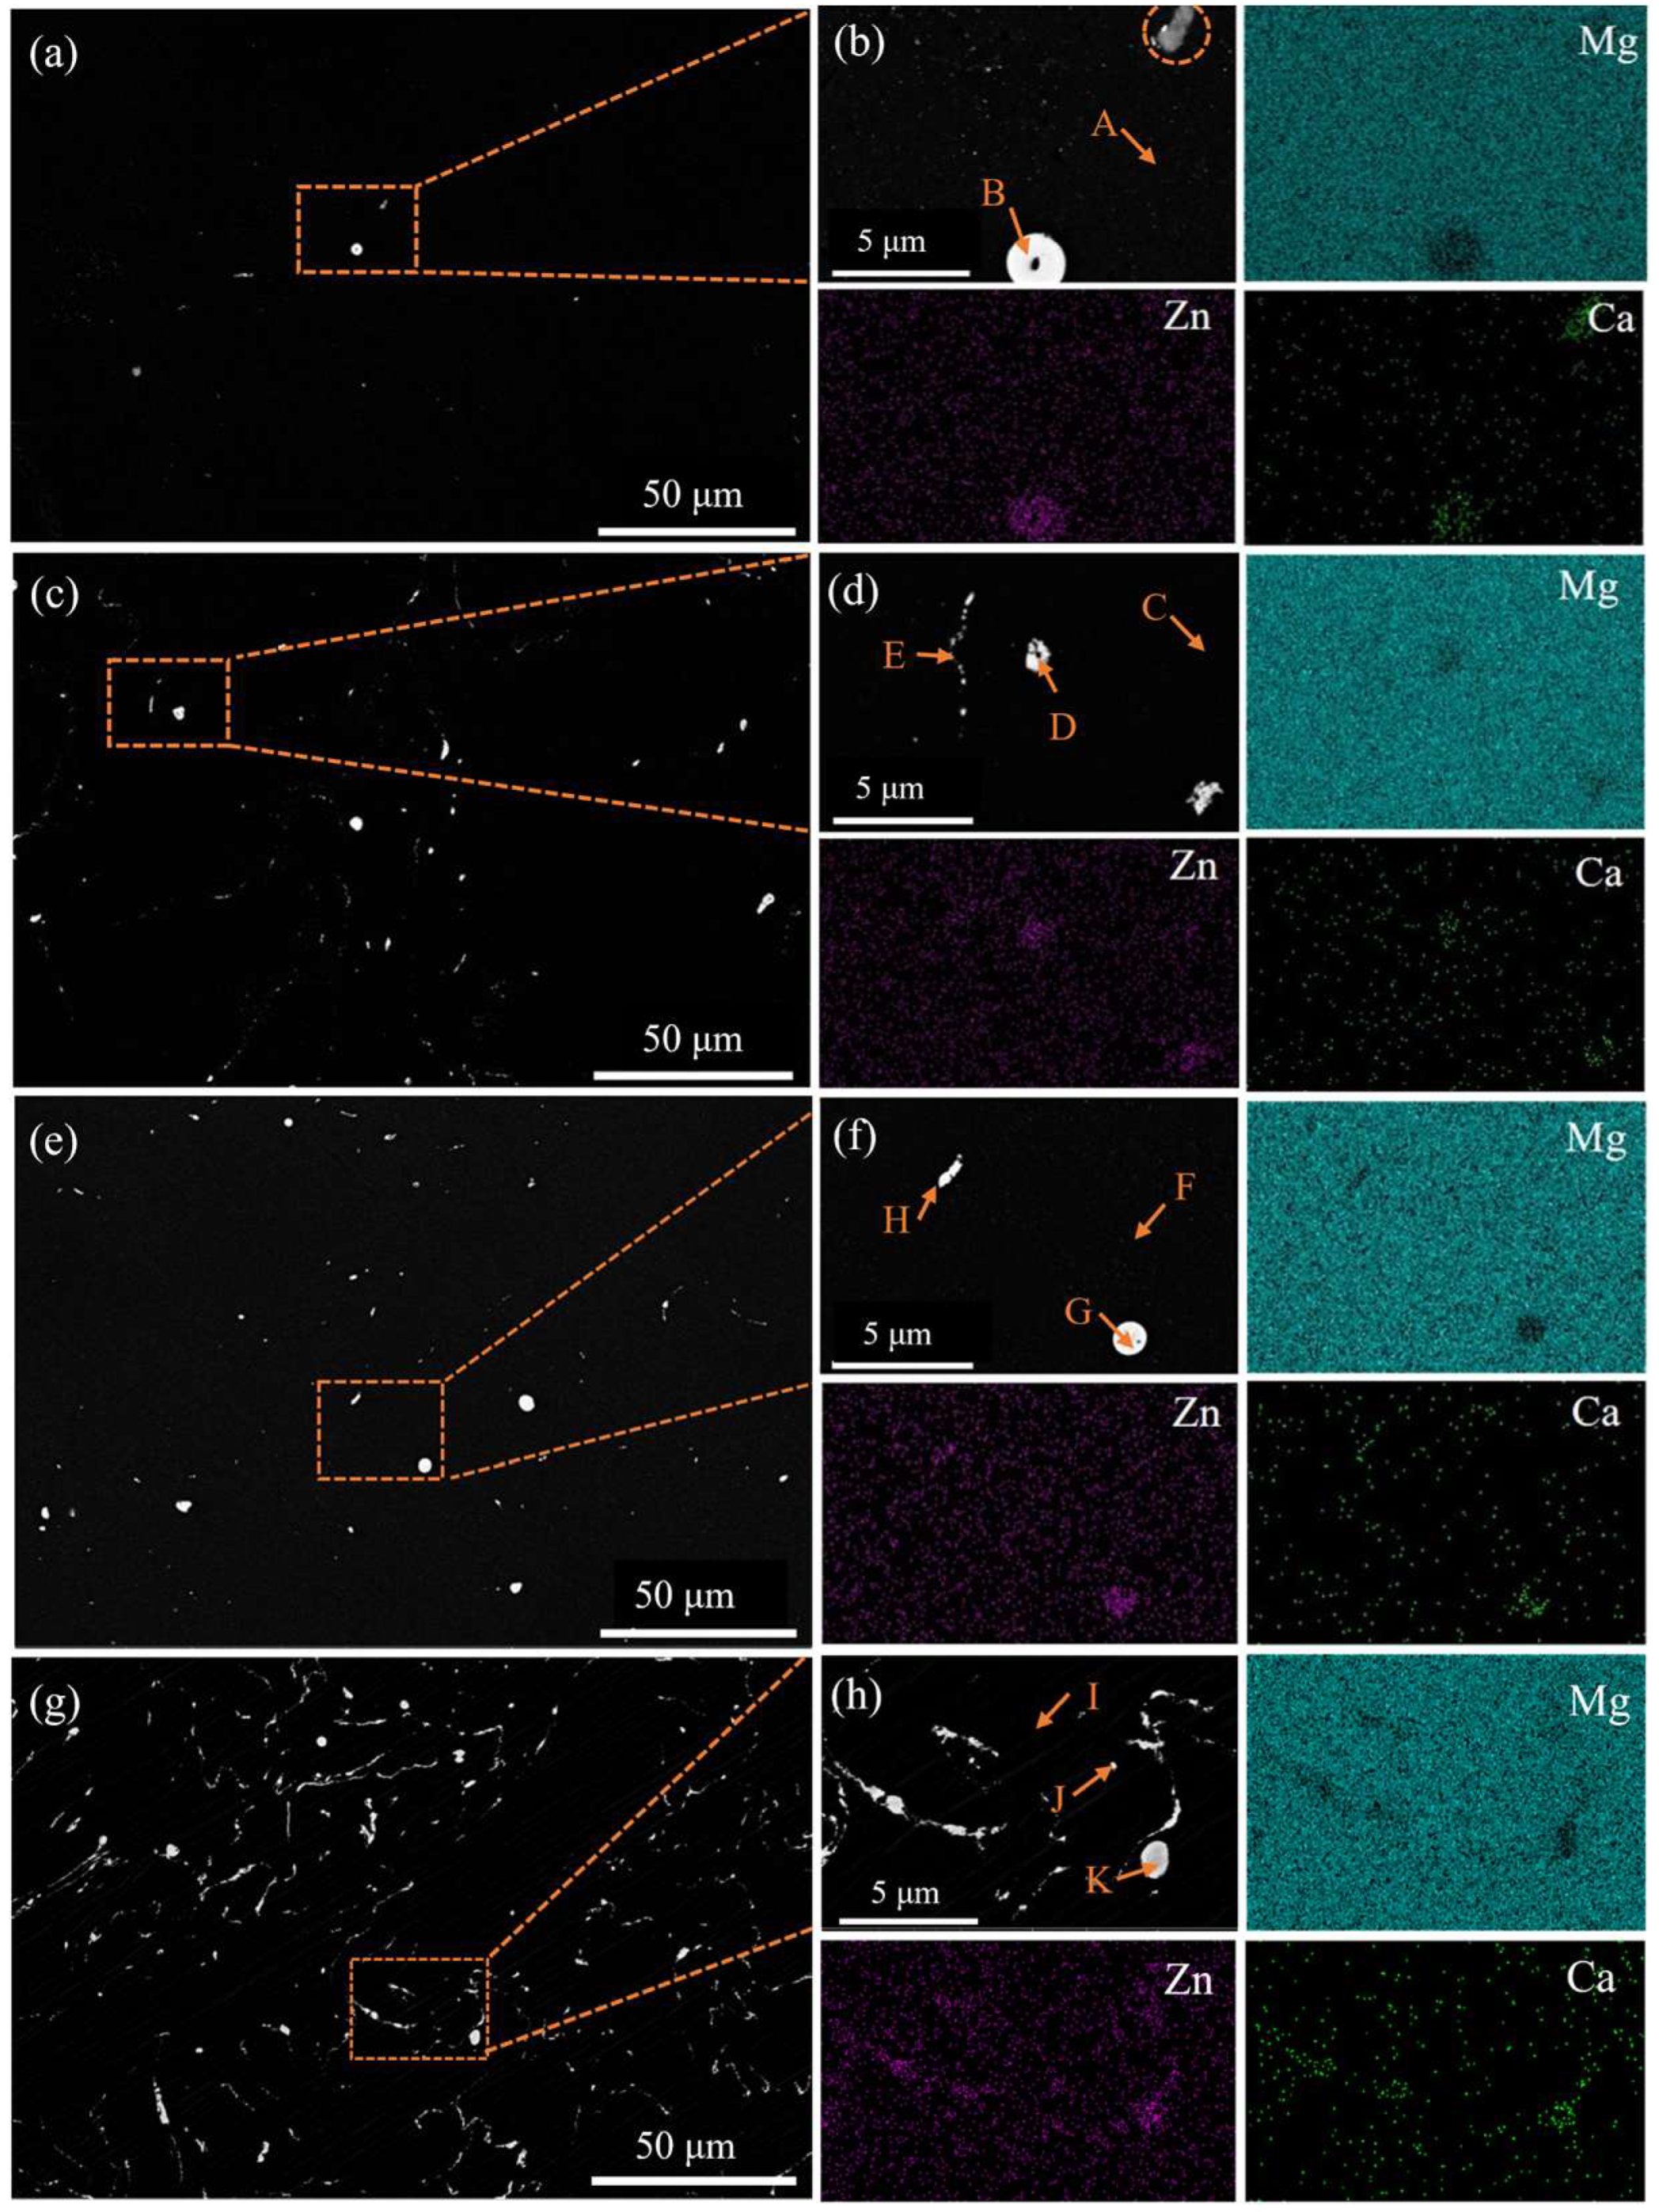
3.1. Microstructural Characterization

The theoretically simulated phase diagrams of the four alloys are shown in Figure 1. Figure 1e–h are localised enlargements of Figure 1a–d, in order to see the trends of the Mg2Ca phase and Ca2Mg6Zn3 phase. From Figure 1a,e, it can be seen that in ZX1.0, α-Mg starts to solidify at 645.4 °C and the Mg2Ca phase starts to precipitate out of α-Mg at 417.3 °C. When the temperature is below 312.2 °C, the Ca2Mg6Zn3 phase starts to appear. At the same time, the Mg2Ca phase is gradually consumed and, at 188.0 °C and below, the Ca2Mg6Zn3 phase forms. As shown in Figure 1b,f, in ZX1.4, α-Mg starts to solidify at 644.2 °C. The Mg2Ca phase starts to precipitate at 417.3 °C. The Ca2Mg6Zn3 phase begins to appear at 360.0 °C and, at 297.0 °C and below, there is exclusively Ca2Mg6Zn3. As in Figure 1c,g, in ZX1.8, α-Mg starts to solidify at 643.1 °C. Similarly, the Mg2Ca phase starts to precipitate at 417.3 °C. The Ca2Mg6Zn3 phase begins to appear at 401.8 °C and, at 384.0 °C and below, there is exclusively the Ca2Mg6Zn3 ternary phase. As shown in Figure 1d,h, for the ZX2.3 alloy, the solidification of α-Mg starts at 640.5 °C. The Mg2Ca phase starts to precipitate at 431.7 °C, the Ca2Mg6Zn3 phase starts to appear at 426.1 °C and, at 100 °C, the Ca2Mg5Zn13 phase starts to appear.
The alloy compositions, possible phases of the four alloys, their corresponding Zn/Ca atomic ratios, α-Mg onset of solidification and second-phase precipitation temperatures are summarized in Table 3.
Figure 2 presents the x-ray diffraction pattern of the extruded Mg-Zn-Ca alloys. It reveals that the predominant phases of the four alloys are α-Mg, Mg2Ca and Ca2Mg6Zn3. Comparatively, the diffractograms of the four alloys exhibit minimal variation. However, the peak strength of the Ca2Mg6Zn3 phase is significantly enhanced in the ZX1.8 and ZX2.3 alloys at 33°. This indicates a higher volume fraction of this phase compared to ZX1.4 and ZX1.0 alloys. All four alloys show a weak Mg2Ca peak at 28.7°, with the ZX1.0 peak being the most pronounced, indicating that an abundant Mg2Ca phase formed. This is slightly different from the theoretical simulated results in Figure 1. With an increasing Zn/Ca ratio, the Mg2Ca phase content gradually decreases. For the ZX2.3 alloy, no peaks of Ca2Mg5Zn13 are found.
Figure 3 shows the metallographic microstructures of the four alloys. Compared with the as-cast state, the microstructure is refined obviously. Meanwhile, the grain size decreases gradually with the increase in Zn and Ca contents. The average grain sizes of extruded ZX1.0, ZX1.4, ZX1.8 and ZX2.3 are 1.87 μm, 1.59 μm, 1.33 μm and 1.28 μm, respectively.
Figure 4 shows the SEM of the four extruded alloys. It is found that the second phases in all four alloy samples are irregular particles or fine bands along the extrusion direction (ED). The volume fractions of the second phase in the four alloys are 1.08%, 1.48%, 2.78% and 5.79%, respectively. A large number of nano-scaled second-phase particles are present in the extruded ZX1.8 alloys and are not recognizable in the EDS spectra due to its resolution limit. EDS analyses of points A, C, F and I show a high solid solubility of Zn in the matrix in Table 4. At the same time, the grain size decreases as the volume fraction of the second phase increases, as shown in Figure 3. This observation suggests that the fine precipitates formed during extrusion greatly impede the grain growth associated with dynamic recrystallization. In addition, the area delineated by the orange circle in Figure 4b is identified as the Mg2Ca phase with no Zn elemental. Except for the irregular particles, there are also semi-continuously point-like particles in the ZX2.3 alloy. Combined with the XRD and the EDS results of the points in Figure 4, it can be concluded that the second phases in the ZX1.0 alloy are Mg2Ca and Ca2Mg6Zn3 and the second phases in ZX1.4, ZX1.8 and ZX2.3 alloys are the Ca2Mg6Zn3 phase.

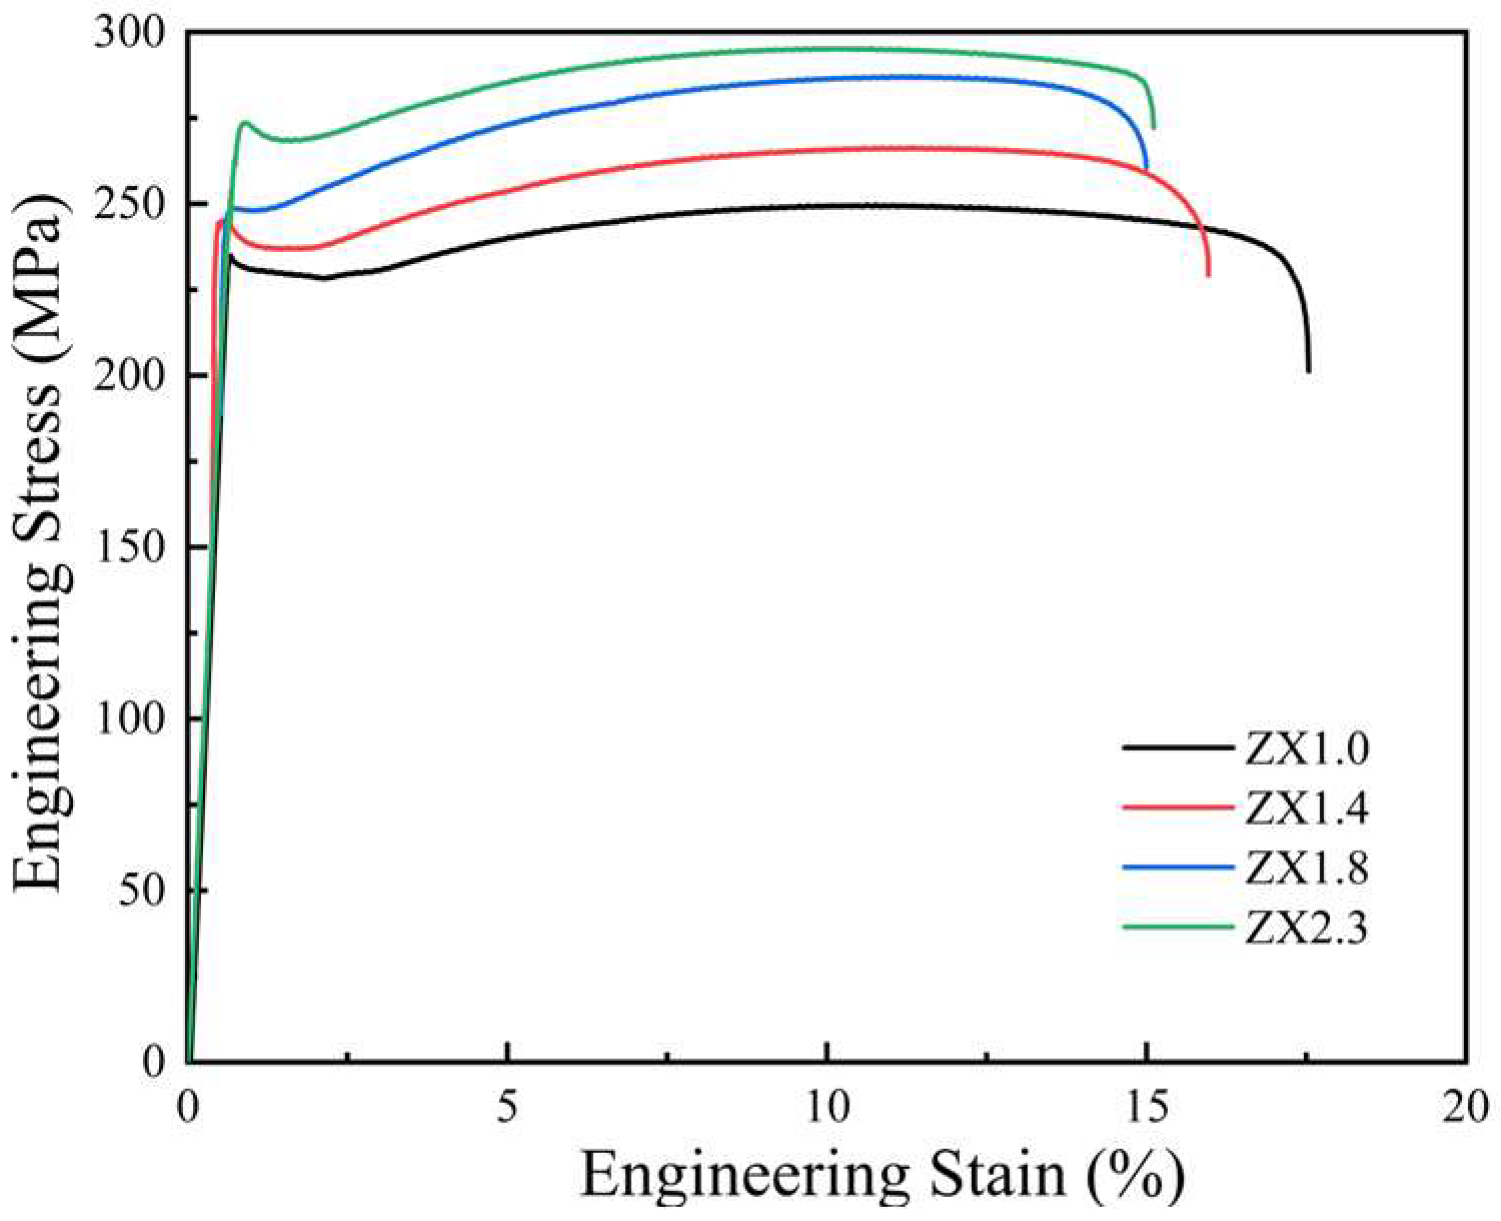
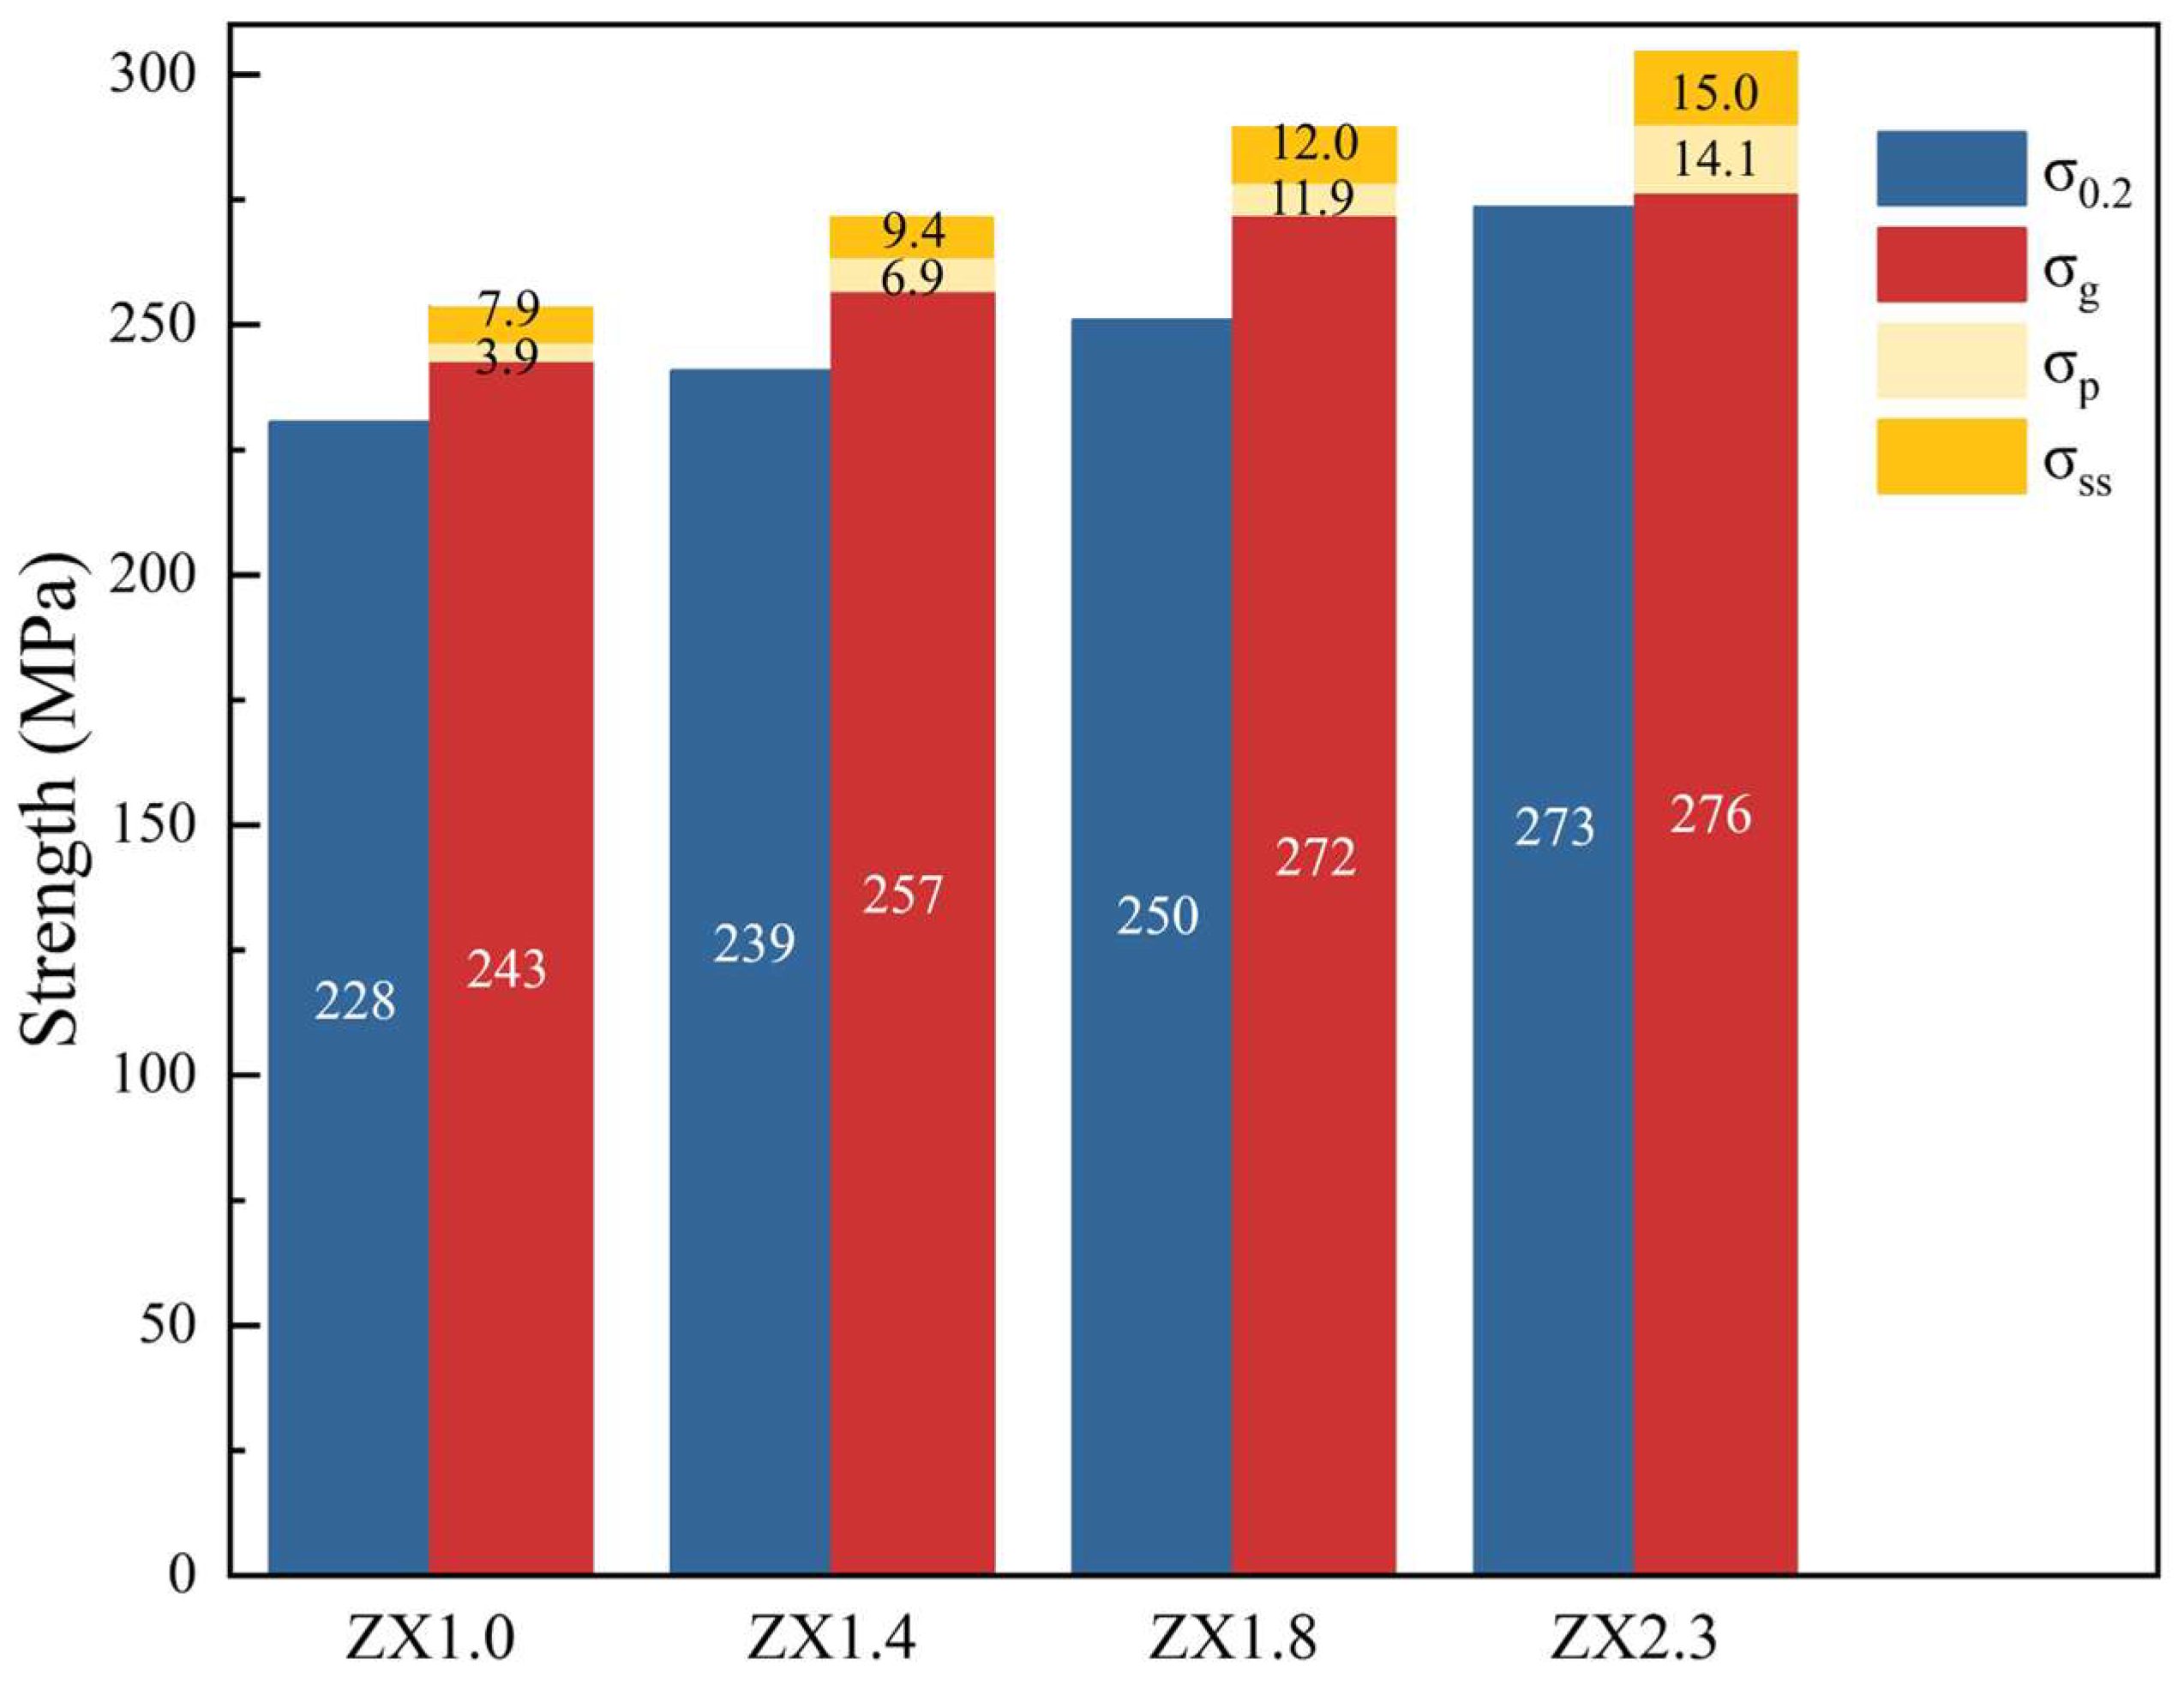
3.2. Mechanical Properties

Figure 5 gives the tensile stress–strain curves of the four extruded alloys. It can be seen that the yield strength (YS) and ultimate tensile strength (UTS) of the alloy in the extruded state increase when increasing the Zn/Ca atomic ratio. The YS of ZX1.0, ZX1.4 and ZX1.8 are 228.5 ± 11.4 MPa, 238.7 ± 11.9 MPa and 249.9 ± 12.5 MPa, respectively, while the UTS are 249.4 ± 12.5 MPa, 266.1 ± 13.3 MPa and 285.6 ± 14.2 MPa, respectively. The extruded ZX2.3 alloy has the highest YS and UTS of 273.4 ± 13.7 MPa and 295.1 ± 14.8 MPa, respectively. Compared to ZX1.0, the YS and UTS of the ZX2.3 alloy increased by 19.6% and 18.3%, respectively.
The elongation of the alloys decreases slightly with the increase in the content of alloying elements. The fracture elongation of ZX1.0, ZX1.4, ZX1.8 and ZX2.3 are 17.5 ± 0.88%, 15.6 ± 0.78%, 14.9 ± 0.75% and 15.1 ± 0.76%, respectively.

3.3. Electrochemical Testing

Figure 6 shows the electrochemical results of the extruded alloys. The polarization curves and impedance electrochemical parameters are shown in Table 5 and Table 6.
The polarization curves showed no significant blunting tendency and minimal change in polarization potential. The polarization potentials of the ZX1.0, ZX1.4 and ZX1.8 alloys increase gradually when increasing the Zn/Ca ratio from −1.312 V to −1.301 V, and the corresponding polarization current density decreases from 4.27 μA/cm2 to 3.33 μA/cm2. ZX2.3 has the lowest polarization potential of −1.32 V, but has the highest polarization current density of 5.13 μA/cm2. This indicates that the ZX2.3 alloy has the highest corrosion rate in the electrochemical corrosion process.
Electrochemical impedance spectra are modeled through the application of an equivalent circuit. The pertinent equivalent circuit model is depicted in Figure 6c to gain deeper insights into the corrosion mechanism. R1 is the solution resistance, R2 is the resistance of the corrosion product layer, R3 is the charge transfer resistance and L denotes the inductive element connected in parallel with R3. n is the standard deviation of the electrochemical parameters obtained from EIS measurements and polarization curves. Similarly, the AC impedance curves show that all alloys have a similar shape, that is, there is a capacitor loop in the mid- and high-frequency regions, and an inductive loop in the low-frequency region for the ZX2.3 alloy. Theoretically, the capacitor loop in the high-frequency region represents the charge transfer between the alloy and the electrolyte interface, the capacitor loop in the mid-frequency region illustrates the formation and dissolution of the corrosion product film and the capacitor loop in the low-frequency region illustrates the localized corrosion of the material. The electrochemical impedance spectroscopy (EIS) results show that the capacitance diameter of the capacitive arc of the alloy in the extruded state increases gradually when increasing the Zn/Ca atomic ratio. Finally, ZX2.3 gives the minimum capacitance diameter of the capacitive arc. When combining the results of EIS and equivalent circuits, it can be seen that for the same Zn/Ca atomic ratio, the corrosion resistance decreases when the Zn and Ca contents exceed 2.5 wt.%.
Figure 7 shows the average annual corrosion rate and pH variation curves for extruded alloys in Hank’s at different immersion times. The corrosion rates of each alloy tend to decrease with an increasing immersion time. This agrees well with the change in pH, which decreases as the immersion time increases. The pH values of ZX1.0, ZX1.4, ZX1.8 and ZX2.3 were 8.8, 8.6, 8.53 and 8.98, respectively, after 336 h (14 days) of immersion. After 336 h of immersion, the ZX1.8 alloy with a Zn/Ca atomic ratio of 4 has the lowest average annual corrosion rate of 0.14 mm/y. The fastest corrosion rate is 0.325 mm/y for ZX2.3.
Figure 8 shows the surface morphology of samples after the removal of corrosion products following 24 h and 168 h of immersion. The area marked by the dotted line is attacked severely during corrosion. After 24 h of immersion, the extruded alloys show minimal corrosion, and there are only minor corrosion features in localized areas. After 168 h (7 days) of immersion, the severity of corrosion increases significantly for all four extruded alloys. Specifically, the ZX1.0 alloy exhibits significant edge detachment. The surfaces of ZX1.4 and ZX1.8 alloys show pitting corrosion at different depths. More pits appear on the surface of the ZX2.3 alloy, and localized corrosion gradually expands.

4. Discussion

4.1. Impact of Zn/Ca Ratio on the Microstructure

XRD (Figure 2) and SEM results (Figure 4) show that the second phase of the four alloys is predominantly Ca2Mg6Zn3, with only a small amount of the Mg2Ca phase in ZX1.0. This is because the enthalpy of the mixing of Zn-Ca is much higher than that of Mg-Zn and Mg-Ca [23]. With an increasing Zn content, Ca atoms tend to combine with Zn atoms preferentially and form Ca2Mg6Zn3. At the same time, the increase in Zn content leads to an increase in the volume fraction of the second phase. The high-volume second phase breaks up during the hot extrusion process and, together with the fresh precipitates, triggers the particle stimulated nucleation (PSN) mechanism and promotes dynamic recrystallization [24,25,26]. In addition, many Ca2Mg6Zn3 particles smaller than 1 μm were present in the extruded ZX1.8 alloy, as shown in Figure 4c,e. These particles were probably thermally precipitated during the hot extrusion process. Under zener pinning pressure, these fine particles impede dislocation motion and inhibit the dynamic recrystallization grain growth [24,27]. As a result, the alloy grain size decreases as the Zn content increases.

4.2. Influence of the Zn/Ca Ratio on the Mechanical Properties

Changes in the Zn/Ca atomic ratio are usually accompanied by the changes in the second phase [28,29]. In this study, the volume fraction of the Ca2Mg6Zn3 phase increases with an increasing Zn content. These second-phase particles increase the strength of the alloy by inhibiting the dislocation motion [30,31].
At the same time, fine grain strengthening is also an important reason for the improvement of mechanical properties [32]. The average grain sizes of the four materials after extrusion are 1.87 μm, 1.59 μm, 1.33 μm and 1.28 μm, respectively, which are positively correlated with the increase in alloy strength.
In general, the strengthening mechanism of Mg alloys can be described by the following Equation (3) [33]:
σ y = σ s s + σ g + σ p + σ d
σ y represents the yield strength of the material. σ s s , σ g , σ p   and σ d represent solid solution strengthening, grain refinement strengthening, second phase strengthening and dislocation strengthening, respectively.
It can be observed by SEM (Figure 4) that a large number of second phases are present in the extruded alloy, so most of the alloying elements are present in the form of second phases. In addition, the Ca contents in the matrix of the four extruded alloys did not vary much (points A, C, F and I in Table 3), so the contribution of solid solution strengthening ( σ s s ) to the total strength of the extruded alloy is mainly related to Zn. After extrusion, the alloy undergoes nearly complete recrystallization, and the dislocation density in the recrystallized regions is relatively low. Therefore, σ d can be ignored, meaning the strengthening of the extruded alloy mainly originates from σ s s , σ g and σ p .
The solid solution strengthening ( σ s s ) can be calculated according to Equation (4) [34]:
σ s s = k · X 2 / 3
k is the average scale factor of the tensile or compressive yield strength of Mg-Zn alloys. The average values for tensile and compressive yield strengths are 10 MPa and 11 MPa, respectively [35,36]. X is the atomic percentage of solute atoms in the matrix. Based on the results in Table 3, the strengths resulting from solid solution strengthening of the material can be calculated as 7.9 MPa, 9.4 MPa, 12.0 MPa and 15.0 MPa, respectively.
The grain boundary strengthening can be calculated using the Hall–Petch Equation (5) [37]:
σ g = σ 0 + k · d 1 / 2
Among others,   σ 0 denotes the friction of the dislocation sliding on the slip surface, which is 90 MPa for the Mg alloy. k is a constant, 210 MPa·μm1/2 for the Mg-Zn-Ca alloy [38]. d is the average grain size. Therefore, the strengths produced by grain boundary strengthening are 243 MPa, 257 MPa, 272 MPa and 276 MPa, respectively.
The strengthening effect of the second phase on Mg alloys depends mainly on the size and volume fraction of the second phase. In this case, if the force is transferred from the matrix to the second phase, denoted as σ L T , the second phase comprises particle-guided Orowan strengthening, denoted σ O R [39,40].
σ p = σ L T + σ O R
σ L T = 1 2 · σ M · f s
σ O R = M · f s · 0.81 G b 2 π 1 υ 1 2 · ( l n d s b · d s 2 · 3 π 2 f s d s 1 )
In Equations (5)–(7), σ M is the yield strength of the Mg matrix ( σ M = σ 0 + σ g ). f s is the volume fraction of the second phase. M (2.5) is Taylor’s coefficient. G is the shear modulus ( G = 40 GPa). b is the Berber vector ( b = 0.32 nm).   υ is the Poisson ratio ( υ = 0.2). d s is the average grain size of the extruded alloy. From Equation (6), σ L T for the four extruded alloys is 1.8 MPa, 2.6 MPa, 5.1 MPa and 5.8 MPa, respectively. σ O R is 2.1 MPa, 4.3 MPa, 6.8 MPa and 8.3 MPa, respectively. Therefore, the second phase strengthening σ p in the extruded alloys is 3.9 MPa, 6.9 MPa, 11.9 MPa and 14.1 MPa, respectively. It can be seen that the contribution of the second-phase strengthening gradually increases when increasing the Zn/Ca atomic ratio and the total element content.
The contributions of grain boundary strengthening and second-phase strengthening to the alloys are shown in Figure 9. It can be seen that the increase in strength of extruded alloys mainly comes from grain boundary strengthening. The contribution of second-phase strengthening is relatively weak though it increases when increasing the total alloying content.

4.3. Effect of Zn/Ca Ratio on Corrosion Resistance of Alloys

The corrosion resistance of ZX1.0, ZX1.4 and ZX1.8 increases with an increasing Zn/Ca atomic ratio. For ZX1.4 and ZX2.3, the content of the second phase as well as the morphology becomes the dominant factors determining corrosion at the same Zn/Ca ratio. In order to gain a concrete understanding of this, the sectional morphology of the corrosion product layer after 7 days of immersion in Hank’s solution was observed, and the potential difference between the second phase and Mg matrix was tested.
Figure 10 shows the cross-sectional corrosion patterns of the samples after 7 days of immersion in Hank’s solution. It shows that the thickness of the corrosion product layer decreases as the Zn/Ca ratio increases. But the thickness of the corrosion product layer in ZX2.3 increases again, with an average thickness of 17.4 μm, which is more than twice the thickness of the ZX1.8 corrosion product layer.
The EDS mapping shows that the corrosion product layer of the material after immersion in Hank’s solution mainly consists of elements of Ca, P, O and Zn. It was reported that the simultaneous appearance of P and Ca elements in the product layer suggested the formation of HA, which had the effect of protecting the substrate. From the EDS results, it can be found that there is a more obvious distribution of O elements in the corrosion product layers of the four alloys, while P and Ca elements are only vaguely visible in the corrosion layers of alloys ZX1.8 and ZX2.3. In addition, according to the element distribution, the corrosion product layer of ZX1.8 is the densest, while the corrosion product layer of ZX1.0, ZX1.4 and ZX2.3 alloys is thick and loose.
In general, grain refinement plays a key role in the corrosion performance of extruded Mg-Zn-Ca alloys, which allows the material to form a continuous dense film in a very short period of time [41,42,43,44]. However, this is not reflected in the ZX2.3 alloy. The second phases of alloys ZX1.0, ZX1.4 and ZX1.8 are uniformly distributed, and there is no significant change in the size of them. This promotes the uniform deposition of the corrosion products and the formation of a dense corrosion product layer [45]. In ZX2.3, the high-volume second phases are interconnected. Lei et al. [46] found that the reduction in the second-phase spacing led to a high degree of overlap in galvanic coupling corrosion, which was detrimental to the alloy’s corrosion performance. If the distances were small enough, corroded areas could interconnect and lead to severe corrosion on a large scale. As a result, the ZX2.3 alloy has a much higher corrosion rate than the other three alloys, even with the same Zn/Ca ratio as ZX1.4.
Figure 11 shows AFM results of the extruded alloy. As can be seen from the figure, the potential difference between Ca2Mg6Zn3 and the matrix is 122 mV in ZX1.0; therefore, Ca2Mg6Zn3 is the cathode during corrosion due to its high potential. With an increasing Zn/Ca atomic ratio, the potential difference between Ca2Mg6Zn3 and the Mg matrix is 142 mV in ZX1.4. The potential difference between the Ca2Mg6Zn3 phase and Mg matrix in ZX1.8 varies, with a 125 mV and a 168 mV. This difference may be attributed to the different element contents in various Ca2Mg6Zn3 particles. The Ca2Mg6Zn3 phase of ZX2.3 has an average potential difference of 158 mV with the Mg matrix, which is higher than that of ZX1.4. This indicates that the total element content changed some of the properties of the phase though they had the same Zn/Ca ratio.
In general, a large potential difference between the second phase and the matrix accelerated the micro-galvanic corrosion of the material [47]. It is known that the standard potentials of Ca and Zn are −2.375 V and −0.76 V, which are lower and higher than that of Mg (−2.37 V), respectively [48,49]. From Table 4, it can be seen that the contents of Zn (9.68 at. %) and Ca (9.4 at. %) in Ca2Mg6Zn3 phases (ZX1.0) are almost the same and have less of a gap with the matrix content, so the second phase in ZX1.0 has less of a potential difference with the matrix. As the Zn/Ca ratio increases, the effect of Zn in the alloy on the corrosion potential changes, increasing the potential difference between the second phase and the Mg matrix. For example, in ZX1.8, there is 20% more Zn than Ca in the Ca2Mg6Zn3 phase, and there is more Zn in the second phase compared to the matrix. Thus, the potential difference between the alloy and the matrix gradually increases as the Zn/Ca ratio increases.
Figure 12 shows the diagram of the corrosion mechanism in conjunction with the above results. These fine and uniformly distributed second-phase particles contribute the uniform corrosion and form a layer of stable corrosion products, which effectively hinder the penetration of the corrosive solution into the Mg matrix through the cracks. The high volume fraction and high potential difference of the Ca2Mg6Zn3 phase in ZX2.3 exacerbate the galvanic corrosion, producing corrosion pits and cracks, and eventually lead to rupture of the corrosion product layer.

5. Conclusions

This work focuses on the impacts of the Zn/Ca atomic ratio and total element content on the microstructure, mechanical properties and corrosion properties of low-alloyed Mg-Zn-Ca alloys in the extruded state, and the following conclusions can be drawn:
(1) The second phase of the alloy in the extruded state varies with the Zn/Ca atomic ratio and is predominantly Ca2Mg6Zn3 in the four alloys. At a Zn/Ca ratio of 2, the ZX1.0 alloy shows a small amount of the Mg2Ca phase.
(2) Fine grain strengthening and second-phase strengthening are the main reasons for the alloy’s increased strength. The second phase and grain refinement achieve a balanced impact on the ductility of Mg-Zn-Ca alloys, leading to a relatively similar plasticity.
(3) When increasing the Zn/Ca ratio, the potential difference between Ca2Mg6Zn3 and the Mg matrix increased, resulting in an increase in galvanic corrosion. The negative effect of the volume fraction of the second phase and the positive effect of the fine grain size determine the corrosion performance together.

Author Contributions

Y.J.: Conceptualization, Data Curation, Writing—Review and Editing, Writing—Original Draft, Validation, Software, Investigation, Methodology. S.L.: Conceptualization, Methodology, Resources, Supervision, Validation, Visualization, Writing—Review and Editing. Q.Y.: Conceptualization, Formal Analysis, Investigation, Methodology. M.C.: Conceptualization, Funding Acquisition, Project Administration, Supervision, Visualization, Writing—Original Draft, Writing—Review and Editing. All authors have read and agreed to the published version of the manuscript.

Funding

This research was funded by the National Natural Science Foundation of China (Nos. 52201301 and 52171241), Tianjin Nature Science Foundation (22JCQNJC00750), Science and Technology Correspondent Project of Tianjin (24YDTPJC00180), Cooperation Project for Basic Research of Beijing-Tianjin-Hebei (22JCZXJC00130) and Chongqing Postdoctoral Science Special Foundation (2022CQBSHTB3025).

Data Availability Statement

The data presented in this study are available on request from the corresponding author (privacy).

Conflicts of Interest

The authors declare no conflict of interest.

References

  1. Chen, L.; Zhu, J.; Ge, N.; Liu, Y.; Yan, Z.; Liu, G.; Li, Y.; Wang, Y.; Wu, G.; Qiu, T.; et al. A biodegradable magnesium alloy promotes subperiosteal osteogenesis via interleukin-10-dependent macrophage immunomodulation. Biomaterials 2025, 318, 122992. [Google Scholar] [CrossRef] [PubMed]
  2. Singh, J.; Hashmi, A.W.; Ahmad, S.; Tian, Y. Critical review on biodegradable and biocompatibility magnesium alloys: Progress and prospects in bio-implant applications. Inorg. Chem. Commun. 2024, 169, 113111. [Google Scholar] [CrossRef]
  3. Yang, Y.; Xiong, X.; Chen, J.; Peng, X.; Chen, D.; Pan, F. Research advances in magnesium and magnesium alloys worldwide in 2020. J. Magnes. Alloy. 2021, 9, 705–747. [Google Scholar] [CrossRef]
  4. Wang, J.; Tang, J.; Zhang, P.; Li, Y.; Wang, J.; Lai, Y.; Qin, L. Surface modification of magnesium alloys developed for bioabsorbable orthopedic implants: A general review. J. Biomed. Mater. Res. Part B: Appl. Biomater. 2012, 100B, 1691–1701. [Google Scholar] [CrossRef]
  5. Baigonakova, G.; Marchenko, E.; Zhukov, I.; Vorozhtsov, A. Structure, cytocompatibility and biodegradation of nanocrystalline coated Mg-Ca-Zn alloys. Vacuum 2022, 207, 111630. [Google Scholar] [CrossRef]
  6. Kumar Rout, P.; Roy, S.; Rathore, D. Recent advances in the development of Mg-Ca-Zn alloys as biodegradable orthopedic implants. Mater. Today Proc. 2024, 115, 24–30. [Google Scholar] [CrossRef]
  7. Eide, D.J. Transcription factors and transporters in zinc homeostasis: Lessons learned from fungi. Crit. Rev. Biochem. Mol. Biol. 2020, 55, 88–110. [Google Scholar] [CrossRef]
  8. Bowen, P.K.; Guillory, R.J.; Shearier, E.R.; Seitz, J.-M.; Drelich, J.; Bocks, M.; Zhao, F.; Goldman, J. Metallic zinc exhibits optimal biocompatibility for bioabsorbable endovascular stents. Mater. Sci. Eng. C 2015, 56, 467–472. [Google Scholar] [CrossRef]
  9. Freeman, S.P.H.T.; Beck, B.; Bierman, J.M.; Caffee, M.W.; Heaney, R.P.; Holloway, L.; Marcus, R.; Southon, J.R.; Vogel, J.S. The study of skeletal calcium metabolism with 41Ca and 45Ca. Nucl. Instrum. Methods Phys. Res. Sect. B Beam Interactions Mater. Atoms 2000, 172, 930–933. [Google Scholar] [CrossRef]
  10. Zareian, Z.; Emamy, M.; Malekan, M.; Mirzadeh, H.; Kim, W.; Bahmani, A. Tailoring the mechanical properties of Mg-Zn magnesium alloy by calcium addition and hot extrusion process. Mater. Sci. Eng. A 2020, 774, 138929. [Google Scholar] [CrossRef]
  11. Jiang, P.; Blawert, C.; Hou, R.; Bohlen, J.; Konchakova, N.; Zheludkevich, M.L. A comprehensive comparison of the corrosion performance, fatigue behavior and mechanical properties of micro-alloyed MgZnCa and MgZnGe alloys. Mater. Des. 2020, 185, 108285. [Google Scholar] [CrossRef]
  12. Yin, J.; Li, M.; Yi, F.; Zhao, X.; Guan, D.; Wang, K.; Gao, Y.; Liu, C. Effects of micro-alloying Ag on microstructure, mechanical properties and corrosion behavior of extruded Mg-2Zn-0.2Ca-xAg alloys. J. Alloys Compd. 2024, 989, 174376. [Google Scholar] [CrossRef]
  13. Du, Y.; Zheng, M.; Xu, C.; Qiao, X.; Wu, K.; Liu, X.; Wang, G.; Lv, X. Microstructures and mechanical properties of as-cast and as-extruded Mg-4.50Zn-1.13Ca (wt.%) alloys. Mater. Sci. Eng. A Struct. Mater. Prop. Microstruct. Process. 2013, 576, 6–13. [Google Scholar] [CrossRef]
  14. Zhang, B.P.; Geng, L.; Huang, L.; Zhang, X.; Dong, C. Enhanced mechanical properties in fine-grained Mg-1.0Zn-0.5Ca alloys prepared by extrusion at different temperatures. Scr. Mater. 2010, 63, 1024–1027. [Google Scholar] [CrossRef]
  15. Sun, Y.; Zhang, B.; Wang, Y.; Geng, L.; Jiao, X. Preparation and characterization of a new biomedical Mg-Zn-Ca alloy. Mater. Des. 2012, 34, 58–64. [Google Scholar] [CrossRef]
  16. Hofstetter, J.; Rüedi, S.; Baumgartner, I.; Kilian, H.; Mingler, B.; Povoden-Karadeniz, E.; Pogatscher, S.; Uggowitzer, P.; Löffler, J. Processing and microstructure–property relations of high-strength low-alloy (HSLA) Mg-Zn-Ca alloys. Acta Mater. 2015, 98, 423–432. [Google Scholar] [CrossRef]
  17. Ma, Y.-Z.; Yang, C.-L.; Liu, Y.-J.; Yuan, F.-S.; Liang, S.-S.; Li, H.-X.; Zhang, J.-S. Microstructure, mechanical, and corrosion properties of extruded low-alloyed Mg-xZn-0.2Ca alloys. Int. J. Miner. Met. Mater. 2019, 26, 1274–1284. [Google Scholar] [CrossRef]
  18. Song, Y.; Yuan, K.; Li, X.; Qiao, Y. Microstructure and properties of biomedical Mg-Zn-Ca alloy at different extrusion temperatures. Mater. Today Commun. 2023, 35, 105578. [Google Scholar] [CrossRef]
  19. Bakhsheshi-Rad, H.R.; Idris, M.H.; Abdul-Kadir, M.R.; Ourdjini, A.; Medraj, M.; Daroonparvar, M.; Hamzah, E. Mechanical and bio-corrosion properties of quaternary Mg–Ca–Mn–Zn alloys compared with binary Mg-Ca alloys. Mater. Des. 2014, 53, 283–292. [Google Scholar] [CrossRef]
  20. Ibrahim, H.; Moghaddam, N.S.; Elahinia, M. Mechanical and In Vitro Corrosion Properties of a Heat-Treated Mg-Zn-Ca-Mn Alloy as a Potential Bioresorbable Material. Adv. Metall. Mater. Eng. 2017, 1, 1. [Google Scholar] [CrossRef]
  21. Goel, V.; Montiel, D.; Thornton, K. Understanding the Effect of Electrochemical Properties and Microstructure on the Microgalvanic Corrosion of Mg Alloys via Phase-Field Simulations. J. Electrochem. Soc. 2023, 170, 101502. [Google Scholar] [CrossRef]
  22. Li, S.; Li, X.; Zhao, C.; Li, H.; Liang, H.; Wang, S.; Zhai, C.; Du, W. Boosting the performance of primary Mg-air battery by regulating the second phase in the Mg-2Zn-0.2Ca anode. J. Energy Storage 2024, 94, 112332. [Google Scholar] [CrossRef]
  23. Takeuchi, A.; Inoue, A. Classification of Bulk Metallic Glasses by Atomic Size Difference, Heat of Mixing and Period of Constituent Elements and Its Application to Characterization of the Main Alloying Element. Mater. Trans. 2005, 46, 2817–2829. [Google Scholar] [CrossRef]
  24. Ikeo, N.; Nishioka, M.; Mukai, T. Fabrication of biodegradable materials with high strength by grain refinement of Mg-0.3 at.%Ca alloys. Mater. Lett. 2018, 223, 65–68. [Google Scholar] [CrossRef]
  25. Zhang, A.; Kang, R.; Wu, L.; Pan, H.; Xie, H.; Huang, Q.; Liu, Y.; Ai, Z.; Ma, L.; Ren, Y.; et al. A new rare-earth-free Mg-Sn-Ca-Mn wrought alloy with ultra-high strength and good ductility. Mater. Sci. Eng. A 2019, 754, 269–274. [Google Scholar] [CrossRef]
  26. Li, S.; Tang, B.; Zeng, D. Effects and mechanism of Ca on refinement of AZ91D alloy. J. Alloys Compd. 2007, 437, 317–321. [Google Scholar] [CrossRef]
  27. Nie, K.; Zhu, Z.; Munroe, P.; Deng, K.; Han, J. The effect of Zn/Ca ratio on the microstructure, texture and mechanical properties of dilute Mg-Zn-Ca–Mn alloys that exhibit superior strength. J. Mater. Sci. 2020, 55, 3588–3604. [Google Scholar] [CrossRef]
  28. Tian, Y.; Shao, Y.; Yu, Q.; Guo, S.; Dang, R.; Du, Y.; Zhu, G.; Lyu, S.; Chen, M. Investigating the corrosion behavior of as-cast Mg-Zn-Ca alloys with the same Zn/Ca atomic ratio by in situ observation. Mater. Corros. 2024, 75, 1472–1483. [Google Scholar] [CrossRef]
  29. Le, T.; Mao, P.; Hu, W.; Le, Q. Effects of Zn/Ca Alloying on the Second Phase, Corrosion Behavior, and Mg–Air Battery Anodic Performance of Mg–1Sn-Based Alloys. Adv. Eng. Mater. 2024, 26, 2301130. [Google Scholar] [CrossRef]
  30. Mi, J.; Liang, S.; Luan, S.; Ren, Q.; Feng, Y.; Cui, J.; Che, X.; Jin, P. Precipitation phase conduction <a> slip improves the plasticity of Mg-Zn-Mn-Ca alloy by microalloying with Nd and La elements. Mater. Today Commun. 2025, 43, 111550. [Google Scholar] [CrossRef]
  31. Jing, X.; Zhou, S.; Ouyang, S.; She, J.; Peng, P.; Tang, A.; Pan, F. Unveiling synergistic strength and plasticity enhancement of Mg-Zn-Mn alloy via closed forging extrusion. J. Mater. Res. Technol. 2024, 31, 3466–3479. [Google Scholar] [CrossRef]
  32. Liu, R.; Zhao, W.; Wu, G.; Wang, S.; Zhang, J.; Xiao, Y.; Mao, X. A high-performance TRIP Mg-Sc-Zn alloy enhanced by fine grain strengthening and nano-precipitate strengthening. J. Mater. Res. Technol. 2024, 33, 3874–3881. [Google Scholar] [CrossRef]
  33. Wang, L.; Ren, Y.; Sun, S.; Zhao, H.; Li, S.; Qin, G.-W. Microstructure, Mechanical Properties and Fracture Behavior of As-Extruded Zn–Mg Binary Alloys. Acta Met. Sin. Engl. Lett. 2017, 30, 931–940. [Google Scholar] [CrossRef]
  34. Yang, Y.; Wang, J.; Ferdowsi, M.R.G.; Kada, S.R.; Dorin, T.; Barnett, M.R.; Perez, M. A coupled model for precipitation strengthening in Mg-Zn alloys. Acta Mater. 2024, 281, 120392. [Google Scholar] [CrossRef]
  35. Wang, J.; Ferdowsi, M.R.G.; Kada, S.R.; Lynch, P.A.; Wang, Z.; Kimpton, J.A.; Barnett, M.R. Stress relaxations during cyclic loading-unloading in precipitation hardened Mg-4.5Zn. Acta Mater. 2021, 205, 116531. [Google Scholar] [CrossRef]
  36. Shi, D.F.; Pérez-Prado, M.T.; Cepeda-Jiménez, C.M. Effect of solutes on strength and ductility of Mg alloys. Acta Mater. 2019, 180, 218–230. [Google Scholar] [CrossRef]
  37. Pande, C.S.; Cooper, K.P. Nanomechanics of Hall–Petch relationship in nanocrystalline materials. Prog. Mater. Sci. 2009, 54, 689–706. [Google Scholar] [CrossRef]
  38. Yu, H.; Xin, Y.; Wang, M.; Liu, Q. Hall-Petch relationship in Mg alloys: A review. J. Mater. Sci. Technol. 2018, 34, 248–256. [Google Scholar] [CrossRef]
  39. Ye, L.; Huang, H.; Sun, C.; Zhuo, X.; Dong, Q.; Liu, H.; Ju, J.; Xue, F.; Bai, J.; Jiang, J. Effect of grain size and volume fraction of eutectic structure on mechanical properties and corrosion behavior of as-cast Zn–Mg binary alloys. J. Mater. Res. Technol. 2022, 16, 1673–1685. [Google Scholar] [CrossRef]
  40. Liu, X.; Sun, J.; Qiu, K.; Yang, Y.; Pu, Z.; Li, L.; Zheng, Y. Effects of alloying elements (Ca and Sr) on microstructure, mechanical property and in vitro corrosion behavior of biodegradable Zn–1.5Mg alloy. J. Alloys Compd. 2016, 664, 444–452. [Google Scholar] [CrossRef]
  41. Zhu, Z.H.; Nie, K.B.; Deng, K.K.; Han, J. Fabrication of biodegradable magnesium matrix composite with ultrafine grains and high strength by adding TiC nanoparticles to Mg-1.12Ca-0.84Zn-0.23Mn (at.%) alloy. Mater. Sci. Eng. C 2020, 107, 110360. [Google Scholar] [CrossRef] [PubMed]
  42. Schäublin, R.E.; Becker, M.; Cihova, M.; Gerstl, S.; Deiana, D.; Hébert, C.; Pogatscher, S.; Uggowitzer, P.; Löffler, J. Precipitation in lean Mg-Zn-Ca alloys. Acta Mater. 2022, 239, 118223. [Google Scholar] [CrossRef]
  43. Ralston, K.D.; Birbilis, N.; Davies, C.H.J. Revealing the relationship between grain size and corrosion rate of metals. Scr. Mater. 2010, 63, 1201–1204. [Google Scholar] [CrossRef]
  44. Cubides, Y.; Zhao, D.; Nash, L.; Yadav, D.; Xie, K.; Karaman, I.; Castaneda, H. Effects of dynamic recrystallization and strain-induced dynamic precipitation on the corrosion behavior of partially recrystallized Mg–9Al–1Zn alloys. J. Magnes. Alloy. 2020, 8, 1016–1037. [Google Scholar] [CrossRef]
  45. Cao, X.; Cheng, X.; Wang, T.; Zhong, F.; Wu, B.; Liang, M.; Li, J. Elucidating the dependence of corrosion behavior and mechanical property on the grain structure of low-temperature as-extruded Mg-Zn-Ca-Zr alloy. J. Mater. Sci. 2024, 59, 11122–11142. [Google Scholar] [CrossRef]
  46. Lei, L.; Cui, Z.; Pan, H.; Pang, K.; Wang, X.; Cui, H. Effect of extrusion on the microstructure and corrosion behavior of Mg-Zn-Mn-(0, 1.5) Sr alloys in Hank’s solution. Corros. Sci. 2022, 195, 109975. [Google Scholar] [CrossRef]
  47. Li, H.; Qin, S.; Ma, Y.; Wang, J.; Liu, Y.-J.; Zhang, J.-S. Effects of Zn content on the microstructure and the mechanical and corrosion properties of as-cast low-alloyed Mg-Zn-Ca alloys. Int. J. Miner. Met. Mater. 2018, 25, 800–809. [Google Scholar] [CrossRef]
  48. Yu, B.; Jiang, H. Illustrating the influence of anodic/cathodic second-phases on dissolution mode via Mg-Ca-Sn alloy anodes for primary Mg-air cells. J. Mater. Res. Technol. 2024, 33, 6102–6113. [Google Scholar] [CrossRef]
  49. Roh, H.; Park, J.; Lee, S.; Kim, D.-H.; Lee, G.-C.; Jeon, H.; Chae, M.; Lee, K.-S.; Sun, J.-Y.; Lee, D.-H.; et al. Optimization of the clinically approved Mg-Zn alloy system through the addition of Ca. Biomater. Res. 2022, 26, 41. [Google Scholar] [CrossRef]
Figure 1. Theoretical simulated phase diagrams of four materials: (a,e) ZX1.0, (b,f) ZX1.4, (c,g) ZX1.8, (d,h) ZX2.3.
Solids 06 00017 g001
Figure 2. X-ray diffractogram of the alloy in the extruded state.
Solids 06 00017 g002
Figure 3. Microstructure of the as-cast (ad) and extruded alloys (eh). (a) ZX1.0, (b) ZX1.4, (c) ZX1.8, (d) ZX2.3, (e) ZX1.0, (f) ZX1.4, (g) ZX1.8, (h) ZX2.3.
Solids 06 00017 g003
Figure 4. SEM photographs of extruded alloys. (a,b) ZX1.0, (c,d) ZX1.4, (e,f) ZX1.8, (g,h) ZX2.3.
Solids 06 00017 g004
Figure 5. Mechanical properties of extruded alloys.
Solids 06 00017 g005
Figure 6. Electrochemical corrosion test results. (a) Polarization curves, (b) EIS curves, (c) equivalent circuit model.
Solids 06 00017 g006
Figure 7. Average annual corrosion rates of extruded alloys for different immersion times. (a) Average annual corrosion rate and (b) pH.
Solids 06 00017 g007
Figure 8. Surface morphology of samples after removal of corrosion products following 24 h and 168 h of immersion. The yellow dotty lines represent edge detachment and the white dotty lines represent corrosion pits. (a,b) ZX1.0, (c,d) ZX1.4, (e,f) ZX1.8, (g,h) ZX2.3.
Solids 06 00017 g008
Figure 9. Comparison of YS between the experimental and theoretical results.
Solids 06 00017 g009
Figure 10. Cross-sectional corrosion morphology of the extruded alloys after 7 d of immersion in Hank’s solution. (a,b) ZX1.0, (c,d) ZX1.4, (e,f) ZX1.8, (g,h) ZX2.3.
Solids 06 00017 g010
Figure 11. AFM test results of the samples. (a) ZX1.0, (b) ZX1.4, (c) ZX1.8, (d) ZX2.3.
Solids 06 00017 g011
Figure 12. Schematic diagram of corrosion behavior of Mg-Zn-Ca alloys in Hank’s solution. (a) ZX1.0, (b) ZX1.4, (c) ZX1.8, (d) ZX2.3.
Solids 06 00017 g012
Table 1. Chemical composition of experimental materials (wt.%).
SampleMgZnCaAlCuNiFeSi
ZX1.098.770.990.240.00030.00030.00030.00140.0005
ZX1.498.421.310.270.00030.00030.00030.00130.0005
ZX1.897.861.860.280.00030.00030.00030.00140.0005
ZX2.397.232.350.420.00030.00030.00030.00130.0005
Table 2. Composition of Hank’s solution (g/mL).
NaClMgSO4·7H2OKClNa2HPO4·12H2OMgCl2·6H2OCaCl2KH2PO4NaHCO3C2H12O6
0.160.0020.0080.00240.0020.00280.00120.0070.02
Table 3. Physical phase precipitation temperature and final room temperature organization of alloys.
AlloyZn/Caα-Mg Solidification Temperature (°C)Mg2Ca Phase Precipitation Temperature (°C)Ca2Mg6Zn3 Phase Precipitation Temperature (°C)Final Microstructure
ZX1.02645.4417.3312.2α-Mg + Ca2Mg6Zn3
ZX1.43644.2417.3360α-Mg + Ca2Mg6Zn3
ZX1.84643.1417.3401.8α-Mg + Ca2Mg6Zn3
ZX2.33640.5417.3426.1α-Mg + Ca2Mg5Zn13
Table 4. EDS compositional analysis results of alloys in extruded state.
Composition (at. %)
SpotsMgZnCa
(b) A99.30.7-
(b) B80.939.689.4
(d) C99.090.91-
(d) D82.910.326.78
(d) E96.192.021.79
(f) F98.671.33-
(f) G74.813.7911.41
(f) H74.1214.2911.59
(h) I98.171.83-
(h) J69.0516.214.74
(h) K74.2114.8210.97
Table 5. Polarization properties of alloys in the extruded state.
Alloy CompositionIcorr (μA/cm2)Ecorr (V/SCE)Pi (mm/y)
X1n1X2n2X3n3
ZX1.04.270.04−1.3120.040.950.0032
ZX1.43.360.003−1.3090.0030.7670.002
ZX1.83.330.008−1.3010.010.7600.005
ZX2.35.130.03−1.3200.011.170.01
Table 6. EIS parameters for alloys in the extruded state.
Material CompositionR1 (Ω·cm2)R2 (Ω·cm2)R3 (Ω·cm2)L (L/cm2)
Y1n1Y2n2Y3n3Y4n4
ZX1.0322.42768301----
ZX1.433.83.75495451----
ZX1.836.54.16536428----
ZX2.3344.564.116.61747813093208.7
Disclaimer/Publisher’s Note: The statements, opinions and data contained in all publications are solely those of the individual author(s) and contributor(s) and not of MDPI and/or the editor(s). MDPI and/or the editor(s) disclaim responsibility for any injury to people or property resulting from any ideas, methods, instructions or products referred to in the content.

