Abstract
Fly ash, a byproduct of coal burning and gasification, is a significant source of global pollution and is classified as hazardous waste. However, physicochemical treatments can improve their adsorption capacity by increasing their surface area. This research aimed to enhance the adsorption capacity of fly ash from the brick manufacturing industry to remove Cd(II) ions by optimizing its surface area. The treatment process was designed with two factors: sodium hydroxide concentration and stirring time, each evaluated at three levels. The modification was confirmed through X-ray diffraction analysis of its mineralogical composition. Using the BET method, the initial fly ash exhibited a surface area of 8.59 m2/g, which increased to a maximum of 33.99 m2/g after treatment. The proposed modification method successfully quadrupled the surface area under optimal conditions: 2.0 M NaOH concentration and 60 min of stirring. The 32 factorial design shows that the highest degree of Cd(II) removal is 99.75%, which is achieved using the modified fly ash with a surface area of 33.99 m2/g under favorable operating conditions of 30 min and 600 rpm stirring speed.
1. Introduction
One of the by-products of coal combustion and gasification [1,2,3] in various applications for power generation and other processes such as biomass incineration [4], and brick firing, are the so-called “fly ashes”. They are characterized by particle sizes in the range of 0.5 to 200 µm and consist especially of spherical particles; this type of material is commonly referred to as particulate matter (PM) [5]. Coal is used as a major source of energy worldwide; in 2015 coal supplied 29% of energy globally; despite increases in the use of renewable energy, and the proportion of coal use is expected to remain at 24% by 2035 [6]; therefore, the generation of fly ash, will continue to be an environmental problem. People chronically exposed to coal fly ash could increase the incidence of respiratory diseases, including chronic obstructive pulmonary disease [7]; they are considered hazardous pollutants [8], a continuing threat to the environment due to various factors that can contaminate air, water, and soil, as well as affect wildlife [1,9].
Fly ashes contain high levels of Si and Al which makes them ideal for producing zeolites [10]; they are mainly composed of silicates, aluminates, and ferrous substances, the first two being the most important ones composed of crystalline mullites and sillimanites [8]; they are used for the synthesis of nanoporous materials [11]. Fly ash can be used as an adsorbent for the treatment of environmental pollutants due to its unique characteristics [9]; recycling fly ash is beneficial in terms of quality, cost-effectiveness, profitability, and environment [2]; transforming fly ash into zeolite is an alternative option to decrease the amount of waste in landfills and generate valuable products [12]. As described, coal fly ash is an important source of global pollution, classified as “hazardous waste”. It is essential to explore the potential of obtaining products with adsorbent properties through alkaline treatments in a thermal medium using fly ash. This approach not only utilizes waste material but also adds value to it, following the principles of the circular economy, particularly within the brick industry. Moreover, it contributes to achieving Sustainable Development Goal 12, which emphasizes responsible production and consumption.
García et al. synthesized a zeolite from coal fly ash by extracting silicon and aluminum from the fly ash by acid pretreatment and a hydrothermal process with NaOH; in the beta zeolite synthesis stage, they varied the source of silicon and aluminum in the mother gel and the crystallization time, maintaining a nominal composition of 50 SiO2:1Al2O3:25TEAOH:Na2O:K2O:17H2O, they obtained a ZSM5 zeolite and mordenite as secondary phase; a subsequent treatment allowed obtaining high purity beta zeolite (Zβ) [13], demonstrating that fly ashes are valuable materials that allow the synthesis of useful products such as zeolites. Iqbal et al. produced 4A zeolite in pure phase from coal fly ash using a Si/Al molar ratio equal to 2, the synthesized zeolite had a well-defined cubic crystalline shape with a specific area of 122 m2/g; they note that the synthesized zeolite had a smaller particle size than a reference zeolite and is quite stable at 800 °C [14].
Wulandari et al. successfully synthesized an A-type zeolite from coal fly ash through a process involving pretreatment, fly ash and sodium hydroxide addition, aging, and hydrothermal treatment. Their results revealed that the final product primarily consisted of zeolite A, with a specific surface area of 36.3 m2/g. The study concluded that the synthesized zeolite holds significant potential for applications in ion exchange and the removal of heavy metals from wastewater [15]. Carreño et al. [10] used fly ash with high levels of Si and Al, to produce adsorbent materials as high-purity sodium-potassium zeolites, through the process of sieving, leaching, and alkaline activation with NaOH and KOH; they obtained irregular microcrystals with granulometry less than 12 µm. Cation exchange tests showed that the activated zeolites had a substitution capacity of 141 and 111.7 meq/100g for zeolites substituted with NaOH and KOH, respectively.
Parra-Huertas et al. explored the synthesis and characterization of Faujasite-Na zeolite from fly ash. Their method involved washing with acid solutions and thermal treatment to eliminate unburned carbon, followed by fusion with NaOH and hydrothermal reactor treatment, which successfully produced the zeolite. The resulting material featured an average crystal size of 38.7 nm and a surface area of 460 m2/g, leading the authors to conclude that the synthesis process was highly efficient [16]. Similarly, Amoni et al. synthesized zeolite A from fly ash using a controlled silica and alumina extraction process. They also introduced a novel pore characterization technique that integrated experimental CO2 isotherms with molecular simulations. The resulting zeolites exhibited high crystallinity and minimal defects. Their findings highlighted the critical role of fly ash pretreatment in influencing the properties of the synthesized zeolite [17].
Gjyli et al. synthesized X- and A-type zeolites with high degree of crystallinity and large surface area from coal fly ash by the perfusion method followed by hydrothermal treatment; they determined that zeolites are formed using NaOH and not KOH and LiOH; the factors affecting the process are temperature, crystallization time, SiO2/Al2O3 ratio and type of water; the obtained zeolite X they successfully used in phenol alkylation using diethyl carbonate [2]. Langauer et al. synthesized a zeolite from coal fly ash by hydrothermal treatment with different concentrations of NaOH, LiCl, Al2O3, and aqueous glass at different temperatures and process times; they obtained several zeolite phases such as sodalite, phillipsite, chabazite, faujasite-Na and faujasite-Ca; they conclude that the synthesized zeolite is a material with textural properties for use as adsorbent and/or storage material [18].
Makgabutlane et al. studied the possibility of synthesizing zeolites from fly ash; used microwave and ultrasound methods to increase energy efficiency; succeeded in synthesizing pure phase sodalite with high surface area; evaluated the effectiveness of sodalite in removing ammonium from the urine; concluded that coal fly ash is a potential starting source for the synthesis of zeolites with applications in the removal of pollutants from water [19]. Boycheva et al. synthesized a Na-X type zeolite (FAZs) from lignite combustion by alkaline activation process with the addition of CuO to improve its catalytic properties; they evaluated its activity in volatile organic compound oxidation tests; they concluded that their study contributes to the development of technological solutions [20]. Joseph et al. synthesized an FAU-type zeolite from coal ash for the removal of Cd(II), Co(II), Cu(II), Pb(II) and Zn(II) ions in aqueous solutions by alkaline fusion followed by hydrothermal treatment; they found that the adsorption efficiency of the ions decreased in the order Pb(II) > Cu(II) > Cd(II) > Zn(II) > Co(II); they concluded that the prepared zeolite has great potential for simultaneous removal of heavy metal ions [21].
He et al. synthesized a highly efficient zeolite for the removal of Ni(II) ions from waste coal by activation through alkaline fusion and hydrothermal crystallization; they claim that it can remove up to 94% Ni(II) from wastewater; they conclude that zeolites obtained from fly ash enable wastewater treatment, which carries practical significance [22]. Yang et al. synthesized a 4A zeolite using fly ash; investigated the effect of sodium hydroxide and sodium carbonate on activation, as well as Cu(II) removal efficiency; used the hydrothermal method; identified that the ratio of the alkaline mixture is an important factor for green synthesis; conclude that the copper removal efficiency remains at an acceptable level after 4 cycles of reuse [23].
Liu et al. synthesized P-type zeolites from class fly ash (CFA) by hydrothermal method; their results showed that the copper removal process follows second-order kinetics; they also indicate that the adsorption process follows the Langmuir model for the equilibrium concentration of Cu(II) and Ni(II) ions [24]. Ren et al. synthesized high crystallinity single-phase zeolite from fly ash, they used the alkaline fusion hydrothermal method; they obtained a zeolite of defined cubic shape with a specific area of 43.7 m2/g at a low temperature of 75 °C for 18 h. The ammonium cation exchange capacity was 232.2 mmol/100 g; they point out that zeolitization of CFA can be a viable alternative to transform into a high-value-added product [25].
Tauanov et al. synthesized zeolites by hydrothermal treatment of fly ash in 3 M sodium hydroxide solution at 110 °C; they developed a conversion model using a zero-order Takagi-Sugeno fuzzy system to analyze how different process parameters affect the conversion and reaction mechanisms in zeolite formation. Such a model was fitted using literature and experimental data and was observed to accurately predict zeolite yield for a given set of reaction parameters [26]. Sivalingam et al. synthesized a microporous zeolite X (mZX) from fly ash (CFA) using the modified hydrothermal method; the variables analyzed were NaOH/CFA ratio, temperature, and crystallization time; they obtained a pore size of 9.048 A; a total area of 648.42 m2/g and a micropore area of 578.64 m2/g, a micropore volume of 0.218 cm3/g and a crystal size of 22.55 nm [27].
Feng et al. studied the migration and distribution of heavy metals during the synthesis of zeolite A from fly ash using a hydrothermal and two-stage melting process. Their findings indicated a high conversion rate of major components like aluminum and silicon. Metalloids such as arsenic, selenium, and molybdenum, characterized by amphoteric properties, exhibited high mobility and were primarily found in wastewater. Despite the presence of heavy metals in the synthesized zeolites, leaching tests under various pH conditions revealed minimal release, leading the authors to conclude that the zeolites are safe for practical applications [12]. Kunecki et al. used fly ash to synthesize type X and type A zeolites by treatment with different ratios of sodium hydroxide and aluminum foil; melting temperature of 550 °C, melting time of 1 h, and reaction time of 4 h; they obtained a zeolite whose specific area ranged from 104 to 256 m2/g; they conclude that class C fly ash, are good materials for zeolite synthesis [28].
Fukasawa et al. proposed the synthesis of zeolite with potassium (zeolite K) from coal fly ash; they obtained zeolites named phillipsite and chabazite; they showed that these zeolites had higher cesium adsorption capacity compared to sodium zeolites [4]. Liu et al. obtained a granular adsorbent material including zero iron (ZVI-GAM) using fly ash as support, bentonite as binder and heteromorph proliferate as pore-former; they showed that it had excellent reduction capacity of Cr(VI) to Cr(III) and Pb(II) to Pb(0); they conclude that ZVI-GAM is a recyclable, low-cost, effective material for the removal of metal contaminants [29].
Xiyili et al. synthesized zeolites from fly ash through mechanical activation to enhance surface area, thereby improving adsorption capacity. Their findings revealed that the mechanically activated fly ash exhibited a significantly higher adsorption capacity compared to untreated fly ash. This method presents a cost-effective alternative for the removal of heavy metals from aqueous solutions [30]. Cardoso et al. used coal ash to synthesize 4A and Na-P1 zeolites; they resulted in zeolites with more than 50% conversion, high cation exchange capacity (CEC), and purity (82% for 4A zeolite and 57–61% for Na-P1 zeolite); furthermore, they conclude that Na-P1 zeolite can be used to treat swine wastewater and remove up to 31 mg/g of total ammonia nitrogen [31].
Abbas et al. investigated the production of bricks incorporating fly ash and found that the compressive strength of bricks containing up to 20% fly ash was lower than that of conventional bricks. However, they concluded that incorporating appropriate percentages of fly ash into brick manufacturing can offer a sustainable and cost-effective solution for reducing environmental impact while producing lightweight and efficient building materials [32]. Ortiz-Medina et al. examined the capacity of a commercial adsorbent supplied by a brick company to adsorb lead; they evaluated the initial concentration of the solute and the pH of the aqueous solution; they found that the maximum capacity was 65.74 mg/g at an initial pH of 4.79 and the lead concentration of 200 mg/L; they also found that the adsorption kinetics obeyed a second-order pseudo kinetic model [33].
In the Ayacucho region, brick manufacturing plants play a crucial role in meeting the demands of a growing city. However, they also generate significant amounts of solid waste, including fly ash, a major environmental pollutant. This study emphasizes the potential of fly ash to be effectively modified to enhance its adsorption capacity, enabling its use in the treatment of wastewater containing metals and other chemical substances. The findings underscore the importance of leveraging local resources to develop water treatment solutions, particularly in a city facing water scarcity. Proper wastewater management through efficient treatment methods is essential for promoting water reuse and addressing the region’s growing water needs.
2. Materials and Methods
2.1. Sample
For the fly ash modification process, a 2 kg sample of fly ash was collected from the “El Carmen” brick kiln, situated in the Company annex of the Pacaycasa District, Ayacucho, Peru. To evaluate the removal efficiency, a synthetic solution of Cd(II) was prepared with a concentration of 110 ppm in a total volume of 2 L with an initial pH of 5.44. The reagent used was cadmium nitrate tetrahydrate from the Merck brand.
2.2. Instruments
This research used calibrated equipment with certification from the Instituto Nacional de Calidad (National Institute of Quality, INACAL) of Peru and certified international standards. BET Miocromeritics GEMINI-VII 2390 t series equipment, for the determination of the specific area, using gaseous nitrogen for the analysis and liquid nitrogen as refrigerant for the condensation of the gaseous nitrogen; Miniflex X-ray diffractometer for the determination of the chemical and mineralogical composition of the Rigaku brand with copper radiation at 40 kV and 30 mA; the analysis was performed using a Thermo Scientific iCAP 7400 ICP-OES plasma spectrometer from Thermo Fisher Scientific (Rockford, IL, USA), with a scanning speed of 2°/min irradiated, for the determination of Cd(II) ion concentration using dual view technology with radial and axial vision, with Syngistix 4.0 software for ICP Enhanced Security, complying with 21CFR standards; magnetic stirrer Model CAT M 6.1.
2.3. Experimental Procedure
The experimental tests were conducted at the Physical Chemistry Laboratory of the Faculty of Chemical Engineering and Metallurgy at the Universidad Nacional de San Cristóbal de Huamanga. X-ray diffraction analysis was performed at the Instituto Geológico Minero Metalúrgico (INGEMMET) in Lima. Surface area determination, using the Brunauer-Emmet-Teller (BET) method, was carried out at the Catalysis Laboratory of the National University of Engineering. The concentration of Cd(II) was analyzed using ICP-OES plasma spectroscopy at Actlabs Skyline Peru S.A.C. in Lima (Lima, Peru).
2.3.1. Coal Ash Treatment
The coal ash sample was subjected to the sieving process, two fractions were obtained, coarse and fine fractions. The fine fraction corresponds to the 160 µm passing mesh established by the American Society for Testing and Materials (ASTM), a classification range given to the particle size of fly ash (0.2 to 200 µm); the fly ash washing water is carried out up to a pH equal to 9, filtered and dried at 110 °C for 4 h. Representative samples are taken to determine the mineralogical composition by X-ray diffraction (XRD) and to determine the surface area (BET method).
To determine the initial adsorption capacity of the fly ash, three tests were carried out. Approximately 0.50 g of fly ash was added to three 250 mL beakers, then 200 mL of Cd(II) solution was added, and it was subjected to stirring with a magnetic stirrer; the control variables were the stirring speed and time, as shown in Table 1.

Table 1.
Tests for Cd(II) removal using fly ash in initial condition. RCd-0-30-400 means Cd removal sample with initial ash at 30 min and 400 rpm; the other samples are similarly named.
2.3.2. Chemical Modification of Fly Ash
For the determination of the most favorable operating conditions in the chemical modification of fly ash for the increase of surface area, the factorial design of type 32 was used, with 2 factors (concentration of the sodium hydroxide solution and stirring time) and three levels; the response variable was the increase of the surface area of the modified fly ash expressed in m2/g.
The sequence of the fly ash chemical modification process is described below:
- According to the selected experimental design, 25 g of fly ashes are weighed and introduced in beakers, then 100 mL NaOH of concentrations 1.5 M; 2.0 M, and 2.5 M respectively are incorporated, being the ash-to-alkaline solution ratio of 25% w/v.
- The contents of the mixture in the beakers are poured into Teflon bottles (250 mL capacity), to be shaken at a speed of 500 rpm for 30, 60, and 90 min. Then they are taken to the oven for treatment in the thermal medium for 24 h at 100 °C.
- Next, the modified fly ash samples are washed to a final pH of 10, filtered, and dried at 110 °C for 8 h. After drying, the product is subjected to the milling process, and finally, representative samples are taken to determine the mineralogical composition and surface area.
- The initial fly ash was only sieved and washed to a pH of 9; a portion of this ash was used for the alkaline treatment, resulting in modified fly ash, whose final washing pH value was 10. In the treatment process, the initial pH of the Cd(II) solution was 5.44; upon adding the fly ash, the final solution reached an average equilibrium pH of 7.61.
The experimental levels of fly ash modification according to the factorial design are shown in Table 2.
Table 2.
Experimental distribution levels for fly ash modification.
2.3.3. Evaluation of the Removal Capacity of the Modified Fly Ash
The removal of Cd(II) ions was carried out in a batch system and for this purpose, the modified fly ash that presented the highest surface area was used. A 2 L synthetic solution of Cd(II) ions of 110 ppm was prepared from the reagent Cd(NO3).4H2O (P. A.) of the Merck brand. For this stage, a factorial design of type 32 was used, i.e., two factors (contact time and stirring speed) at three levels corresponding to the independent variables and the removal percentage as the dependent variable.
The Cd(II) ion removal process has the following sequence:
- Notably, 0.5 g of modified fly ash is incorporated in 250 mL capacity beakers, and then 200 mL of synthetic Cd(II) ion solution of 110 ppm concentration is added, the ratio of the mass of modified fly ash to the volume of solution is 1:400.
- The beakers containing the sample and solution are placed onto the electric hot plate, after which a magnetic stir bar is added. The stirring speed is adjusted according to the specifications of the experimental design, and the reaction time is carefully monitored to ensure accurate results.
- The removal tests are carried out at pH 5.44 corresponding to the Cd(II) ion solution and at room temperature.
- After the removal process, it is filtered with Whatman filter paper Cat. No. 1001150, and the remaining solution is received in special flasks to determine its composition by ICP-OES plasma spectroscopy.
The experimental levels for the removal of Cd(II) ions according to the factorial design are shown in Table 3.
Table 3.
Experimental disposition levels for Cd(II) ion removal. The nomenclature RCd-x, means removal of cadmium (II) ions in sample x.
The expression that allows to determine the percentage of removal is:
where: [Cd2+]o—initial concentration of Cd(II) ions in ppm in the initial solution, [Cd2+]f—final concentration of Cd(II) ions in ppm in solution after adsorption process.
2.4. Data Procedure
After completing the chemical modification process according to the factorial experimental design outlined in Table 2, the optimal operating conditions for NaOH solution concentration and stirring time were identified based on the results yielding the highest surface area. During this experimental stage, the influence of independent variables and the optimization of modification process parameters were evaluated using the Response Surface Methodology (RSM).
This approach included the analysis of estimated effects and interactions between the independent variables, variance analysis (ANOVA), and detailed explanations of Pareto charts. Additionally, the study examined the coefficients and polynomial equations of the response function, the response surface plot, and the contour plot to identify the optimal point. The maximization of the response variable, as well as the graphical representation of the influence of NaOH concentration and stirring time, were also evaluated to ensure a thorough understanding of their impact on the process.
For the evaluation of Cd(II) ion removal, the factorial design detailed in Table 3 was employed, with stirring time and stirring speed as the independent variables, and the removal percentage as the response variable. The influence of these independent variables, as well as the optimization of removal process parameters based on the removal percentage, was analyzed using Response Surface Methodology (RSM). Both the factorial design and RSM analyses were carried out using Statgraphics Centurion XVI statistical software, ensuring precise modeling and optimization of the removal process.
3. Results
3.1. Characterization of Fly Ashes
The analysis of the diffractogram, as well as the acquisition of adsorption and desorption isotherms, was conducted by Pérez-Chauca [34], who also carried out the modification of the fly ash surface area through sodium hydroxide treatment and controlled stirring. These results confirmed the structural changes and the increase in surface area, thereby optimizing the material’s adsorption capacity for Cd(II) removal.
3.1.1. Mineralogical Composition and Diffractogram
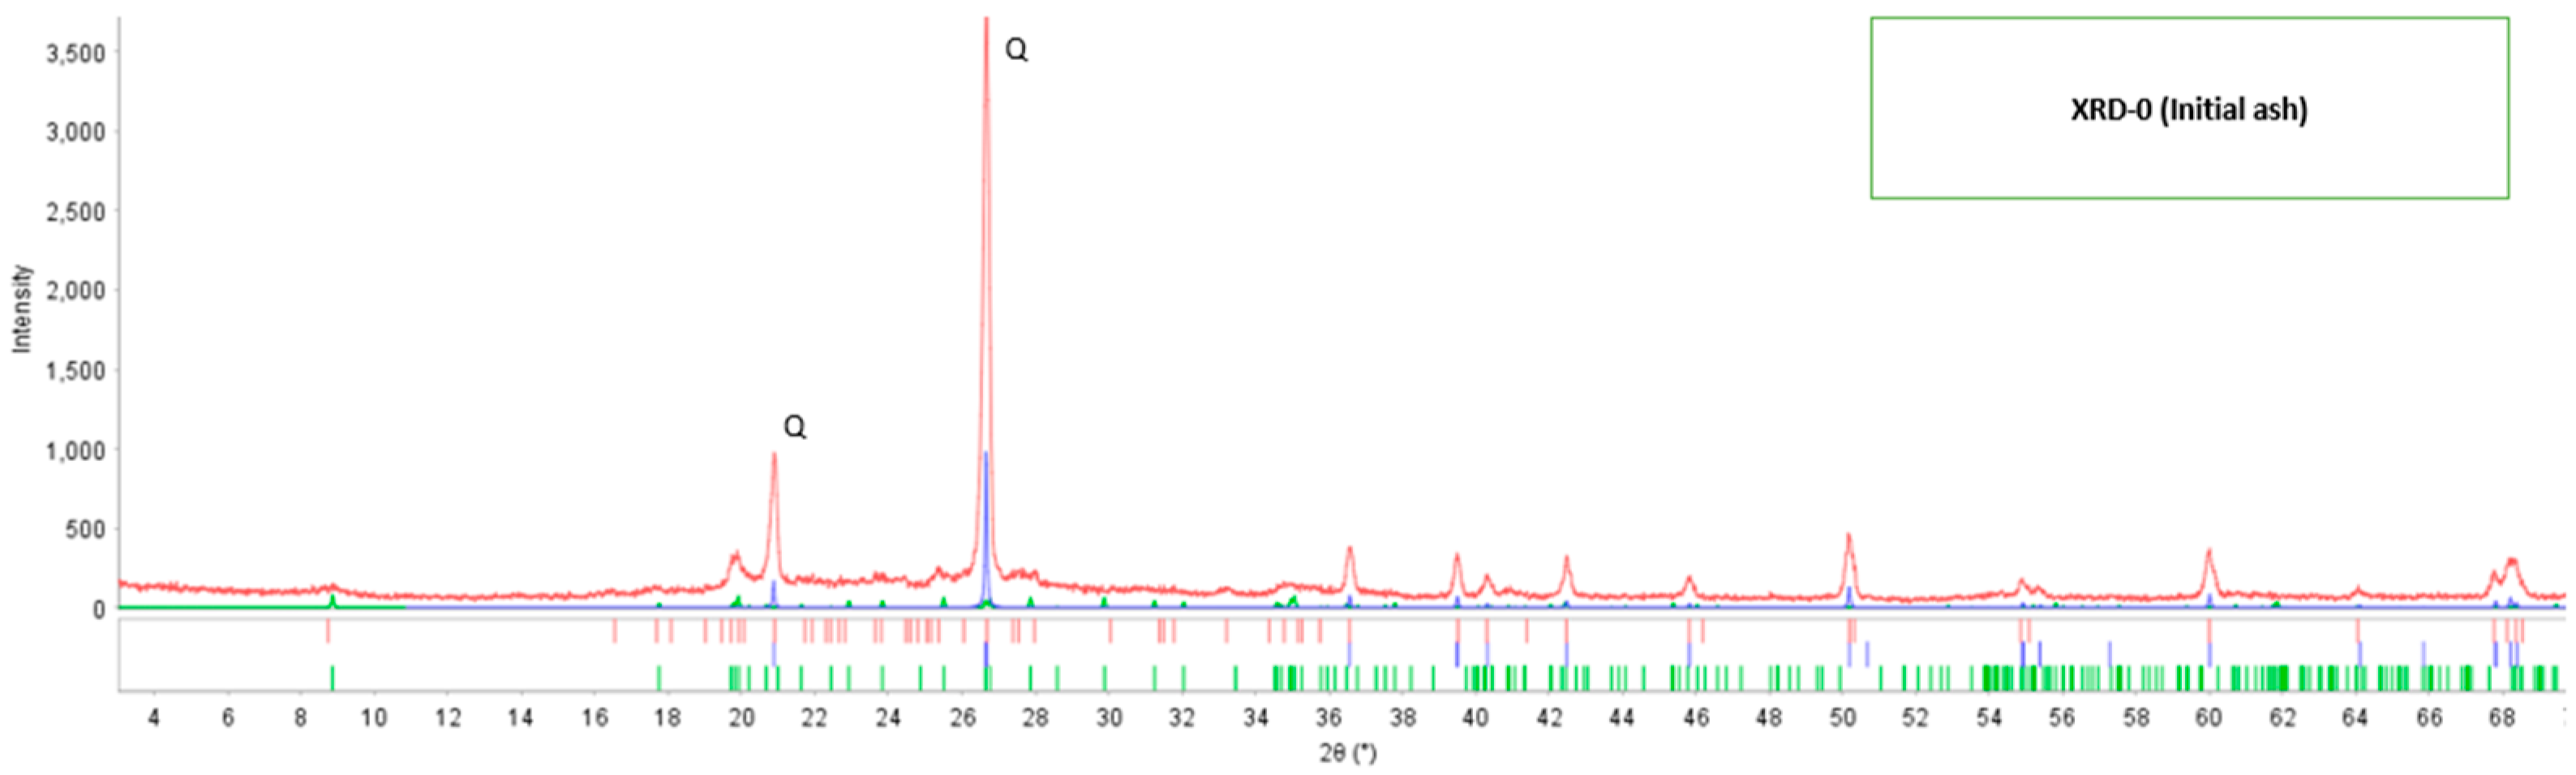
In the identification of the crystalline phases, the PDF5+ database version 2020 was used, applying the RIR (Reference Intensity Ratio) method, and for quantification, the SIeve+ software for PDF-5+ from the ICDD (International Center for Diffraction Data) was used. According to the X-ray diffraction analysis, it was determined that the mineralogical composition of the initial fly ash contains only two crystalline components: the mineral quartz (SiO2) with 92.53% by mass and 7.47% for the mineral muscovite (K0.8Na0.2Fe0.05Al2.95Si3.1O10(OH)2), respectively, based on the crystalline phases. The X-ray diffraction pattern of the fly ash in its initial state (XRD-0) is shown in Figure 1, where two typical peaks at 2θ: 21° and 26.5° corresponding to the mineral quartz (SiO2) are presented. The reported PDF card numbers are for quartz 46-1045, calcite 5-0586, and muscovite 6-0263.
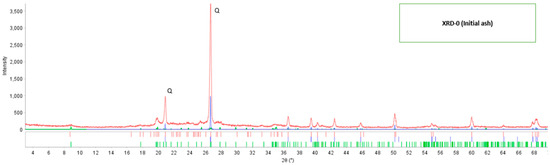
Figure 1.
The diffractogram of initial fly ash.
3.1.2. Surface Area
Figure 2 shows the adsorption-desorption isotherm of fly ash in its initial condition called BETFA-0, a type IV isotherm established by the International Union of Pure and Applied Chemistry (IUPAC-1985), corresponding to solids with a micro mesoporous surface, with hysteresis loop type H1 and cylindrical pore; its surface area was determined by the BET method, and it was 8.59 m2/g.
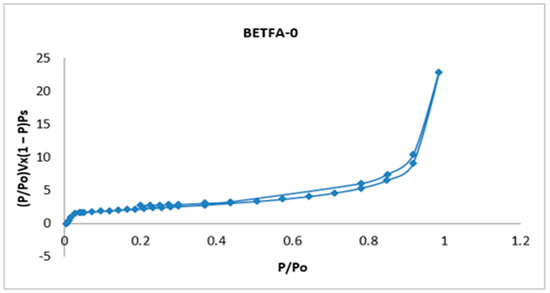
Figure 2.
Adsorption-desorption isotherm of the fly ash in its initial condition.
The results of the Cd(II) removal capacity of the fly ash in its initial condition are shown in Table 4, which shows an average Cd(II) removal rate of 20%.
Table 4.
Cd(II) removal results using initial fly ash.
3.2. Characterization of Modified Fly Ashes
3.2.1. Mineralogical Composition
Table 5 reports the results of the mineralogical composition of the initial fly ash (XRD-0) and modified fly ashes (XRD-1 to XRD-9) by X-ray diffraction method.
Table 5.
Mineralogical composition of fly ash (XRD-0) and modified fly ash (XRD-1 to XRD-9).
3.2.2. Surface Area Modification
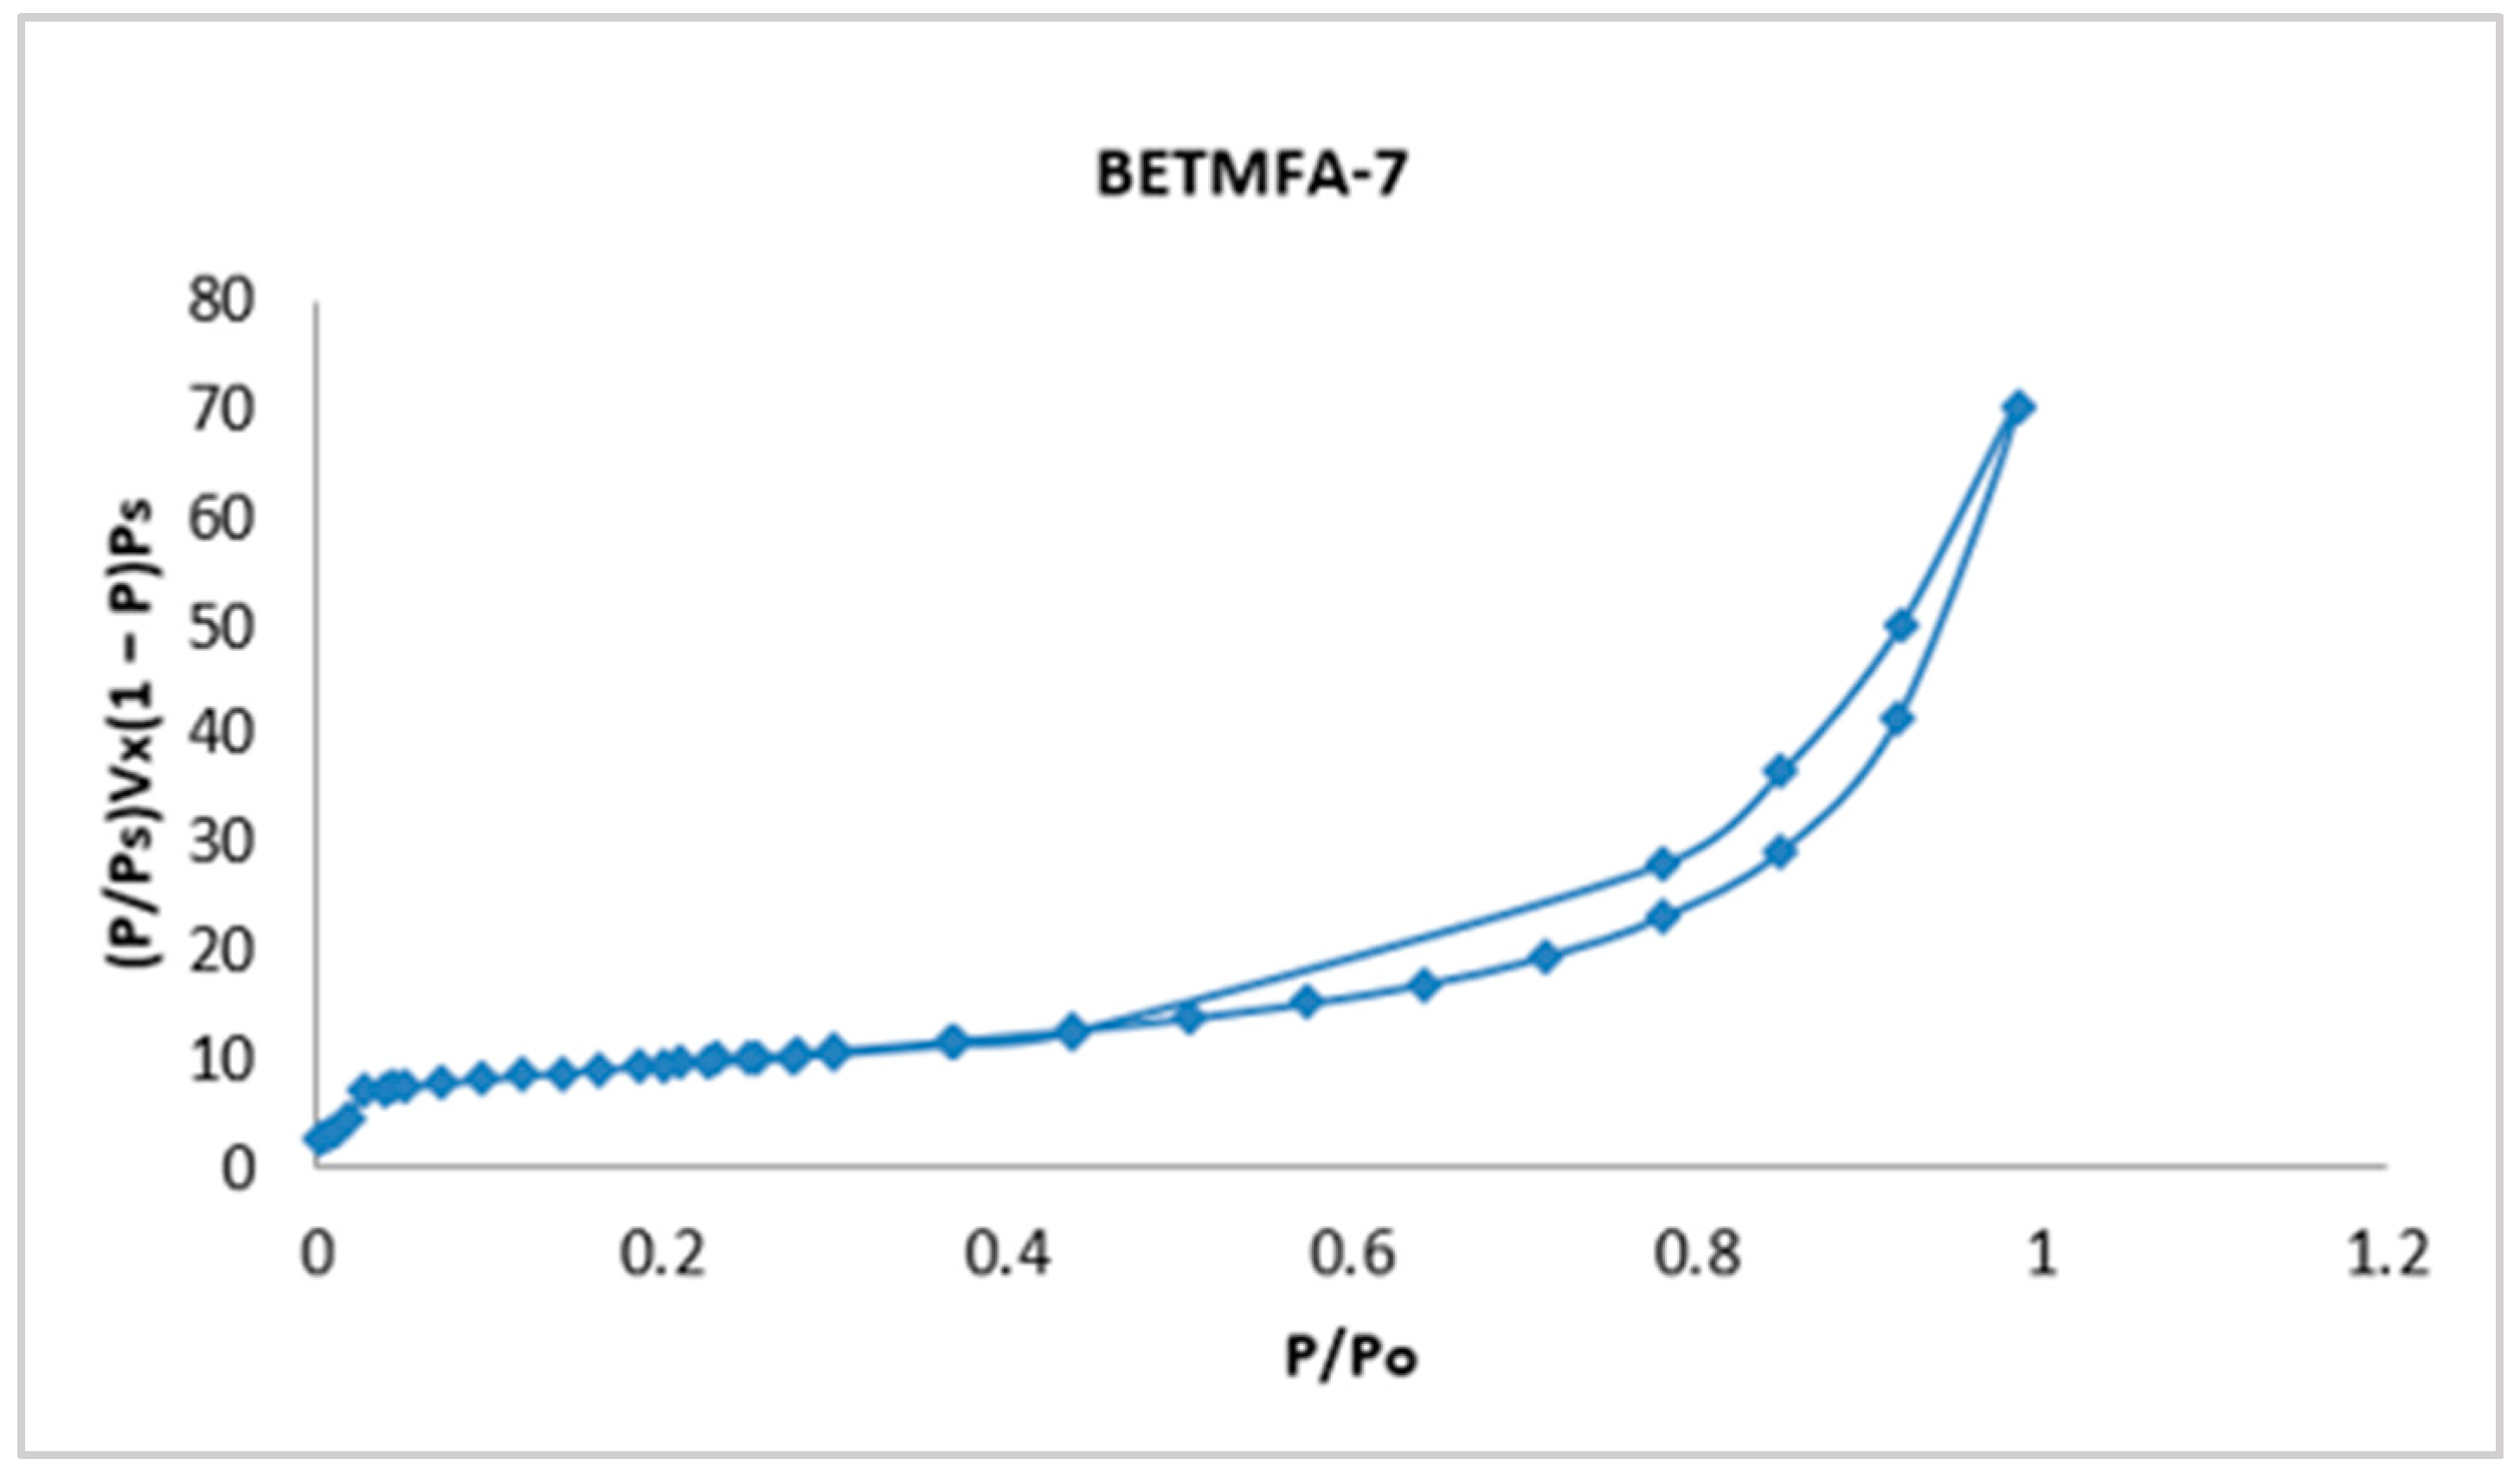
The fly ash modification was evaluated in terms of the increase in the surface area value. Table 6 shows the results of the surface area of the modified ashes determined by the BET method. In this table, it is observed that the highest value of surface area corresponds to sample 7 (BETMFA-7), being 33.99 m2/g at more favorable operating conditions of 2.0 M NaOH concentration and 60 min of stirring time and the lowest value corresponds to sample 2 (BETMFA-7) being 10.89 m2/g of surface area under operating conditions of 1.5 M NaOH concentration and 90 min of stirring time.
Table 6.
Surface area results of modified fly ash. BETMFA-x indicates surface area (BET Method) of the modified fly ash of sample x.
The isotherms of the nine experimental runs are available; however, only the sample with the highest specific area, corresponding to the BETMFA-7 experiment, is presented; this isotherm is shown in Figure 3.

Figure 3.
Adsorption-desorption isotherm of the modified fly ash corresponding to sample 7.
3.2.3. Diffractogram
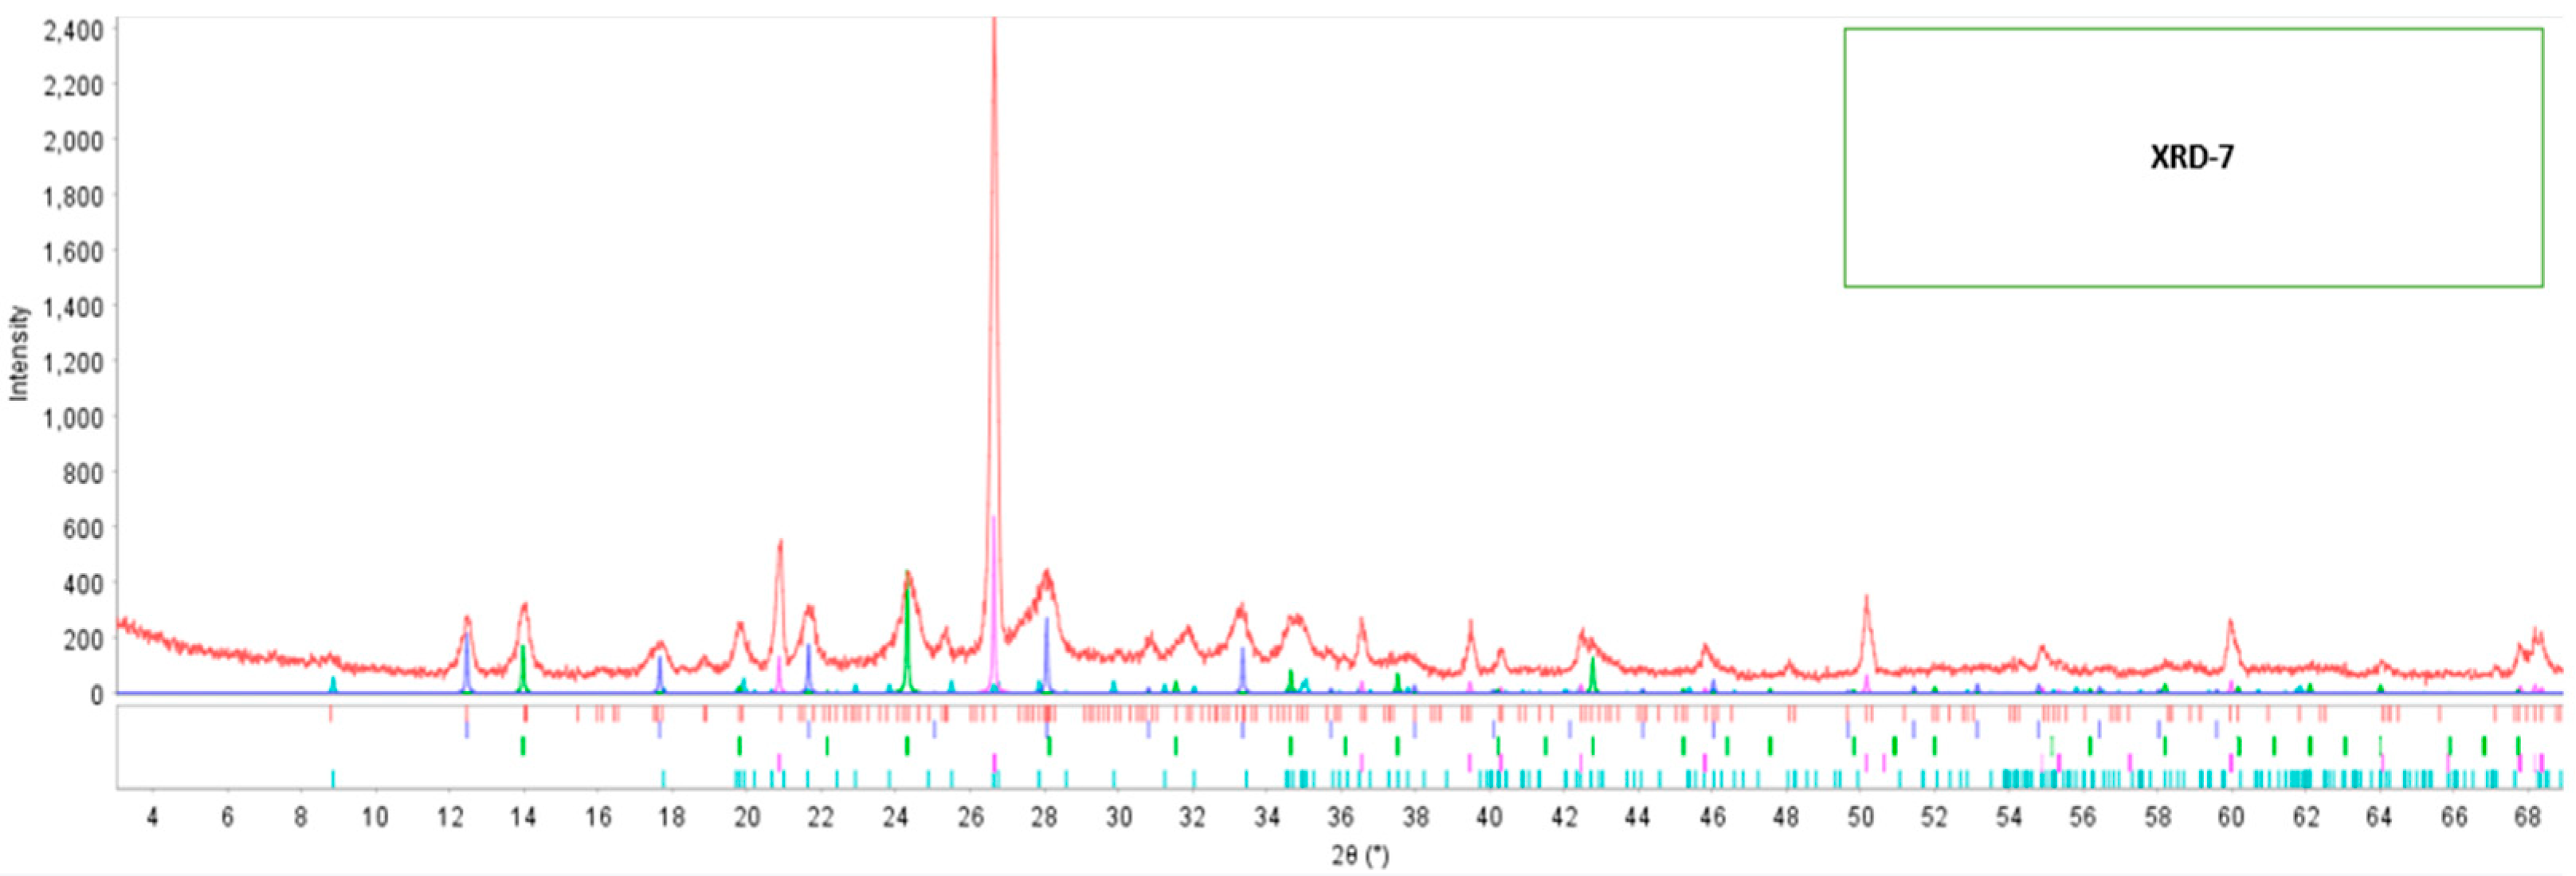
Referring to the modified fly ash 7 (XRD-7), its diffractogram is visualized in Figure 4, it is observed the formation of new peaks with small intensities in 2θ: 12°, 14°, 20°, 22°, 24°, 28°, and 35°. Table 5 shows the formation of three new minerals: 1.8% of calcite, 32.26% of gismondine, and 18.23% of zeolite.

Figure 4.
Diffractogram of modified fly ash-7.
3.3. Regarding the Influence of NaOH Concentration and Stirring Time
The level of influence of the variables NaOH solution concentration and stirring time on fly ash modification, optimization, and other effects, were evaluated according to the response surface methodology (RSM) as a function of the increase in surface area.
3.3.1. Analysis of Variance for the Increase in Surface Area
Table 7 shows the analysis of variance (ANOVA) of the results for the increase in surface area of the modified fly ash; where the partition of the variability of the increase in surface area is observed separating by parts for each of the effects, thus statistically testing the significance of each effect by comparing its mean square of the experimental error against the closest one. In this case, an effect has a p-value less than 0.05, which indicates that it is significantly different from zero with a confidence level of 95%.
Table 7.
Analysis of variance for surface area increment.
The statistical analysis indicates that the corrected R-squared value demonstrates that the model explains 88.43% of the variability in the increase of surface area. The rescaled R-squared statistic, particularly suited for comparing models with multiple independent variables, is 69.16%. The standard error of the estimate shows a residual standard deviation of 4.39, while the Absolute Central Error (ACE) is 2.20, representing the average magnitude of the residuals. The Durbin-Watson (DW) statistic was used to test for significant autocorrelation among the residuals, based on the order of the data. Since the p-value associated with this test is greater than 5%, there is no evidence of serial autocorrelation in the residuals at the 5% significance level. These results validate the model’s reliability and appropriateness for interpreting the relationships between the variables.
The standardized Pareto plot, presented in Figure 5, illustrates the factors affecting the increase in the surface area of the modified fly ash. This diagram corroborates the ANOVA results, indicating the significance levels of the two independent variables. It can be observed that neither the concentration nor the stirring time variables exceed the critical significance threshold, represented by the vertical line at a value of 3.2.
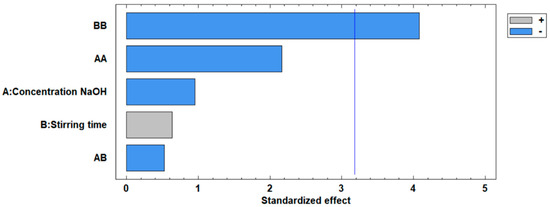
Figure 5.
Standardized Pareto plot for the increase in surface area.
Table 8 details the effects of each of the estimated interactions on the increase in the surface area of the modified fly ash, showing the individual standard error corresponding to each effect and interaction of the independent variables.
Table 8.
Estimated effects for surface area increase.
The estimated effects represent the percentage contribution of the variables to the observed changes in an event. For the two variables involved in the increase of surface area, as detailed in Table 8, the following characteristics are observed:
- NaOH concentration has a negative effect of −3.42% on the increase in surface area.
- Stirring time has a positive effect of 2.28%, indicating a favorable influence on surface area.
- The interaction of NaOH concentration with NaOH concentration exhibits a negative effect of −13.48%, highlighting a diminishing return when this variable is squared.
- The interaction of NaOH concentration by stirring time results in a negative effect of −2.30%, suggesting a small antagonistic interaction between these factors.
- The interaction of stirring time with stirring time has the most significant negative effect of −25.38%, reflecting diminishing returns when stirring time is excessively increased.
In summary, the stirring time variable shows the highest positive estimated effect at 2.28%, contrasting with the negative effect of NaOH concentration at −3.42%. This indicates that while stirring time contributes positively to increasing the surface area of modified ashes, the influence of NaOH concentration and the interactions generally detract from the surface area enhancement.
3.3.2. Regression Coefficients for Surface Area Increase
The information regarding the numerical regression coefficients for the response variable surface area increase of modified fly ash is reported in Table 9.
Table 9.
Regression coefficients for surface area increase.
The regression model for the increase in surface area according to the experimental design data fits the following expression:
where: y—increase in surface area, x1—concentration, x2—stirring time.
3.3.3. Response Surface for the Increase of Surface Area
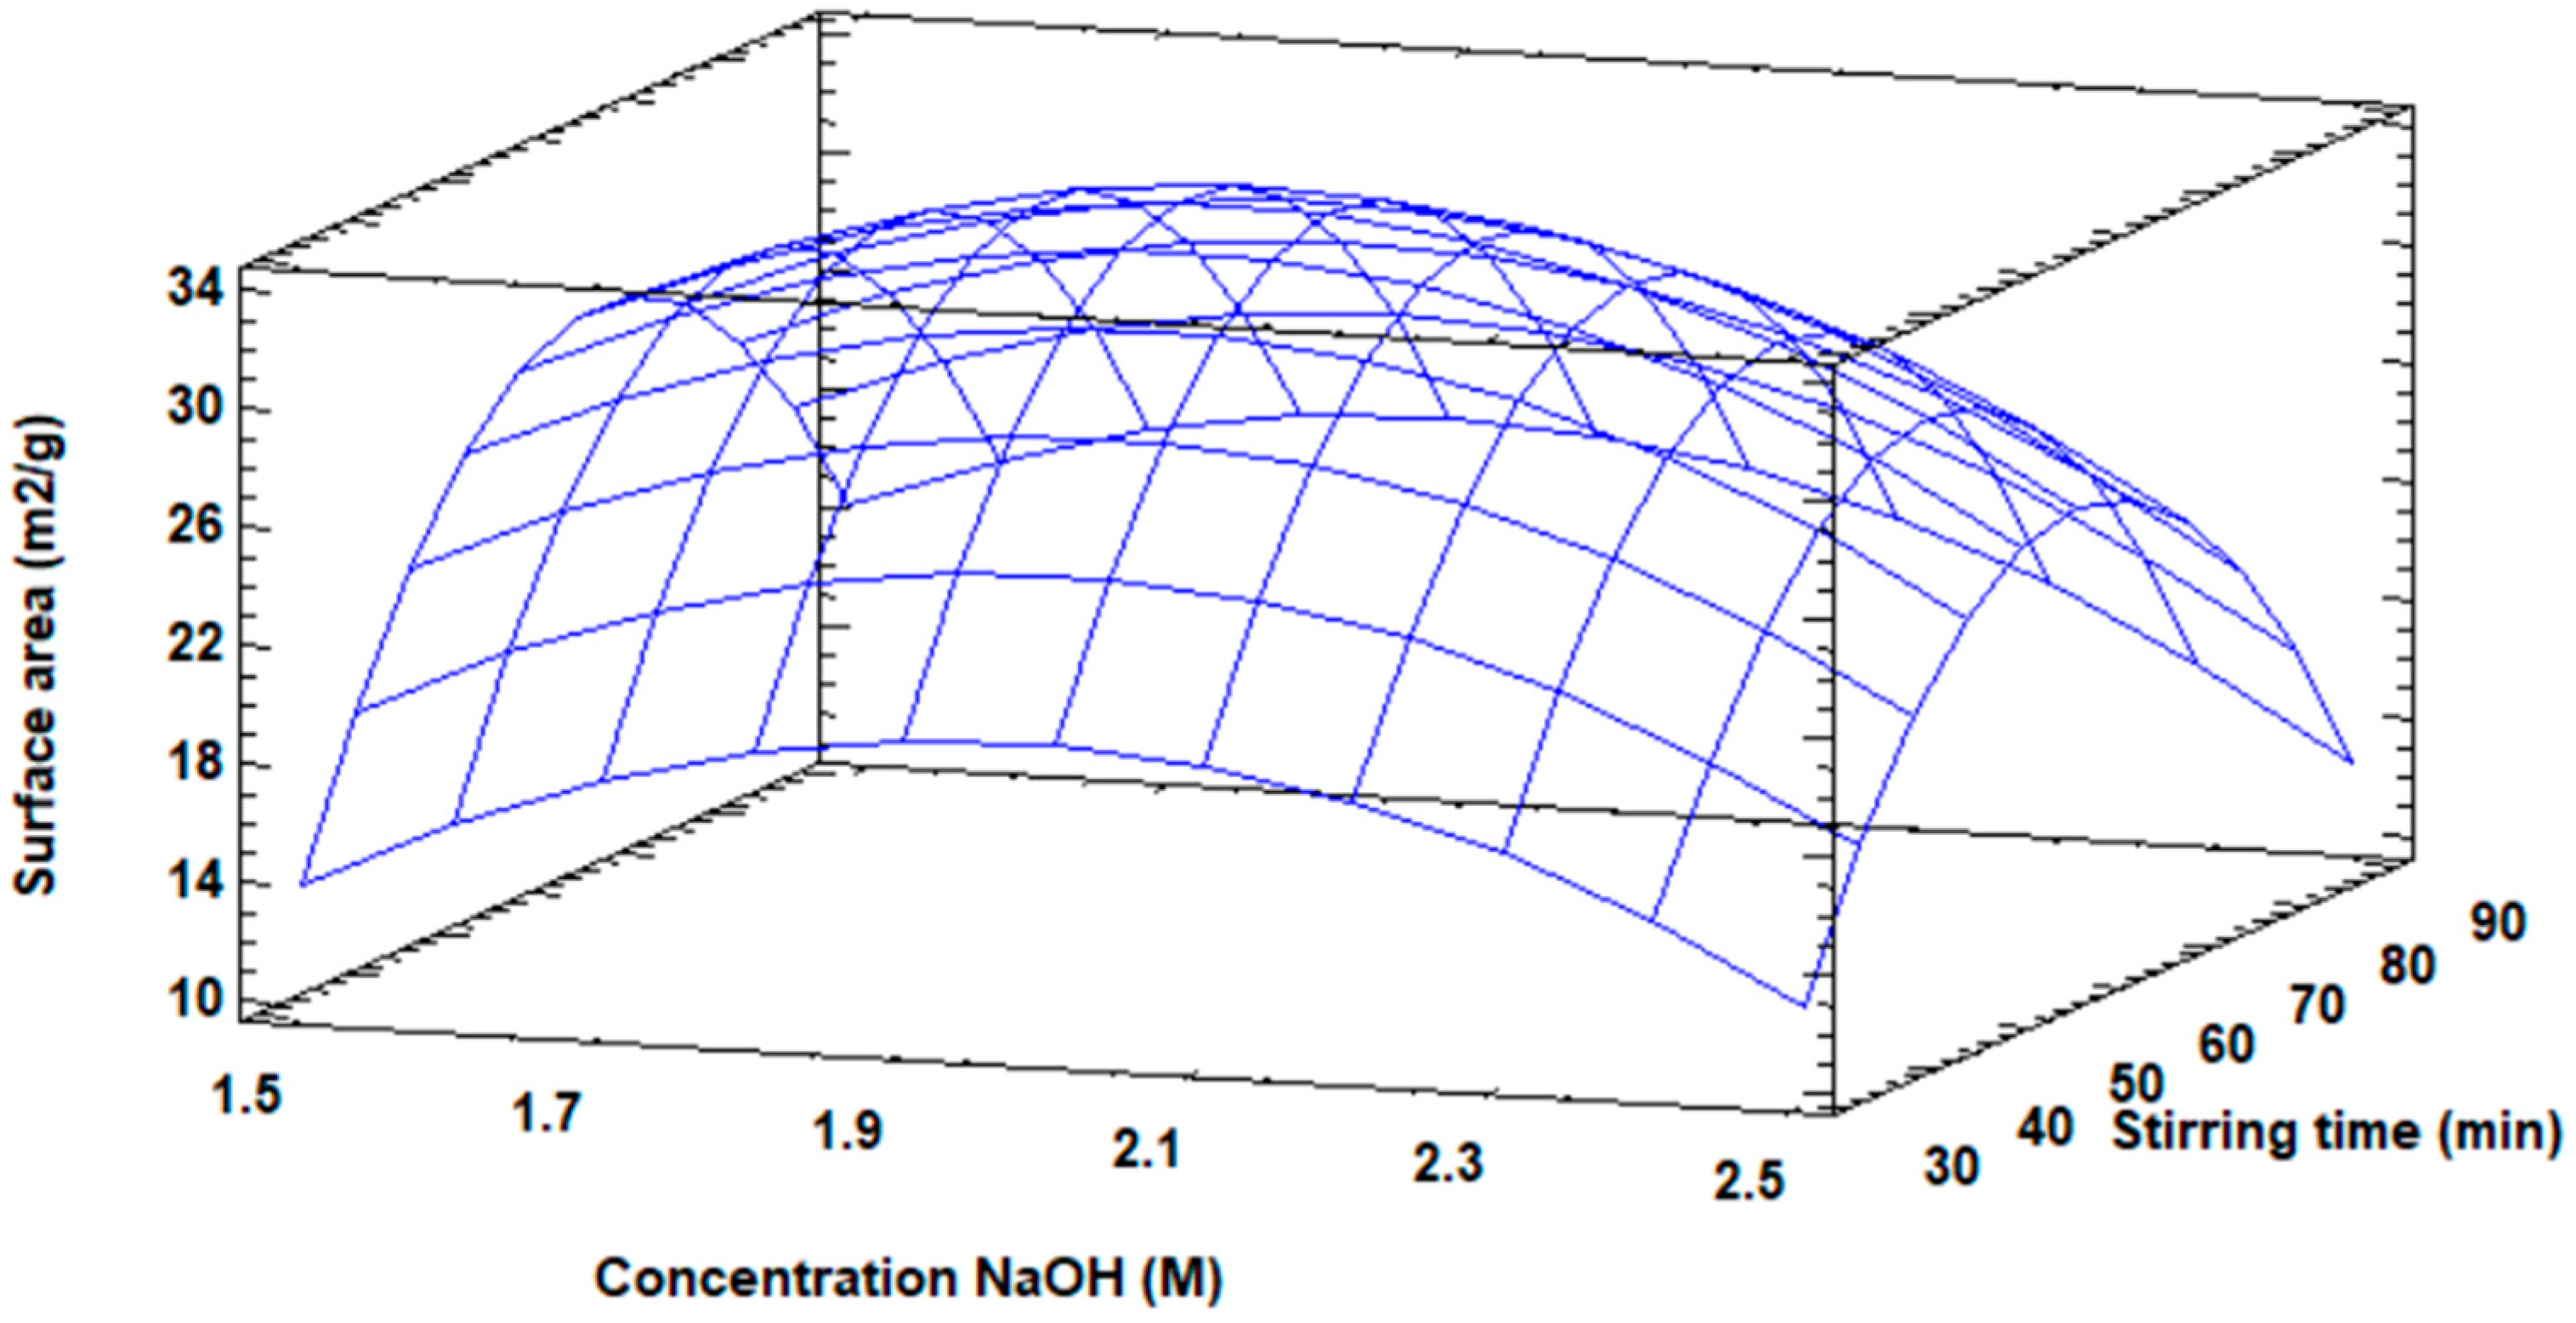
Three-dimensionally, the response surface diagram is shown in Figure 6 for the increase in the surface area of the modified fly ash, in which the maximum value of the surface area is visualized, as well as the distribution of the increase in surface area as a function of the concentration and the stirring speed.
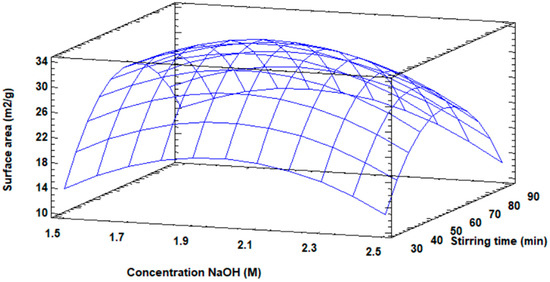
Figure 6.
Response surface plot for surface area increase.
3.3.4. Contour Plot for the Surface Area Increase
Table 10 details the values of NaOH concentration and stirring speed of the optimized response to the surface area increase of the modified fly ash.
Table 10.
Optimized response to surface area increase.
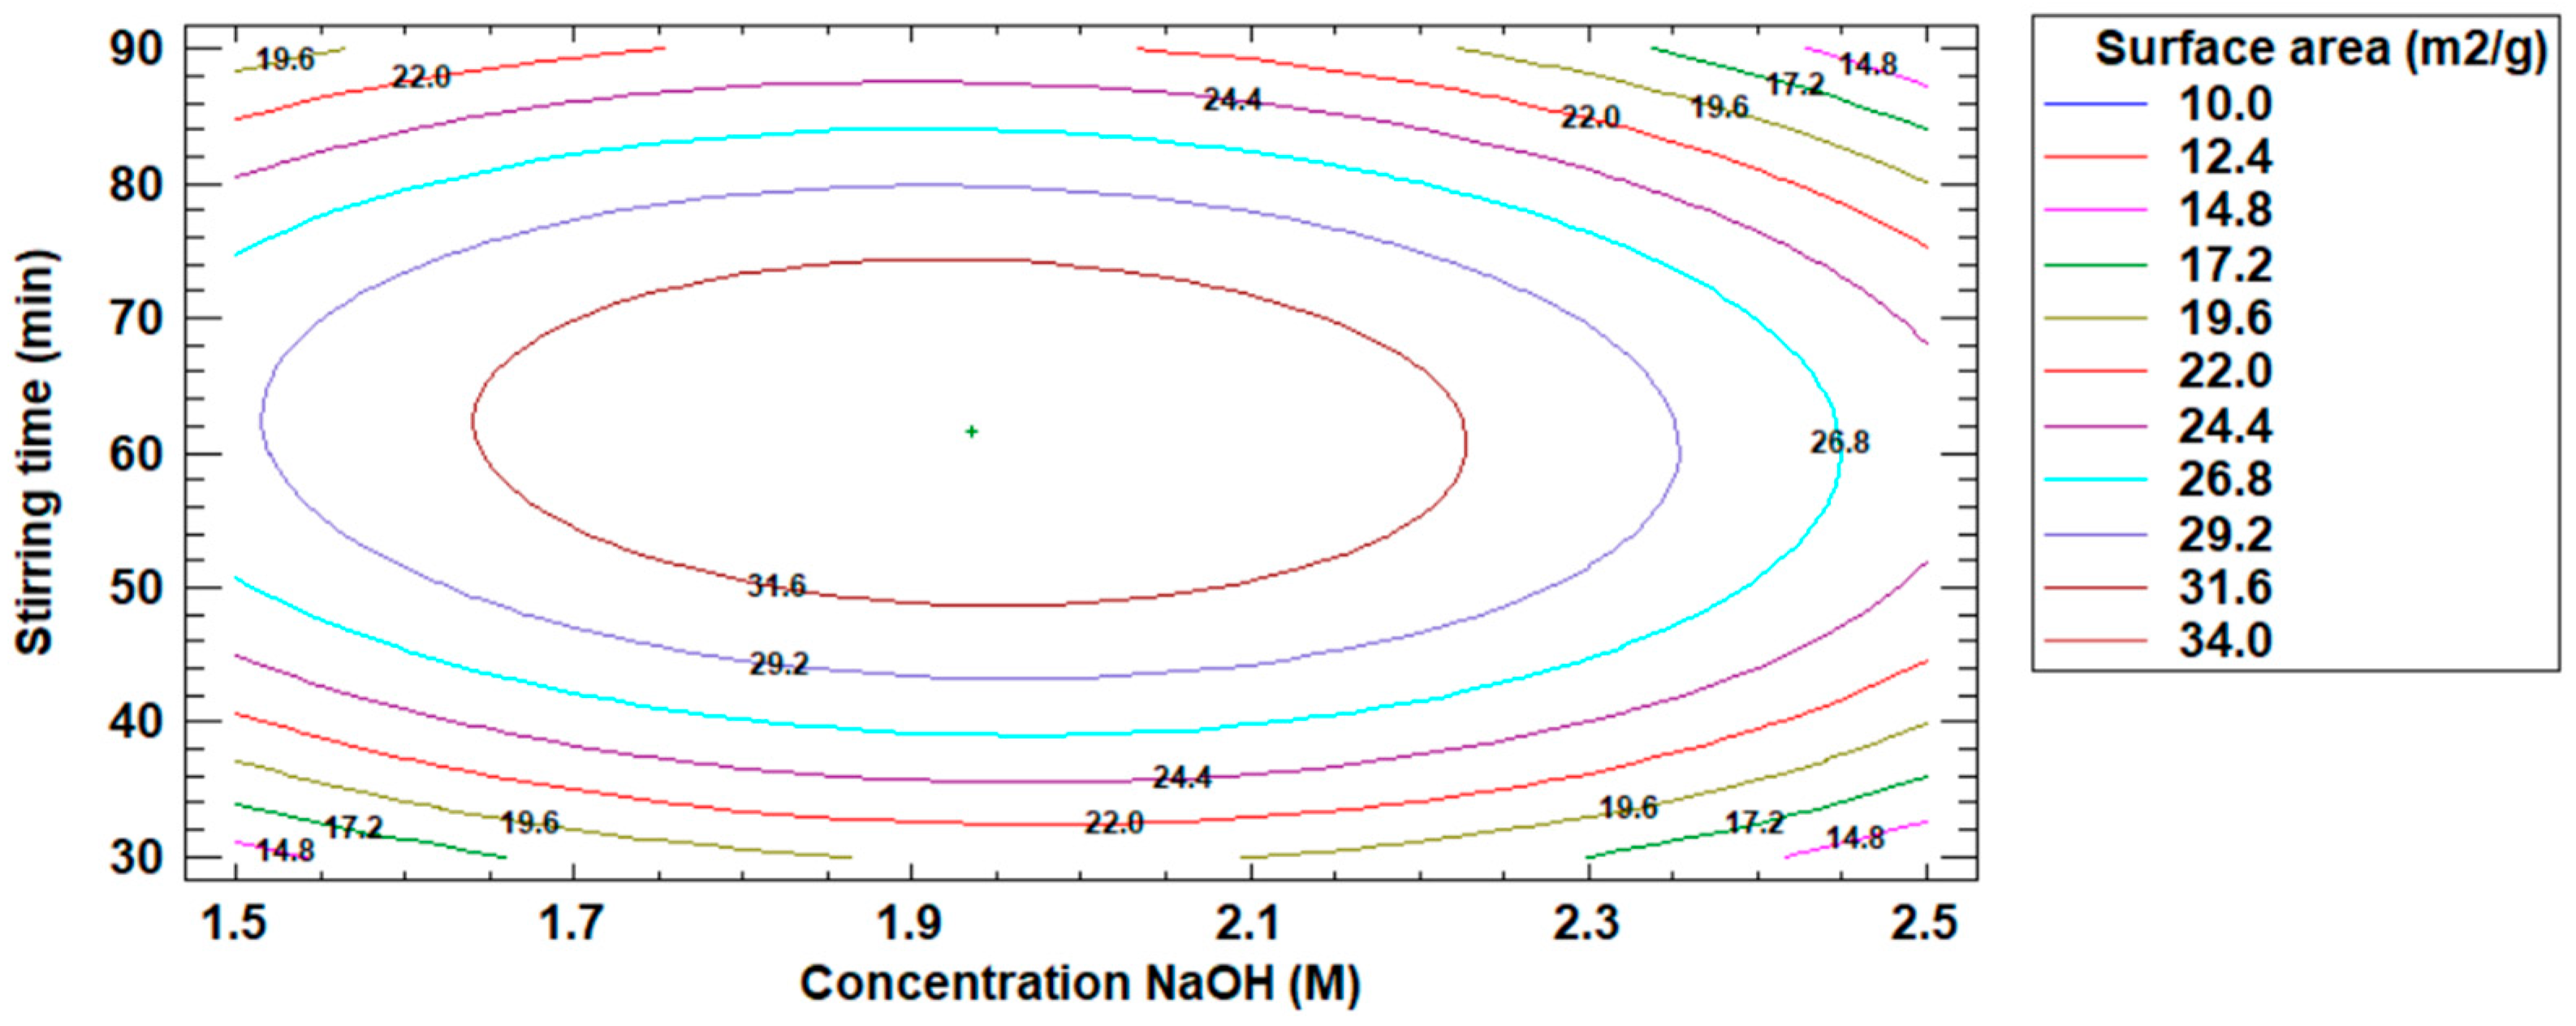
On the other hand, Figure 7 shows the estimated contour plot for the increase of the surface area value of the modified fly ash, where the maximum point of the increase of the surface area of the modified fly ash is visualized.
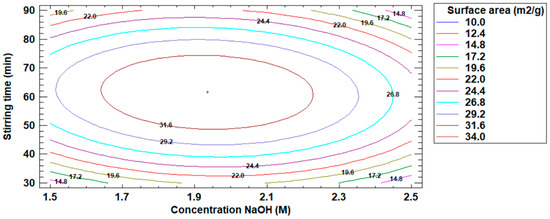
Figure 7.
Estimated contour plot for the increase in surface area value.
The optimum operating conditions in the fly ash modification process were: NaOH concentration 1.93 M, stirring time 61.52 min, and 33.92 m2/g surface area.
3.3.5. Analysis of the Influence of Concentration and Stirring Time
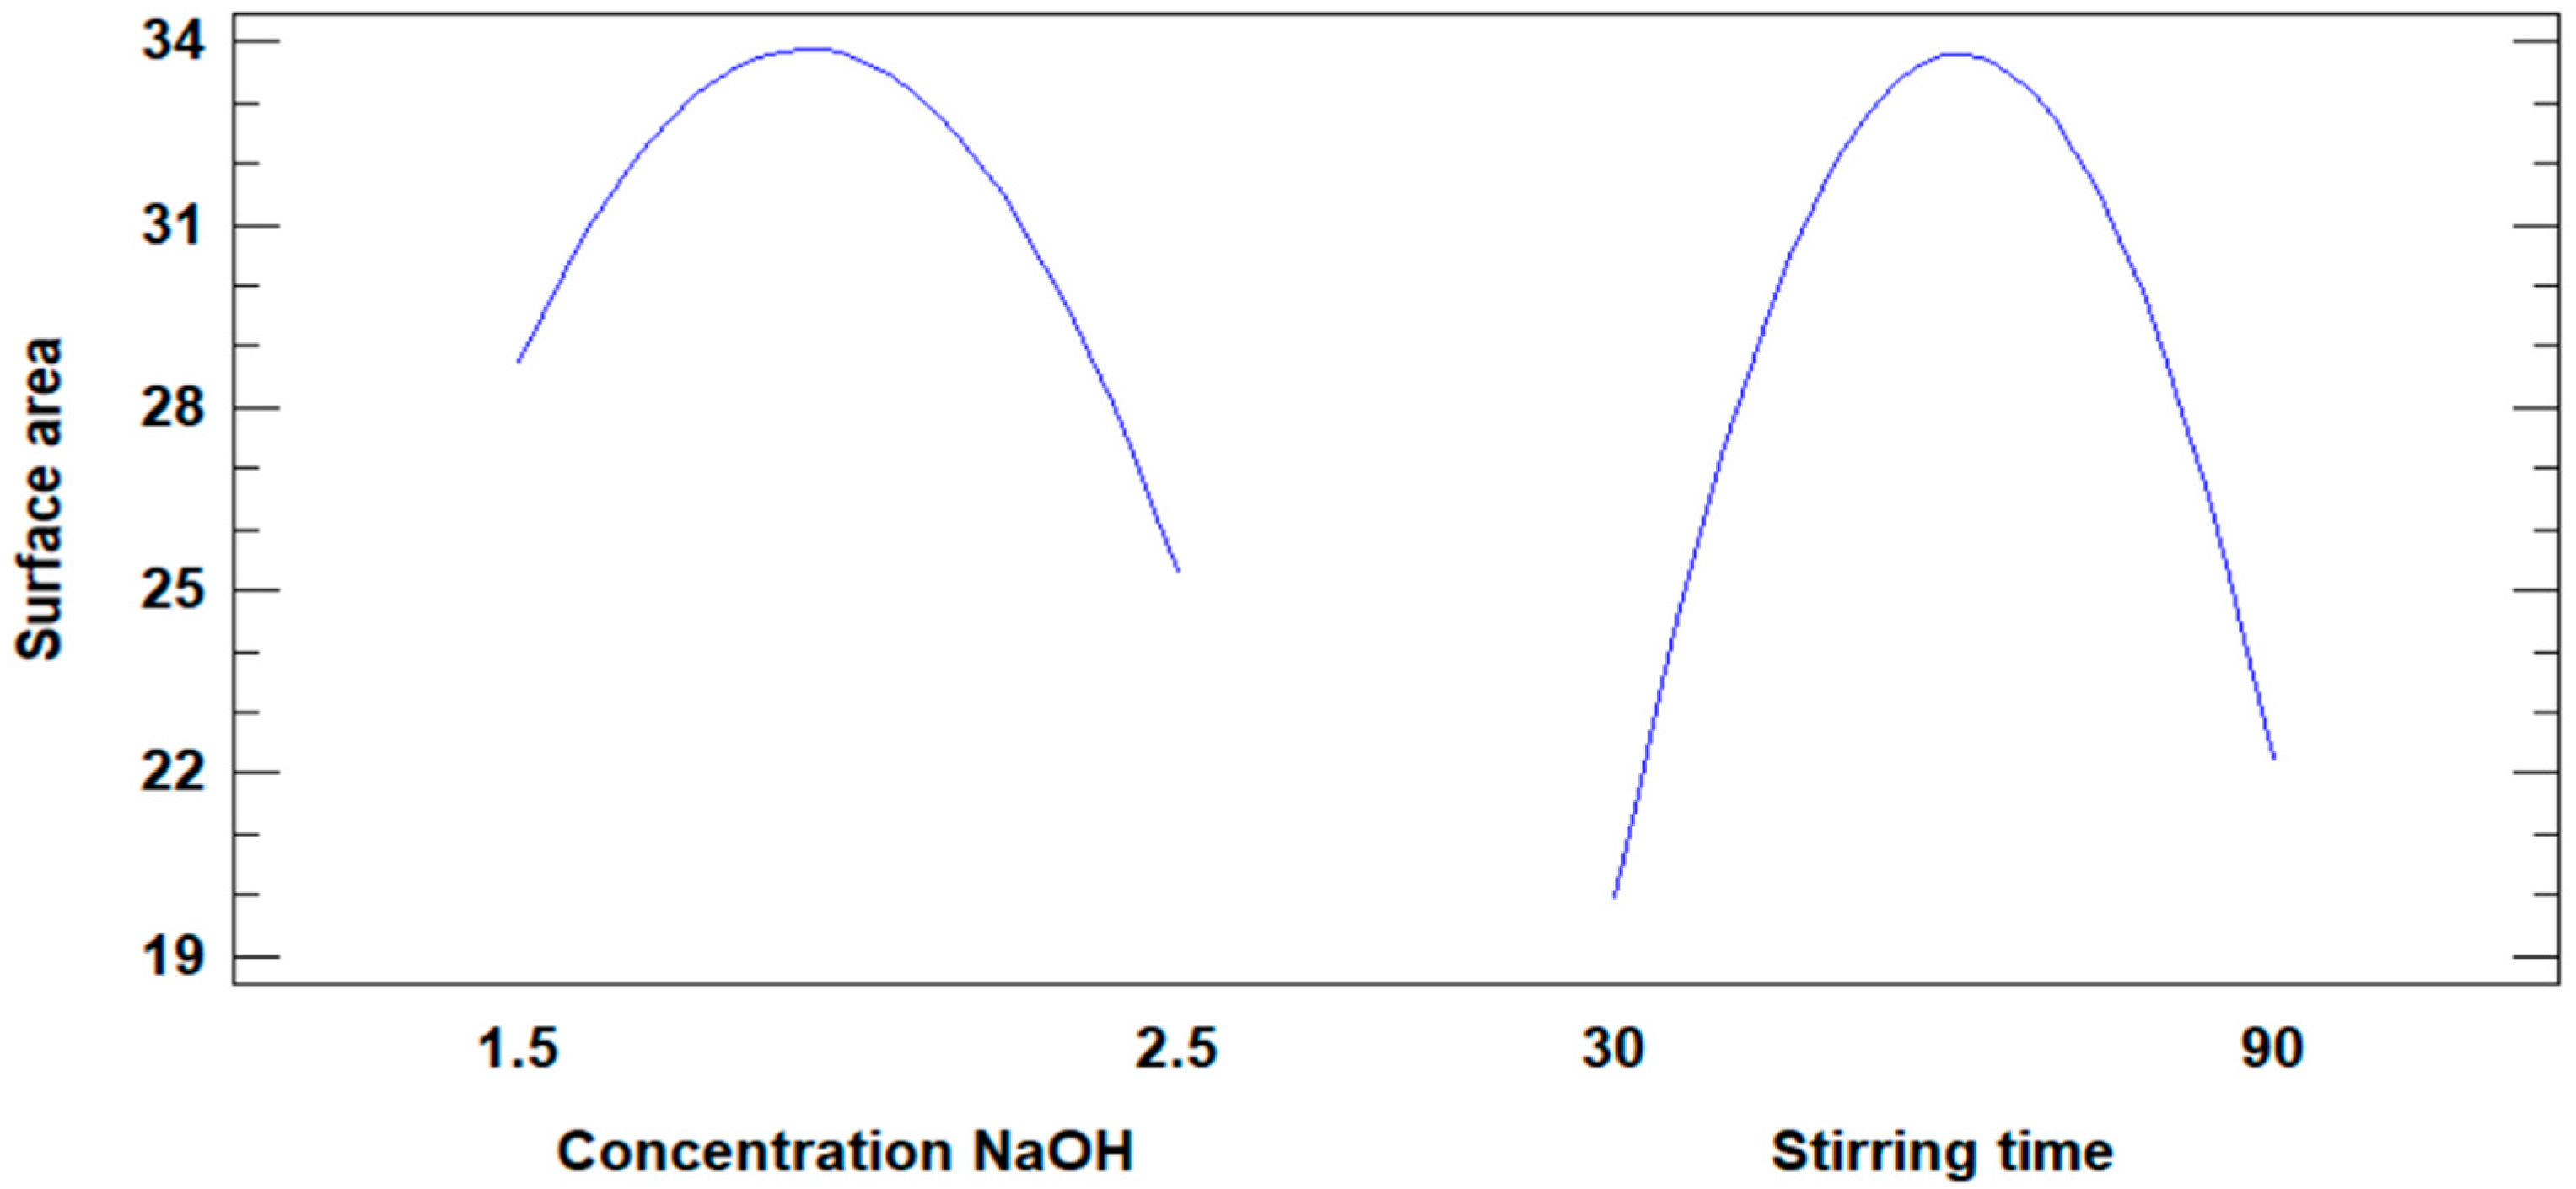
Figure 8 illustrates the influence of NaOH concentration and stirring time on the increase in the surface area of the modified fly ash. Both variables demonstrate an impact, with the surface area increasing until a maximum value is reached. However, a notable difference is observed in their behavior.
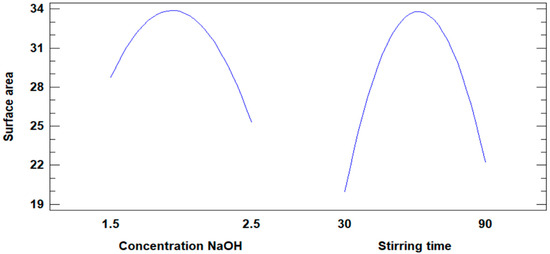
Figure 8.
Influence of concentration and stirring time on the increase in surface area.
- The NaOH concentration variable does not exhibit a minimum value for the surface area, indicating a consistent influence across its range.
- In contrast, the stirring time variable reaches a minimum value of 30 min for the surface area before contributing positively, reflecting a less consistent influence.
Based on this observation, the NaOH concentration variable exerts a more significant and steady influence on increasing the surface area compared to stirring time, making it the more effective factor in the modification process.
3.4. Regarding the Removal of Cd(II) Ions
For this stage, the modified fly ash with the highest surface area value of 33.99 m2/g corresponding to sample 7 (BTMFA-7) was used.
Table 11 describes the results of the removal of Cd(II) ions according to the factorial design of type 32; it shows that the highest degree of Cd(II) removal is presented in sample 8 (RCd-8) with 99.75% and with more favorable operating conditions of 30 min and 600 rpm of stirring speed.
Table 11.
Results of the removal of Cd(II) ions according to the factorial design 32. The nomenclature RCd-x means removal of Cd(II) ions in sample x.
The initial pH of the Cd(II) ion solution was 5.44 and the average pH of the remaining solutions in the removal process was 7.61, a value that corresponds to the equilibrium pH.
The adsorption of cadmium (II) with unmodified fly ash occurs mainly through processes such as ion exchange and electrostatic adsorption on surface active sites. Its adsorption capacity may be limited due to the lower available active surface area and the presence of other competing ions; while adsorption with modified ash increases the adsorption surface area, introduces new functional groups, and enhances ion exchange properties and complex formation, which generally results in a higher adsorption capacity for cadmium (II).
3.5. Regarding the Influence of Time and Stirring Speed
The level of influence of the variables time and stirring speed on the removal of Cd(II) ions, optimization, and other effects, were evaluated as a function of the percentage of removal by the RSM.
3.5.1. Analysis of Variance for the Removal Percentage
For the percentage removal of Cd(II) ions, the ANOVA (Statistical Package Statgraphics Centurion XVIII) is detailed in Table 12, where it is observed that it partitions the variation of the percentage removal of Cd(II) ions into independent parts for each of the effects, testing statistically the significance for each effect by comparing its mean square versus the experimental error estimate. It was detected that zero effects present a p-value lower than 0.05, showing that they are significantly different from the value of zero with a confidence level of 95%.
Table 12.
Analysis of variance for the percentage removal of Cd(II) ions.
Likewise, the R-squared statistic indicates that the model, thus corrected, explains 65.49% of the variability in the percentage of Cd(II) ion removal. For the adjusted R-squared statistic, considered the most adequate to contrast models with different numbers of independent variables, it is 7.99%. Additionally, the standard error of the approximate shows that the standard deviation of the residuals is 0.0362093.
The absolute central error of 0.018518 is the average value of the residuals. The Durbin-Watson statistic tests the residuals to determine if any significant correlations occur based on the order in which the data are presented. Since the p-value is greater than 5%, there is no serial autocorrelation information in the residuals at 5% significance.
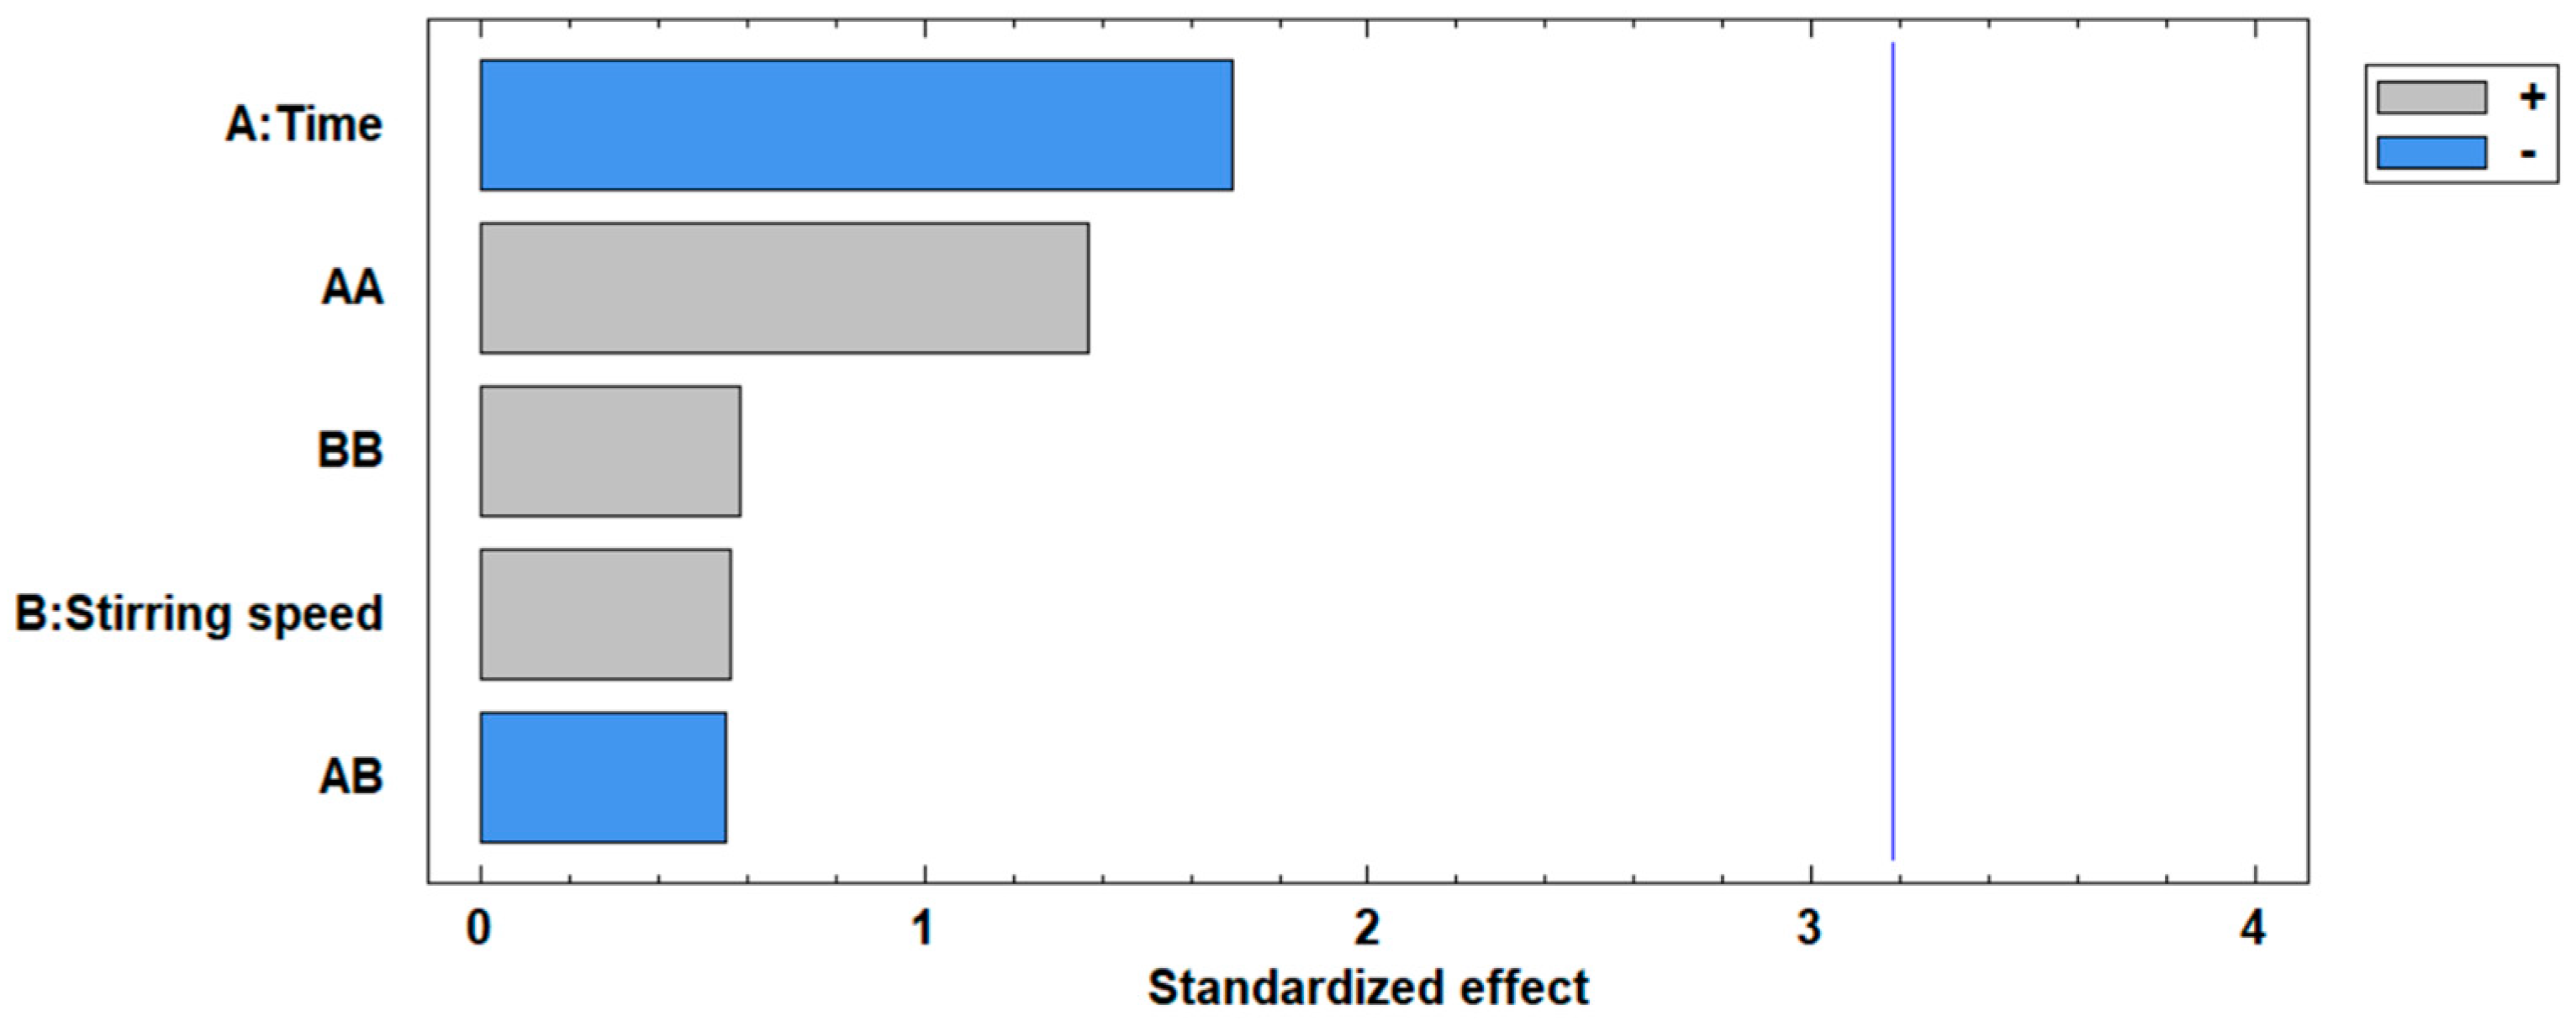
The standardized Pareto chart in Figure 9 given for the percentage removal of Cd(II), confirms the ANOVA results of the significance level of the independent variables on the removal of Cd(II) ions, it is observed that the two variables, time and stirring speed do not exceed the vertical line of significance at 3.20; indicating that the two variables do not have very important effect on the percentage removal; however, it is noted that the time effect exceeds the stirring speed.
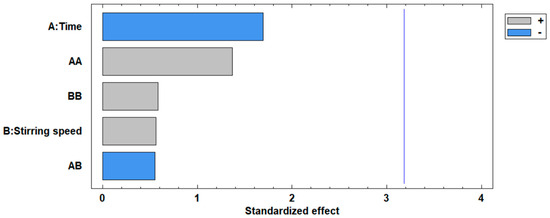
Figure 9.
Standardized Pareto chart for the percentage removal of Cd(II) ions.
The effects of each of the interactions evaluated on the percentage removal of Cd(II) ions are given in Table 13, which details the individual error of each of the consequences and the interaction of the independent variables in the removal process.
Table 13.
Estimated effects for the percentage removal of Cd(II) ions.
The effects of the two variables involved in the percentage removal of Cd(II) ions given in Table 13, present the following characteristics: the time variable in the removal process presents a negative effect of −0.05%; the stirring speed variable presents a positive effect of 0.0167%; the time by time interaction presents a positive effect of 0.07%; the time by stirring speed interaction presents a negative effect of −0.02% and finally the stirring speed by stirring speed interaction presents a positive effect of 0.03%. It is affirmed that the stirring time variable presents a greater effect with 0.0167% compared to the negative effect of time with −0.05% for the percentage of Cd(II) ion removal.
3.5.2. Regression Coefficients for the Removal Percentage
Table 14 reports the information on the regression coefficients for the response variable Cd(II) ion removal percentage; it shows the coefficients corresponding to the regression equation that allows the behavior of the Cd(II) ion removal percentage.
Table 14.
Regression coefficients for the percentage removal of Cd(II) ions.
The experimental design data were fitted to the following regression model:
where: y—percentage removal of Cd(II) ions, x1—time, x2—stirring speed.
3.5.3. Response Surface for the Removal Percentage
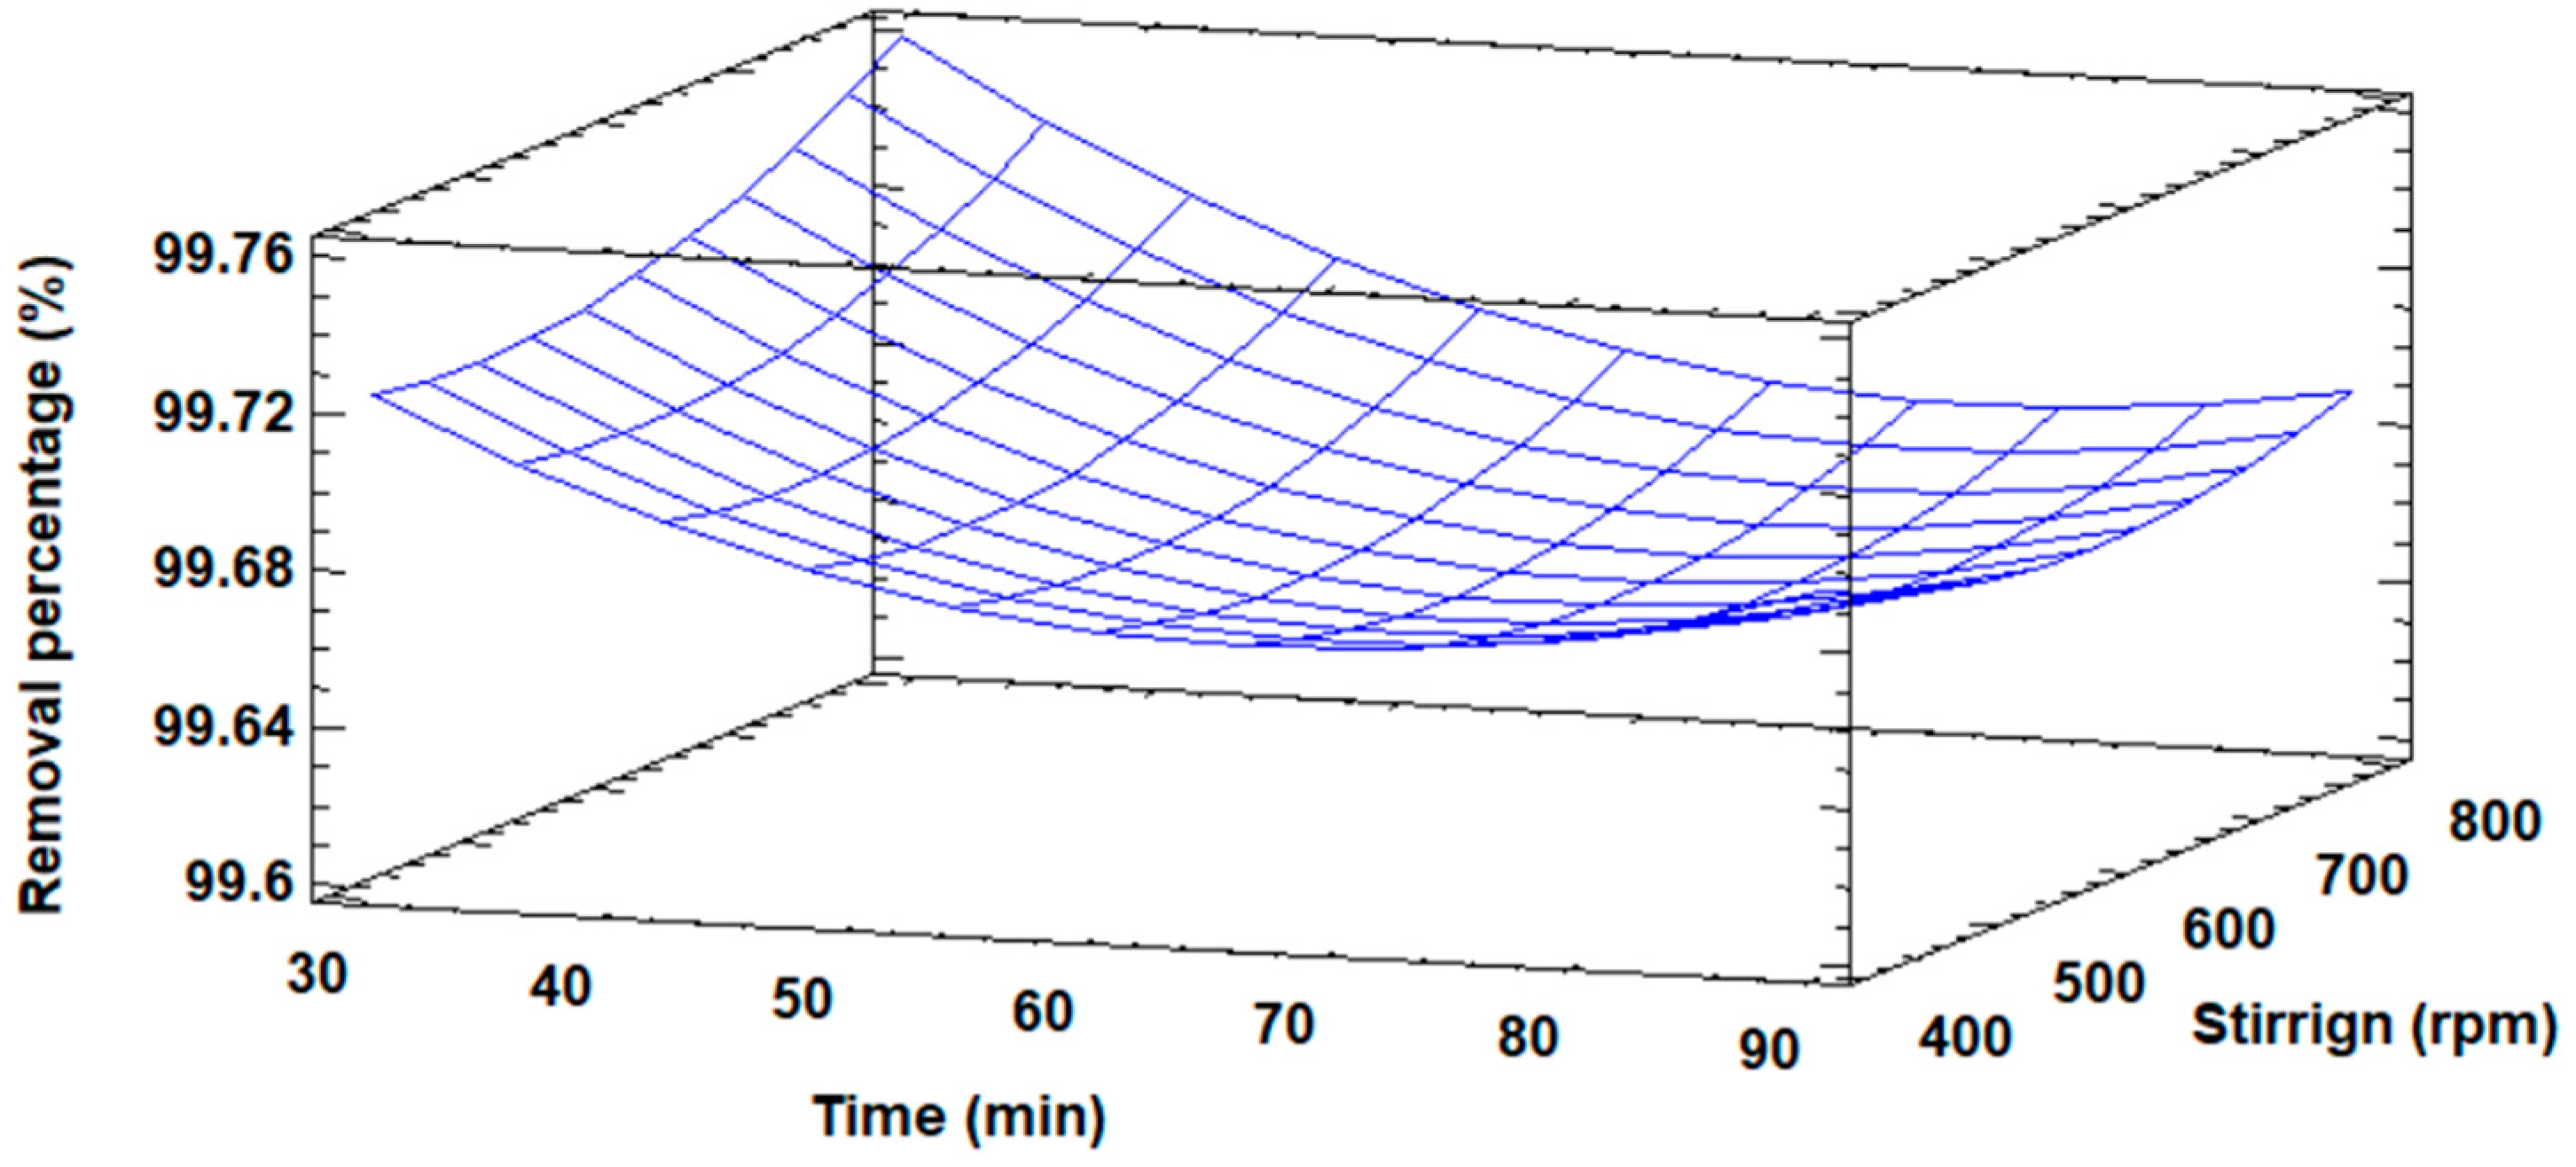
Figure 10 shows in three-dimensional form the response surface diagram for the percentage of Cd(II) removal. The maximum removal of Cd(II) ions is observed; it also shows the distribution of the removal percentage as a function of time and stirring speed.
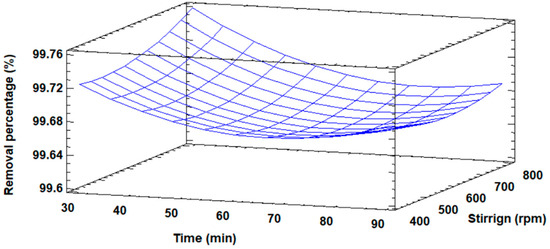
Figure 10.
Response surface plot for the percentage removal of Cd(II) ions.
3.5.4. Contour Plot for the Percentage of Removal
The values of time and stirring speed of the optimized result for the percentage removal of Cd(II) ions are reported in Table 15.
Table 15.
Optimized result for the percent removal of Cd(II) ions.
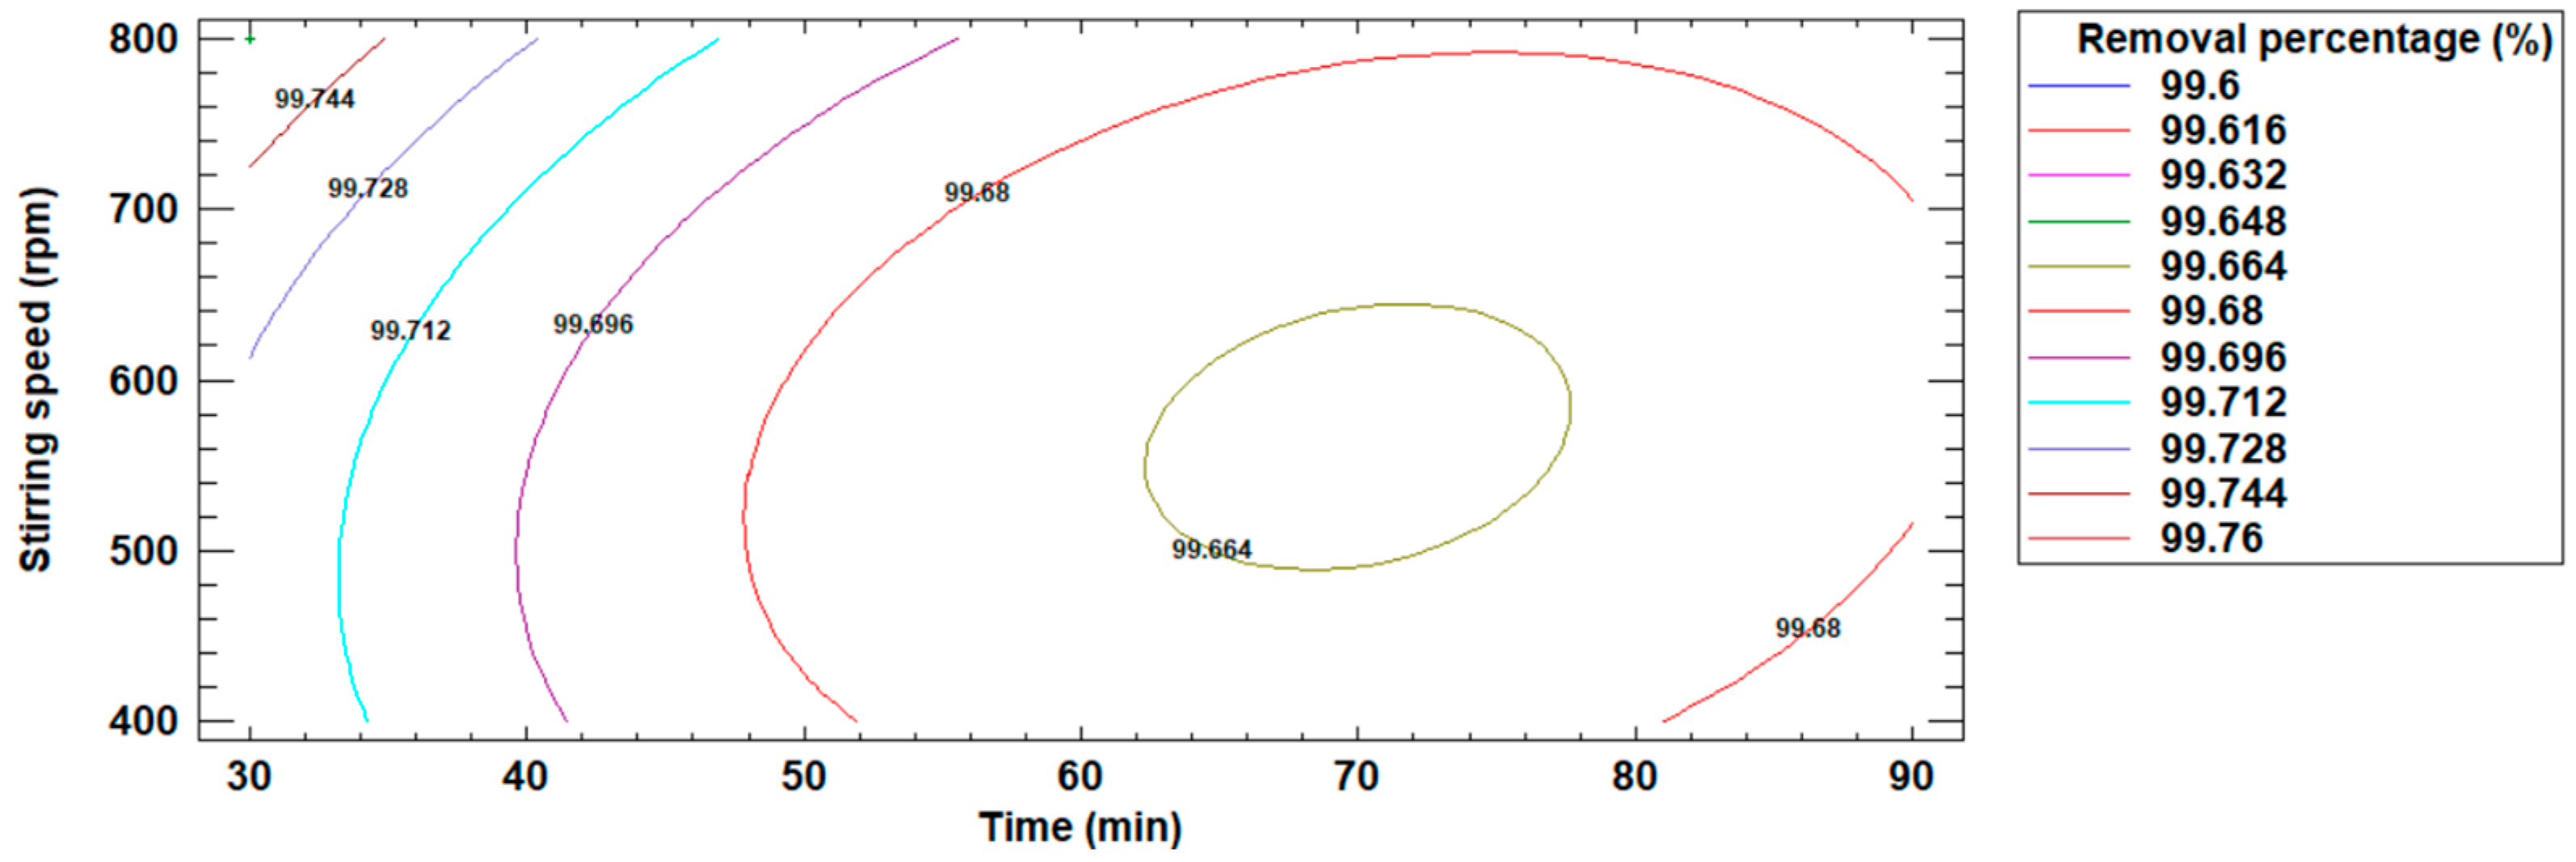
Figure 11 presents the contour plot that visualizes the point at which the percentage removal of Cd(II) ions is maximized. This estimated contour plot identifies the optimal operating conditions for the removal process, providing a clear representation of the conditions under which maximum Cd(II) ion removal is achieved.
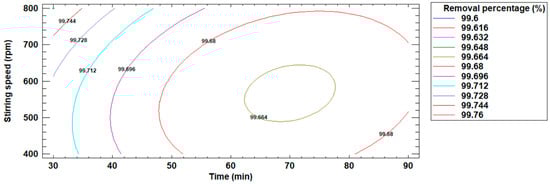
Figure 11.
Estimated contour plot for the percentage removal of Cd(II) ions.
It was determined that the optimum operating conditions in the removal process were: 30 min of stirring time, 800 rpm stirring speed and, 99.76% removal of Cd(II) ions.
3.5.5. Analysis of the Influence of Stirring Time and Stirring Speed
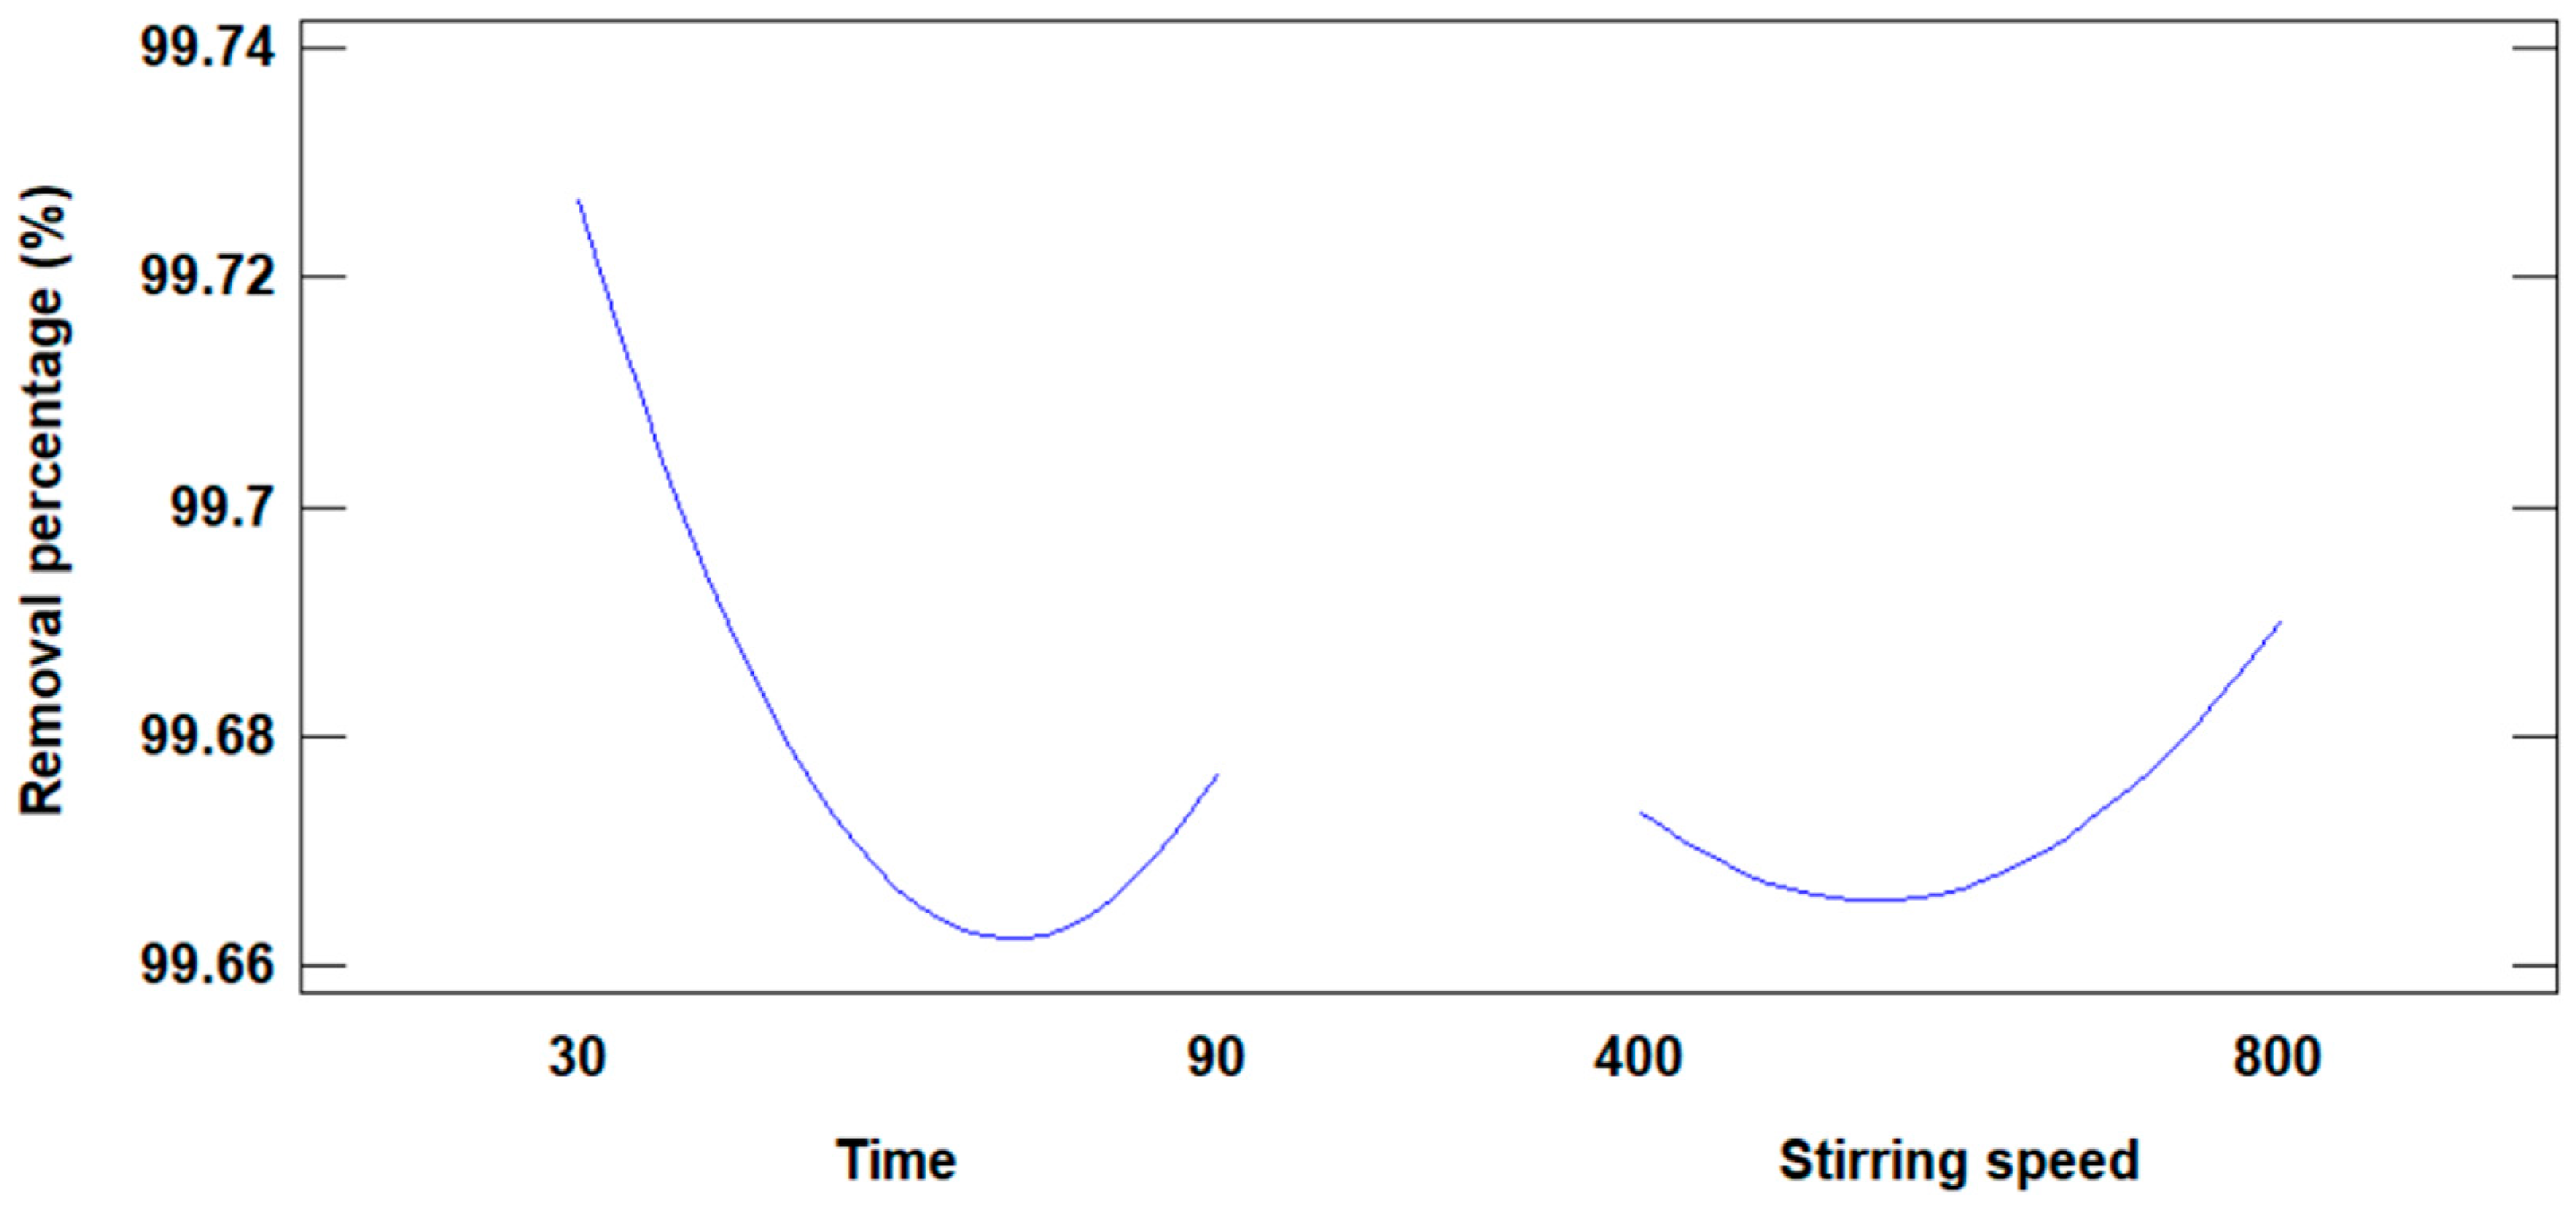
Figure 12 shows the graph that shows the influence of time and stirring speed on the removal of Cd(II) ions.
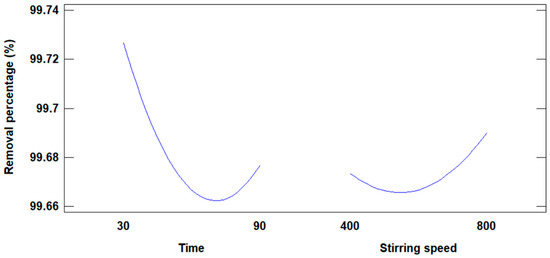
Figure 12.
Influence of time and stirring speed on the percentage of removal.
4. Discussion
Through the X-ray diffraction technique, it was possible to determine the mineralogical composition of the fly ash coming from the brick industry in its initial condition; Table 5 shows the presence of two types of minerals; quartz (SiO2) and muscovite (K0.8Na0.2Fe0.05Al2,95Si3,1O10(OH)2), additionally the diffractogram of Figure 1 of the fly ash present typical peaks that identify it in the range of 2θ from 20° to 28°. Regarding the characterization of fly ash, authors such as Yang [23] using XRD determined that fly ash presents two main components mullite and quartz; Joseph [21] when determining the physicochemical properties of fly ash found by XRD that it is constituted by quartz and mullites and Iqbal [14] with the fly ash studied, identified two major components quartz and mullite. Therefore, the mineralogical composition is a way to characterize a solid material; in all the XRD analyses it is shown that quartz is a mineral found in fly ash, its presence and high SiO2 content allow it to be used as a raw material to obtain adsorbent materials.
The surface area determined by the BET method of the initial fly ash was 8.59 m2/g, some researchers such as Amaya et al. [35] report a 10 m2/g surface area of untreated fly ash; Parra-Huertas et al. [16] found a surface area of 6 m2/g; Längauer et al. [18] used two types of fly ash from two types of coals, their surface areas were 0.8 and 3.6 m2/g; Joseph et al. [21] report 2 m2/g surface area for fly ash and Gjyli et al. [2] reported 1.5 m2/g in their research. According to the report and compared with the literature, the surface area of the fly ash used in the present investigation is within the range of the values found for fly ash. On the other hand, Table 4 shows the results of the evaluation of the adsorption capacity of fly ash in its initial condition, it is evident that it removed 20% on average of Cd(II) ions, we affirm that fly ash in its initial condition has limited adsorption properties.
Utilizing the factorial design of type 32 and according to the results given in Table 3, it is evidenced that sample 7 (BETMFA-7) presents the highest value of surface area with 33.99 m2/g, a result that allows us to determine the most favorable operating conditions in the modification of the surface area; being 2 M of NaOH concentration and 60 min of stirring time. By response surface methodology, the optimal operating conditions were determined; being 1.93 M for NaOH concentration, 60.52 min of stirring, and 33.92 m2/g of surface area.
Regarding the chemical modification of the fly ash, Table 5 presents the results of the mineralogical composition; the modified fly ash samples XRD-1 and 7 present five minerals; samples XRD-2, 3, 4, 5, 6, and 8 present four; and samples XRD-9 presents only three. Additionally, it was found that samples XRD-1, 3, 5, 6, 7, and 8, formed zeolitic materials in small quantities; sample XRD-4 formed the zeolite Faujasite; and samples XRD-1, 2, 4, and 9 formed the zeolite sodalite. Regarding the formation of new crystalline phases and zeolites; Joseph et al. [21] state that the formation of zeolites or new crystalline phases occurs when the amorphous phases after aging are reorganized and after that nucleation occurs for the growth and formation of new crystals; finally, Ren et al. [25] points out that the amorphous aluminosilicate and insoluble crystalline phases were completely transformed into zeolite A with a high crystallization of 94%.
The modified fly ash with the highest surface area was 33.99 m2/g corresponding to sample 7 (BETMFA-7), a value that increased by a factor of 4 compared to the fly ash in the initial condition. According to studies carried out in obtaining adsorbent materials from fly ash, Ren et al. [25] obtained single-phase zeolite A with a surface area of 43.7 m2/g by the alkaline fusion hydrothermal method; Wulandari et al. [15] obtained zeolite A with initial alkaline fusion treatment followed by a hydrothermal method, which showed a surface area of 37.12 m2/g; Joseph et al. [21] synthesized zeolite 4A in pure phase from coal fly ash, the surface area analysis showed an area of 122 m2/g, and Wulandari et al. [15] by microwave and ultrasound treatment obtained pure phase sodalite with a surface area of 16 m2/g. As can be observed in the treatments carried out on fly ash in the various investigations, different values of surface area were obtained, so we affirm that the treatment of fly ash in an alkaline thermal medium causes the modification of the surface area of fly ash.
Using the response surface methodology, the influence of NaOH concentration and stirring time on the modification of the surface area was analyzed. The influence of both variables is visualized in Figure 8; in this figure, it is observed that, by increasing the NaOH concentration up to the second level, the surface area increases up to a maximum, after which it decreases; likewise, the influence of the stirring time presents the same characteristic. With the first two levels of stirring time, the surface area increases up to a maximum and then decreases. According to Gonzalez et al. [36] found that NaOH concentration and reaction time are the most important factors in the modification of fly ash to obtain adsorbent materials (including zeolite formation). We conclude that both independent variables have a positive influence on the increase of fly ash surface area in the first two levels, then decrease when the third level is reached; likewise, according to results and information from other works show that sodium hydroxide (NaOH) is an important activating agent in the hydrothermal modification of fly ash.
The results in Table 11 of the removal using modified ashes show that the RCd-8 sample presents the highest degree of removal of Cd(II) ions, 99.75%, under the most favorable operating conditions of 30 min and 600 rpm stirring speed. Utilizing the response surface methodology, it was determined that the optimum removal conditions were 30 min, 800 rpm, and 99.76% removal. According to the results of Table 4 on the removal of fly ash in its initial condition, an average of 20% of Cd(II) ions was removed; using the modified ash, the degree of removal of these ions was increased by 5 times. Regarding the removal of metal ions using fly ash to obtain adsorbent materials, Yang et al. [23] obtained pure zeolite 4A using fly ash, and evaluated the removal efficiency of Cu2+ in an aqueous solution by the synthesized zeolite; He et al. [22] used coal fly ash to synthesize a new type A zeolite, which was highly efficient as an adsorbent, they removed up to 94% of Ni2+ ions in wastewater, and Joseph et al. [21] obtained FAU-type zeolite prepared from coal fly ash, they demonstrated the efficiency of zeolite for adsorption of metal ions in the order: Pb(II) > Cu(II) > Cd(II) > Zn(II) > Co(II). In this way, fly ashes are starting materials for obtaining adsorbent materials and zeolites, which are applied in the removal of heavy metals in liquid effluents; with this type of application, one of the objectives of the circular economy is met, which consists of giving an added value to a material considered as a solid pollutant.
Based on the experimental results using modified fly ash, 99.75% of Cd(II) ions were removed; by response surface methodology, results were obtained from the analysis of the influence of stirring time and speed on the removal of Cd(II). Figure 12 shows the influence of stirring time and speed on the percentage removal of Cd(II) ions. In the case of the removal time variable: if it is increased in the first two levels, the removal percentage decreases drastically to a minimum, and with the third time level the removal percentage increases slightly. As for the influence of stirring speed, when it is increased up to the second level of stirring speed the percentage of removal decreases slightly, and when the third level is reached, the percentage of removal increases notoriously. According to the results obtained, the individual influence of the stirring speed has the greatest effect on the percentage of Cd(II) ion removal.
5. Conclusions
The characterization of fly ash from the brick-baking industry in its initial state, using X-ray diffraction (XRD), revealed that its mineralogical composition primarily consists of quartz (SiO2) and muscovite (K0.8Na0.2Fe0.05Al2.95Si3.1O10(OH)2). Surface area analysis by the BET method determined an initial specific surface area of 8.59 m2/g.
The modification of fly ash to improve its adsorption capacity also allowed the formation of new crystalline phases, with properties similar to zeolites, including porous crystalline structures that could act as a molecular sieve. The following favorable conditions were obtained: NaOH concentration of 2 M, 60 min of stirring, and a surface area of 33.99 m2/g. Using Response Surface Methodology (RSM), the optimal operating conditions were refined to a NaOH concentration of 1.93 M, 61.52 min of stirring, and a surface area of 33.92 m2/g.
The RSM analysis demonstrated that both NaOH concentration and stirring time significantly influence the modification process. As these variables increase up to their second level, the surface area also increases, peaking before a decline. Notably, NaOH concentration exerts a greater influence, maintaining consistent increases without reaching a minimum value, whereas stirring time shows a more pronounced decline after the maximum is achieved.
For the removal of Cd(II) ions using modified fly ash, the experimental results identified favorable conditions of 30 min of stirring at 600 rpm, achieving a removal efficiency of 99.75%. By applying RSM, the optimal conditions for Cd(II) ion removal were determined to be 30 min of stirring at 800 rpm, with an efficiency of 99.76%.
This research makes a significant contribution to promoting the circular economy in the brick-firing industry. It aligns with the United Nations Sustainable Development Goal 12, which emphasizes responsible production and consumption practices. By repurposing fly ash—a common industrial waste product—into an effective material for water treatment, this study supports sustainable practices and waste minimization within the industry.
Author Contributions
Conceptualization, L.F.P.-C.; methodology, L.A.C.-V.; software, L.A.C.-V.; validation, L.F.P.-C.; formal analysis, L.G.C.-P. and A.T.-G.; investigation, L.A.C.-V.; resources, L.G.C.-P.; data curation, L.G.C.-P.; writing—original draft preparation, L.F.P.-C. and J.L.Q.-C.; writing—review and editing, J.V.G.-F.; visualization, J.V.G.-F.; supervision, A.T.-G. All authors have read and agreed to the published version of the manuscript.
Funding
This research received no external funding.
Data Availability Statement
The original contributions presented in this study are included in the article. Further inquiries can be directed to the corresponding author.
Acknowledgments
We would like to thank the ‘El Carmen’ brick factory in the town of Compañía Huamanga-Ayacucho for providing the fly ash samples for this study; the Comité de Administración de los Recursos para la Capacitación (CAREC-Peru), the Instituto Geológico Minero Metalúrgico (INGEMMET-Peru) for facilitating the XRD analyses of the samples, the Catalysis Laboratory of the Chemistry Section of the National Engineering University in Lima-Peru for supporting the surface area determination using the BET method, and the company Actlabs Skyline Peru S.A.C.-Lima for the Cd(II) content analysis.
Conflicts of Interest
The authors declare no conflicts of interest.
References
- Valeev, D.; Kunilova, I.; Alpatov, A.; Mikhailova, A.; Goldberg, M.; Kondratiev, A. Complex Utilisation of Ekibastuz Brown Coal Fly Ash: Iron & Carbon Separation and Aluminum Extraction. J. Clean. Prod. 2019, 218, 192–201. [Google Scholar] [CrossRef]
- Gjyli, S.; Korpa, A.; Teneqja, V.; Siliqi, D.; Belviso, C. Siliceous Fly Ash Utilization Conditions for Zeolite Synthesis. Environ. Sci. Proc. 2021, 6, 24. [Google Scholar] [CrossRef]
- Alterary, S.; Marei, N.H. The Impact of Coal Fly Ash Purification on Its Antibacterial Activity. Minerals 2020, 10, 1002. [Google Scholar] [CrossRef]
- Fukasawa, T.; Horigome, A.; Tsu, T.; Karisma, A.D.; Maeda, N.; Huang, A.N.; Fukui, K. Utilization of Incineration Fly Ash from Biomass Power Plants for Zeolite Synthesis from Coal Fly Ash by Hydrothermal Treatment. Fuel Process. Technol. 2017, 167, 92–98. [Google Scholar] [CrossRef]
- UNE-EN 450-1:2006+A1:2008; Cenizas Volantes Para Hormigón. Parte 1: Definiciones, Especificaciones y Criterios de Conformidad. Asociación Española de Normalización y Certificación: Madrid, Spain, 2008.
- Bhatt, A.; Priyadarshini, S.; Acharath Mohanakrishnan, A.; Abri, A.; Sattler, M.; Techapaphawit, S. Physical, Chemical, and Geotechnical Properties of Coal Fly Ash: A Global Review. Case Stud. Constr. Mater. 2019, 11, e00263. [Google Scholar] [CrossRef]
- Whiteside, M.; Herndon, J.M.; Syed Zaidi, F. Aerosolized Coal Fly Ash: Risk Factor for COPD and Respiratory Disease. J. Adv. Med. Med. Res. 2018, 26, 1–13. [Google Scholar] [CrossRef]
- Yadav, V.K.; Saxena, P.; Lal, C.; Gnanamoorthy, G.; Choudhary, N.; Singh, B.; Tavker, N.; Kalasariya, H.; Kumar, P. Synthesis and Characterization of Mullites From Silicoaluminous Fly Ash Waste. Int. J. Appl. Nanotechnol. Res. (IJANR) 2020, 5, 10–25. [Google Scholar] [CrossRef]
- Ge, J.C.; Yoon, S.K.; Choi, N.J. Application of Fly Ash as an Adsorbent for Removal of Air and Water Pollutants. Appl. Sci. 2018, 8, 1116. [Google Scholar] [CrossRef]
- Carreño-Flórez, E.F.; Ferrer-Pacheco, M.Y.; Peña-Rodríguez, G. Sodic and Potassium Zeolites from Fly Ash Coming from Coal Combustion of Thermoelectric Termotasajero S.A.S. Cienc. Desarro. 2019, 10, 219–233. [Google Scholar] [CrossRef]
- Miricioiu, M.G.; Niculescu, V.C. Fly Ash, from Recycling to Potential Raw Material for Mesoporous Silica Synthesis. Nanomaterials 2020, 10, 474. [Google Scholar] [CrossRef]
- Feng, W.; Wan, Z.; Daniels, J.; Li, Z.; Xiao, G.; Yu, J.; Xu, D.; Guo, H.; Zhang, D.; May, E.F.; et al. Synthesis of High Quality Zeolites from Coal Fly Ash: Mobility of Hazardous Elements and Environmental Applications. J. Clean. Prod. 2018, 202, 390–400. [Google Scholar] [CrossRef]
- García Barrero, J.A.; Pazos Zarama, M.C.; Chaparro Barajas, J.R.; Fonseca Martínez, D.A.; Pavón González, E.; Alba Carranza, M.D. Síntesis De Zβ A Partir de Cenizas Volantes, Utilizadas En Liberación Controlada De Nitratos. Cienc. Desarro. 2020, 11, 159–175. [Google Scholar] [CrossRef]
- Iqbal, A.; Sattar, H.; Haider, R.; Munir, S. Synthesis and Characterization of Pure Phase Zeolite 4A from Coal Fly Ash. J. Clean. Prod. 2019, 219, 258–267. [Google Scholar] [CrossRef]
- Wulandari, W.; Paramitha, T.; Rizkiana, J.; Sasongko, D. Characterization of Zeolite A from Coal Fly Ash Via Fusion-Hydrothermal Synthesis Method. IOP Conf. Ser. Mater. Sci. Eng. 2019, 543, 012034. [Google Scholar] [CrossRef]
- Parra-Huertas, R.A.; Calderón-Carvajal, C.O.; Gómez-Cuaspud, J.A.; Vera-López, E. Synthesis and Characterization of Faujasite-Na from Fly Ash by the Fusion-Hydrothermal Method. Boletín Soc. Española Cerámica Vidr. 2023, 62, 527–542. [Google Scholar] [CrossRef]
- Amoni, B.C.; Freitas, A.D.L.; Bessa, R.A.; Oliveira, C.P.; Bastos-Neto, M.; Azevedo, D.C.S.; Lucena, S.M.P.; Sasaki, J.M.; Soares, J.B.; Soares, S.A.; et al. Effect of Coal Fly Ash Treatments on Synthesis of High-Quality Zeolite A as a Potential Additive for Warm Mix Asphalt. Mater. Chem. Phys. 2022, 275, 125197. [Google Scholar] [CrossRef]
- Längauer, D.; Čablík, V.; Hredzák, S.; Zubrik, A.; Matik, M.; Danková, Z. Preparation of Synthetic Zeolites from Coal Fly Ash by Hydrothermal Synthesis. Materials 2021, 14, 1267. [Google Scholar] [CrossRef]
- Makgabutlane, B.; Nthunya, L.N.; Musyoka, N.; Dladla, B.S.; Nxumalo, E.N.; Mhlanga, S.D. Microwave-Assisted Synthesis of Coal Fly Ash-Based Zeolites for Removal of Ammonium from Urine. RSC Adv. 2020, 10, 2416–2427. [Google Scholar] [CrossRef]
- Boycheva, S.; Zgureva, D.; Lazarova, K.; Babeva, T.; Popov, C.; Lazarova, H.; Popova, M. Progress in the Utilization of Coal Fly Ash by Conversion to Zeolites with Green Energy Applications. Materials 2020, 13, 2014. [Google Scholar] [CrossRef]
- Joseph, I.V.; Tosheva, L.; Doyle, A.M. Simultaneous Removal of Cd(II), Co(II), Cu(II), Pb(II), and Zn(II) Ions from Aqueous Solutions via Adsorption on FAU-Type Zeolites Prepared from Coal Fly Ash. J. Environ. Chem. Eng. 2020, 8, 103895. [Google Scholar] [CrossRef]
- He, X.; Yao, B.; Xia, Y.; Huang, H.; Gan, Y.; Zhang, W. Coal Fly Ash Derived Zeolite for Highly Efficient Removal of Ni2+ Inwaste Water. Powder Technol. 2020, 367, 40–46. [Google Scholar] [CrossRef]
- Yang, L.; Qian, X.; Yuan, P.; Bai, H.; Miki, T.; Men, F.; Li, H.; Nagasaka, T. Green Synthesis of Zeolite 4A Using Fly Ash Fused with Synergism of NaOH and Na2CO3. J. Clean. Prod. 2019, 212, 250–260. [Google Scholar] [CrossRef]
- Liu, Y.; Wang, G.; Wang, L.; Li, X.; Luo, Q.; Na, P. Zeolite P Synthesis Based on Fly Ash and Its Removal of Cu(II) and Ni(II) Ions. Chin. J. Chem. Eng. 2019, 27, 341–348. [Google Scholar] [CrossRef]
- Ren, X.; Xiao, L.; Qu, R.; Liu, S.; Ye, D.; Song, H.; Wu, W.; Zheng, C.; Wu, X.; Gao, X. Synthesis and Characterization of a Single Phase Zeolite A Using Coal Fly Ash. RSC Adv. 2018, 8, 42200–42209. [Google Scholar] [CrossRef]
- Tauanov, Z.; Shah, D.; Inglezakis, V.; Jamwal, P.K. Hydrothermal Synthesis of Zeolite Production from Coal Fly Ash: A Heuristic Approach and Its Optimization for System Identification of Conversion. J. Clean. Prod. 2018, 182, 616–623. [Google Scholar] [CrossRef]
- Sivalingam, S.; Sen, S. Optimization of Synthesis Parameters and Characterization of Coal Fly Ash Derived Microporous Zeolite X. Appl. Surf. Sci. 2018, 455, 903–910. [Google Scholar] [CrossRef]
- Kunecki, P.; Panek, R.; Wdowin, M.; Franus, W. Synthesis of Faujasite (FAU) and Tschernichite (LTA) Type Zeolites as a Potential Direction of the Development of Lime Class C Fly Ash. Int. J. Miner. Process. 2017, 166, 69–78. [Google Scholar] [CrossRef]
- Liu, J.; Mwamulima, T.; Wang, Y.; Fang, Y.; Song, S.; Peng, C. Removal of Pb(II) and Cr(VI) from Aqueous Solutions Using the Fly Ash-Based Adsorbent Material-Supported Zero-Valent Iron. J. Mol. Liq. 2017, 243, 205–211. [Google Scholar] [CrossRef]
- Xiyili, H.; Çetintaş, S.; Bingöl, D. Removal of Some Heavy Metals onto Mechanically Activated Fly Ash: Modeling Approach for Optimization, Isotherms, Kinetics and Thermodynamics. Process Saf. Environ. Prot. 2017, 109, 288–300. [Google Scholar] [CrossRef]
- Cardoso, A.M.; Horn, M.B.; Ferret, L.S.; Azevedo, C.M.N.; Pires, M. Integrated Synthesis of Zeolites 4A and Na–P1 Using Coal Fly Ash for Application in the Formulation of Detergents and Swine Wastewater Treatment. J. Hazard. Mater. 2015, 287, 69–77. [Google Scholar] [CrossRef]
- Abbas, S.; Saleem, M.A.; Kazmi, S.M.S.; Munir, M.J. Production of Sustainable Clay Bricks Using Waste Fly Ash: Mechanical and Durability Properties. J. Build. Eng. 2017, 14, 7–14. [Google Scholar] [CrossRef]
- Ortiz Medina, Ó.L.; Agudelo Valencia, R.N.; Tovar Castañeda, L.M.; Gutiérrez Camargo, N. Evaluación de Cenizas Volantes Como Material Adsorbente Para La Remoción de Pb2+ En Solución Acuosa. Revista Mutis 2018, 8, 47–56. [Google Scholar] [CrossRef]
- Pérez-Chauca, L.F. Condiciones de Operación Favorables Para La Modificación Del Área Superficial de Las Cenizas Volantes de La Industria Del Cocido de Ladrillos Para Su Aplicación En La Remoción de Iones Cadmio (II); Universidad Nacional Federico Villarreal: Lima, Peru, 2023. [Google Scholar]
- Amaya, J.; Tristancho, A.; Sánchez Castellanos, F.J. Employing Fly Ash and FCC Catalyser Waste in Recovering Chrome (III) from Liquid Effluent Emitted by Tanneries. Rev. Ing. Investig. 2005, 57, 39–48. [Google Scholar]
- González, D.R.; Pérez, L.; Santa, A.; Ramírez, J.H. Producción y Caracterización de Zeolita Obtenida a Partir de Ceniza Volante Mediante DRX. Momento Rev. Física 2014, 48E, 52–60. [Google Scholar]


Disclaimer/Publisher’s Note: The statements, opinions and data contained in all publications are solely those of the individual author(s) and contributor(s) and not of MDPI and/or the editor(s). MDPI and/or the editor(s) disclaim responsibility for any injury to people or property resulting from any ideas, methods, instructions or products referred to in the content. |
© 2025 by the authors. Licensee MDPI, Basel, Switzerland. This article is an open access article distributed under the terms and conditions of the Creative Commons Attribution (CC BY) license (https://creativecommons.org/licenses/by/4.0/).