Article

Effect of Additional Loads on Joint Kinetics and Joint Work Contribution in Males and Females Performing Vertical Countermovement Jumps

Department of Sports and Exercise Science, University of Salzburg, 5020 Salzburg, Austria
*
Author to whom correspondence should be addressed.
Biomechanics 2022, 2(3), 319-330; https://doi.org/10.3390/biomechanics2030025
Submission received: 29 April 2022 / Revised: 30 June 2022 / Accepted: 4 July 2022 / Published: 8 July 2022
(This article belongs to the Special Issue Sports Biomechanics)

Abstract

:
This study aimed to investigate the effect of additional loads and sex on countermovement jump (CMJ) joint kinetics during the entire take-off impulse in males and females. Twelve female and 13 male sport students performed vertical countermovement jumps without and with additional loads up to +80% of body mass using a straight barbell. Ground reaction forces and body kinematics were collected simultaneously. A significant increase was found for peak ankle power, whereas knee and hip peak power decreased significantly as additional load increased in both males and females. Joint work increased in each joint as additional load increased, although significance was observed only in the hip joint. Peak power of each joint (22–47%) and total hip work (61%) were significantly higher for males than females. Relative joint contributions to total joint work (“joint work contribution”) remained stable as additional loads increased, whereas meaningful differences were found in the magnitudes of joint work contribution between males and females. CMJ joint kinetics and joint work contributions were distinctly influenced by additional load and sex. Hence, these differences should be considered when prescribing loaded jumps for training or testing.

1. Introduction

Vertical countermovement jumps (CMJs) are frequently used in strength training and performance testing because they are simple, sport-specific, reproducible, and diagnostically valuable [1,2,3]. Maximizing mechanical power is crucial for improving athletic performance [4,5], and loaded jumps are frequently used to achieve this. Specifically, jumping with additional loads of 20–30% body mass appears to maximize explosive strength across a training cycle [1], and this exercise has the advantage of simple implementation versus weightlifting derivatives [6].
Furthermore, CMJs without and with additional load (up to 80–100% of body mass) are used to quantify an athlete’s performance level by investigating parameters such as jump height, force, and power [7,8,9,10]. Lower body power output originates from a complex combination of lower-limb joint contributions [11]. McErlain-Naylor et al. [12] investigated CMJ kinetic and kinematic parameters and found that joint kinetics (especially knee and ankle peak joint power) substantially determine CMJ performance.
Increasing additional load during jumping implicitly changes the total power output by increasing force and decreasing velocity [13]. Moreover, CMJ load increases concentric phase duration, net impulse, and mean force during the propulsive and braking phase of the jump, among other kinematic and kinetic variables [1,14]. While the relationship between load and global kinetics (i.e., net impulse, center of mass power, etc.) is well understood [1,14], the influence of load on CMJ joint kinetics is not thoroughly investigated. Previous studies [15,16,17,18,19,20] found that additional load affects joint kinetics, but the findings were inconsistent. Some studies reported increased lower-limb joint work [16], whereas others reported decreases in this variable [15]. Joint power appeared unaffected or decreased with increasing load [15,16,20]. However, individual characteristics and load conditions might explain these inconsistencies. Some studies used weighted vests and applied moderate loads up to 35 kg with straps close to the center of mass [15,16,17], while others used straight barbells and added heavy loads up to 90% of the one-repetition maximum [18,19,20]. Discrepant findings might be caused by different positions of additional loads. It has been shown that load position (e.g., straight versus hexagonal barbell) has meaningful effects on body kinematics and kinetics [21]. Straight barbells are perhaps the most commonly used loading modality in strength training and performance testing. Studies investigating joint kinetics using straight barbells and heavy additional loads only studied male athletes [18,19,20]. These studies did not report joint work, which could help to obtain a holistic picture of the effect of load on relative joint work contributions.
Moreover, while male and female CMJ joint kinetics and the relative joint work contributions differ [15], studies have not yet reported female joint kinetics during CMJs with heavy loads. This jeopardizes the validity and effectiveness of CMJ parameter selection if adhering to recommendations made from research gathered on males. This appears to be a systematic problem; only about 63% of sports science research includes female participants, and 3% of the studies cover females exclusively [22]. It may be erroneous to apply evidence-based information derived from males to females, since female strength and performance differ substantially owing to hormonal fluctuation, anthropometrics, and training history opportunities [23,24,25]. Hence, a holistic picture of the effects from heavy barbell loads on joint kinetics in males and females is still missing. This may have implications for training prescription and test selection.
Therefore, we aimed to investigate the effect of additional loads using a straight barbell on CMJ joint kinetics during take-off in males and females. We hypothesized that there would be significant effects of (i) additional load on CMJ joint kinetic values, (ii) sex on joint kinetic values, and (iii) sex on joint work contributions.

2. Materials and Methods

2.1. Participants

Twelve female (age: 24.9 ± 2.4 years, body mass: 60.6 ± 8.2 kg; body height: 1.66 ± 0.05 m) and 13 male (age: 25.2 ± 3.9 years, body mass: 74.9 ± 6.0 kg; body height: 1.79 ± 0.08 m) sport students volunteered to participate in this study (based on an a priori power analysis with power of 0.9, p = 0.05, effect size 0.25, two groups, and five conditions; due to an injury, one female participant had to be excluded and could not be replaced on time). The participants were physically active and conducted strength training regularly (≥2 h/week) at least for the last 2 years. Participants were informed about the experimental procedure, aims, and potential risks, and they were excluded if they had a lower-limb injury in the previous 6 months, cardiovascular disorders, or any reported pain that hindered vertical jumping with additional loads.

2.2. Design

A cross-sectional design was used to determine cohort-dependent effects of additional loads on joint kinetics during CMJ take-off. Participants attended two countermovement jump sessions. The first one was used as a familiarization session at least 48 h prior to the test session. Then, participants performed the test session of CMJ with progressive load conditions.
At the beginning of the test session, participants performed a supervised warm-up, including 10 min of low-intensity treadmill jogging, dynamic stretching, and core stability exercises. A specific warm-up was completed including five squats with +60% of body mass, three CMJs without additional load, and three CMJs with +40% of body mass. For the CMJ testing, participants executed four CMJs with five different load conditions each: +0%, +20%, +40%, +60%, and +80% of body mass as additional load in increasing order. Breaks of 1–2 min between jumps of the same load condition and resting time of 4 min between load conditions were provided. Participants were instructed as follows: “step on the force plates, stand still, and then jump as high as possible”. CMJs were unconstrained on the basis of previous findings demonstrating higher reliability for jumps performed without controlled countermovement depths [26].

2.3. Data Collection and Analysis

Ground reaction forces (GRFs) were measured using two separated force plates (AMTI, Advanced Mechanical, Technology Inc., MSA-6 MiniAmp, Watertown, MA, USA) with a sampling rate of 1000 Hz, which was downsampled to 200 Hz. Simultaneously, kinematics were recorded using a full body marker set (Cleveland Clinic Marker Set) and a 12-camera infrared motion capture system (Qualisys AB, Göteborg, Sweden) with a sampling rate of 200 Hz. No markers were placed on the barbell. GRF and marker trajectories were low-pass filtered using a second-order, zero-lag Butterworth filter, with cutoff frequencies of 30 Hz for GRF and 6 Hz for marker trajectories.
Jump height was calculated by integrating the GRF from the propulsive phase [27]. Total system load was recorded from a static position before the CMJ was initiated. The start of the CMJ was defined as the timepoint when the GRF fell below 20 N of the total system load. The best performance (maximum jump height) out of the four jumps at each load condition was used for further analysis.
Segment positions and orientations were determined using an inverse kinematics algorithm (V3D; C-Motion, Rockville, MD, USA). The definitions of the joint angles are shown in Figure 1. Moments of inertia and centers of gravity of each segment were derived by modeling the segments as geometric solids according to Hanavan [28]. Segment masses were defined according to the values provided by Dempster [29].
An inverse dynamics approach was used to calculate net forces and net moments of the hip, knee, and ankle joints (V3D; C-Motion, Rockville, MD, USA). Net joint power was obtained by multiplying the joint moments with the respective angular velocity. Total joint work was derived by integrating the absolute values of joint power over time [15]. Leg symmetry was established by calculating the leg symmetry index (mean and peak GRF), which was 3.1% and 3.2% respectively, on average across all conditions and participants. Hence, all joint kinetic parameters were determined from the right leg. The contribution of each joint to total work, which we consider “joint work contribution”, was defined as a percentage of the overall total lower extremity joint work (sum of hip, knee, and ankle).

2.4. Statistical Analysis

All data are presented as group means and standard deviations (SD). A one-way mixed ANOVA (sex) with repeated measures (load) was performed to evaluate the main effects (Bonferroni) of load, sex, and their interaction using IBM SPSS Statistics (version 26.0; SPSS Inc, Chicago, IL, USA). Pairwise comparisons were conducted separately for males and females for each load condition (+0%, +20%, +40%, +60%, +80%) by post hoc analyses (LSD). Effect size (η2) was calculated for the main effects. Significance level was set to α = 0.05. Effect size was interpreted as small (<0.1), medium (<0.6), or large (>0.14) according to Cohen [30].

3. Results

The statistical main effects of load, sex, and their interaction are presented in Table 1. Joint kinetics, relative joint contributions, and jump heights are presented in Figure 2, Figure 3, Figure 4 and Figure 5. Statistical results of the pairwise comparisons for all load conditions can be found in the Appendix A (Table A1). Joint angles at the lowest position of the CMJ are presented in the Appendix A (Table A2).

3.1. Load

Jump height decreased significantly with increasing additional load in males and females. Post hoc pairwise comparisons revealed significant differences in jump height for each pair of the load conditions in both cohorts.
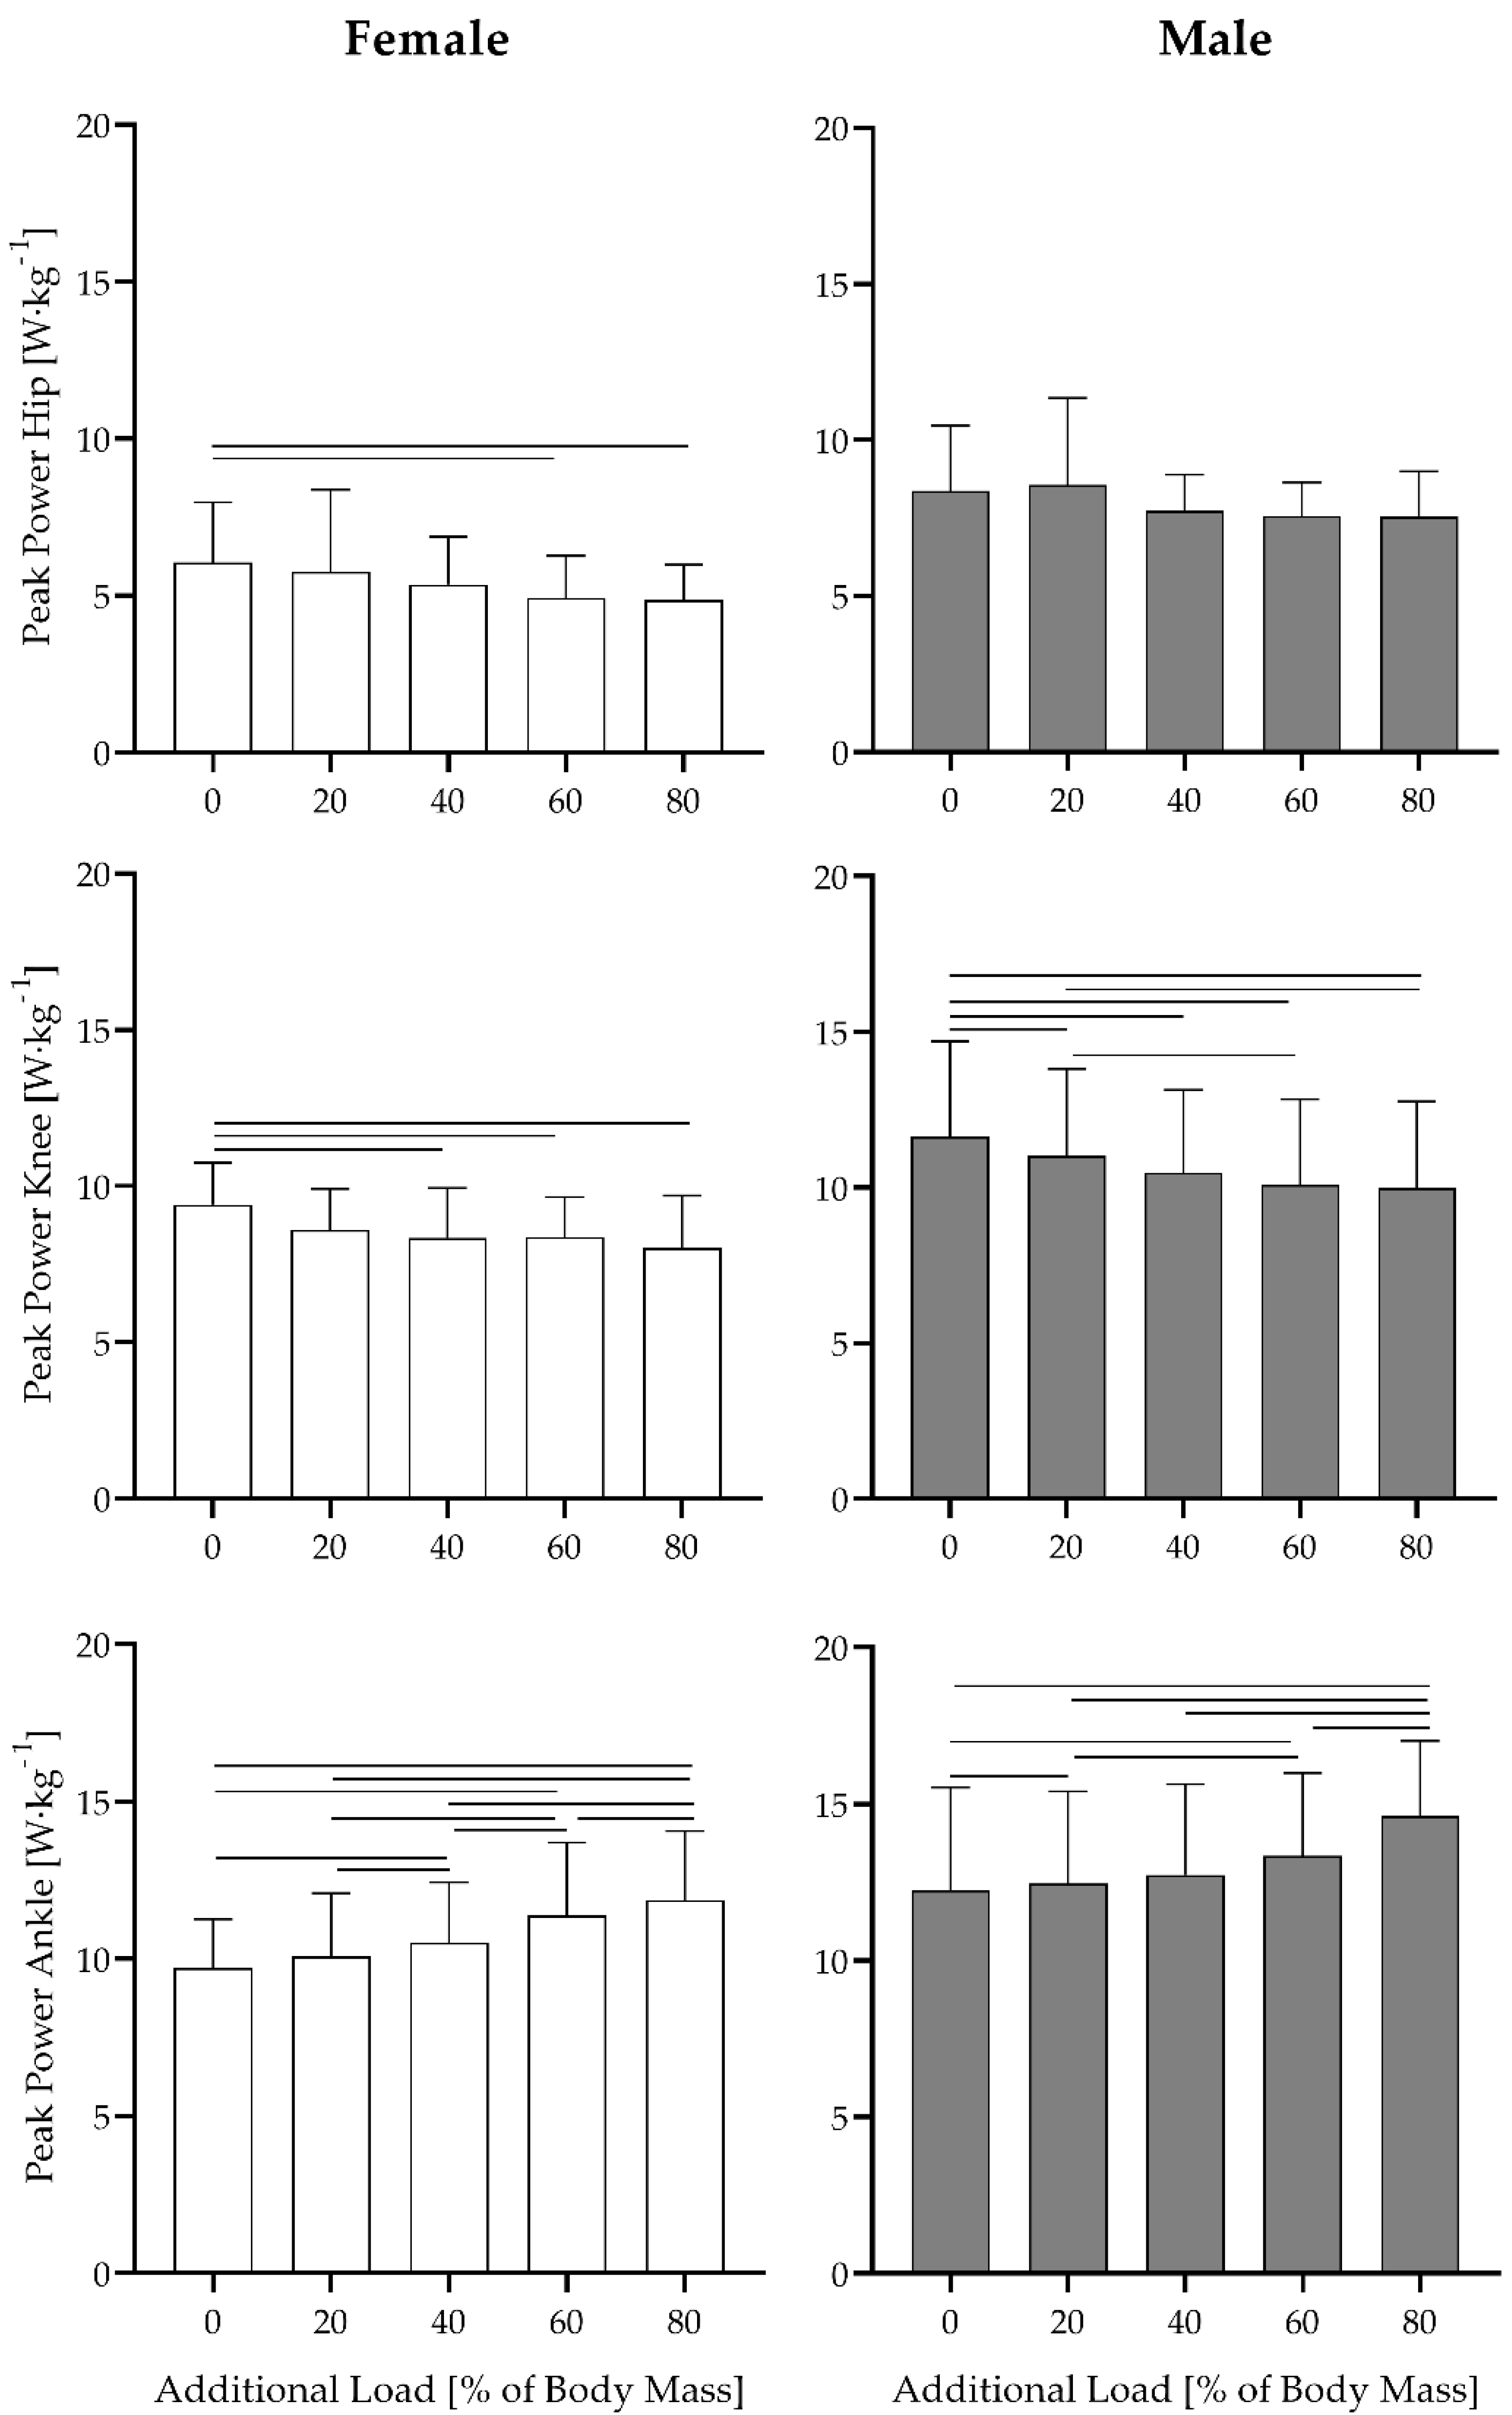
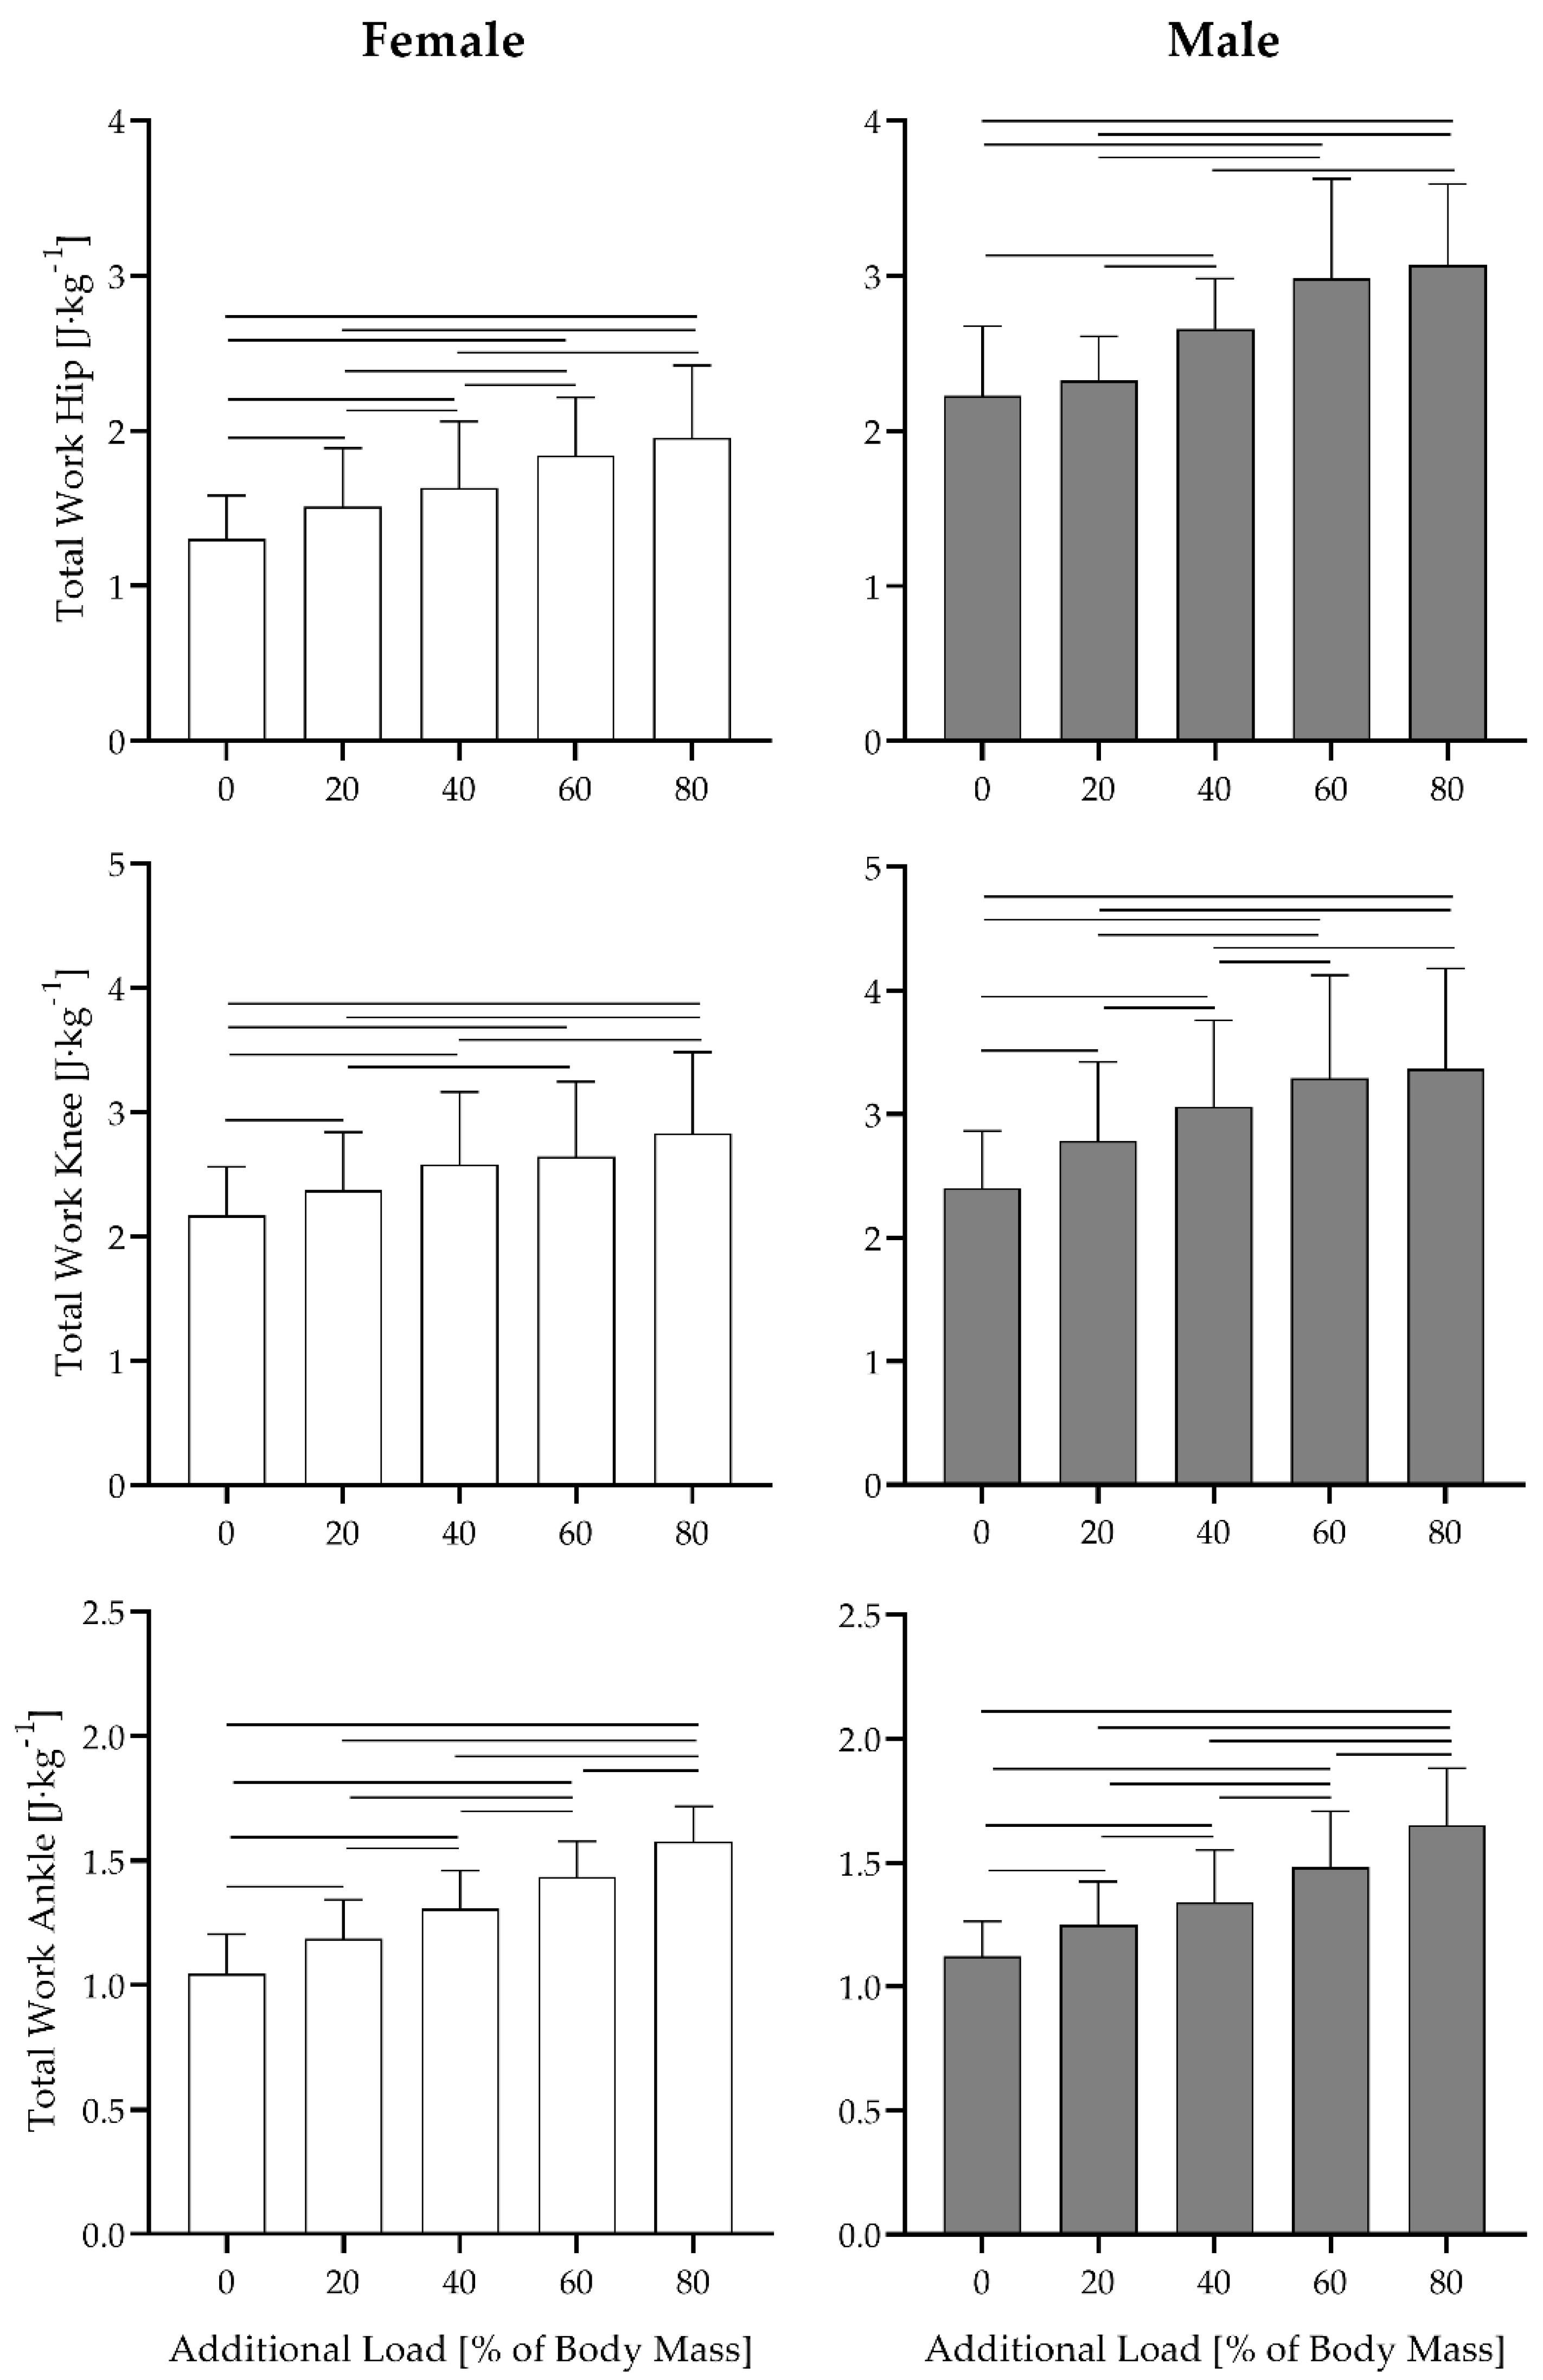
Each kinetic parameter was significantly affected by load: peak ankle power increased significantly in males and females, whereas maximal knee and hip power slightly decreased with increasing additional loads. Peak ankle power was different for females at all load conditions above 20% additional load, whereas, in males, significance was observed at the lowest and highest loads (Figure 3). In females, significant pairwise differences of peak knee power were found between the load condition pairs 0:40%, 0:60%, and 0:80%, whereas, in males, each pair was significantly different except for 20:40%, 40:60%, 40:80%, and 60:80%. Pairwise comparisons of peak hip power revealed significant differences between the 0:60% and 0:80% load conditions in females, but nothing in males. Total ankle joint work increased significantly with increasing additional loads in females and males (Figure 4).
Pairwise comparisons of total ankle joint work revealed significant differences between each pair in females, as well as in males. Total knee work increased in both cohorts with increasing additional load. Pairwise comparison of the total knee work revealed several significant differences (except for 20:40%, 40:60%, and 60:80%) in females, whereas, in males, only one pair (60:80%) was not significant. Total hip work increased as additional load increased in males and females. Pairwise comparisons revealed significant differences for most load conditions (except 60:80%) in females. In comparison, males’ pairwise comparison of total hip work showed no significant differences for the pairs 0:20%, 40:60%, and 60:80%.

3.2. Sex

Sex significantly affected jump height, peak joint power (ankle, knee, hip), and total work in the hip joint. Effect sizes ranged from medium to large (0.033 to 0.633) (Table 1). Males’ pooled jump height over all load conditions was 47.9% higher than females’ jump height. Peak power was higher in males than in females, with 22.2% (η2 = 0.215) difference in the ankle joint, 24.5% difference in the knee joint, and 47.5% difference in the hip joint. Total work was greater in males than in females with 18.6% higher knee joint work (p = 0.58) and about 61% higher hip joint work.

3.3. Joint Work Contribution (Relative Joint Contributions to Total Work)

For both males and females, the relative contribution of the joints remained stable over all load conditions (Figure 5). However, relative joint contributions to total joint work were substantially different between sexes across all load conditions. The hip joint contribution was higher in males (38%) than in females (30%) over all load conditions on average. The relative ankle and relative knee joint contributions were higher in females (ankle: 24%, knee: 46%) than in males (ankle: 19%, knee: 43%).

4. Discussion

The purpose of this study was to provide a holistic picture of CMJ joint kinetics among males and females across different load conditions. Joint kinetics and jump height were affected by load and most parameters by sex, whereas an interaction effect was found only for jump height. Furthermore, while joint work contribution was hardly affected by load, it was substantially different between sexes.

4.1. Load

The relative increase in ankle and decreases in knee and hip peak joint power with additional load diverge from previous similar studies. Moir and colleagues [19] and Feeney and colleagues [16] found a decrease in joint power for all three lower-limb joints, whereas others reported no influence of additional load on joint power [15]. However, Fain, Seymore, Lobb, and Brown [15] used relatively light weight vests (up to 35 kg) compared to Moir and colleagues [19] and our study, which used heavy barbell loads up to 85% of one-repetition maximum. This could explain the discrepancies in joint power. However, none of the mentioned studies reported an increase of ankle peak joint power. We speculate that this difference stems from the type of vertical jump used, since Moir and colleagues [19] utilized squat jumps (SJ) and participants performed CMJs in the current study. CMJs generally have higher take-off velocities, resulting in larger jump heights than in squat jumps [31]. Moreover, biarticular muscles (rectus femoris and gastrocnemius) transfer energy from the proximal to distal joints (intersegmental mechanical energy transfer) [32]. This effect is possibly enhanced due to the additional load, which could have contributed to the observed increase in ankle joint power. Hence, future interventions could investigate maximizing ankle joint power to improve lower body power in athletes who frequently perform such explosive movements under load.
Joint work significantly increased in the ankle, knee, and hip joint as additional load increased; these findings are in line with previous studies [15,16,17]. Our results with heavy barbell loads reflect similar joint work values, even though these other studies applied relatively low additional loads via weighted vests. It is unknown if similar trends exist for loaded jumps using alternative modalities such as a hexagonal barbell or a Smith machine.

4.2. Sex

Males jumped 47.9% higher, on average, than females across all load conditions. We found significantly higher peak joint power for males at the ankle, knee, and hip joint, while joint work was significantly higher only in the hip joint. Previous studies found similar results confirming higher joint kinetics for males than for females [15,17]. Specifically, hip joint work showed the biggest difference between males and females. Moreover, this was the only joint kinetic parameter which was close to a significant interaction effect between load and sex (p = 0.98); the effect of increased additional load on hip joint work was greater in males than in females. We also observed different body kinematics between males and females. Males had a greater hip angle than females at the deepest position of the CMJ (males = 98° ± 4°, females = 90° ± 4°), resulting in a more forward trunk position versus females. Hence, males had a greater range of motion at the hip joint. Consequently, the hip extensors of females may not contribute to the same extent as those of males to overall jump performance. It is known that trunk position has a substantial effect on CMJ performance and joint kinetics (e.g., knee joint power) [33], and studies have observed that females perform CMJ with additional load with a less inclined trunk. This could be attributed to weaker trunk stability in females, which is partly supported by reports of lower muscular trunk endurance in females than in males [34]. Differences in hip joint work might explain some of the large sex differences in jump height. Moreover, jump height was the only parameter with an interaction effect between sex and load; trunk angle and hip work could contribute to this diverging trend. The result of a higher relative ankle joint work contribution in females than in males is in line with previous findings [15]. It was speculated that females might use the spring mechanics of the ankle soft tissue more efficiently than males [15,35]. Moreover, it has been shown that females store elastic energy in the ankle joint better than males and may use the elastic properties of the soft tissue more efficiently in the eccentric phase of the CMJ [36,37]. Moreover, the higher relative ankle and knee joint contribution in females compared to males might be due to a redistribution of work between joints. This may be a result of the reduced relative hip joint contribution in females.

4.3. Joint Work Contribution

Since relative joint contributions to total joint work were stable as additional load increased, joint work contribution appears to be minimally unaffected by additional load in males and females (Figure 5). Consequently, by adding additional loads in jump exercises, the ankle, knee, and hip joint are affected in a similar way; thus, the structures around these joints can be developed in a jump training regime accordingly.
Relative joint contribution magnitudes obtained in the present study differ from previous findings; we found higher knee and hip joint and lower ankle joint contributions compared to Fain, Seymore, Lobb, and Brown [15]. Since load placement affects body kinematics and kinetics [21], these disparities might reflect methodological differences in additional load selection (weighted vests versus straight barbells).
We found meaningful differences between males’ and females’ joint work contributions. Females’ ankle and knee joint contributions were relatively higher than males, whereas hip joint contribution was lower. The higher knee joint contribution in females might be explained, as discussed above, by the different trunk inclinations between males and females. This assumption is supported by previous findings showing increased knee joint power due to decreased trunk inclination [33]. This indicates higher knee joint load in females than in males due to increased torques occurring in females’ knee joints. Hence, practitioners and coaches should be aware of these effects when utilizing heavy additional loads with females.

4.4. Limitations

To fully understand the underlying mechanisms which determine joint kinetics and joint work contributions between males and females, a larger investigation of full-body kinematics is required. Additionally, studying muscle activation could further explain hip joint work contribution differences between males and females. Although we assumed leg symmetry on the basis of previous findings [38], this aspect could be addressed in future research by evaluating inter-limb differences in joint kinetics. We speculate that the standardization of additional loads relative to body mass might have influenced our findings. Standardizing loads relative to the one-repetition maximum or relative to lean body mass could elucidate differences between males and females [39] by reducing the effect of known differences in relative strength and lean mass characteristics. Nevertheless, since performance testing commonly uses body mass scaling [40,41], we believe that our current findings can be generalized across many domains.

5. Conclusions

CMJ joint kinetics during take-off are affected by additional loads in males and females. Moreover, we conclude that males and females exhibit different and distinct joint work contributions characterized by the near-significant interaction effect between load and sex for hip joint work, the differences in relative joint contributions, and the discrepant hip joint angles at the lower CMJ position. Females’ loaded CMJ performance might be limited by weaker core stability resulting in decreased relative hip joint contribution compared to males. Additionally, knee joint load is higher in females compared to males due to the more upright trunk position when jumping with additional barbell loads. Hence, similar additional barbell load leads to different joint loading and joint contribution between males and females, which has to be considered when designing training regimes, strength testing, and rehabilitation programs.

Author Contributions

Conceptualization, I.F., J.K. and H.S.; methodology, I.F. and J.K.; software, I.F.; formal analysis, I.F.; investigation, I.F and E.H.; resources, H.S.; data curation, I.F.; writing—original draft preparation, I.F.; writing—review and editing, E.H., J.K. and H.S.; visualization, I.F.; supervision, H.S.; project administration, H.S. All authors have read and agreed to the published version of the manuscript.

Funding

This research received no external funding.

Institutional Review Board Statement

The study was conducted in accordance with the Declaration of Helsinki and approved by the Ethics Committee of University of Salzburg (EK-GZ: 5/2022 27 January 2022).

Informed Consent Statement

Informed consent was obtained from all subjects involved in the study.

Data Availability Statement

Not applicable.

Acknowledgments

We sincerely thank all sport students who participated in this study.

Conflicts of Interest

The authors declare no conflict of interest.

Appendix A

Table A1. The p-values from the post hoc pairwise comparison of the load condition pairs (A:B).
Parameterp-Values—Load Condition Pairs (% of Body Mass)
Female0:200:400:600:8020:4020:6020:8040:6040:8060:80
Jump height0.0000.0000.0000.0000.0000.0000.0000.0000.0000.000
Peak power ankle0.2980.0190.0010.0000.0240.0000.0000.0030.0000.022
Peak power knee0.0660.0390.0310.0270.4660.4900.2030.9110.3040.122
Peak power hip0.5480.2510.0330.0320.5920.2480.1770.1700.1080.807
Total work ankle0.0000.0000.0000.0000.0020.0000.0000.0010.0000.000
Total work knee0.0220.0020.0010.0010.0910.0220.0130.5300.0090.072
Total work hip0.0050.0010.0000.0000.0140.0010.0030.0010.0030.270
Male
Jump height0.0000.0000.0000.0000.0000.0000.0000.0000.0000.000
Peak power ankle0.6160.3460.0350.0020.2750.0190.0000.0570.0010.003
Peak power knee0.0410.0030.0070.0000.0680.0040.0050.2910.0690.717
Peak power hip0.7320.1110.0930.1150.2060.1550.1620.5150.5200.933
Total work ankle0.0050.0000.0000.0000.0000.0000.0000.0010.0000.000
Total work knee0.0020.0000.0000.0000.0010.0000.0010.0420.0400.495
Total work hip0.2810.0010.0000.0000.0010.0000.0000.0570.0020.428
Table A2. Mean ± SD joint angles at the deepest countermovement position.
JointLoad Condition (% of Body Mass)
Female0%20%40%60%80%
Hip (°)95.0 ± 8.691.9 ± 10.489.2 ± 10.588.0 ± 9.984.1 ± 9.6
Knee (°)98.6 ± 10.396.8 ± 11.895.1 ± 10.594.2 ± 10.589.6 ± 9.6
Ankle (°)101.7 ± 4.0100.5 ± 4.199.8 ± 4.599.1 ± 4.697.7 ± 4.1
Male
Hip (°)102.7 ± 5.099.4 ± 5.398.8 ± 4.997.2 ± 6.692.5 ± 6.0
Knee (°)101.0 ± 7.6103.0 ± 7.2103.6 ± 6.6102.0 ± 6.199.2 ± 7.0
Ankle (°)96.5 ± 5.496.6 ± 6.096.1 ± 5.495.6 ± 5.795.7 ± 5.6
° = degree.

References

  1. Vaverka, F.; Jakubsova, Z.; Jandacka, D.; Zahradnik, D.; Farana, R.; Uchytil, J.; Supej, M.; Vodicar, J. The Influence of an Additional Load on Time and Force Changes in the Ground Reaction Force During the Countermovement Vertical Jump. J. Hum. Kinet. 2013, 38, 191–200. [Google Scholar] [CrossRef] [PubMed] [Green Version]
  2. McMahon, J.J.; Lake, J.P.; Suchomel, T.J. Vertical Jump Testing. In Performance Assessment in Strength and Conditioning; Routledge: New York, NY, USA, 2018; pp. 96–116. ISBN 1315222817. [Google Scholar]
  3. McGuigan, M. Monitoring Training and Performance in Athletes; Human Kinetics: Champain, IL, USA, 2017; ISBN 1492535206. [Google Scholar]
  4. Sleivert, G.; Taingahue, M. The Relationship between Maximal Jump-Squat Power and Sprint Acceleration in Athletes. Eur. J. Appl. Physiol. 2004, 91, 46–52. [Google Scholar] [CrossRef] [PubMed]
  5. Kraemer, W.J.; Newton, R.U. Training for Muscular Power. Phys. Med. Rehabil. Clin. N. Am. 2000, 11, 341–368. [Google Scholar] [CrossRef]
  6. Oranchuk, D.J.; Robinson, T.L.; Switaj, Z.J.; Drinkwater, E.J. Comparison of the Hang High Pull and Loaded Jump Squat for the Development of Vertical Jump and Isometric Force-Time Characteristics. J. Strength Cond. Res. 2019, 33, 17–24. [Google Scholar] [CrossRef] [PubMed]
  7. Ashley, C.D.; Weiss, L.W. Vertical Jump Performance and Selected Physiological Characteristics of Women. J. Strength Cond. Res. 1994, 8, 5–11. [Google Scholar] [CrossRef]
  8. Nuzzo, J.L.; McBride, J.M.; Cormie, P.; McCaulley, G.O. Relationship between Countermovement Jump Performance and Multijoint Isometric and Dynamic Tests of Strength. J. Strength Cond. Res. 2008, 22, 699–707. [Google Scholar] [CrossRef]
  9. Sheppard, J.M.; Cronin, J.B.; Gabbett, T.J.; McGuigan, M.R.; Etxebarria, N.; Newton, R.U. Relative Importance of Strength, Power, and Anthropometric Measures to Jump Performance of Elite Volleyball Players. J. Strength Cond. Res. 2008, 22, 758–765. [Google Scholar] [CrossRef] [Green Version]
  10. Wisløff, U.; Castagna, C.; Helgerud, J.; Jones, R.; Hoff, J. Strong Correlation of Maximal Squat Strength with Sprint Performance and Vertical Jump Height in Elite Soccer Players. Br. J. Sports Med. 2004, 38, 285–288. [Google Scholar] [CrossRef] [Green Version]
  11. Fukashiro, S.; Komi, P.V. Joint Moment and Mechanical Power Flow of the Lower Limb During Vertical Jump. Int. J. Sports Med. 1987, 8, 15–21. [Google Scholar] [CrossRef]
  12. McErlain-Naylor, S.; King, M.; Pain, M.T.G. Determinants of Countermovement Jump Performance: A Kinetic and Kinematic Analysis. J. Sports Sci. 2014, 32, 1805–1812. [Google Scholar] [CrossRef] [Green Version]
  13. Samozino, P.; Rejc, E.; Di Prampero, P.E.; Belli, A.; Morin, J.B. Optimal Force-Velocity Profile in Ballistic Movements—Altius: Citius or Fortius? Med. Sci. Sports Exerc. 2012, 44, 313–322. [Google Scholar] [CrossRef] [PubMed]
  14. Mundy, P.D.; Smith, N.A.; Lauder, M.A.; Lake, J.P. The Effects of Barbell Load on Countermovement Vertical Jump Power and Net Impulse. J. Sports Sci. 2017, 35, 1781–1787. [Google Scholar] [CrossRef] [PubMed]
  15. Fain, A.C.; Seymore, K.D.; Lobb, N.J.; Brown, T.N. Lower-Limb Biomechanics Differ between Sexes During Maximal Loaded Countermovement Jumps. J. Strength Cond. Res. 2021, 35, 325–331. [Google Scholar] [CrossRef] [PubMed]
  16. Feeney, D.; Stanhope, S.J.; Kaminski, T.W.; Machi, A.; Jaric, S. Loaded Vertical Jumping: Force-Velocity Relationship, Work, and Power. J. Appl. Biomech. 2016, 32, 120–127. [Google Scholar] [CrossRef] [PubMed]
  17. Harry, J.R.; Barker, L.A.; Paquette, M.R. Sex and Acute Weighted Vest Differences in Force Production and Joint Work During Countermovement Vertical Jumping. J. Sports Sci. 2019, 37, 1318–1326. [Google Scholar] [CrossRef] [PubMed]
  18. Jandacka, D.; Uchytil, J.; Farana, R.; Zahradnik, D.; Hamill, J. Lower Extremity Power During the Squat Jump with Various Barbell Loads. Sports Biomech. 2014, 13, 75–86. [Google Scholar] [CrossRef]
  19. Moir, G.L.; Gollie, J.M.; Davis, S.E.; Guers, J.J.; Witmer, C.A. The Effects of Load on System and Lower-Body Joint Kinetics During Jump Squats. Sports Biomech. 2012, 11, 492–506. [Google Scholar] [CrossRef]
  20. Williams, K.J.; Chapman, D.W.; Phillips, E.J.; Ball, N.B. Load-Power Relationship During a Countermovement Jump: A Joint Level Analysis. J. Strength Cond. Res. 2018, 32, 955–961. [Google Scholar] [CrossRef]
  21. Swinton, P.A.; Stewart, A.; Agouris, I.; Keogh, J.W.; Lloyd, R. A Biomechanical Analysis of Straight and Hexagonal Barbell Deadlifts Using Submaximal Loads. J. Strength Cond. Res. 2011, 25, 2000–2009. [Google Scholar] [CrossRef]
  22. Cowley, E.S.; Olenick, A.A.; McNulty, K.L.; Ross, E.Z. “Invisible Sportswomen”: The Sex Data Gap in Sport and Exercise Science Research. Women Sport Phys. Act. J. 2021, 29, 146–151. [Google Scholar] [CrossRef]
  23. Carmichael, M.A.; Thomson, R.L.; Moran, L.J.; Wycherley, T.P. The Impact of Menstrual Cycle Phase on Athletes’ Performance: A Narrative Review. Int. J. Environ. Res. Public Health 2021, 18, 1667. [Google Scholar] [CrossRef] [PubMed]
  24. Nimphius, S. Exercise and Sport Science Failing by Design in Understanding Female Athletes. Int. J. Sports Physiol. Perform 2019, 19, 1157–1158. [Google Scholar] [CrossRef] [PubMed] [Green Version]
  25. Mujika, I.; Taipale, R.S. Sport Science on Women, Women in Sport Science. Int. J. Sports Physiol. Perform 2019, 14, 1013–1014. [Google Scholar] [CrossRef] [PubMed] [Green Version]
  26. Janicijevic, D.; Knezevic, O.; Mirkov, D.; Pérez-Castilla, A.; Petrovic, M.; Samozino, P.; García-Ramos, A. Assessment of the Force-Velocity Relationship During Vertical Jumps: Influence of the Starting Position, Analysis Procedures and Number of Loads. Eur. J. Sport Sci. 2019, 20, 614–623. [Google Scholar] [CrossRef]
  27. Kibele, A. Possibilities and Limitations in the Biomechanical Analysis of Countermovement Jumps: A Methodological Study. J. Appl. Biomech. 1998, 14, 105–117. [Google Scholar] [CrossRef] [Green Version]
  28. Hanavan, E.P., Jr. A Mathmatical Mdoel of the Human Body. AMRL 1964, 1–149. Available online: https://cordis.europa.eu/article/id/181132-mathematical-modelling-of-the-human-body (accessed on 5 July 2022).
  29. Dempster, W.T. Space Requirements of the Seated Operator, Geometrical, Kinematic, and Mechanical Aspects of the Body with Special Reference to the Limbs. In Wright Air Development Center, Air Research and Development Command; Michigan State Univ. East Lansing: East Lansing, MI, USA, 1955. [Google Scholar]
  30. Cohen, J. Statistical Power Analysis for the Behavioral Sciences, 2nd ed.; Lawrence Erlbaum Associates: Hilldale, NY, USA, 1988; ISBN 1483276481. [Google Scholar]
  31. Bobbert, M.F.; Gerritsen, K.G.; Litjens, M.C.; Van Soest, A.J. Why Is Countermovement Jump Height Greater Than Squat Jump Height? Med. Sci. Sports Exerc. 1996, 28, 1402–1412. [Google Scholar] [CrossRef]
  32. Prilutsky, B.I.; Zatsiorsky, V.M. Tendon Action of Two-Joint Muscles: Transfer of Mechanical Energy between Joints during Jumping, Landing, and Running. J. Biomech. 1994, 27, 25–34. [Google Scholar] [CrossRef]
  33. Vanrenterghem, J.; Lees, A.; Clercq, D.D. Effect of Forward Trunk Inclination on Joint Power Output in Vertical Jumping. J. Strength Cond. Res. 2008, 22, 708–714. [Google Scholar] [CrossRef]
  34. Brotons-Gil, E.; García-Vaquero, M.P.; Peco-González, N.; Vera-Garcia, F.J. Flexion-Rotation Trunk Test to Assess Abdominal Muscle Endurance: Reliability, Learning Effect, and Sex Differences. J. Strength Cond. Res. 2013, 27, 1602–1608. [Google Scholar] [CrossRef]
  35. Farris, D.J.; Raiteri, B.J. Modulation of Leg Joint Function to Produce Emulated Acceleration During Walking and Running in Humans. R. Soc. Open Sci. 2017, 4, 160901. [Google Scholar] [CrossRef] [Green Version]
  36. Komi, P.V.; Bosco, C. Utilization of Stored Elastic Energy in Leg Extensor Muscles by Men and Women. Med. Sci. Sports 1978, 10, 261–265. [Google Scholar] [PubMed]
  37. McBride, J.M.; McCaulley, G.O.; Cormie, P. Influence of Preactivity and Eccentric Muscle Activity on Concentric Performance During Vertical Jumping. J. Strength Cond. Res. 2008, 22, 750–757. [Google Scholar] [CrossRef] [PubMed]
  38. Fritz, J.; Stallegger, J.; Fessl, I.; Schwameder, H.; Kröll, J. Jumping with Barbell Load: Assessment of Lower Limb Joint Kinematics and Kinetics During Landing. J. Biomech. 2021, 120, 110354. [Google Scholar] [CrossRef] [PubMed]
  39. Mayhew, J.; Salm, P.C. Gender Differences in Anaerobic Power Tests. Eur. J. Appl. Physiol. Occup. Physiol. 1990, 60, 133–138. [Google Scholar] [CrossRef]
  40. Fessl, I.; Wiesinger, H.-P.; Kröll, J. Power-Force-Velocity Profiling as a Function of Used Loads and Task Experience. Int. J. Sports Physiol. Perform 2022, 17, 694–700. [Google Scholar] [CrossRef]
  41. Samozino, P. A Simple Method for Measuring Lower Limb Force, Velocity and Power Capabilites During Jumping. In Biomechanics of Training and Testing; Morin, J., Samozino, P., Eds.; Springer Nature: Cham, Switzerland, 2018; pp. 65–96. [Google Scholar]
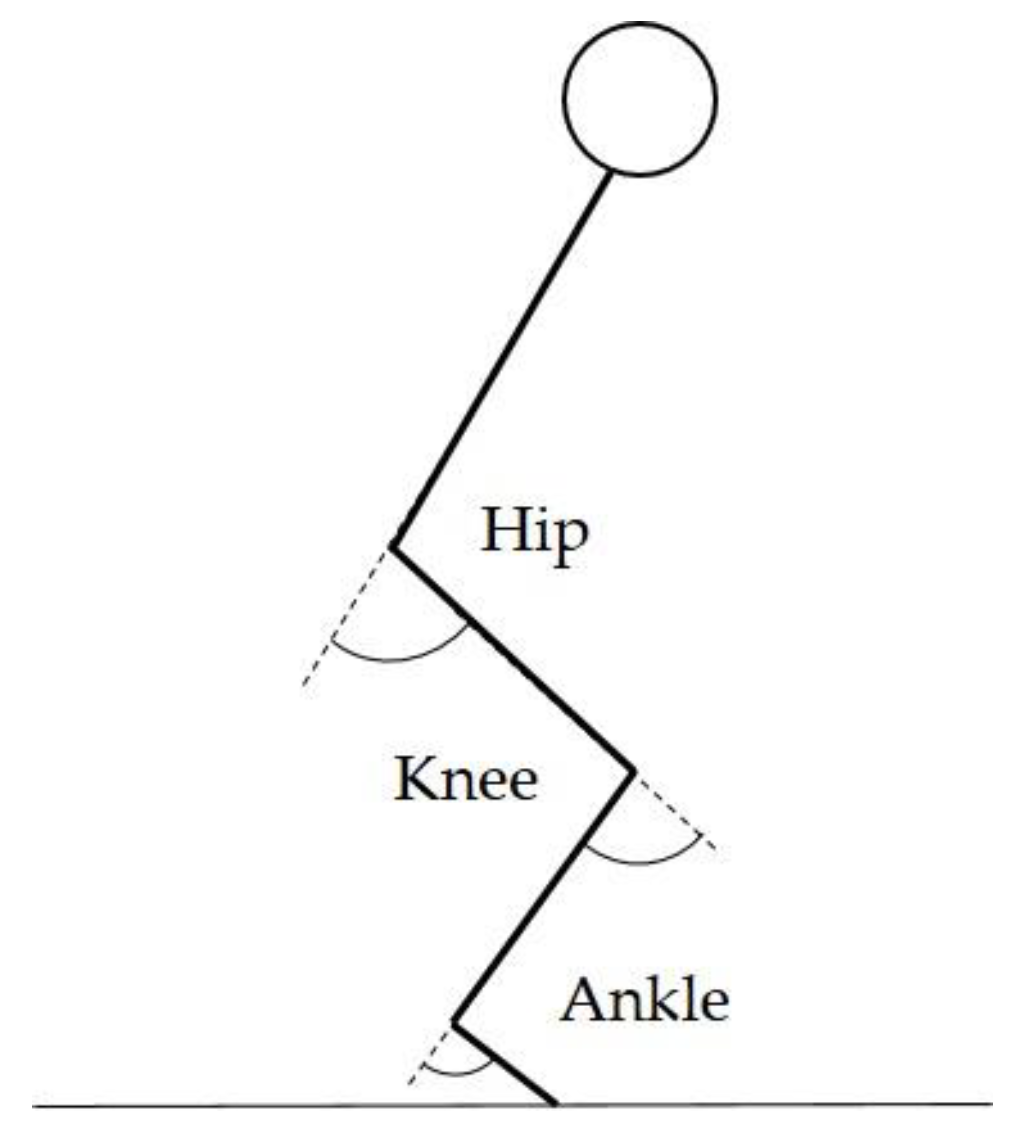
Figure 1. Schematic representation of the joint angle definitions.
Biomechanics 02 00025 g001
Figure 2. Jump height for females (white bars) on the left side and for males (gray bars) on the right side. Horizontal lines above the bars indicate significant differences between pairs (p < 0.05).
Biomechanics 02 00025 g002
Figure 3. Peak joint power for females (white bars) on the left side and for males (gray bars) on the right side. Horizontal lines above the bars indicate significant differences between pairs (p < 0.05).
Biomechanics 02 00025 g003
Figure 4. Total joint work for females (white bars) on the left side and for males (gray bars) on the right side. Horizontal lines above the bars indicate significant differences between pairs (p < 0.05).
Biomechanics 02 00025 g004
Figure 5. Relative joint contribution for females on the left side and for males on the right side.
Biomechanics 02 00025 g005
Table 1. Statistical analysis aims (i) and (ii)—main effects of load, sex, and their interaction.
LoadSexLoad * Sex
Parameterp (F)η2p (F)η2p (F)η2
Jump height (m)<0.001 * (631.0)0.965<0.001 * (28.5)0.553<0.001 * (20.6)0.472
Peak power ankle (W·kg−1)<0.001 * (27.0)0.5390.020 * (6.3)0.2150.527 (0.7)0.030
Peak power knee (W·kg−1)<0.001 * (11.7)0.3360.022 * (6.1)0.2080.616 (0.6)0.025
Peak power hip (W·kg−1)0.028 * (3.8)0.142<0.001 * (20.2)0.4670.846 (0.2)0.008
Total work ankle (J·kg−1)<0.001 * (153.0)0.8690.387 (0.8)0.0330.796 (0.3)0.014
Total work knee (J·kg−1)<0.001 * (33.1)0.5900.060 (3.9)0.1450.126 (2.0)0.081
Total work (J·kg−1)<0.001 * (43.5)0.654<0.001 * (45.3)0.6630.098 (2.0)0.081
* Significant difference.
Publisher’s Note: MDPI stays neutral with regard to jurisdictional claims in published maps and institutional affiliations.