Article

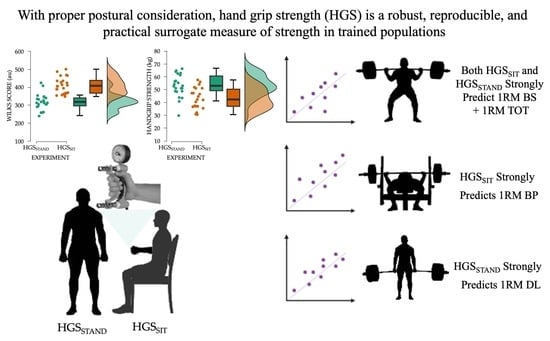
Locked and Loaded: Divergent Handgrip Tests as Surrogate Measures for One-Repetition Maximal Strength

by
S. Kyle Travis
1,2,3,*,
Antonella V. Schwarz
1,4 and
Benjamin I. Burke
5,6
1
School of Health Sciences, Department of Allied Health Professions, Liberty University, Lynchburg, VA 24515, USA
2
Science, Medicine, Innovation & Technology (SMIT) Laboratory, nøsisX, Elizabethton, TN 37643, USA
3
Department of Bioengineering & Medical Device Innovation, MediTerry, Tamaroa, IL 62888, USA
4
Department of Sport and Exercise Sciences, Barry University, Miami Shores, FL 33168, USA
5
Department of Physiology, College of Medicine, University of Kentucky, Lexington, KY 40506, USA
6
Center for Muscle Biology, College of Health Sciences, University of Kentucky, Lexington, KY 40506, USA
*
Author to whom correspondence should be addressed.
Biomechanics 2025, 5(1), 16; https://doi.org/10.3390/biomechanics5010016
Submission received: 3 February 2025 / Revised: 1 March 2025 / Accepted: 5 March 2025 / Published: 7 March 2025
(This article belongs to the Special Issue Biomechanics in Sport, Exercise and Performance)

Abstract

:
Background/Objectives: Despite widespread use in clinical and athletic settings, validity of handgrip strength (HGS) as a surrogate for maximal strength remains debated, particularly regarding how testing posture influences its predictive value. Moreover, while HGS is frequently considered a marker of ‘total strength’, this term is often vaguely defined, lacking a clear, performance-based framework. Therefore, this study investigates HGS as a potential surrogate measure for one-repetition maximum (1RM) performances in key compound lifts via back squat (BS), bench press (BP), deadlift (DL), and total (TOT), while accounting for variations in testing posture. Methods: Two distinct testing conditions were used to account for postural influences: Experiment 1 implemented high-output standing HGS (HGSSTAND) in 22 recreationally trained males [Wilks Score: 318.51 ± 44.61 au] vs. Experiment 2, which included low-output seated HGS (HGSSIT) in 22 competitive powerlifters [409.86 ± 46.76 au], with all testing immediately followed by 1RM assessment. Results: Correlational analyses identified the strongest association between HGSSTAND and 1RM DL (r = 0.693, BF10 = 106.42), whereas HGSSIT exhibited the strongest relationship with 1RM BP (r = 0.732, BF10 = 291.32). Postural effects had a significant impact on HGS outcomes (p < 0.001, η2 = 0.413), with HGSSTAND producing higher outputs than HGSSIT despite lower absolute strength 1RM capabilities. Conclusions: These findings emphasize the role of biomechanical specificity and neuromuscular engagement in grip strength assessments, indicating that HGS can function as a practical surrogate for maximal strength, though its predictive value depends on posture. Strength practitioners, sport scientists, and clinicians should consider these confounding factors when implementing HGS-based monitoring strategies.

Graphical Abstract

1. Introduction

Handgrip strength (HGS) is a universally efficient, cost-effective, reliable indicator of biological and physiological age, health status, mortality risk, muscular strength, and physical performance in clinical, recreational, and athletic settings [1,2,3]. Despite the subject matter and setting, HGS can provide an objective measurement output for tracking progress over time as a surrogate measure for a given variable of interest (e.g., muscle mass, maximal strength, VO2max, sprint time, vertical jump) [1]. HGS plays a crucial role in an array of sporting events requiring forceful hand and forearm contractions, as well as in activities that involve whole-body strength and coordination [1]. Notably, HGS correlates with performance in diverse sports categories, including stick, club, bat, racket, and ball sports (e.g., baseball, tennis, hockey) [4,5,6]; court sports (e.g., basketball, volleyball) [7,8,9]; field sports (e.g., soccer, rugby) [10,11]; water sports (e.g., swimming, rowing) [12,13]; climbing and gymnastics [14,15]; combat sports (e.g., wrestling, judo, mixed martial arts) [16,17,18]; and strength sports (e.g., weightlifting, powerlifting) [19,20,21]. Thus, the widespread relevance of HGS across athletic disciplines demonstrates its practicality as a general marker of physical performance capabilities.
While relationships between HGS and both upper- and lower-body strength are well documented, there can be considerable variation in how maximal strength is assessed (e.g., one-repetition-maximum [1RM], isometric peak force testing) [1,22,23]. Despite these discrepancies, athletes commonly develop and assess upper- and lower-body strength via bench press (BP) and back squat (BS), respectively, with both exercises traditionally used in athletics, recreation, and general population training programs and maximal strength evaluations [22]. Notably, variations in HGS and 1RM performance are observed not only between athletes and non-athletes [7,9,17] but also among athletes of different competitive levels, with higher-level athletes typically exhibiting superior strength outputs [24]. Despite these performance differences, HGS moderately to strongly correlates with both 1RM BS and BP performance [7,9,17,24], suggesting that it may serve as a reliable surrogate for maximal strength assessments across individuals with varying levels of strength and training experience.
Although HGS has been commonly examined in relation to both BS and BP, fewer studies have explored its association with deadlift (DL) performance, despite the DL’s reliance on grip strength and its classification as a total-body pulling movement [25]. Drid et al. [24] reported that elite judokas outperformed sub-elite competitors in 1RM DL, while differences in BS and BP performance were less pronounced, suggesting that DL strength may better differentiate competitive levels [26]. This trend is also evident in powerlifting, where DL often determines competition outcomes [27]. While HGS is frequently cited as correlating with ‘total strength’, this term is often vaguely defined [1]. In the context of powerlifting performance, the summation of the highest achieved BS, BP, DL in competition via a powerlifting total (TOT) provides a clear, competition-relevant measure of total strength. However, direct investigations of HGS vs. BS, BP, DL, and TOT performance in strength-based populations remain scarce [21,28,29]. Existing studies such as those by Schofstall et al. [28] and Suazo and DeBliso [29] examined these relationships in competitive powerlifters but lack methodological rigor, detailed HGS testing protocols, and comprehensive statistical analyses. Notably, these studies do not account for variations in HGS testing posture, which may significantly influence measurement outcomes and require further investigation.
Standing HGS assessments (HGSSTAND) consistently produce higher force outputs than seated HGS (HGSSIT) [1,30], raising concerns about the validity of how HGS measures are used for predicting maximal strength in strength-trained individuals. Balogun et al. [30] demonstrated that grip strength varies across common testing positions (i.e., seated with elbow flexed at 90°, seated with elbow extended at 180°, standing with elbow flexed at 90°, and standing with elbow extended at 180°), with standing and extended-arm positions yielding the highest values, while seated assessments with 90° elbow flexion produce the lowest. Given that a movement like the DL is performed in a standing position with extended arms, HGSSTAND may better reflect neuromuscular function and maximal strength for such movement. Similarly, because BP is performed in a supine position, with peak force application occurring around 90° of elbow flexion [31], HGSSIT may provide a more relevant measure of pressing strength. However, the extent to which these postural effects impact strength-trained populations’ movements, such as BS or TOT, remains unclear, as no studies have directly compared HGS testing positions in relation to 1RM maximal strength as it biomechanically relates to a given movement.
Additionally, individual strength levels may influence HGS performance across testing conditions [24]. Stronger athletes may generate high grip outputs regardless of posture, potentially mitigating biomechanical disadvantages associated with seated testing, whereas weaker individuals may rely more on advantageous conditions, such as standing, to produce inflated HGS outputs relative to actual absolute 1RM capabilities. These factors highlight the need to determine whether testing posture affects the predictive value of HGS for maximal strength assessments and whether stronger individuals exhibit greater resilience to positional influences.
Therefore, to address these gaps, this study investigates the following: (1) whether HGSSTAND demonstrates stronger relationships with BS and DL due to shared postural mechanics, (2) whether HGSSIT demonstrates stronger relationships with BP due to biomechanical similarities at the 90° elbow flexion sticking point, (3) whether total TOT, as defined by the summation of 1RM BS, BP, and DL, varies as a function of strength level and testing posture, and (4) whether stronger individuals overcome a biomechanical disadvantage (seated with 90° elbow flexion) to produce similar HGS outputs as weaker individuals tested in an advantageous position (standing with arm in extension). Thus, we hypothesized that postural mechanics would influence the relationship between HGS and maximal strength, with HGSSTAND demonstrating stronger correlations with lower-body lifts (BS, DL) and HGSSIT demonstrating stronger correlations with upper-body pressing strength (BP). Additionally, we anticipated that HGS outputs would be higher in the standing position due to its biomechanical advantages. However, we expected that stronger individuals would compensate for the biomechanical disadvantage of the seated position, generating HGS outputs comparable to those of weaker individuals tested in the more advantageous standing position. By evaluating these relationships, this study provides a novel insight into the role of HGS as a surrogate strength assessment tool within strength-trained populations and highlights potential implications for its application in performance monitoring.

2. Materials and Methods

This study analyzed data from an investigative analysis to evaluate the utility of HGS from different testing positions as a surrogate measure of overall maximal strength in cohorts with divergent training backgrounds. Research has established differences in HGS outputs between seated and standing positions with extended versus 90° flexed elbows [1,30]. Therefore, Experiment 1 included recreationally strength-trained males who completed standing HGSSTAND testing, which typically yields higher HGS outputs than seated positions [30,32,33] despite lower 1RM strength levels. Conversely, Experiment 2 included strength athletes competing in powerlifting who performed HGSSIT testing, which typically produces lower HGS outputs than standing positions [30,34] despite higher 1RM strength levels.
This study intentionally selected these contrasting strength profiles to examine how HGS performance varies based on postural differences and whether training backgrounds produce similar results despite the biomechanical advantages or disadvantages of standing versus seated positions. In Experiment 2, the strength athletes exhibited a bimodal distribution (Figure 1), with clusters at both the lighter (≤93 kg) and heavier (>93 kg) weight classes. This trend aligns with competitive powerlifting demographics [27,35,36], where younger or less experienced athletes often compete in lighter weight classes, and seasoned lifters with greater muscle mass and training experience dominate heavier classes. Despite this bimodal trend, statistical testing confirmed normality assumptions, ensuring the analyses’ robustness. By incorporating these distinctions and analyzing HGS and 1RM data across these two cohorts, this study establishes evidence for HGS as a practical, non-invasive monitoring tool for surrogate maximal strength assessments.

2.1. Study Participants

A total of 44 males (Age: 22.05 ± 2.70 years; Height: 175.41 ± 4.93 cm; Body mass: 89.45 ± 19.04 kg; Wilks score: 364.19 ± 64.61 au) participated in testing, including recreationally trained subjects (n = 22; 21.55 ± 1.84 years; 175.54 ± 5.40 cm; 84.55 ± 16.56 kg; 318.51 ± 44.61 au) and competitive strength athletes (n = 22; 22.55 ± 3.32 years; 175.29 ± 4.53 cm; 94.35 ± 20.43 kg; 409.86 ± 46.76 au) (Figure 2). Inclusion criteria encompassed: (a) Recreationally trained subjects were required to have at least one year of strength-training experience involving BS, BP, and DL, train at least 3 days per week, and have no history of participation in competitive strength sports; (b) Competitive strength athletes were required to have at least 2 years of dedicated powerlifting training, with BS, BP, and DL as their primary movements, train at least 3 days per week, and have competed in at least one raw sanctioned powerlifting meet (i.e., only a belt, knee sleeves, and wrist wraps permitted in competition) in the last 12 months. Exclusion criteria included: (a) Subjects with current musculoskeletal injuries, history of major orthopedic surgery in the past year, or ongoing rehabilitation that prevented safe completion of 1RM testing were excluded; (b) Individuals using performance-enhancing drugs or banned substances in violation of the United States Powerlifting (USAPL) Drug-Free Standards [37] were excluded; and (c) Competitive strength athletes who only trained and used the sumo DL stance (i.e., wide footing, hands placed inside knees) in competition as well as (d) equipped powerlifters (i.e., assistive lifting gear such as squat suit, bench shirt, deadlift suit permitted in competition) were excluded from the study. To ensure movement standardization, only the conventional DL stance was permitted (i.e., feet positioned approximately shoulder-width apart with hands placed just outside the knees (Figure 2, Panel C4)). Both cohorts demonstrated competency in each lift based on evaluation by National Strength and Conditioning Association Certified Strength and Conditioning Specialists® (CSCS®) and United Kingdom Strength and Conditioning Association Accredited Strength and Conditioning Coaches (ASCC). All subjects completed a health history questionnaire and informed consent document before all testing. The Liberty University Institutional Review Board reviewed and approved this protocol, which complied with the Helsinki Declaration.

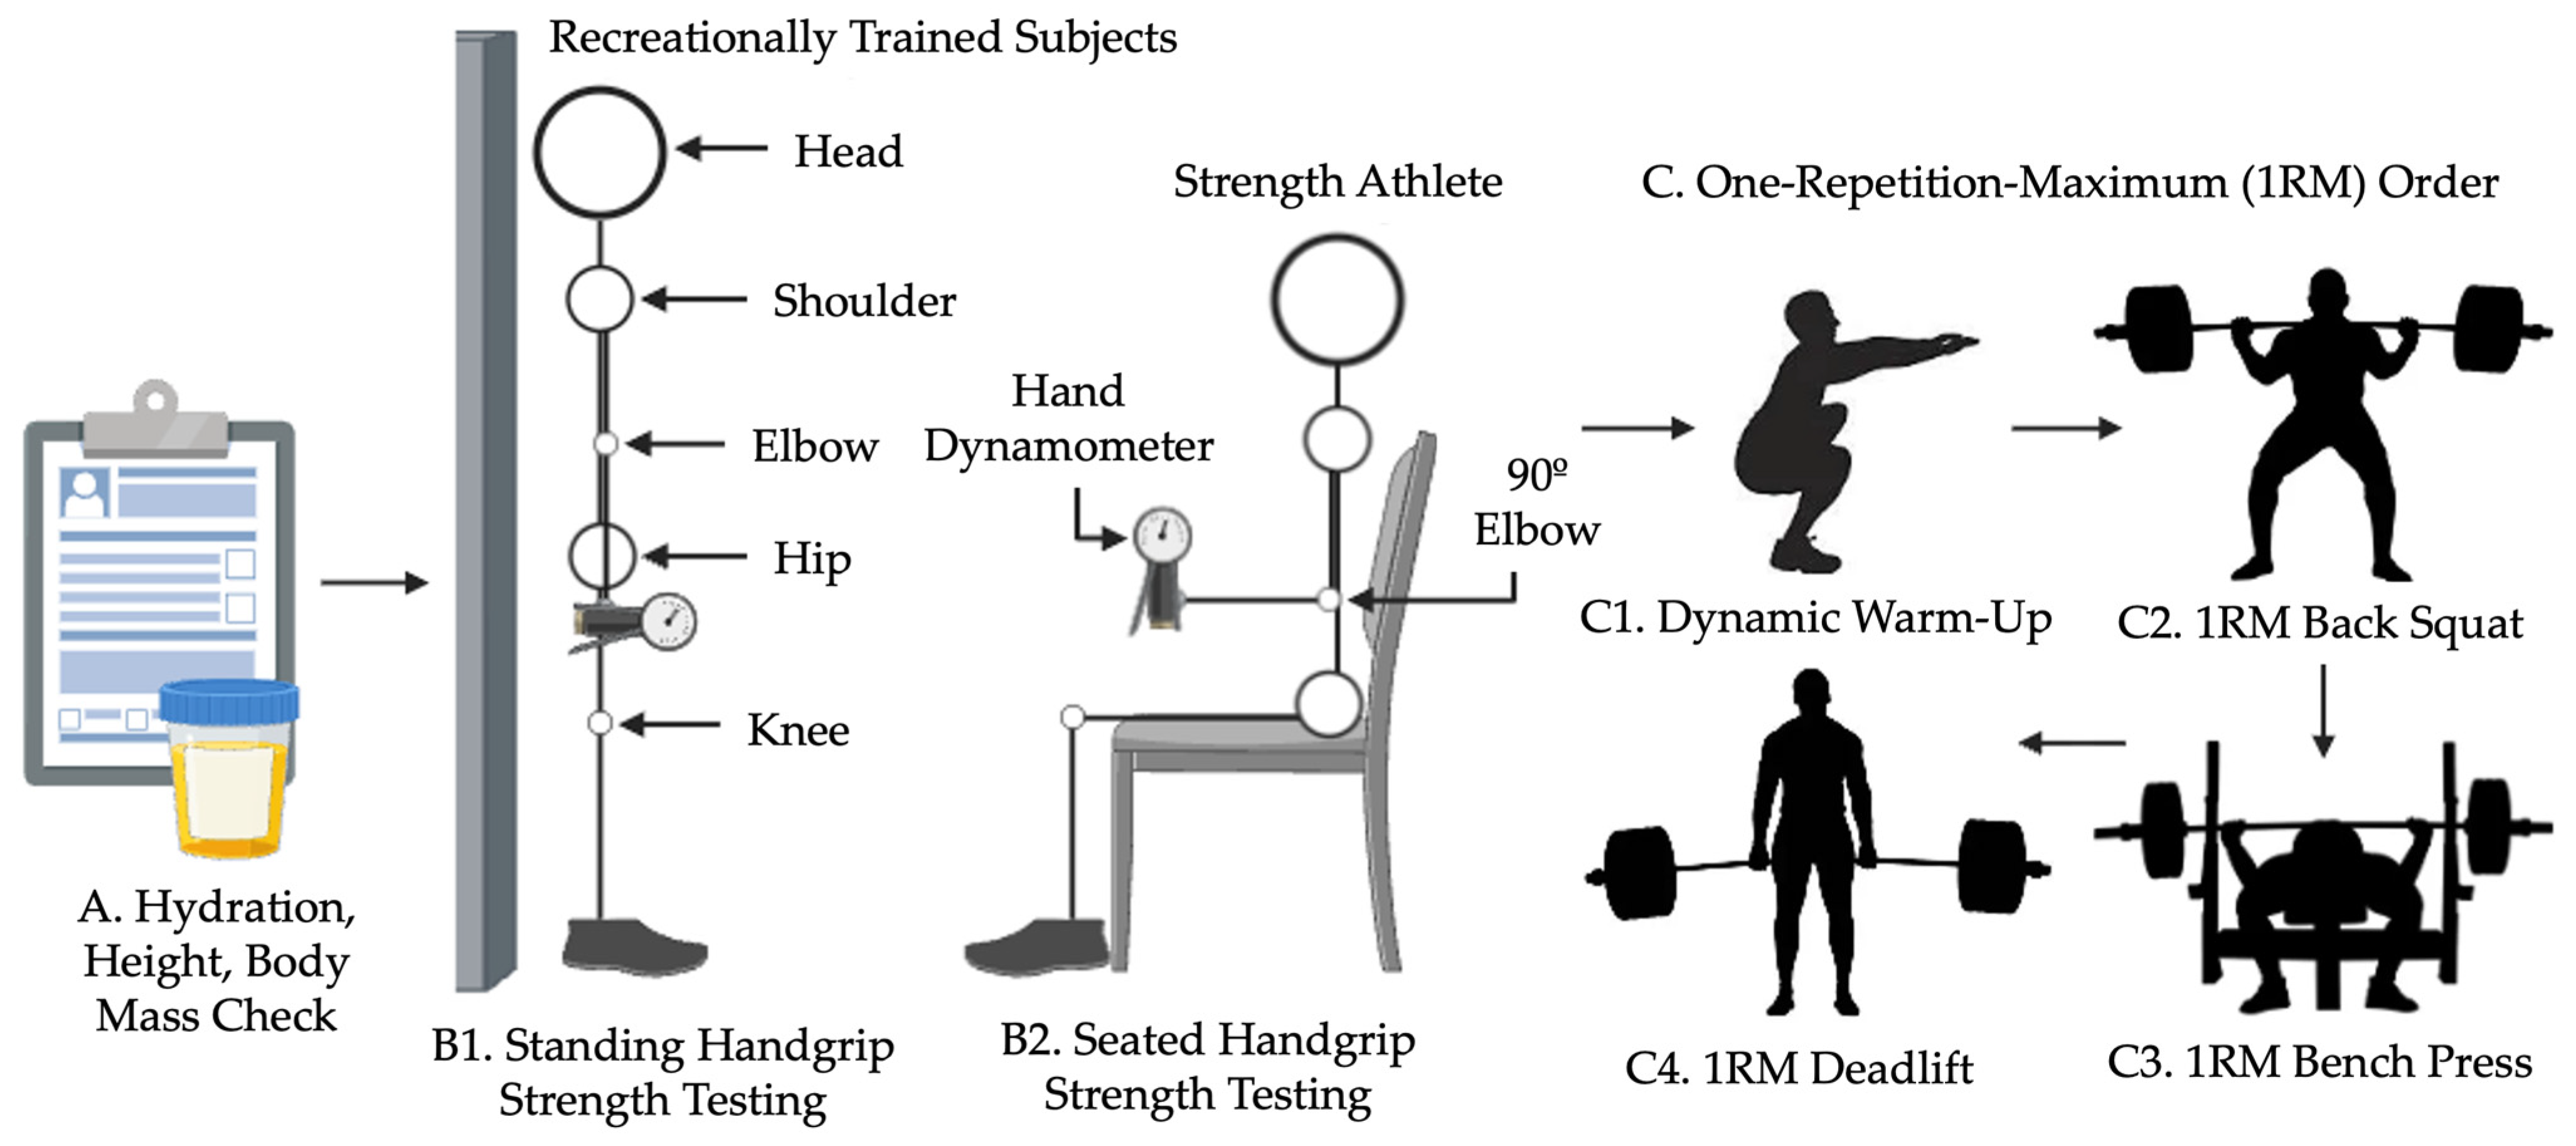
2.2. Testing Procedures

2.2.1. Hydration and Anthropometric Assessments

Hydration status was assessed at the start of each laboratory session using a refractometer (ATAGO, Tokyo, Japan) following an established hydration protocol [23,38,39,40]. If urine-specific gravity was ≥1.020, subjects consumed water for at least 20 min before reassessment. Testing did not proceed until urine-specific gravity reached <1.020. After passing hydration (Figure 2, Panel A), body mass was recorded to the nearest 0.01 kg using a digital scale (Tanita, Tokyo, Japan), and height was measured to the nearest 0.01 m using a stadiometer (Cardinal Scale Manufacturing, Co., Webb City, MO, USA).

2.2.2. Standing Handgrip Strength Testing: Experiment 1—Recreationally Trained Subjects

Using a Jamar® hydraulic hand-held dynamometer (Sammons Preston, Inc., Bolingbrook, IL, USA), HGSSTAND was assessed with the recreationally trained cohort (Figure 2, Panel B1) [30,32,33,41,42]. The dynamometer was adjusted to fit each subject’s dominant hand size according to the manufacturer’s instructions [43]. Subjects stood upright with both feet flat on the ground, holding the device at their side while maintaining a 180° extended elbow position, confirmed using a handheld goniometer. The shoulder and wrist remained in a neutral position. Warm-up trials were performed at 50% and 75% effort with 30 s of rest between each. Following warm-ups, subjects completed at least three maximal effort attempts. Standardized verbal cues were provided: “3, 2, 1, SQUEEZE!” to initiate the contraction, and “STOP!” after 5–10 s to terminate the attempt. A 60 s rest period was given between trials. The two highest measurements within 5 kg were averaged and used for analysis. Reliability testing confirmed the Jamar® device produced interclass correlations (ICCs) ranging from 0.96 to 0.99 in the standing position with an extended elbow, aligning with prior literature [1].

2.2.3. Seated Handgrip Strength Testing: Experiment 2—Strength Athletes

Using the same Jamar® hydraulic hand-held dynamometer (Sammons Preston, Inc., Bolingbrook, IL, USA), HGSSIT was assessed with the strength athlete cohort (Figure 2, Panel B2) [30,34,41,42]. The dynamometer was adjusted to fit each athlete’s dominant hand according to the manufacturer’s instructions [43]. Athletes sat upright in a chair with both feet flat on the ground, holding the device at their side with an adducted shoulder while maintaining a 90° flexed elbow position, confirmed using a handheld goniometer. Warm-up trials were performed at 50% and 75% effort, followed by at least three maximal effort attempts. Standardized verbal cues were provided: “3, 2, 1, SQUEEZE!” to initiate the contraction, and “STOP!” after 5–10 s to terminate the attempt. Sixty seconds of rest was given between trials. The two highest measurements within 5 kg were averaged for analysis. Reliability testing confirmed the Jamar® device produced ICCs of 0.97–0.99 in the seated position with a 90° elbow, aligning with prior literature [1].

2.2.4. One-Repetition Maximum Strength

The 1RM testing protocol has been detailed previously [23,38,39]. In brief, after completing HGS testing, subjects performed a dynamic warm-up (Figure 2, Panel C1), which included bodyweight movements targeting major muscle groups. Movements such as jumping jacks, shoulder circles, leg swings, trunk twists, lunges, push-ups, and body weight squats targeting major muscle groups, performed for 1–2 sets of 10–20 reps each. All subjects completed 1RM testing according to USAPL standards as outlined in the technical rules handbook [37]. For 1RM DL, both cohorts exclusively performed conventional stances to ensure movement standardization. Load increments were determined using rating of perceived exertion (RPE) criteria (a) if an RPE of 10 was recorded and further increases were deemed unsuccessful by the investigator, or (b) if an RPE of 9 or 9.5 was recorded and the subsequent attempt with a 2.5 kg load increase resulted in failure. Following 1RM assessments, Wilks scores were computed to determine relative strength across all subjects. The Wilks score normalizes strength performance relative to body mass, allowing for equitable comparisons between individuals of different sizes and training backgrounds [44]. Additionally, Wilks scores serve as a useful indicator of cohort quality, with scores ≥400 typically representing national- to world-level competitors, while scores <400 are more common among local or regional lifters [27,35,36]. This metric provided an additional means of evaluating strength and group homogeneity independent of the absolute load lifted.

2.3. Statistics

All statistical analyses were conducted in JASP (JASP (Version 0.19.3)). Descriptive statistics, including mean and standard deviation (AVG ± SD), summarized subject characteristics and testing outcomes. Data were screened for outliers, and the Shapiro–Wilk test confirmed normality with no violations. Statistical significance was set at p < 0.05 for all analyses.
Pearson’s correlation coefficients (r) with 95% confidence intervals (CI1) assessed relationships between HGS positions and 1RM performances (BS, BP, DL, TOT). Classic correlation magnitudes followed Hopkins’ classification scale [45]: Small (0.1–0.3), Moderate (0.3–0.5), Strong (0.5–0.7), Very Strong (0.7–0.9), and Nearly Perfect (>0.9). Bayesian correlations supplemented these analyses, reporting Bayes factors (BF10) with 95% credible intervals (CI2). Magnitude classifications followed Jeffrey’s BF10 classification scale [46]: BF < 1 (Evidence supports H0), BF = 1 (No evidence for H1 (alternative) or H0), BF 1–3 (Anecdotal evidence for H1), BF 3–10 (Moderate evidence for H1), BF 10–30 (Strong evidence for H1), BF 30–100 (Very strong evidence for H1), and BF > 100 (Extreme evidence for H1).
A one-way ANCOVA assessed the effect of posture (HGSSTAND vs. HGSSIT) on HGS while adjusting for absolute strength (1RM BS, BP, DL, TOT) as covariates. The model met assumptions for homogeneity of regression slopes and homoscedasticity. Welch’s t-tests examined whether significant differences existed in HGS outputs between Experiment 1 and Experiment 2, considering differences in 1RM strength profiles and testing posture.

3. Results

3.1. Experiment 1: HGSSTAND—Recreationally Trained Subjects

3.1.1. Classical Correlations—HGSSTAND vs. Maximal Strength

Pearson correlation analyses identified the strongest relationship between HGSSTAND and 1RM DL (r = 0.693), followed by 1RM TOT (r = 0.672), 1RM BS (r = 0.649), and 1RM BP (r = 0.557) (Figure 3).

3.1.2. Bayesian Correlations—HGSSTAND vs. Maximal Strength

Bayesian analyses further supported these results, with 1RM DL showing the strongest evidence of an association with HGSSTAND (BF10 = 106.42), followed by 1RM TOT (BF10 = 63.97), 1RM BS (BF10 = 39.32), and 1RM BP (BF10 = 7.95) (Table 1).

3.2. Experiment 2: HGSSIT—Competitive Strength Athletes

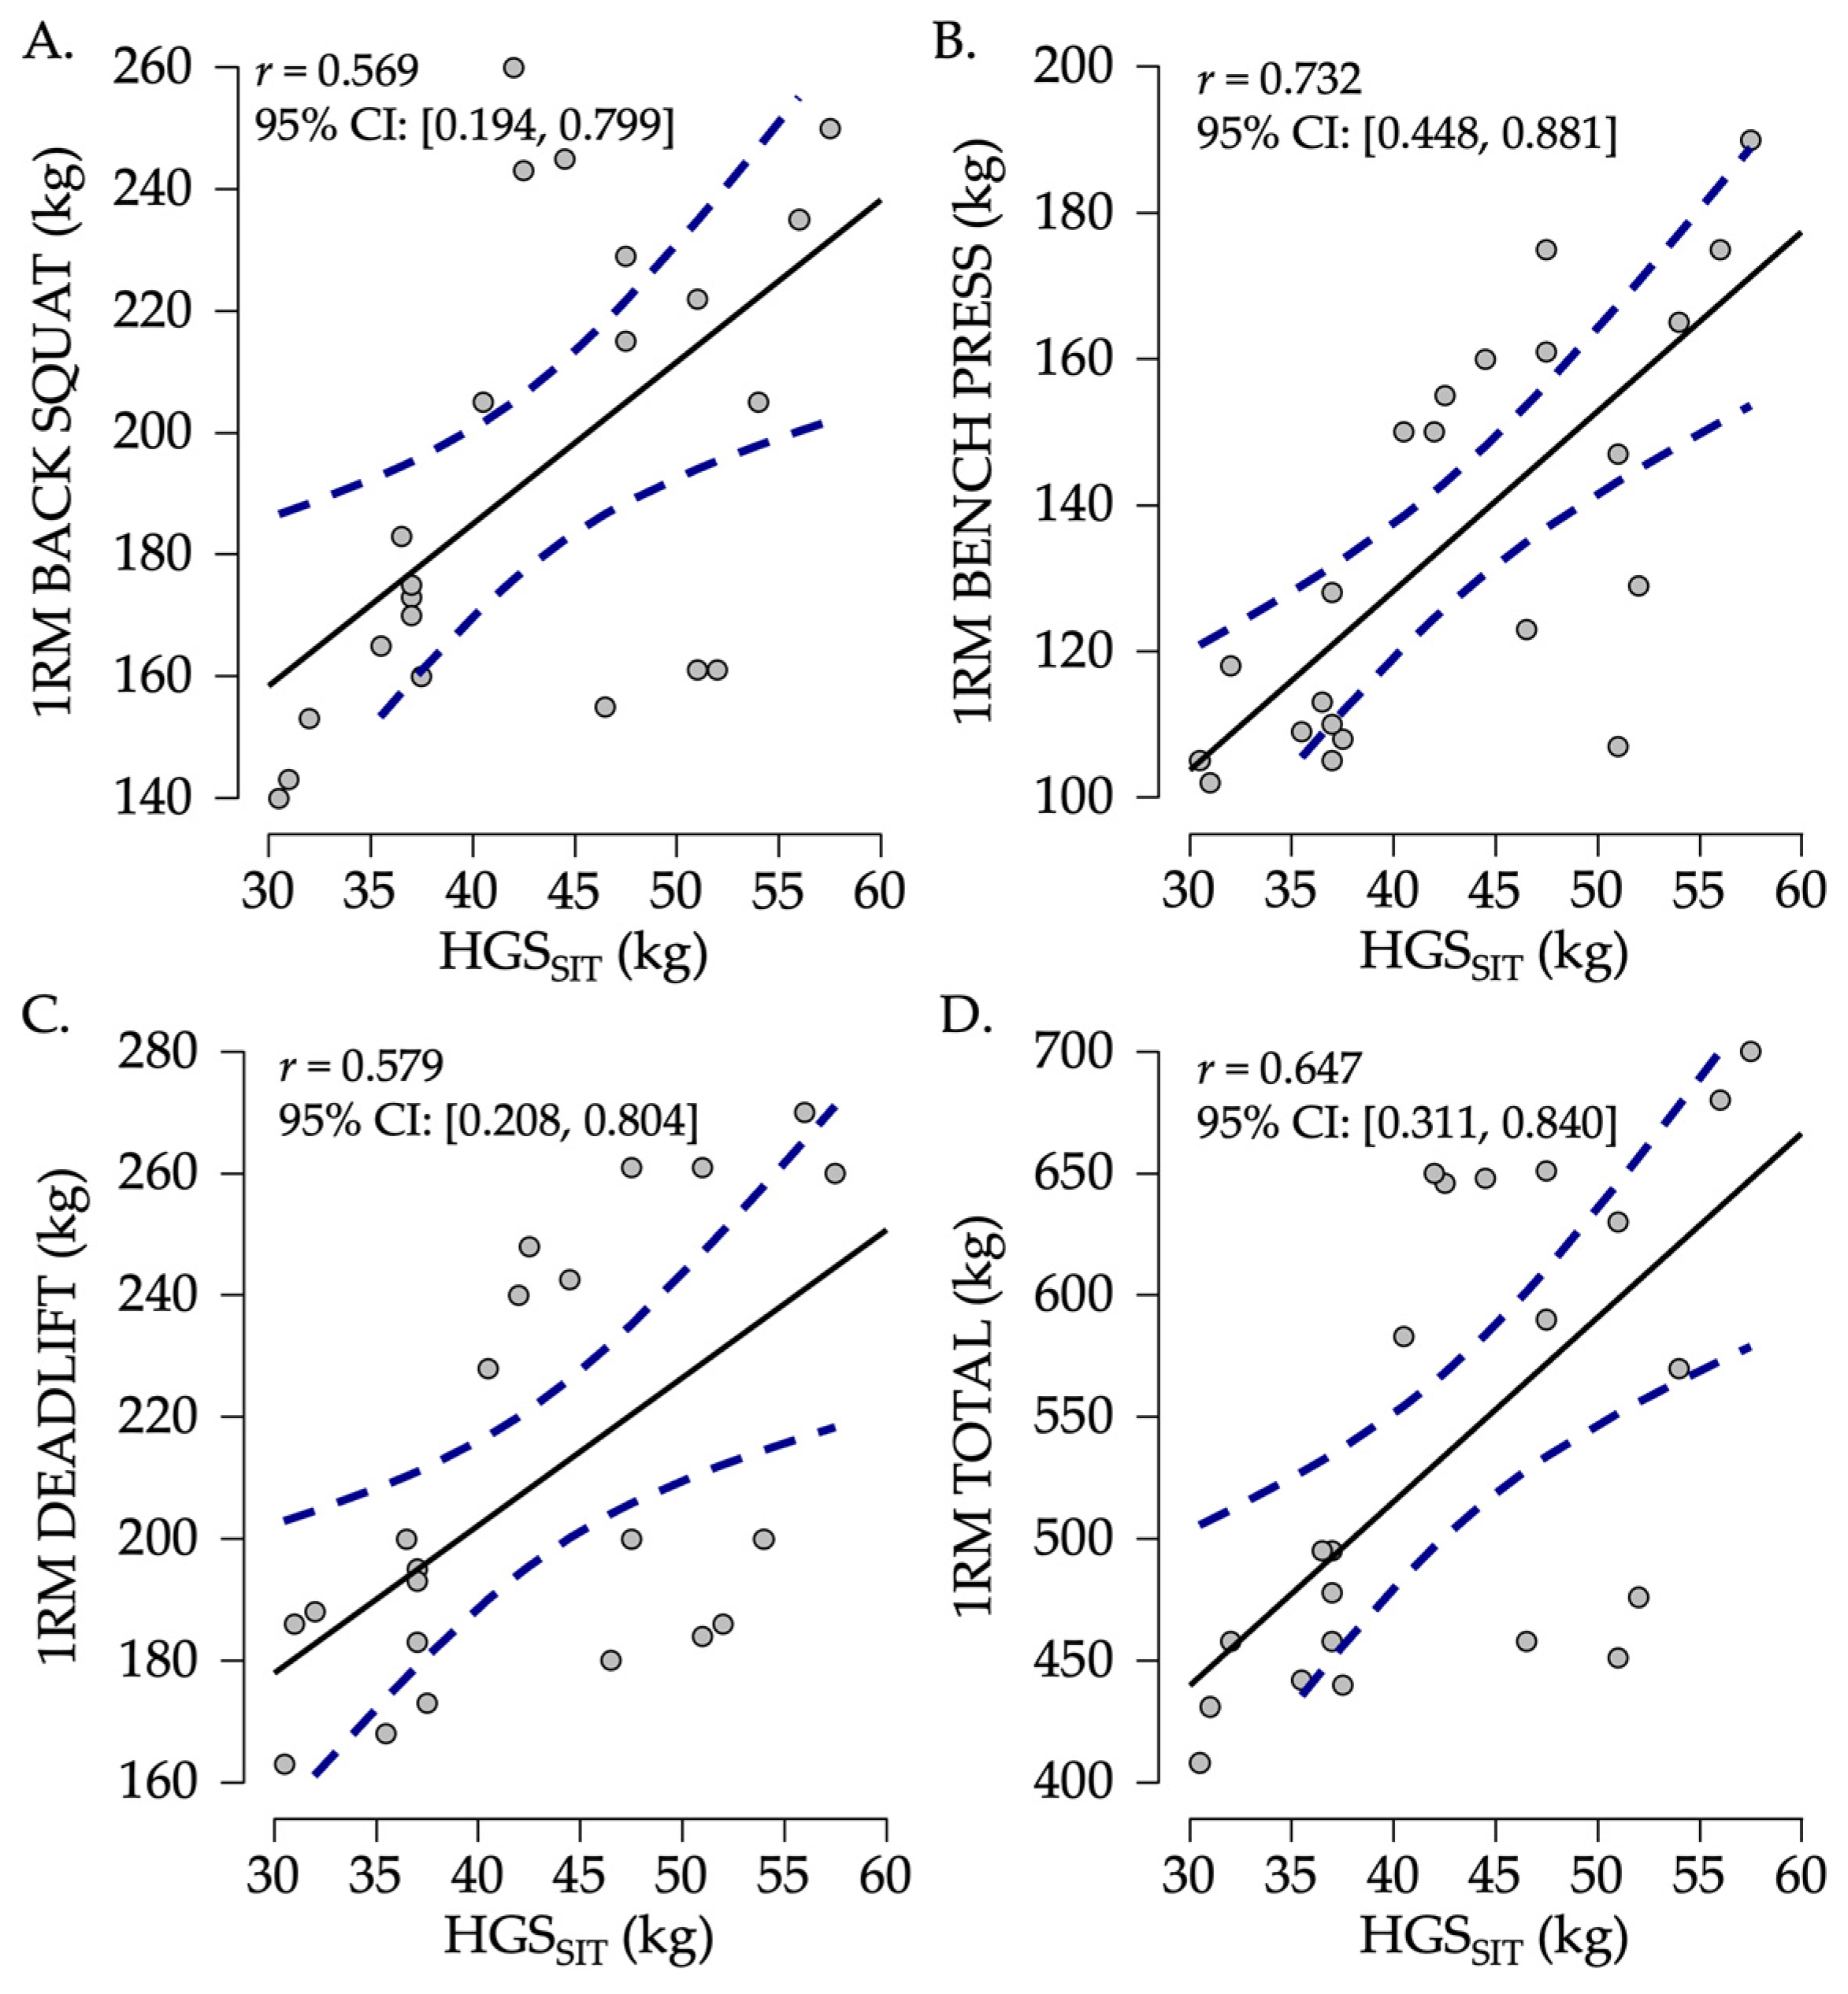
3.2.1. Classical Correlations—HGSSIT vs. Maximal Strength

Pearson correlation analyses identified the strongest relationship between HGSSIT and 1RM BP (r = 0.732), followed by 1RM TOT (r = 0.647), 1RM DL (r = 0.579), and 1RM BS (r = 0.569) (Figure 4).

3.2.2. Bayesian Correlations—HGSSIT vs. Maximal Strength

Bayesian analyses supported these findings, with the strongest evidence for an association between HGSSIT and 1RM BP (BF10 = 291.32), followed by 1RM TOT (BF10 = 38.15), 1RM DL (BF10 = 11.10), and 1RM BS (BF10 = 9.49) (Table 2).

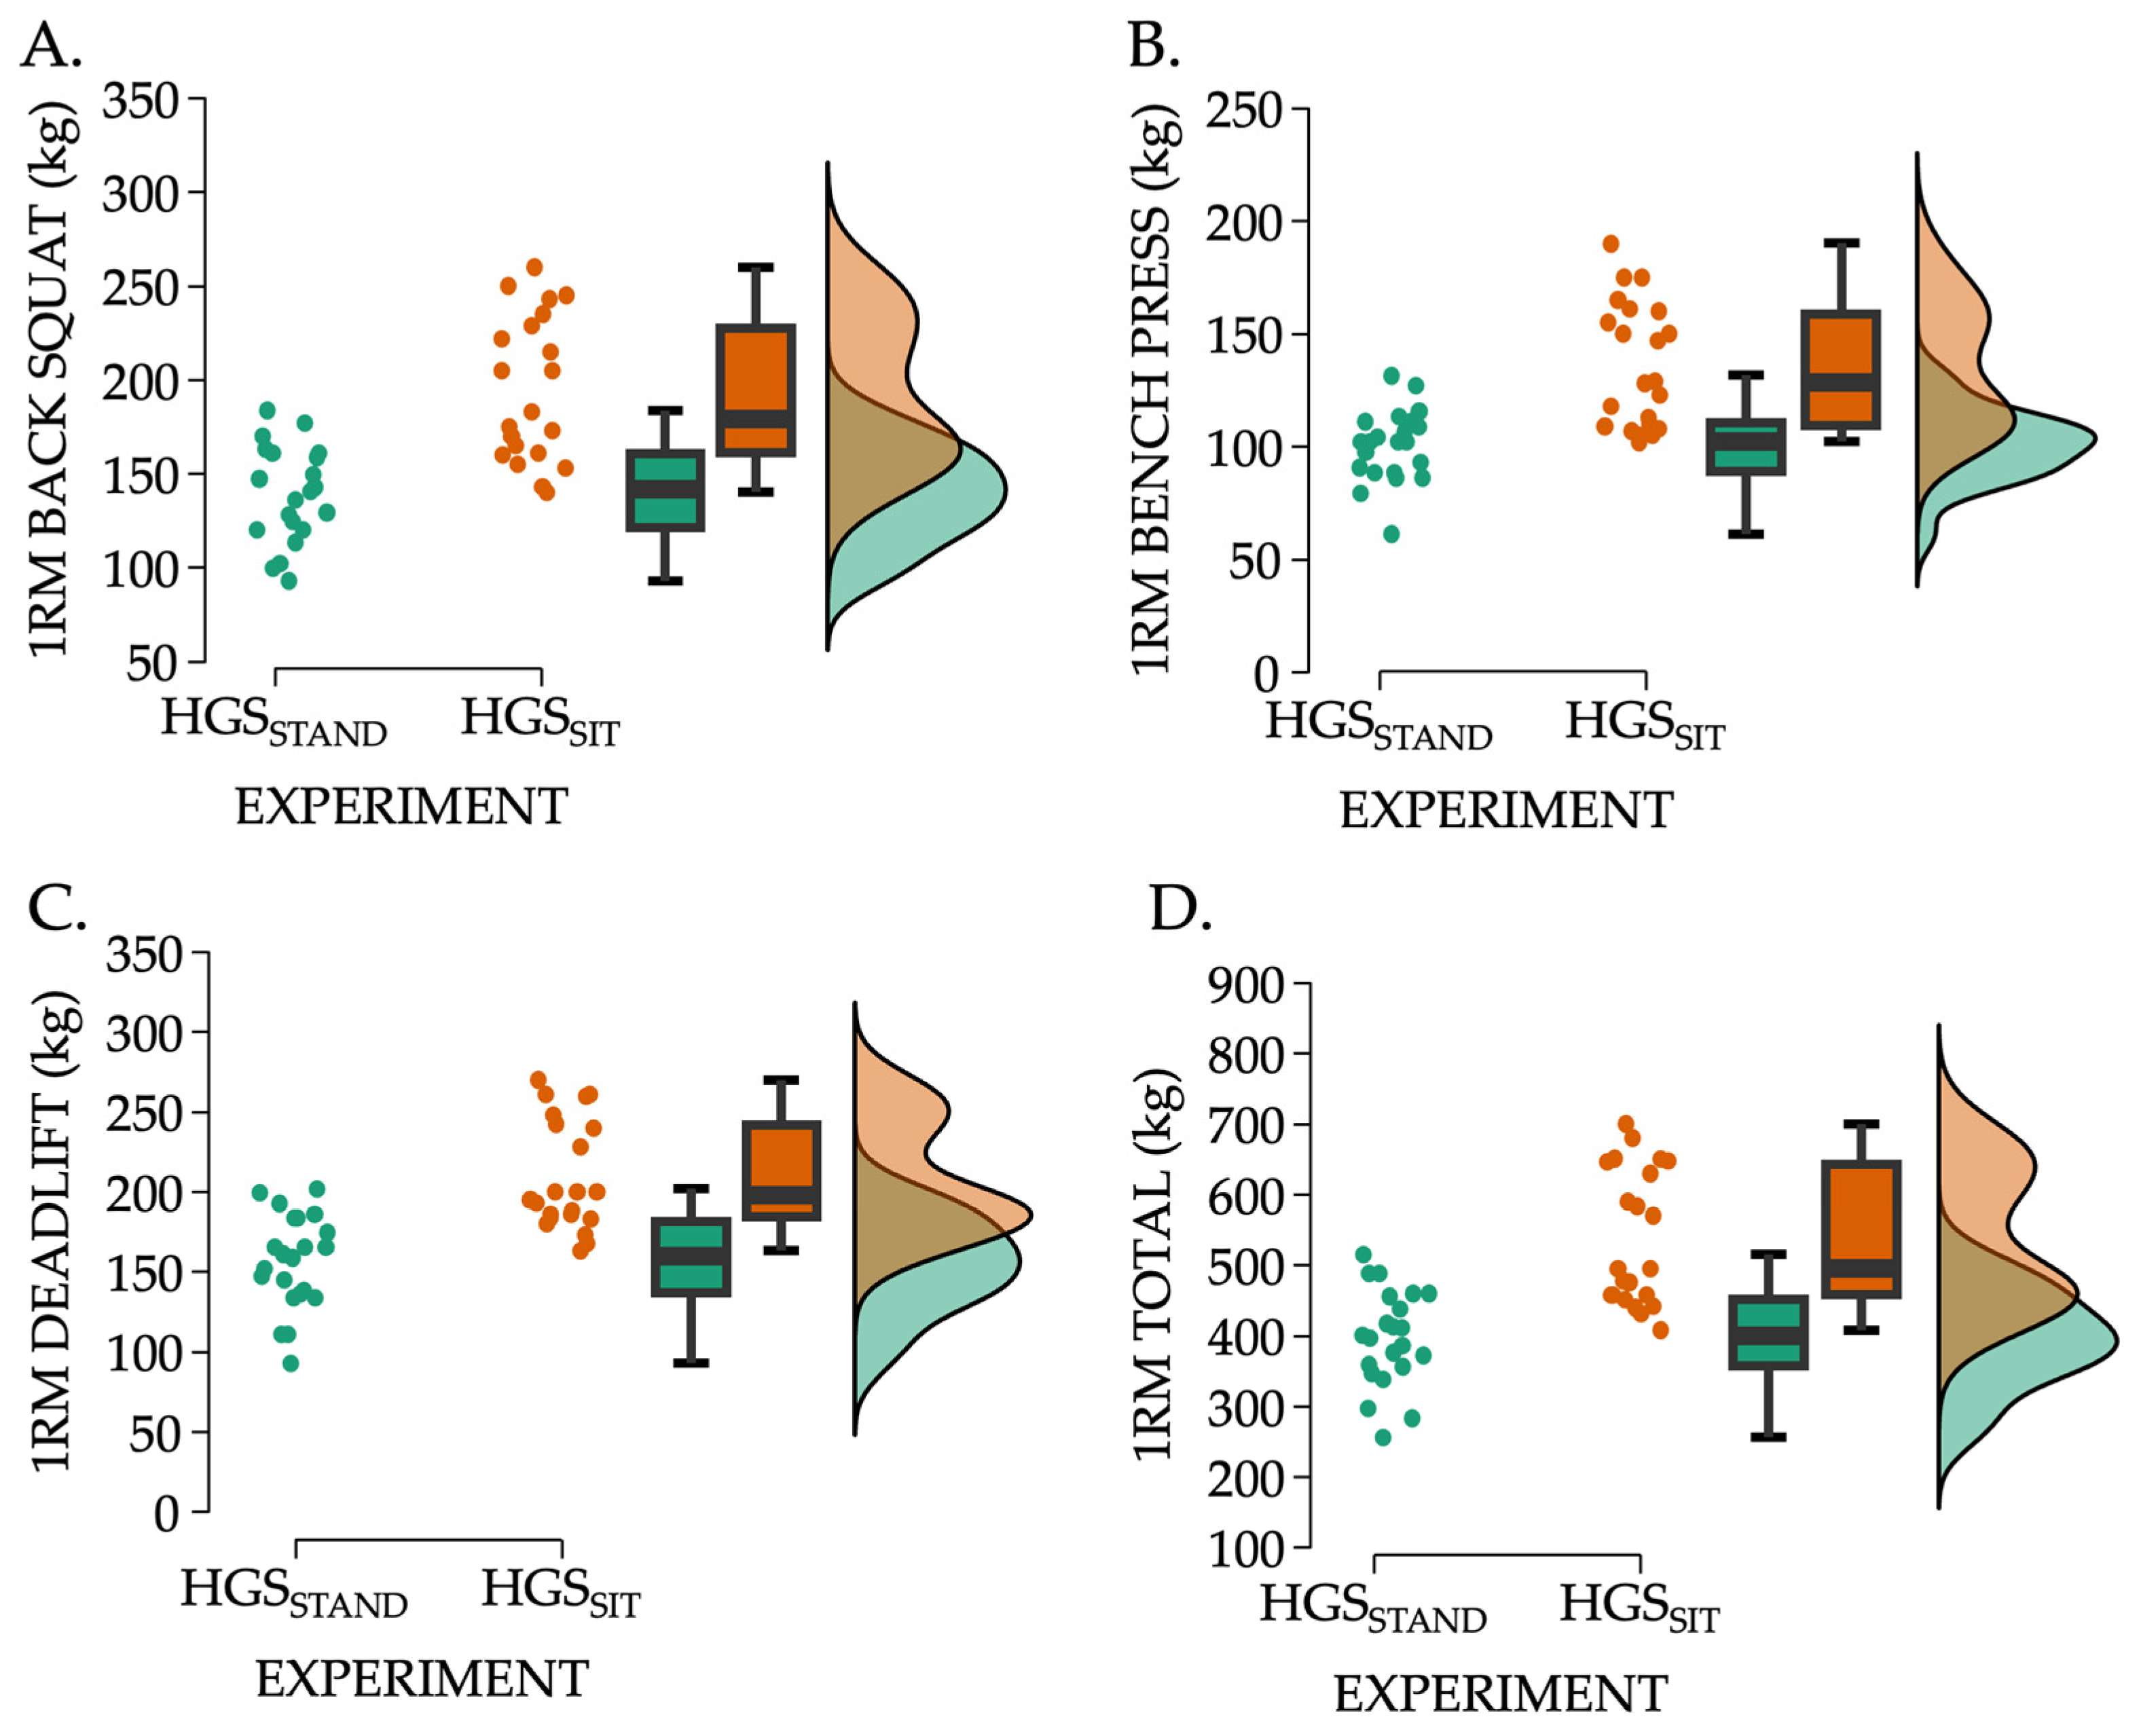
3.3. Positional Handgrip Strength Comparisons and Maximal Strength Influence

Independent sample t-tests identified significant differences between groups across all measured variables. The HGSSIT cohort exhibited significantly greater performances in 1RM BS (t (36.19) = 5.471, p < 0.001, g = 1.620, 95%  CI1 [0.914, 2.310]), 1RM BP (t (33.40) = 5.184, p < 0.001, g = 1.535, 95%  CI1 [0.831, 2.222]), 1RM DL (t (41.00) = 5.478, p < 0.001, g = 1.622, 95%  CI1 [0.928, 2.302]), and 1RM TOT (t (37.82) = 5.645, p < 0.001, g = 1.671, 95%  CI1 [0.963, 2.363]), with large effect sizes. However, HGSSTAND was significantly higher than HGSSIT (t (41.78) = −3.915, p < 0.001, g = −1.159, 95% CI1 [−1.794, −0.513]) despite the lower strength performance observed in the HGSSTAND cohort, highlighting a robust postural effect.
A significant main effect of posture emerged (F(1, 38) = 44.053, p < 0.001, η2 = 0.537), with HGSSTAND yielding higher values compared to HGSSIT. Adjusting for 1RM BS, BP, DL, and TOT as covariates did not significantly alter this outcome, as none of the covariates meaningfully contribute to the model (all p > 0.9). This highlights the robustness of the postural effect on HGS, independent of absolute strength levels.

4. Discussion

This study examined the validity of HGS as a surrogate measure of maximal strength, focusing on how testing posture (HGSSTAND vs. HGSSIT) influences these relationships across individuals with different training backgrounds. Based on biomechanical principles, we hypothesized that HGSSTAND would correlate more strongly with lower-body lifts (BS, DL), while HGSSIT would demonstrate stronger associations with upper-body pressing strength (BP). Additionally, we expected that stronger individuals would compensate for the biomechanical disadvantage of the seated position, producing HGS outputs comparable to those of weaker individuals tested in the more advantageous standing position. The results partially support these hypotheses, confirming the expected postural effects, with HGSSTAND most strongly correlating with 1RM DL and HGSSIT showing the strongest association with 1RM BP. However, contrary to expectations, stronger individuals did not overcome the seated disadvantage, instead exhibiting lower HGS outputs in this position. These findings emphasize the role of the testing posture in interpreting HGS values, demonstrating that while HGS serves as a practical strength assessment tool, its utility is posture-dependent and influenced by an individual’s strength background. The following sections discuss these findings in relation to grip-lift specificity (HGSSTAND and DL, HGSSIT and BP), postural effects on HGS performance, and how training status influences grip strength relationships with maximal strength outcomes.

4.1. Standing Handgrip Strength and Deadlift Performance

The strong correlation between HGSSTAND and 1RM DL highlights the DL’s role as a comprehensive total-body pulling movement. Unlike the BS or BP, the DL directly relies on grip strength to secure the barbell throughout the lift, likely explaining its stronger association with HGSSTAND. The biomechanical similarity between holding a dynamometer while standing and maintaining a static grip during DL lockout further reinforces this relationship. Prior research by Choe et al. [47], demonstrated the DL’s greater reliance on hip extensor and posterior chain activation compared to the BS, emphasizing its engagement of key musculature for force transmission in standing tasks. Additionally, Cholewa et al. [48] identified anthropometric factors such as limb and trunk length ratios as determinants of DL performance, which may also contribute to variability in HGSSTAND outputs.
Beyond grip strength, the DL recruits the entire kinetic chain, providing a functional measure of force generation. Martín-Fuentes et al. [49] emphasized the coordinated contributions of both upper and lower extremities during DL execution, further supporting its strong relationship with grip assessments. Although all classical correlations between HGSSTAND and 1RM measures were large, Bayesian analyses revealed extreme evidence supporting DL as the strongest predictor, whereas the association with BP was only moderate. This disparity likely reflects grip-specific biomechanical demands where the DL requires a sustained, active grip in an extended position, directly aligning with HGSSTAND, whereas BP performed with a pronated grip lacks this specificity.
These findings align with broader evidence linking HGS to total-body strength and health outcomes, such as reduced mortality and improved mobility in older adults [3,50]. The relationship between HGS and health likely stems from its reflection of overall physical resilience, captured by multi-joint, full-body movements like the DL (e.g., can a patient lift and hold a load for time?). Given that recreationally trained individuals align with the general active population, the observed relationship between HGSSTAND and DL performance is consistent with these patterns.
The observed relationships support standing HGS assessments as an accessible and reliable proxy for DL performance in recreationally trained populations, particularly when frequent 1RM DL testing is impractical. However, when grip strength is assessed in a seated position at a 90° elbow angle, its relationship with maximal strength shifts, demonstrating a stronger association with 1RM BP, further reinforcing the role of postural mechanics in HGS outputs.

4.2. Seated Handgrip Strength and Bench Press Performance

The strong correlation between HGSSIT and 1RM BP highlights the specific relationship between upper-body pressing strength and grip performance in a seated position. Unlike HGSSTAND, which integrates lower-body engagement, HGSSIT isolates the upper extremities, making it particularly relevant to 1RM BP, a movement primarily driven by the pectoralis major, anterior deltoid, and triceps brachii [51]. Stastny et al. [51] demonstrated that pectoralis major and triceps brachii dominate the electromyographic activity during the BP, particularly during the concentric phase, where force application peaks.
The very large and extreme correlation classifications likely stem from a biomechanical overlap between HGSSIT and BP, particularly at the sticking point, a critical phase where mechanical leverage diminishes and muscular demand peaks. Kompf and Arandjelović [31] acknowledged the sticking point as a performance bottleneck, commonly occurring near 90° elbow flexion, mirroring the dynamometer’s grip position during seated testing, reinforcing the shared reliance on maximal voluntary contraction during this phase.
Additionally, the HGSSIT position minimizes contributions from stabilizing muscles and lower-body engagement, further amplifying its specificity to upper-body strength. This aligns with Tromaras et al. [21], who reported that powerlifters’ grip strength and BP performance were interlinked due to static grip demands during heavy pressing movements. Furthermore, Nikolaidis et al. [52] emphasized grip strength’s role in upper-body-dominant activities, particularly in military and athletic populations, validating its predictive value for pressing strength.
These findings suggest that HGSSIT may serve as a practical alternative for tracking upper-body strength fluctuations over time, allowing practitioners to monitor pressing strength adaptations without the need for frequent maximal BP testing. However, despite postural nuances and lift specificity, HGS remains a reliable indicator of overall strength, demonstrating strong associations across all major lifts regardless of condition.

4.3. Postural Effects on Handgrip Strength (Between-Condition Comparisons)

Researchers have widely examined the influence of posture on HGS, with studies consistently demonstrating that body position can significantly alter force outputs [1,30,32,33,34,41,42]. In the present study, HGSSTAND yielded significantly higher values than seated HGSSIT, reinforcing the importance of standardizing posture when using HGS as a surrogate for specific strength. The observed postural effect aligns with previous literature suggesting that grip strength is influenced by upper-body stabilization and overall kinetic chain engagement [1,30,42,53]. While seated testing minimizes extraneous movement and isolates grip strength, standing assessments allow for greater systemic tension through the trunk and lower body, which may enhance force transmission to the hand [30].
Biomechanically, HGSSTAND likely benefits from enhanced neuromuscular engagement and postural stabilization. Standing increases intra-abdominal pressure, core bracing, and force transmission from the lower extremities through the kinetic chain to the upper body [54]. This concept is particularly relevant when considering that grip strength depends not only on the hand and forearm but also on proximal muscle activation, including the shoulder stabilizers and trunk musculature [33]. Almashaqbeh et al. [55] demonstrated that arm and body positioning influence grip strength, with more stable positions yielding higher outputs. Thus, standing HGS assessments may benefit from improved postural alignment, leading to greater force application compared to seated testing, which minimizes external stabilization and isolates grip strength.
These postural differences hold practical value based on the testing context. Seated assessments may be preferable for controlled clinical evaluations (e.g., seated pressing or pulling strength vs. HGSSIT), while a standing assessment might provide a more functional representation of strength in dynamic or athletic settings (e.g., standing overhead press vs. HGSSTAND with arm in 180° of flexion, similar to the press lockout). Shyam Kumar et al. [56] previously demonstrated that grip strength and endurance differ based on the testing position, reinforcing the need for context-specific assessments. However, posture alone does not fully explain HGS performance. Grip capacity also depends on training background and overall strength. Given that our cohorts had distinct training histories, underlying differences between competitive strength-trained athletes and recreationally trained individuals may have further influenced the observed postural effects, warranting further investigation.

4.4. General Strength and Grip Comparisons: Stronger vs. Weaker Individuals

Researchers have consistently demonstrated that resistance-trained individuals and higher-level athletes exhibit higher absolute and relative grip strength compared to untrained individuals and lower-level athletes [17,24,57]. This discrepancy likely stems from chronic strength adaptations that improve neuromuscular efficiency and force production capacity. However, it is possible that higher-level athletes reach a point where HGS may not meaningfully improve further. Specifically, Tromaras et al. [21] examined high-level powerlifters and found that despite significant improvements in 1RM BS, BP, and DL following a training cycle, HGS did not exhibit concurrent increases. This suggests that while grip strength may serve as a surrogate for maximal strength in general populations, its sensitivity to changes in strength performance among highly trained individuals may be limited; albeit, thorough analyses were not performed to investigate further.
Studies comparing HGS across trained and untrained populations suggest that sport-specific demands significantly influence grip strength outputs. Melnychuk et al. [58] observed superior grip strength among medical students engaged in various sports (e.g., powerlifting, athletics, and CrossFit) compared to peers in standard physical education programs. Similarly, Sun et al. [59], found that resistance-trained individuals demonstrated significantly greater grip strength endurance than untrained controls. These results highlight the importance of training exposure and specificity, particularly in sports emphasizing grip-intensive movements.
However, differences in HGS correlations among strength-trained individuals also depend on lifting equipment and sport-specific mechanics. Schoffstall et al. [28] observed nearly perfect correlations (r ≈ 0.97) between HGS and 1RM BS, BP, and DL in raw powerlifters but reported only small to moderate correlations (r = 0.31–0.41) in equipped powerlifters. This discrepancy likely arises because equipped lifters use assistive powerlifting gear that reduces force generations, whereas raw lifters must rely entirely on their force generation and grip to maintain control of the bar. Similarly, Suazo and Debeliso [29] found that while HGS correlated well with powerlifting performance in a female-only cohort, its predictive power varied by lift, suggesting that the degree of grip involvement in each movement contributes to these differences. These findings emphasize that HGS is most relevant as a strength assessment tool when grip remains a limiting factor in maximal effort lifting.
Despite these sport-specific nuances, the present study demonstrates that both HGSSTAND and HGSSIT exhibited very strong correlations with 1RM TOT, reinforcing their utility as surrogate measures of overall strength in trained populations. This alignment with 1RM powerlifting performance suggests that previous studies may have overlooked methodological differences in testing posture or evaluated only a limited subset of strength outcomes. By accounting for postural variations and including both stronger and weaker subjects, these findings offer a more comprehensive understanding of HGS efficacy in recreational and competitive lifters.
Taken together, these findings indicate that while HGS serves as a robust marker of general strength capacity, its interpretation must be contextualized based on an individual’s training status and sport-specific demands. In untrained or recreationally active populations, HGS appears to be a meaningful indicator of maximal strength. However, among well-trained strength athletes, its relationship with 1RM performance may be attenuated due to sport-specific adaptations and external influences, such as the use of supportive equipment that alters force production and movement mechanics. Future research should explore the interaction between grip strength and strength adaptations across diverse athletic populations, with particular attention to the role of grip-intensive versus non-grip-intensive lifting strategies.

4.5. Limitations

This study has several limitations. Although the sample size was sufficient for statistical analyses, it limits generalizability, particularly to untrained individuals and athletes outside of powerlifting or those who do not use BS, BP, and DL for training and testing movements. Additionally, the study did not employ a crossover design, which would have allowed within-subject comparisons across testing positions. Instead, distinct cohorts were used to examine training-specific adaptations, but this remains a consideration. The absence of a longitudinal analysis also prevented tracking how training progression influences HGS correlations with 1RM performance over time. Future research should explore these relationships through repeated measures to determine whether grip strength adaptations mirror maximal strength development along with exploring other 1RM lifts.

4.6. Practical Applications

The findings from this study provide practical insights for strength and conditioning professionals, rehabilitation specialists, and clinicians. HGSSTAND serves as a non-invasive proxy for DL strength, while HGSSIT reliably reflects BP performance. To ensure accurate longitudinal tracking of strength adaptations, practitioners should maintain consistent testing protocols.
Beyond their applications in powerlifting, HGS assessments may serve as general strength indicators across various sports and training disciplines. For example, athletes who may not regularly perform BS, BP, and DL, such as weightlifters, strongman competitors, or team sport athletes, could use HGS alongside alternative compound movements to estimate alternate TOT 1RM strength. In such cases, 1RM front squat (lower-body strength), 1RM overhead press (upper-body push), and 1RM Pendlay row (upper-body pull) could provide a comparable total-body strength measure (e.g., summing these values as an alternative to the traditional powerlifting TOT). Future research should explore whether these alternative 1RM combinations maintain similar correlations with HGS measures, further expanding their applicability.
These results suggest that HGS testing is a practical, time-efficient tool in settings where maximal 1RM testing is not feasible. Importantly, selecting the appropriate testing posture should align with the specific strength qualities of interest, as standing vs. seated position measurements reflect distinct neuromuscular demands.

5. Conclusions

This study highlights the utility of HGS as a robust, reproducible, and practical surrogate for maximal strength assessments in both recreationally strength-trained and competitive strength athlete populations. Specifically, HGSSTAND demonstrates a robust relationship with 1RM DL performance, while seated HGSSIT is more closely associated with 1RM BP strength; yet, both have strong relationships with TOT strength. These findings reinforce the importance of considering testing posture when implementing HGS as a non-invasive strength assessment tool.

Author Contributions

Conceptualization, S.K.T.; methodology, S.K.T.; data collection, S.K.T., A.V.S. and B.I.B.; software, S.K.T.; validation, S.K.T., A.V.S. and B.I.B.; formal analysis, S.K.T.; investigation, S.K.T., A.V.S. and B.I.B.; supervision, S.K.T.; writing—original draft preparation, S.K.T.; writing—review and editing, S.K.T., A.V.S. and B.I.B.; visualization, S.K.T. All authors have read and agreed to the published version of the manuscript.

Funding

This research received no external funding.

Institutional Review Board Statement

The study was conducted in accordance with the Declaration of Helsinki and approved by the Institutional Review Board of Liberty University (protocol #IRB-FY23-24-960).

Informed Consent Statement

Informed consent was obtained from all subjects involved in the study.

Data Availability Statement

Research data are available upon reasonable request.

Acknowledgments

The authors would like to thank all the participants who gave us their time and effort to conduct this study.

Conflicts of Interest

The authors declare no conflicts of interest.

References

  1. Cronin, J.; Lawton, T.; Harris, N.; Kilding, A.; McMaster, D.T. A Brief Review of Handgrip Strength and Sport Performance. J. Strength Cond. Res. 2017, 31, 3187–3217. [Google Scholar] [CrossRef] [PubMed]
  2. Labott, B.K.; Bucht, H.; Morat, M.; Morat, T.; Donath, L. Effects of Exercise Training on Handgrip Strength in Older Adults: A Meta-Analytical Review. Gerontology 2019, 65, 686–698. [Google Scholar] [CrossRef] [PubMed]
  3. Wang, D.X.M.; Yao, J.; Zirek, Y.; Reijnierse, E.M.; Maier, A.B. Muscle Mass, Strength, and Physical Performance Predicting Activities of Daily Living: A Meta-Analysis. J. Cachexia Sarcopenia Muscle 2020, 11, 3–25. [Google Scholar] [CrossRef]
  4. Abe, T.; Kohmura, Y.; Suzuki, K.; Someya, Y.; Loenneke, J.P.; Machida, S.; Naito, H. Athletes in Sporting Events with Upper-Body Gripping Movements Have Greater Handgrip Strength than Those in Sporting Events That Prioritize the Lower Body. Am. J. Hum. Biol. 2023, 35, e23891. [Google Scholar] [CrossRef] [PubMed]
  5. Sánchez-Pay, A.; Pino-Ortega, J.; Sanz-Rivas, D. Influence of Successive Wheelchair Tennis Matches on Handgrip Strength in High-Level Male Players. Int. J. Environ. Res. Public Health 2023, 20, 4842. [Google Scholar] [CrossRef]
  6. Ferraz, A.; Valente-Dos-Santos, J.; Duarte-Mendes, P.; Nunes, C.; Victorino, S.; Coelho-E-Silva, M.J.; Travassos, B. Body Composition and Grip Strength Constraints in Elite Male Rink-Hockey Players of Contrasting Ethnicity. PLoS ONE 2022, 17, e0274894. [Google Scholar] [CrossRef]
  7. Amato, A.; Giustino, V.; Patti, A.; Proia, P.; Trivic, T.; Drid, P.; Obradovic, A.; Manojlovic, M.; Mondoni, M.; Paoli, A.; et al. Young Basketball Players Have Better Manual Dexterity Performance than Sportsmen and Non-Sportsmen of the Same Age: A Cross-Sectional Study. Sci. Rep. 2023, 13, 20953. [Google Scholar] [CrossRef]
  8. Soylu, Ç.; Yıldırım, N.Ü.; Akalan, C.; Akınoğlu, B.; Kocahan, T. The Relationship Between Athletic Performance and Physiological Characteristics in Wheelchair Basketball Athletes. Res. Q. Exerc. Sport. 2021, 92, 639–650. [Google Scholar] [CrossRef]
  9. Camacho-Villa, M.A.; Hurtado-Alcoser, J.; Jerez, A.S.; Saavedra, J.C.; Paredes Prada, E.T.; Merchán, J.A.; Millan-Domingo, F.; Silva-Polanía, C.; De la Rosa, A. Handgrip Strength and Upper Limb Anthropometric Characteristics among Latin American Female Volleyball Players. J. Funct. Morphol. Kinesiol. 2024, 9, 168. [Google Scholar] [CrossRef]
  10. Francia, P.; Ferri Marini, C.; Bocchi, L.; Piccini, B.; Seghieri, G.; Federici, A.; Toni, S.; Lucertini, F. The Assessment of Ankle Range-of-Motion and Its Relationship with Overall Muscle Strength in a Cross-Section of Soccer Players. Sports 2023, 11, 12. [Google Scholar] [CrossRef]
  11. Burnett, P.J.M.; Willems, M.E.T. Effects of New Zealand Blackcurrant Extract on Sequential Performance Testing in Male Rugby Union Players. Sports 2022, 10, 152. [Google Scholar] [CrossRef] [PubMed]
  12. Stavrou, V.T.; Vavougios, G.D.; Tsirimona, G.; Daniil, Z.; Gourgoulianis, K.I. Sleep Quality in Greek Adolescent Swimmers. J. Funct. Morphol. Kinesiol. 2024, 9, 87. [Google Scholar] [CrossRef] [PubMed]
  13. Busta, J.; Hellebrand, J.; Kinkorová, I.; Duchoňová, A.; Hybská, T.; Sánchez, C.C.; Vajda, M. Body Morphology and Handgrip Strength Parameters of the Female Canoe Slalom Paddlers. Front. Physiol. 2024, 15, 1343341. [Google Scholar] [CrossRef] [PubMed]
  14. Stefan, R.R.; Camic, C.L.; Miles, G.F.; Kovacs, A.J.; Jagim, A.R.; Hill, C.M. Relative Contributions of Handgrip and Individual Finger Strength on Climbing Performance in a Bouldering Competition. Int. J. Sports Physiol. Perform. 2022, 17, 768–773. [Google Scholar] [CrossRef]
  15. Amaral, L.; Claessens, A.L.; Ferreirinha, J.E.; Santos, P.J. Ulnar Variance Related to Biological and Training Characteristics and Handgrip Strength in Portuguese Skeletally Immature Female Gymnasts. J. Sports Med. Phys. Fitness 2012, 52, 393–404. [Google Scholar]
  16. Karatrantou, K.; Katsoula, C.; Tsiakaras, N.; Ioakimidis, P.; Gerodimos, V. Strength Training Induces Greater Increase in Handgrip Strength than Wrestling Training per Se. Int. J. Sports Med. 2020, 41, 533–538. [Google Scholar] [CrossRef]
  17. Honorato, R.d.C.; Franchini, E.; Lara, J.P.R.; Fonteles, A.I.; Pinto, J.C.B.d.L.; Mortatti, A.L. Differences in Handgrip Strength-Endurance and Muscle Activation Between Young Male Judo Athletes and Untrained Individuals. Res. Q. Exerc. Sport 2021, 92, 1–10. [Google Scholar] [CrossRef]
  18. Folhes, O.; Reis, V.M.; Marques, D.L.; Neiva, H.P.; Marques, M.C. Maximum Isometric and Dynamic Strength of Mixed Martial Arts Athletes According to Weight Class and Competitive Level. Int. J. Environ. Res. Public Health 2022, 19, 8741. [Google Scholar] [CrossRef]
  19. Ince, İ.; Ulupinar, S. Prediction of Competition Performance via Selected Strength-Power Tests in Junior Weightlifters. J. Sports Med. Phys. Fitness 2020, 60, 236–243. [Google Scholar] [CrossRef]
  20. Guilherme, J.P.L.F.; Semenova, E.A.; Borisov, O.V.; Larin, A.K.; Moreland, E.; Generozov, E.V.; Ahmetov, I.I. Genomic Predictors of Testosterone Levels Are Associated with Muscle Fiber Size and Strength. Eur. J. Appl. Physiol. 2022, 122, 415–423. [Google Scholar] [CrossRef]
  21. Tromaras, K.; Zaras, N.; Stasinaki, A.-N.; Mpampoulis, T.; Terzis, G. Lean Body Mass, Muscle Architecture and Powerlifting Performance during Preseason and in Competition. J. Funct. Morphol. Kinesiol. 2024, 9, 89. [Google Scholar] [CrossRef] [PubMed]
  22. Travis, S.K.; Mujika, I.; Gentles, J.A.; Stone, M.H.; Bazyler, C.D. Tapering and Peaking Maximal Strength for Powerlifting Performance: A Review. Sports 2020, 8, 125. [Google Scholar] [CrossRef] [PubMed]
  23. Travis, S.K.; Mujika, I.; Zwetsloot, K.A.; Gentles, J.A.; Stone, M.H.; Bazyler, C.D. The Effects of 3 vs. 5 Days of Training Cessation on Maximal Strength. J. Strength Cond. Res. 2022, 36, 633–640. [Google Scholar] [CrossRef]
  24. Drid, P.; Casals, C.; Mekic, A.; Radjo, I.; Stojanovic, M.; Ostojic, S.M. Fitness and Anthropometric Profiles of International vs. National Judo Medalists in Half-Heavyweight Category. J. Strength Cond. Res. 2015, 29, 2115–2121. [Google Scholar] [CrossRef]
  25. Jukic, I.; García-Ramos, A.; Baláš, J.; Malecek, J.; Omcirk, D.; Tufano, J.J. Ergogenic Effects of Lifting Straps on Movement Velocity, Grip Strength, Perceived Exertion and Grip Security during the Deadlift Exercise. Physiol. Behav. 2021, 229, 113283. [Google Scholar] [CrossRef]
  26. Schiemann, S.; Keiner, M.; Wirth, K.; Lohmann, L.H.; Wagner, C.-M.; Behm, D.G.; Warneke, K. The Magnitude of Correlation between Deadlift 1RM and Jumping Performance Is Sports Dependent. Front. Sports Act. Living 2024, 6, 1345213. [Google Scholar] [CrossRef] [PubMed]
  27. Travis, S.K.; Zourdos, M.C.; Bazyler, C.D. Weight Selection Attempts of Elite Classic Powerlifters. Percept. Mot. Skills 2021, 128, 507–521. [Google Scholar] [CrossRef]
  28. Schoffstall, J.E.; Morrison, S.; Boswell, B.; Kozlik, B. Grip Strength and Powerlifting Performance. In Proceedings of the Southeastern Chapter of the American College of Sports Medicine Regional Conference, Greenville, SC, USA, February 2010. [Google Scholar]
  29. Suazo, N.; Debeliso, M. The Relationship between Powerlifting Performance and Hand Grip Strength among Female Athletes. Turk. J. Kinesiol. 2021, 7, 112–122. [Google Scholar] [CrossRef]
  30. Balogun, J.A.; Akomolafe, C.T.; Amusa, L.O. Grip Strength: Effects of Testing Posture and Elbow Position. Arch. Phys. Med. Rehabil. 1991, 72, 280–283. [Google Scholar]
  31. Kompf, J.; Arandjelović, O. The Sticking Point in the Bench Press, the Squat, and the Deadlift: Similarities and Differences, and Their Significance for Research and Practice. Sports Med. 2017, 47, 631–640. [Google Scholar] [CrossRef]
  32. Boadella, J.M.; Kuijer, P.P.; Sluiter, J.K.; Frings-Dresen, M.H. Effect of Self-Selected Handgrip Position on Maximal Handgrip Strength. Arch. Phys. Med. Rehabil. 2005, 86, 328–331. [Google Scholar] [CrossRef] [PubMed]
  33. Keener, M.M.; Tumlin, K.I.; Heebner, N.R. Combined Driving: Task-Specific Position Impacts Grip Strength of Equestrian Athletes. Eur. Rev. Aging Phys. Act. 2022, 19, 2. [Google Scholar] [CrossRef] [PubMed]
  34. Vaishya, R.; Misra, A.; Vaish, A.; Ursino, N.; D’Ambrosi, R. Hand Grip Strength as a Proposed New Vital Sign of Health: A Narrative Review of Evidences. J. Health Popul. Nutr. 2024, 43, 7. [Google Scholar] [CrossRef]
  35. van den Hoek, D.J.; Beaumont, P.L.; van den Hoek, A.K.; Owen, P.J.; Garrett, J.M.; Buhmann, R.; Latella, C. Normative Data for the Squat, Bench Press and Deadlift Exercises in Powerlifting: Data from 809,986 Competition Entries. J. Sci. Med. Sport 2024, 27, 734–742. [Google Scholar] [CrossRef] [PubMed]
  36. van den Hoek, D.; Garrett, J.; Travis, S.K.; Oxnard, K.; Howells, R.; Owen, P.; Latella, C. Analysis of Competition Performance Leading to Success at the International Powerlifting Federation World Championships Between 2013 and 2019. J. Strength Cond. Res. 2023, 37, e555. [Google Scholar] [CrossRef]
  37. USA Powerlifting. USA Powerlifting Technical Rules 2024, Version 2024.1; USA Powerlifting: Anchorage, AK, USA, 2024. [Google Scholar]
  38. Travis, S.K.; Zwetsloot, K.A.; Mujika, I.; Stone, M.H.; Bazyler, C.D. Skeletal Muscle Adaptations and Performance Outcomes Following a Step and Exponential Taper in Strength Athletes. Front. Physiol. 2021, 12, 1766. [Google Scholar] [CrossRef]
  39. Burke, B.I.; Carroll, K.M.; Travis, S.K.; Stone, M.E.; Stone, M.H. Two Days Versus Four Days of Training Cessation Following a Step-Taper in Powerlifters. J. Strength Cond. Res. 2023, 37, 625–632. [Google Scholar] [CrossRef]
  40. Burke, B.I.; Travis, S.K.; Gentles, J.A.; Sato, K.; Lang, H.M.; Bazyler, C.D. The Effects of Caffeine on Jumping Performance and Maximal Strength in Female Collegiate Athletes. Nutrients 2021, 13, 2496. [Google Scholar] [CrossRef]
  41. Parvatikar, V.B.; Mukkannavar, P.B. Comparative Study of Grip Strength in Different Positions of Shoulder and Elbow with Wrist in Neutral and Extension Positions. J. Ex. Sci. Physiother. 2011, 5, 67–75. [Google Scholar]
  42. España-Romero, V.; Ortega, F.B.; Vicente-Rodríguez, G.; Artero, E.G.; Rey, J.P.; Ruiz, J.R. Elbow Position Affects Handgrip Strength in Adolescents: Validity and Reliability of Jamar, DynEx, and TKK Dynamometers. J. Strength Cond. Res. 2010, 24, 272–277. [Google Scholar] [CrossRef]
  43. Jamar®. Jamar® Hydraulic Hand Dynamometer Owner’s Manual; Performance Health: Warrenville, IL, USA, 2024. [Google Scholar]
  44. Vanderburgh, P.M.; Batterham, A.M. Validation of the Wilks Powerlifting Formula. Med. Sci. Sports Exerc. 1999, 31, 1869–1875. [Google Scholar] [CrossRef]
  45. Hopkins, W.G. New View of Statistics: Effect Magnitudes. Available online: https://www.sportsci.org/resource/stats/effectmag.html (accessed on 29 January 2025).
  46. Jeffreys, H. The Theory of Probablity; Oxford University Press: Oxford, UK, 1939. [Google Scholar]
  47. Choe, K.H.; Coburn, J.W.; Costa, P.B.; Pamukoff, D.N. Hip and Knee Kinetics During a Back Squat and Deadlift. J. Strength Cond. Res. 2021, 35, 1364–1371. [Google Scholar] [CrossRef] [PubMed]
  48. Cholewa, J.M.; Atalag, O.; Zinchenko, A.; Johnson, K.; Henselmans, M. Anthropometrical Determinants of Deadlift Variant Performance. J. Sports Sci. Med. 2019, 18, 448–453. [Google Scholar] [PubMed]
  49. Martín-Fuentes, I.; Oliva-Lozano, J.M.; Muyor, J.M. Electromyographic Activity in Deadlift Exercise and Its Variants. A Systematic Review. PLoS ONE 2020, 15, e0229507. [Google Scholar] [CrossRef]
  50. García-Hermoso, A.; Cavero-Redondo, I.; Ramírez-Vélez, R.; Ruiz, J.R.; Ortega, F.B.; Lee, D.-C.; Martínez-Vizcaíno, V. Muscular Strength as a Predictor of All-Cause Mortality in an Apparently Healthy Population: A Systematic Review and Meta-Analysis of Data from Approximately 2 Million Men and Women. Arch. Phys. Med. Rehabil. 2018, 99, 2100–2113.e5. [Google Scholar] [CrossRef] [PubMed]
  51. Stastny, P.; Gołaś, A.; Blazek, D.; Maszczyk, A.; Wilk, M.; Pietraszewski, P.; Petr, M.; Uhlir, P.; Zając, A. A Systematic Review of Surface Electromyography Analyses of the Bench Press Movement Task. PLoS ONE 2017, 12, e0171632. [Google Scholar] [CrossRef]
  52. Nikolaidis, P.T.; Papaioannou, K.-G.; Rosemann, T.; Knechtle, B. Exercise Testing of Muscle Strength in Military. Mil. Med. 2019, 184, e426–e430. [Google Scholar] [CrossRef]
  53. Núñez-Cortés, R.; Cruz, B.D.P.; Gallardo-Gómez, D.; Calatayud, J.; Cruz-Montecinos, C.; López-Gil, J.F.; López-Bueno, R. Handgrip Strength Measurement Protocols for All-Cause and Cause-Specific Mortality Outcomes in More than 3 Million Participants: A Systematic Review and Meta-Regression Analysis. Clin. Nutr. 2022, 41, 2473–2489. [Google Scholar] [CrossRef]
  54. Vargas-Pinilla, O.-C.; Rodríguez-Grande, E.-I. Reproducibility and Agreement between Three Positions for Handgrip Assessment. Sci. Rep. 2021, 11, 12906. [Google Scholar] [CrossRef]
  55. Almashaqbeh, S.F.; Al-Momani, S.; Khader, A.; Qananwah, Q.; Marabeh, S.; Maabreh, R.; Al Badarneh, A.; Abdullah, K. The Effect of Gender and Arm Anatomical Position on the Hand Grip Strength and Fatigue Resistance during Sustained Maximal Handgrip Effort. J. Biomed. Phys. Eng. 2022, 12, 171–180. [Google Scholar] [CrossRef]
  56. Shyam Kumar, A.J.; Parmar, V.; Ahmed, S.; Kar, S.; Harper, W.M. A Study of Grip Endurance and Strengh in Different Elbow Positions. J. Orthop. Traumatol. 2008, 9, 209–211. [Google Scholar] [CrossRef] [PubMed]
  57. Harris, D.M.; Kendall, K.; Haff, G.G.; Latella, C. Absolute and Relative Strength, Power and Physiological Characteristics of Indian Junior National-Level Judokas. Sports 2020, 8, 14. [Google Scholar] [CrossRef] [PubMed]
  58. Melnychuk, I.M.; Yastremska, S.O.; Popovych, D.V.; Humeniuk, V.V.; Yefremova, O.V.; Novakova, L.V.; Shukatka, O.V. Health Dynamics of the Medical University Students During Sports Activities. Wiad. Lek. 2021, 74, 295–302. [Google Scholar] [CrossRef] [PubMed]
  59. Sun, R.; Wan, J.; Tang, J.; Deng, Y.; Zhang, M.; Liu, C.; Li, J.; Zhang, Q. Effectiveness of Resistance Training on Body Composition, Muscle Strength, and Biomarker in Sarcopenic Older Adults: A Meta-Analysis of Randomized Controlled Trials. Arch. Gerontol. Geriatr. 2025, 128, 105595. [Google Scholar] [CrossRef]
Figure 1. Sample distribution for one-repetition-maximum (1RM) back squat (A), bench press (B), deadlift (C), and total (D).
Biomechanics 05 00016 g001
Figure 2. Testing timeline begins with initial laboratory testing via (A) hydration, height, and body mass check preceding (B1) standing or (B2) seated handgrip strength testing followed by a (C1) dynamic warm-up and 1RMs on (C2) back squat, (C3) bench press, and (C4) deadlift.
Biomechanics 05 00016 g002
Figure 3. Classical correlations: standing handgrip strength (HGSSTAND) vs. one-repetition-maximum (1RM) for (A) back squat, (B) bench press, (C) deadlift, and (D) total. Black solid lines represent the line of best fit, while blue dashed lines indicate the 95% confidence intervals. Each point represents an individual data observation.
Biomechanics 05 00016 g003
Figure 4. Classical correlations: seated handgrip strength (HGSSIT) vs. one-repetition-maximum (1RM) for (A) back squat, (B) bench press, (C) deadlift, and (D) total. Black solid lines represent the line of best fit, while blue dashed lines indicate the 95% confidence intervals. Each point represents an individual data observation.
Biomechanics 05 00016 g004
Table 1. Standing handgrip strength classical and Bayesian correlation outputs.
Classical
Correlation
HGSSTAND vs.rp95% CI1Hopkins’ Classification
1RM BS0.6490.001[0.313, 0.841]Large
1RM BP0.5570.007[0.177, 0.792]Large
1RM DL0.693<0.001[0.384, 0.863]Large
1RM TOT0.672<0.001[0.313, 0.837]Large
Bayesian
Correlation
HGSSTAND vs.rBF1095% CI2Jeffreys’ Classification
1RM BS0.64939.32[0.279, 0.824]Very Strong
1RM BP0.5577.95[0.154, 0.772]Moderate
1RM DL0.693106.42[0.346, 0.849]Extreme
1RM TOT0.67263.97[0.313, 0.837]Very Strong
HGSSTAND = Handgrip Strength Standing; r = Pearson’s r; p = p-value; BF10 = Bayes Factor; 95% CI1 = Confidence Intervals; 95% CI2 = Credible Interval; 1RM = One-Repetition-Maximum; BS = Back Squat; BP = Bench Press; DL = Deadlift; TOT = Total.
Table 2. Seated handgrip strength classical and Bayesian correlation outputs.
Classical
Correlation
HGSSIT vs.rp95% CI1Hopkins’ Classification
1RM BS0.5690.006[0.194, 0.799]Large
1RM BP0.732<0.001[0.448, 0.881]Very Large
1RM DL0.5790.005[0.208, 0.804]Large
1RM TOT0.6470.001[0.311, 0.840]Large
Bayesian
Correlation
HGSSIT vs.rBF1095% CI2Jeffreys’ Classification
1RM BS0.5699.49[0.169, 0.779]Moderate
1RM BP0.732291.32[0.407, 0.870]Extreme
1RM DL0.57911.10[0.182, 0.784]Strong
1RM TOT0.64738.15[0.277, 0.823]Very Strong
HGSSIT = Handgrip Strength Seated; r = Pearson’s r; p = p-value; BF10 = Bayes Factor; 95% CI1 = Confidence Intervals; 95% CI2 = Credible Interval; 1RM = One-Repetition-Maximum; BS = Back Squat; BP = Bench Press; DL = Deadlift; TOT = Total.
Disclaimer/Publisher’s Note: The statements, opinions and data contained in all publications are solely those of the individual author(s) and contributor(s) and not of MDPI and/or the editor(s). MDPI and/or the editor(s) disclaim responsibility for any injury to people or property resulting from any ideas, methods, instructions or products referred to in the content.

