Article

The Swelling–Shrinkage Properties of Intact and Disturbed Clayey and Marly Soils: The Density Effect

GERS/SRO, IFSTTAR, Université Gustave Eiffel, 14-20 Boulevard Newton, Champs sur Marne, 77420 Marne-la-Vallée, France
*
Author to whom correspondence should be addressed.
Geotechnics 2024, 4(2), 512-529; https://doi.org/10.3390/geotechnics4020028
Submission received: 9 April 2024 / Revised: 5 May 2024 / Accepted: 16 May 2024 / Published: 28 May 2024
(This article belongs to the Special Issue Recent Advances in Geotechnical Engineering (2nd Edition))

Abstract

:
Expansive soils commonly encountered beneath foundations often lead to structural issues inducing expensive repairs. With the increase of the frequency of dry summers and irregular rainfall patterns, the clayey and marly soils become more and more sensitive to shrinking and swelling phenomena. So to find solutions and improve the knowledge on such phenomena especially in temperate countries where the saturation state is considered as the usual soil state, the impact of the soil density on shrinkage was studied by varying the compaction mode and introducing a swelling step before shrinkage. As expected, dynamically or statically compacted clayey or marly soils exhibited high shrinkage deformation when the soil had a low density. The swelling before shrinkage impacted the soil structure but ultimately had a low effect on shrinkage deformation. Swelling deformation was also influenced by density; the denser the soil, the more sensitive the compacted soil became to swelling. Furthermore, compaction modes induced differences in swelling or shrinkage amplitude that couldn’t be explained by microstructural observations. Finally, results demonstrated that intact soil behavior after shrinkage could be extrapolated from swelling–shrinkage tests conducted on remolded soil samples, thus decreasing the cost of field investigations.

Graphical Abstract

1. Introduction

Among the parameters governing the geotechnical behavior of soils, density is a key one. While some references discuss its influence on the swelling–shrinkage of intact soils, characterized by an undisturbed microstructure, the behavior of disturbed (and compacted) soils is largely studied, particularly by earthworkers using active compaction (with lime addition) to improve soil properties [1,2,3].
It is clear from the earthworks literature that soil structure is affected by compaction, which depends on the soil type, water content and loading. Ref. [4] showed that the history of materials, such as the loading pressure, the temperature, the degree of drying, and if the soil has been subjected to freezing, also has an influence. The understanding of the effect of soil density on the swelling–shrinking phenomenon can be improved by observing the soil structure and studying the water–clay interaction [5]. Early studies have shown that the macroscopic behavior of soils depends on microscopic phenomena, in particular the effect of water content on the compaction and arrangement of soil particles [6,7]. However, the microstructure of clayey soils and how it changes under water fluctuations or mechanical stress remains poorly understood. Clay plates or small aggregates can be observed locally by transmission electron microscopy at the nanometer scale, but the important role of soil heterogeneity, which can determine macroscopic behavior, especially in natural soils, cannot be fully appreciated at the centimeter or decimeter scale alone. No experimental apparatus can provide nano- or micrometric data on a full centimeter sample. X-ray tomography attempts to achieve such a goal, but is currently limited to volumes smaller than a cubic millimeter if a 10 µm resolution is desired. However, despite this limitation, it has been observed that particles in clayey soils tend to aggregate, forming large aggregates structured at the millimeter scale [8]. Low-density soils typically exhibit a structure where aggregates are connected by clay bridges. In dense soils, the concept of aggregate structure becomes less applicable as it becomes difficult to distinguish individual aggregates from each other [9]. The use of mercury intrusion porosimetry (MIP) demonstrates the influence of compaction on pore size distribution, both inter- and intra-aggregate. Consequently, the decrease in the void ratio due to compaction correlates with a decrease in pore sizes equal to or less than 1 micron, thereby reducing their volume [10,11]. On the other hand, pores smaller than 1 micron do not appear to be affected by compaction [12].
In order to reproduce a soil in the laboratory under in situ compaction conditions, it is important to consider the physical and mechanical properties of the soil under consideration. In particular, this will influence the compaction method to be used [13,14].
For example, dry density is generally not a sufficient criterion for obtaining a representative sample of a particular compaction method. Indeed, in the case of clays, the structure tends to become more oriented as the water content increases, even for the same compaction energy [15]. In addition, as the compaction energy increases, the permeability of the soil decreases due to both increased dry density and increased particle orientation. Studies investigating the effect of initial dry density and water content on the swelling pressure and swelling deformation of compacted bentonite indicate that the swelling pressure is exponentially related to the dry density, but independent of the initial water content of the clay [16]. With regard to shrinkage, tests on clay soils indicate that shrinkage deformation increases with increasing clay content [17]. Shrinkage deformation also increases with increasing water content during compaction [18]. Tests on eight natural clay soils subjected to dry–wet cycles show that volumetric shrinkage stress appears to be influenced by soil properties and compaction conditions [14]. Ref. [19] found that the relationship between compaction force and shrinkage stress was unclear. Results were obtained from shrinkage tests on the samples of highly plastic clay prepared with compaction water contents between 10% and 20%, using three compaction energies. At low compaction water contents, shrinkage decreased with increasing compaction energy and no trend was observed at higher water contents. In conclusion, it seems to be universally accepted that the swelling–shrinking amplitude measured on deformed samples depends on density, while the behavior of intact soils is rarely mentioned [7]. Furthermore, density is still not taken into account in the classification of soil sensitivity to water variation [20,21,22]. Classifications applied to natural intact soils are usually based on tests carried out on disturbed soils. The behavior of disturbed soils or particle characteristics (such as Atterberg limits) are extrapolated to the behavior of intact soils, neglecting the role of microstructure [23].
The objective of this paper is to investigate how different soils with different densities respond to environmental variations and characterize their behavior under external hydraulic stress. The literature indicates that various parameters influence the swelling–shrinkage process when soil moisture levels change.
The cumulative effect of wet–dry cycles, and the degree of soil consolidation, are to be taken into account [24]. Lithology, mineralogy, and geotechnical indices also play a role [25]. Ref. [26] demonstrated that the liquid limit significantly influences the shrinkage limit, air entry suction, and compressibility of compacted samples. Soil disturbance, often accompanied by changes in dry density due to the compaction or relaxation of cohesive forces between particles and aggregates, is another important parameter to consider, as disturbance can modify the pore space architecture [27].
The purpose of this paper is to reinforce the idea that density needs to be introduced into such classifications, and not just the presence or absence of expansive clay. Such an approach needs to improve the knowledge of the shrinkage phenomenon, which is generally less studied than swelling deformation. Experimentally, the shrinkage tests in this paper are preceded or not by free swelling in order to demonstrate the possible role of dry–wet cycles. Furthermore, the behavior of marl is distinguished from that of clay, and its peculiarities are described in detail.

2. Materials and Methods

2.1. Materials

Two geological formations in the Paris sedimentary basin, being the primary sources of house pathologies during drought, were sampled in a quarry. The behavior of Argenteuil blue marl (BM) and Romainville green clay (GC) after disturbance and compaction was compared with that of intact soil. Green clay has a liquid limit wL equal to 76% (with a plastic Index Ip corresponding to 39%) and a < 2 µm fraction reaching 78.3% (mainly composed by muscovite/illite clay minerals). The Argenteuil blue marl has a higher liquid limit close to 82% (with Ip = 46%) and a < 2 µm fraction reaching 81% (that contains also muscovite/illite clay minerals mixed with calcite CaCO3 whose content equal to 34%).

2.2. Sample Preparation

GC and BM were subjected to ‘C’ mode disturbance as ‘cut soil’, and ‘W’ mode disturbance as ‘wet soil’. In the C-disturbance protocol, the soil, after being cut into small pieces, is coarsely ground to 1–3 mm and dried at 40 °C for at least 24 h. The W-disturbance involves mixing the soil with water (w > 1.5 wL) for 24h to form a slurry, and drying it in air in a thin layer in a large and flat container before being ground similarly to the C-disturbance mode. In both preparation methods, the disturbed soil is then moistened to reach a fixed water content corresponding to the natural water content of the soils (in the quarry), but also to the water content wOPN [28] associated with the optimum Proctor density of each soil (unless a different water content is mentioned). The wOPN and the optimum Proctor density (corresponding to the optimum water content that gives the highest dry density at a given compaction energy) measured on BM and GC are quite similar. They are, respectively, 30% and 1.26 g/cm3 for BM and 27.2% and 1.23 g/cm3 for GC.
After 24 h of homogenization (in plastic airtight bags at 8 °C), the soil is compacted in a ring, either in one step with a static press or with a dynamic compactor. Using a static press, samples of different densities are produced by varying the volume of compacted soil (only the W-disturbance mode was tested). All samples are finally cut to a similar height. Samples have similar initial water content and are undersaturated, unlike a second set of W-disturbed samples prepared in a fixed volume ring with variable amounts of water and dried soil. Such samples are initially positioned close to the saturation line in Figure 1, but with variable initial water contents.
In parallel, W- and C-disturbed samples with different densities and two initial water contents (wi = 27 or 30%) are tested after dynamic compaction using a miniaturized Proctor rammer, as described in [29]. The compaction energy is approximately 593 kN·m/dm3 and the density variation is obtained by increasing the number of blows applied per layer. The filling of the mold (an oedometer ring) is carried out in two steps. The majority of the compacted samples reach a dry density higher than the optimum Proctor density and only a few samples are positioned at a lower density. The characteristics of the samples tested are summarized in Table 1 and their initial states are shown in Figure 1.

2.3. The swelling and Shrinkage Protocol

The swelling–shrinkage test protocol applied to C- or W-disturbed soils consists of an axial free-swelling test. The welling test was conducted under a load of less than 10 kPa for 10 days, after ASTM D4546-03 (method A) [30] and a manual or automated free volume shrinkage was applied on compacted samples following AS 1289.7.1.1 standard [31]. The shrinkage curves are not shown in the dV/V–w% plot because the curves depend on the initial water content, which makes difficult the comparison of the strain potentials measured on various samples.

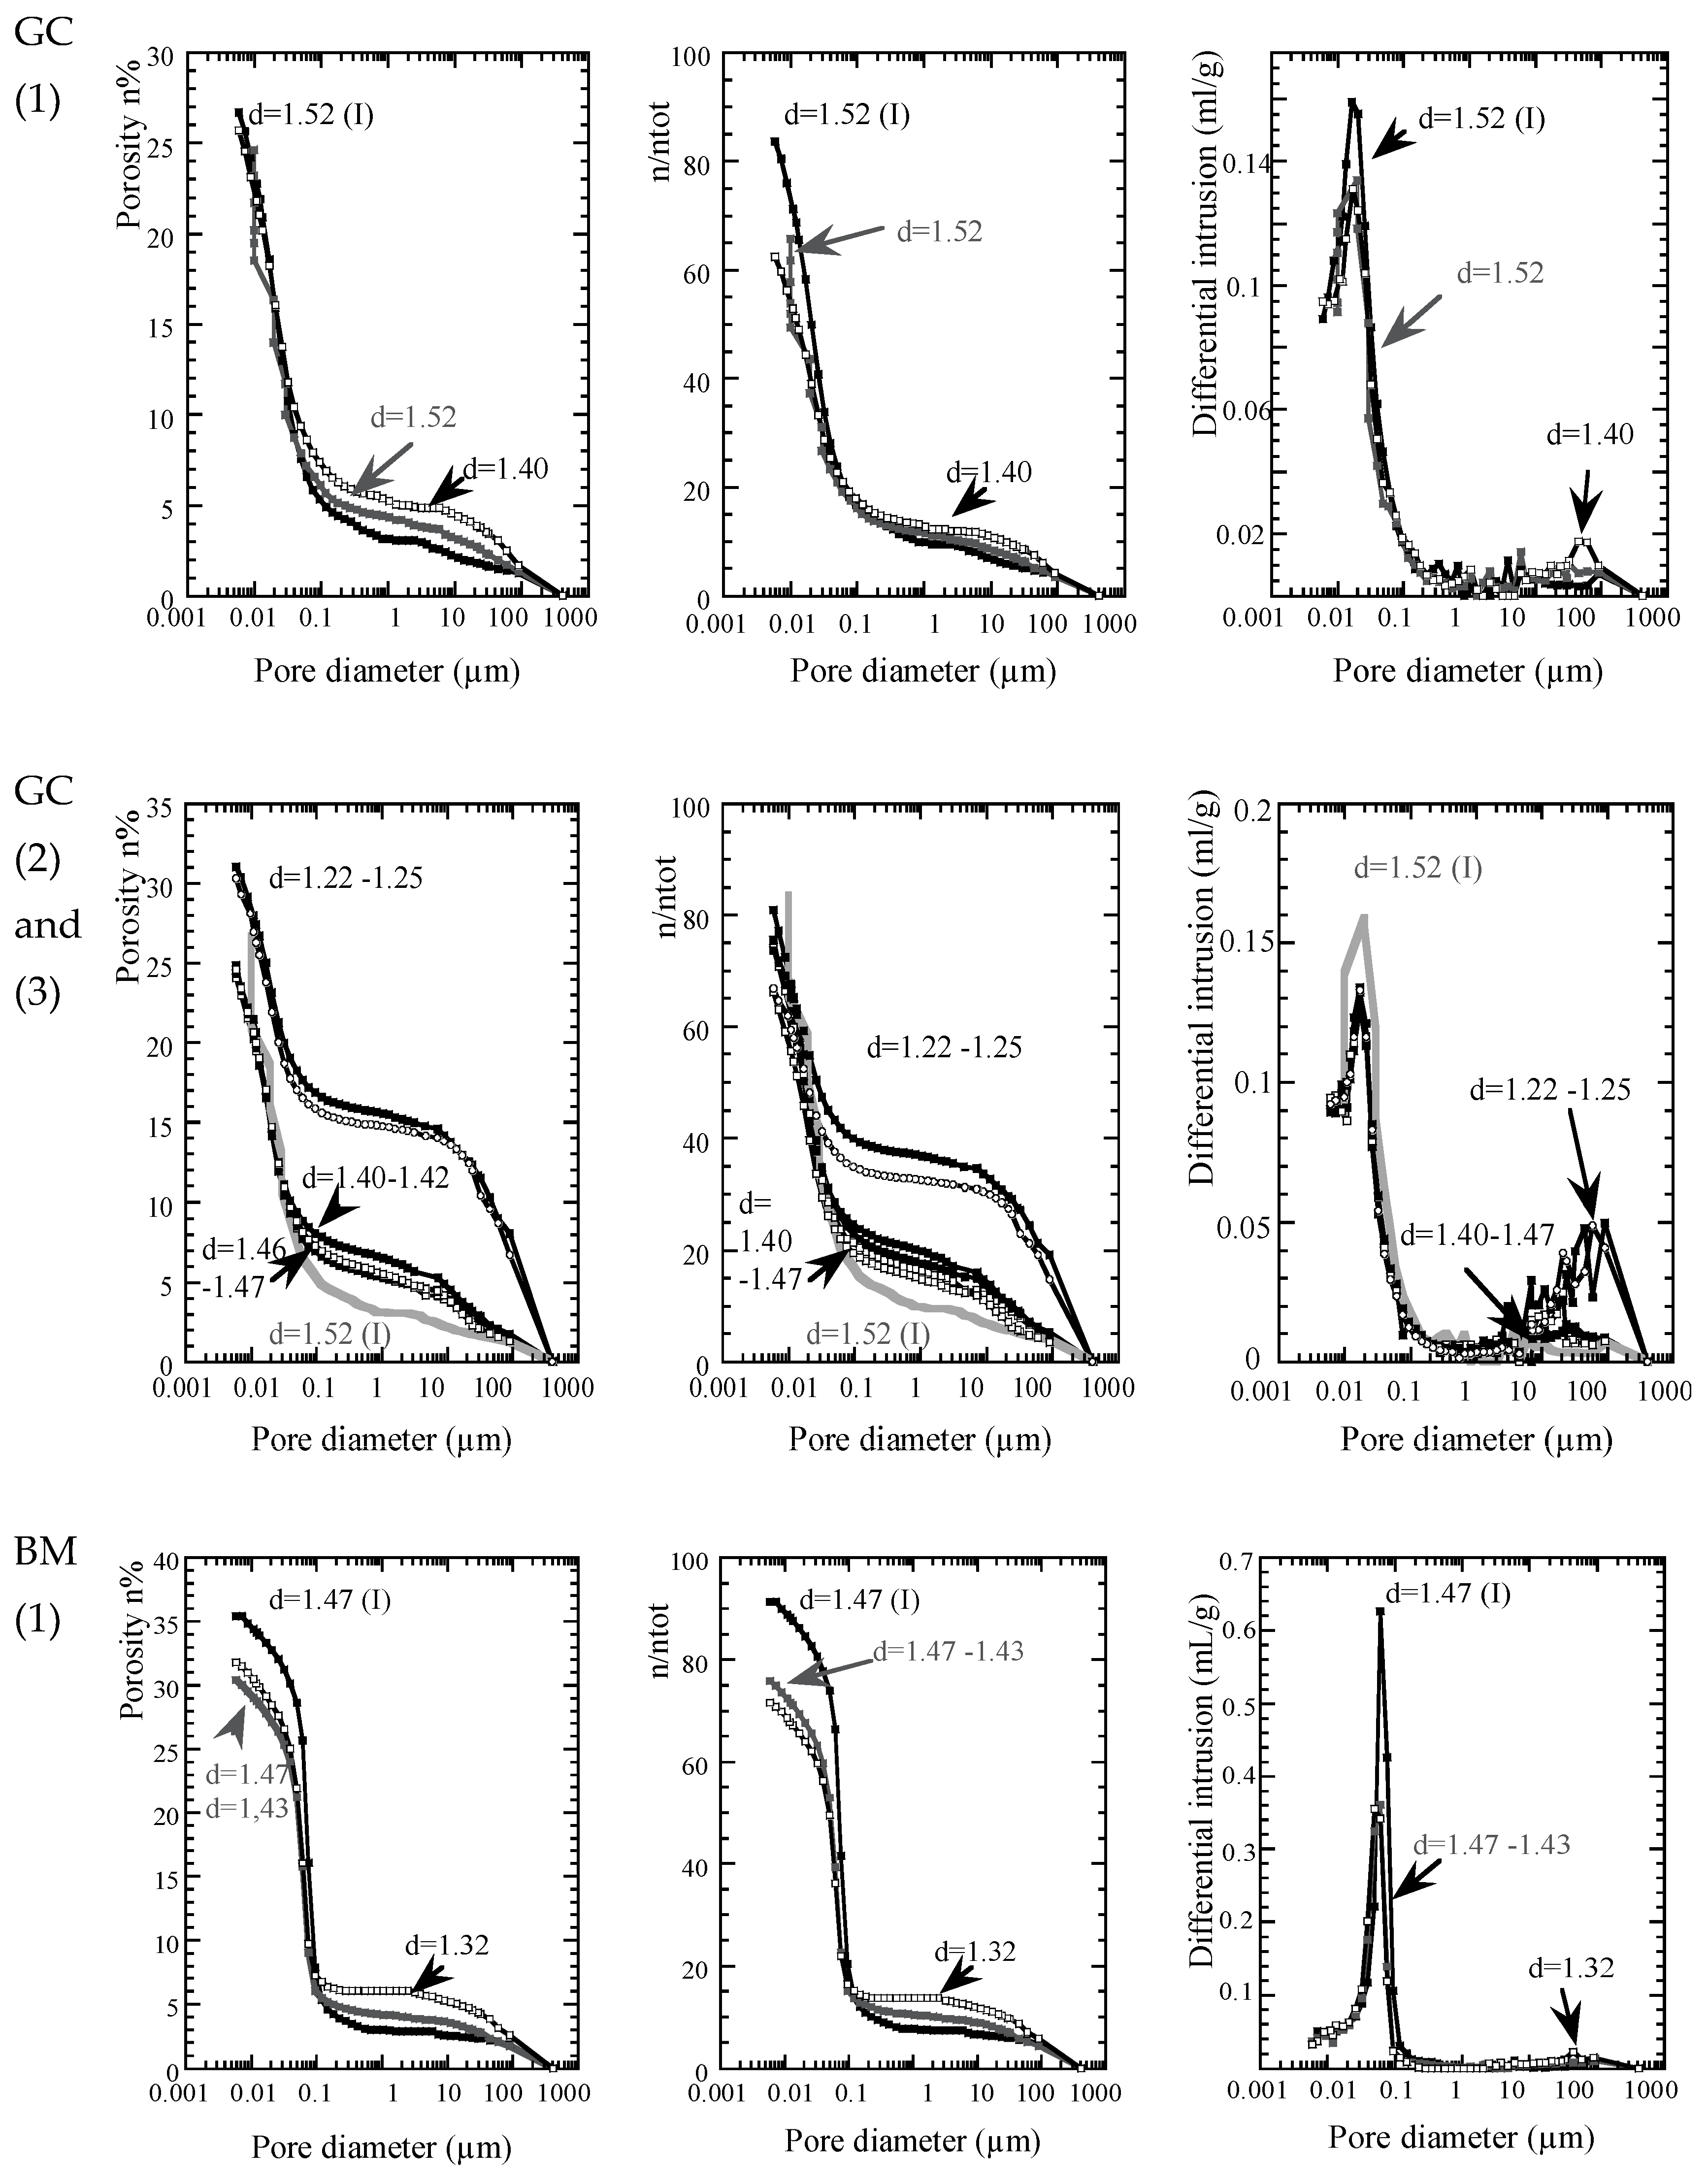
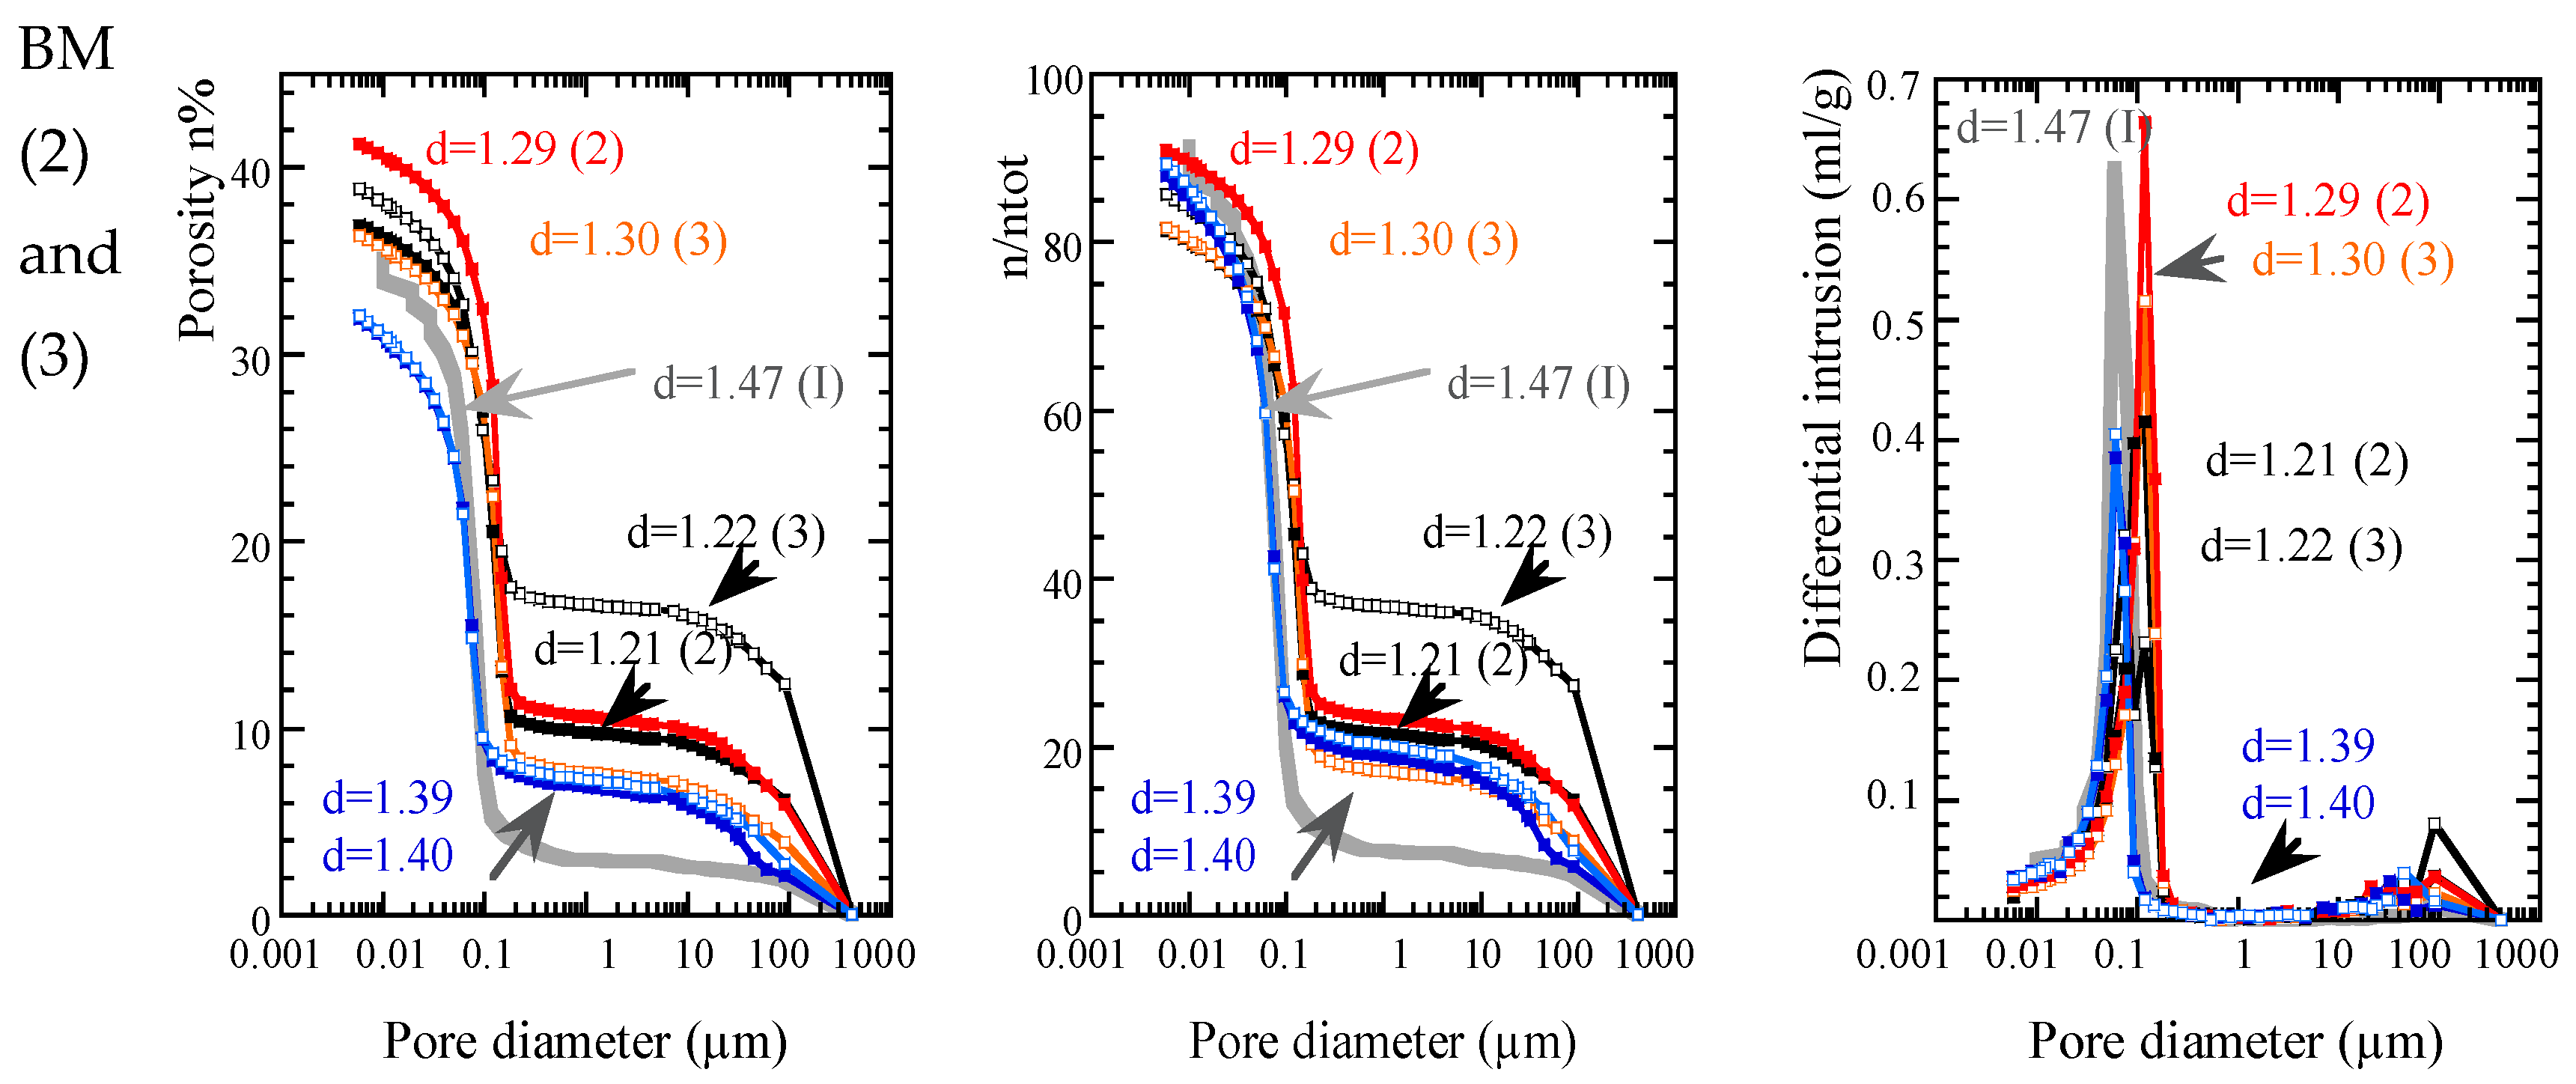
2.4. Microstructural Observations

A description of the soil microstructure is given using the mercury intrusion porosimetry (MIP) (with an Autopore IV from Micromeritics) on freeze-dried samples at the end of the shrinkage test. The pore size distribution (PSD) is described in terms of differential intrusion (dV/dlogD, where V is the volume of intruded mercury and D is the pore diameter) and accessible cumulative porosity n %. Complementary, secondary electron images in low vacuum mode of an environmental scanning electron microscope (SEM) (Quanta 400 from FEI) provide direct information on the soil structure.

3. Results and Discussion

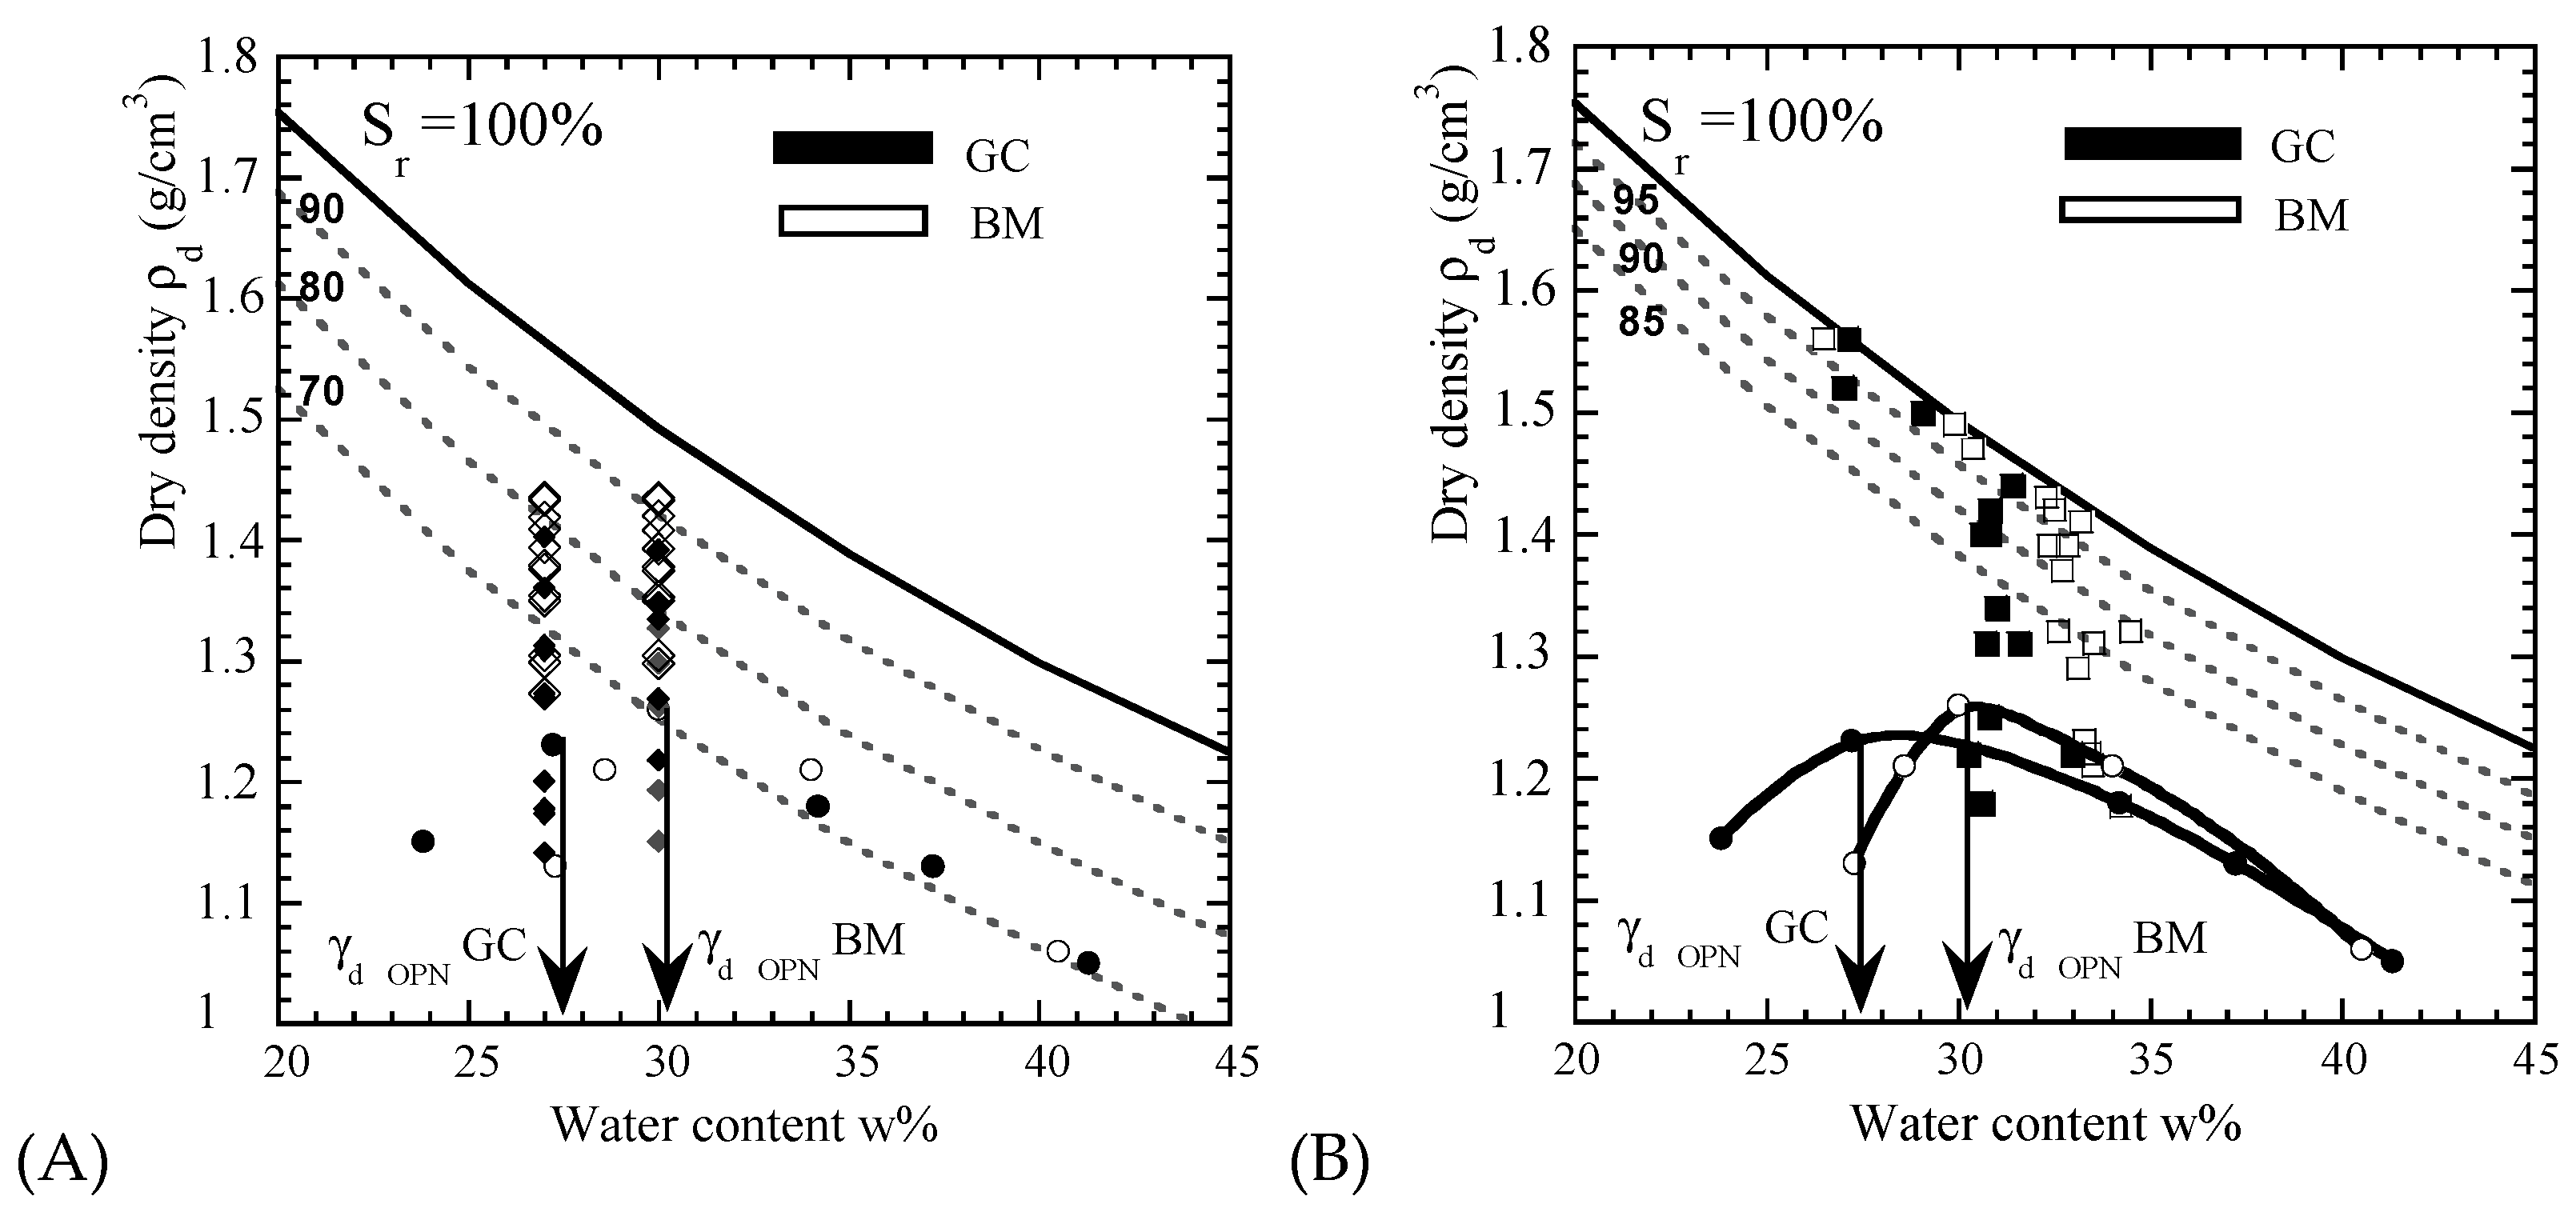
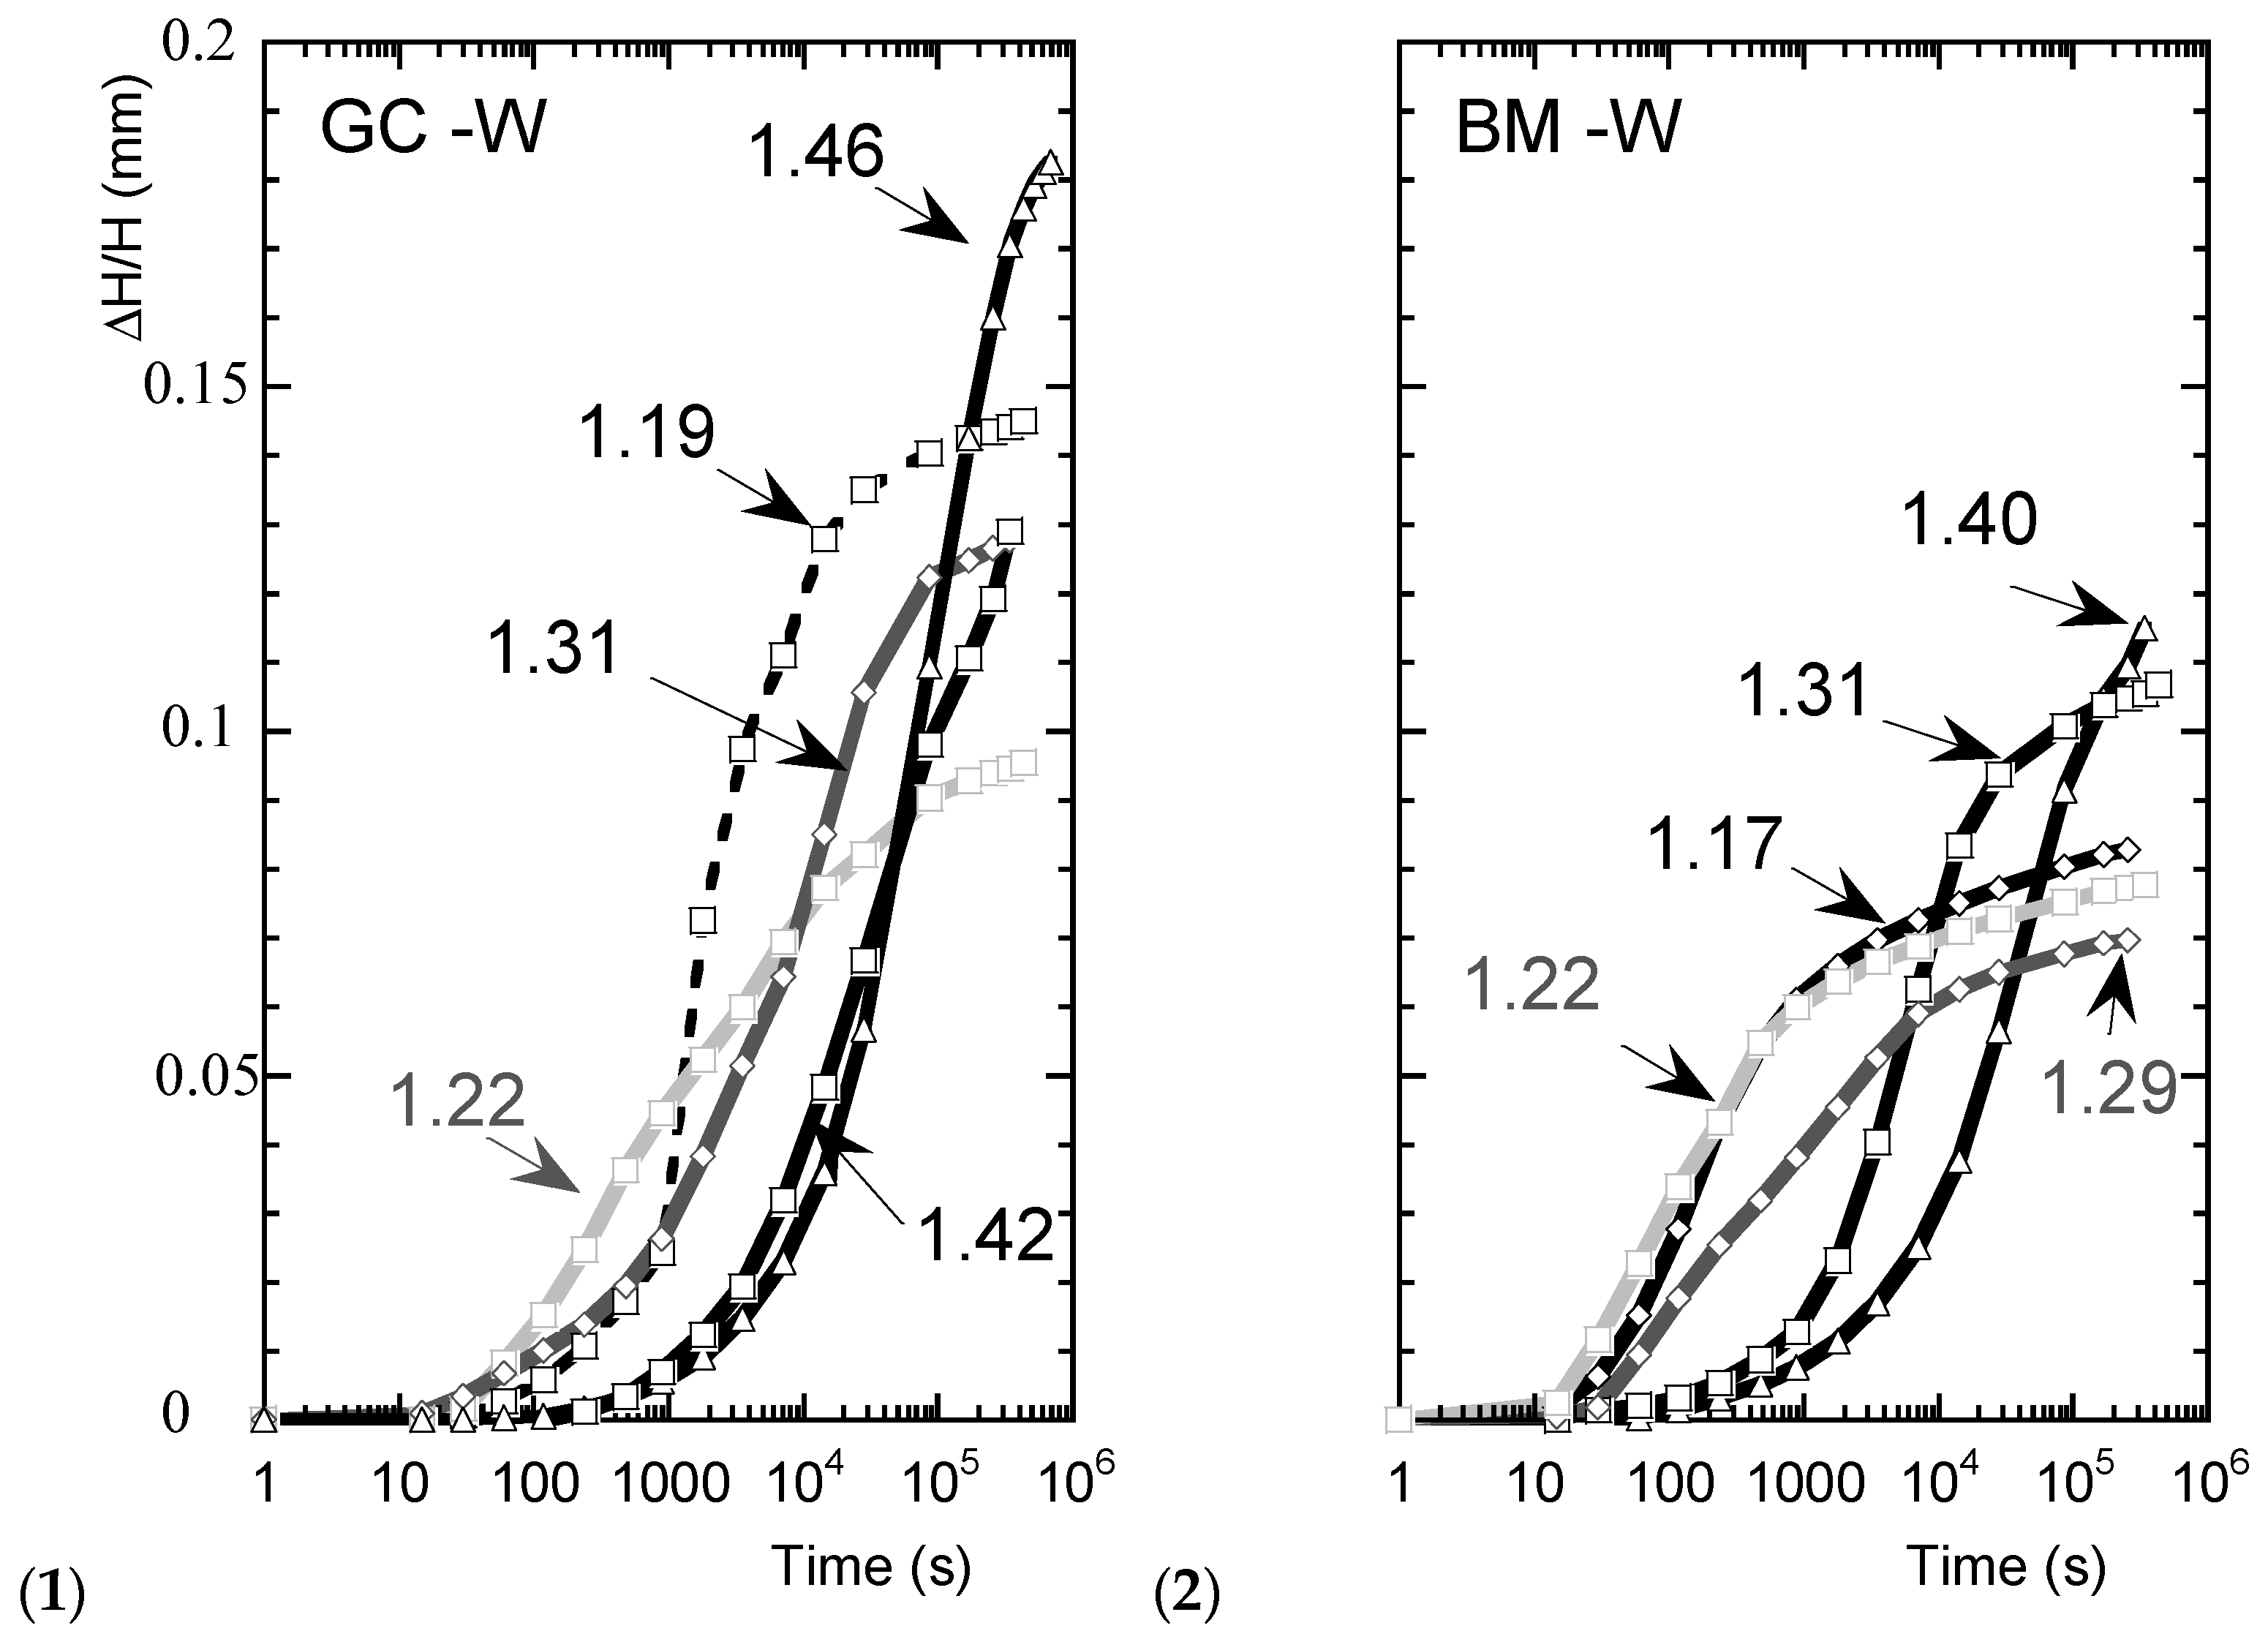
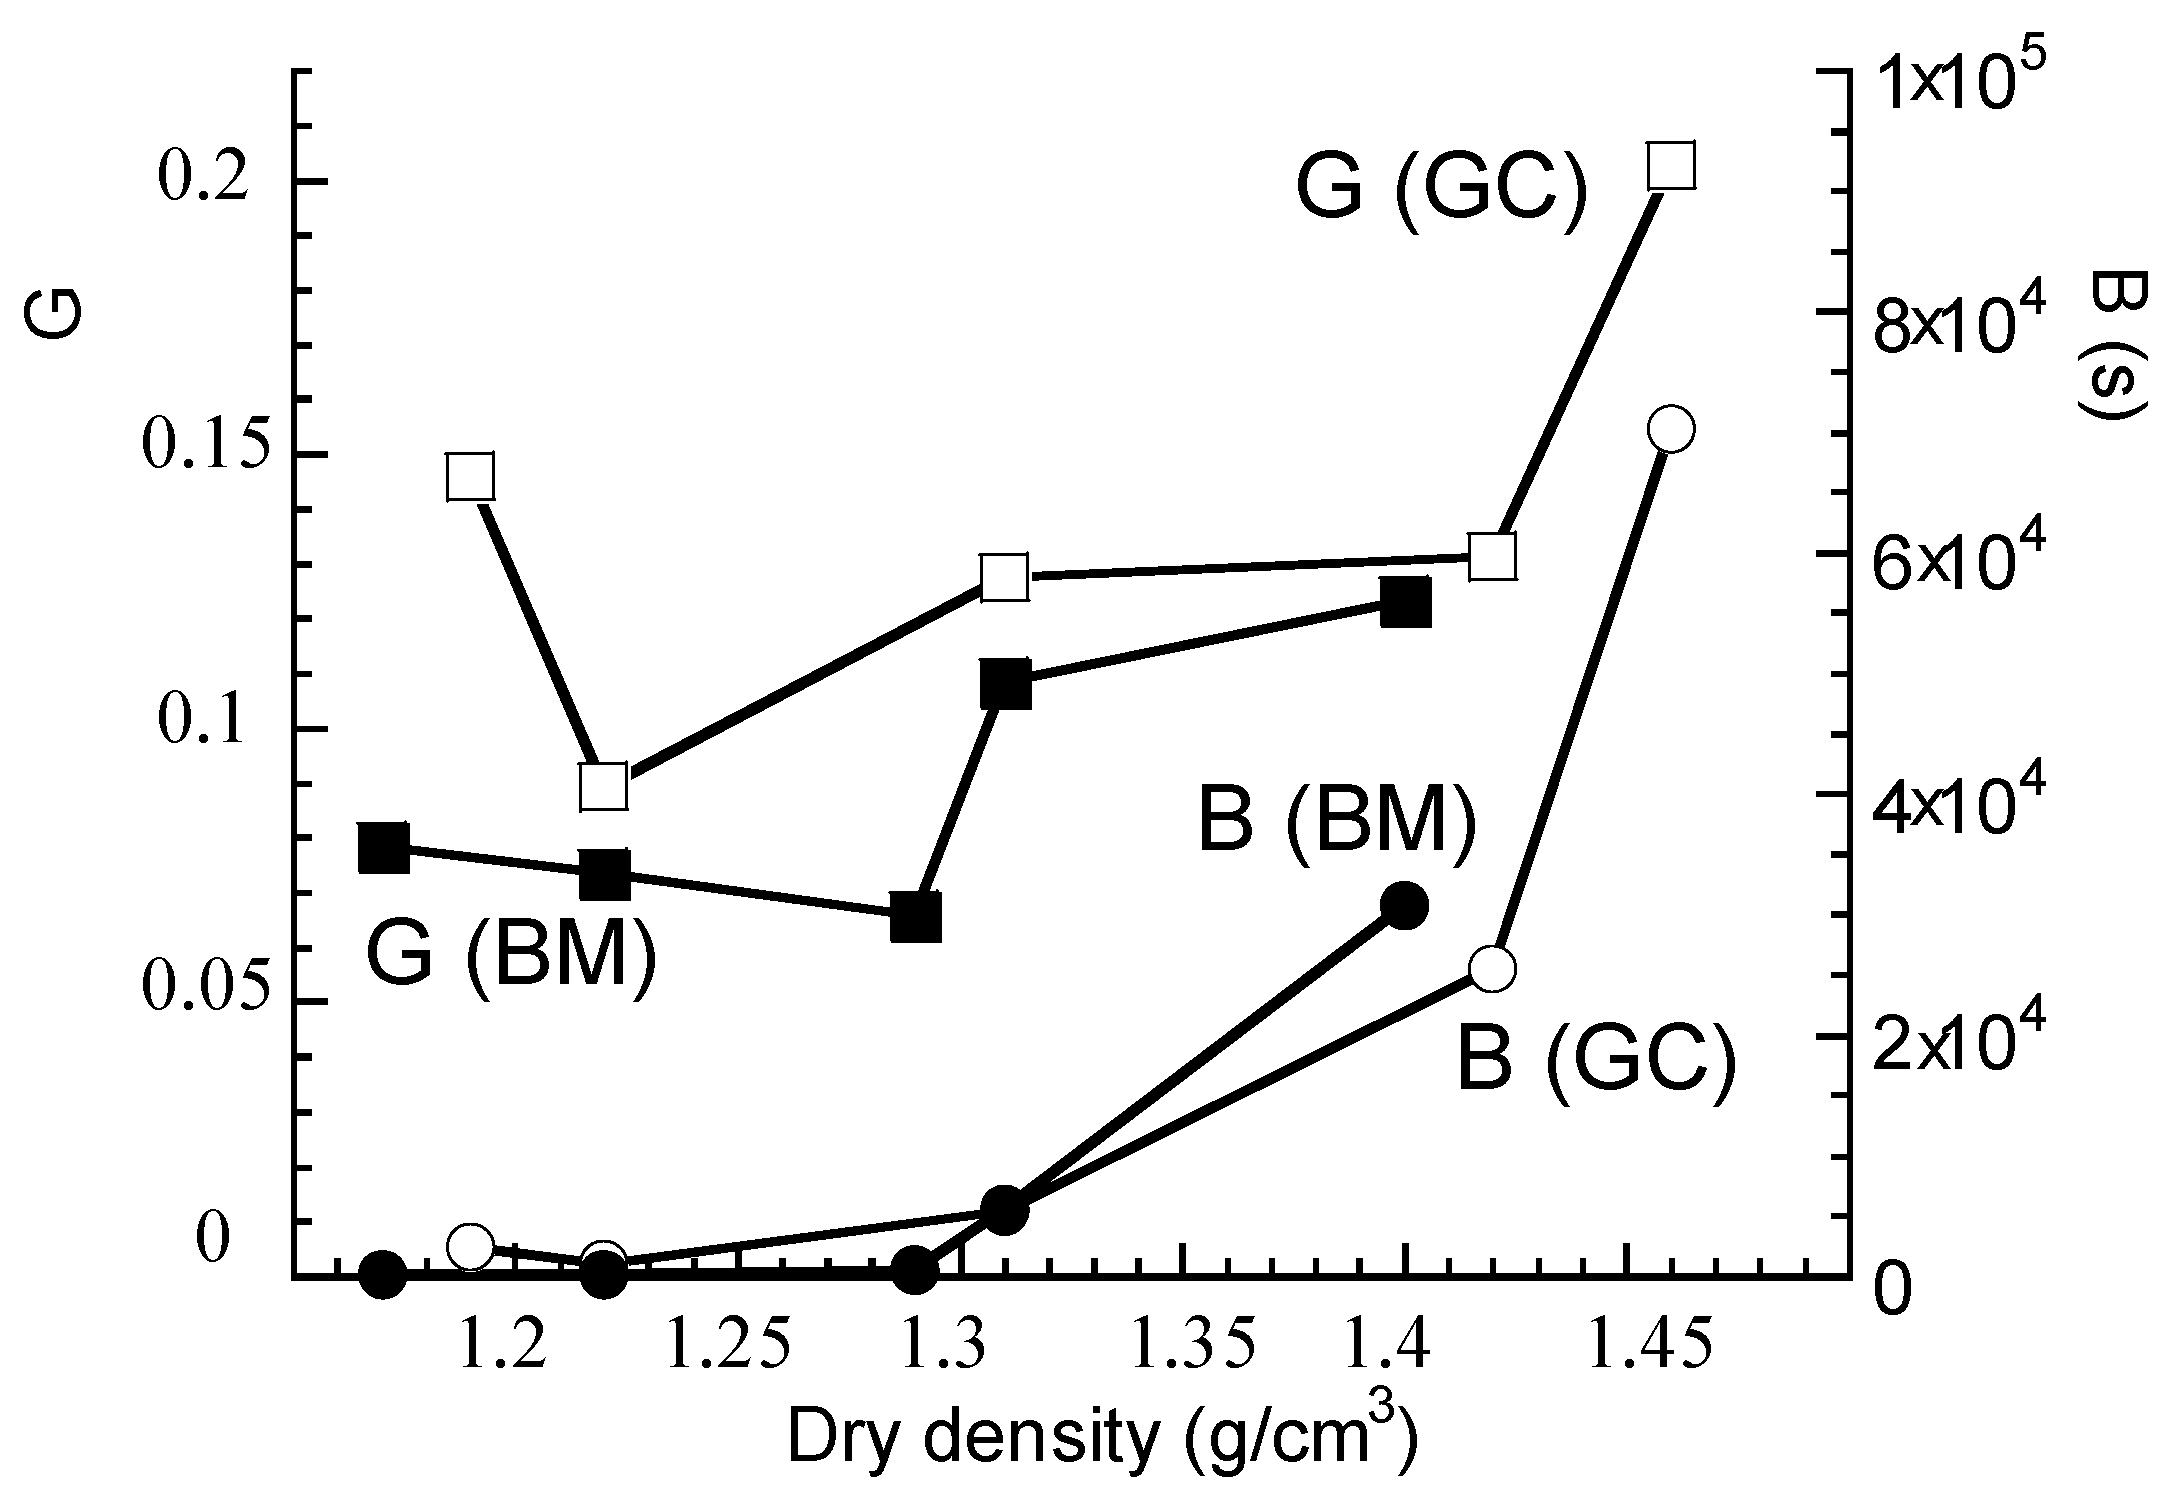
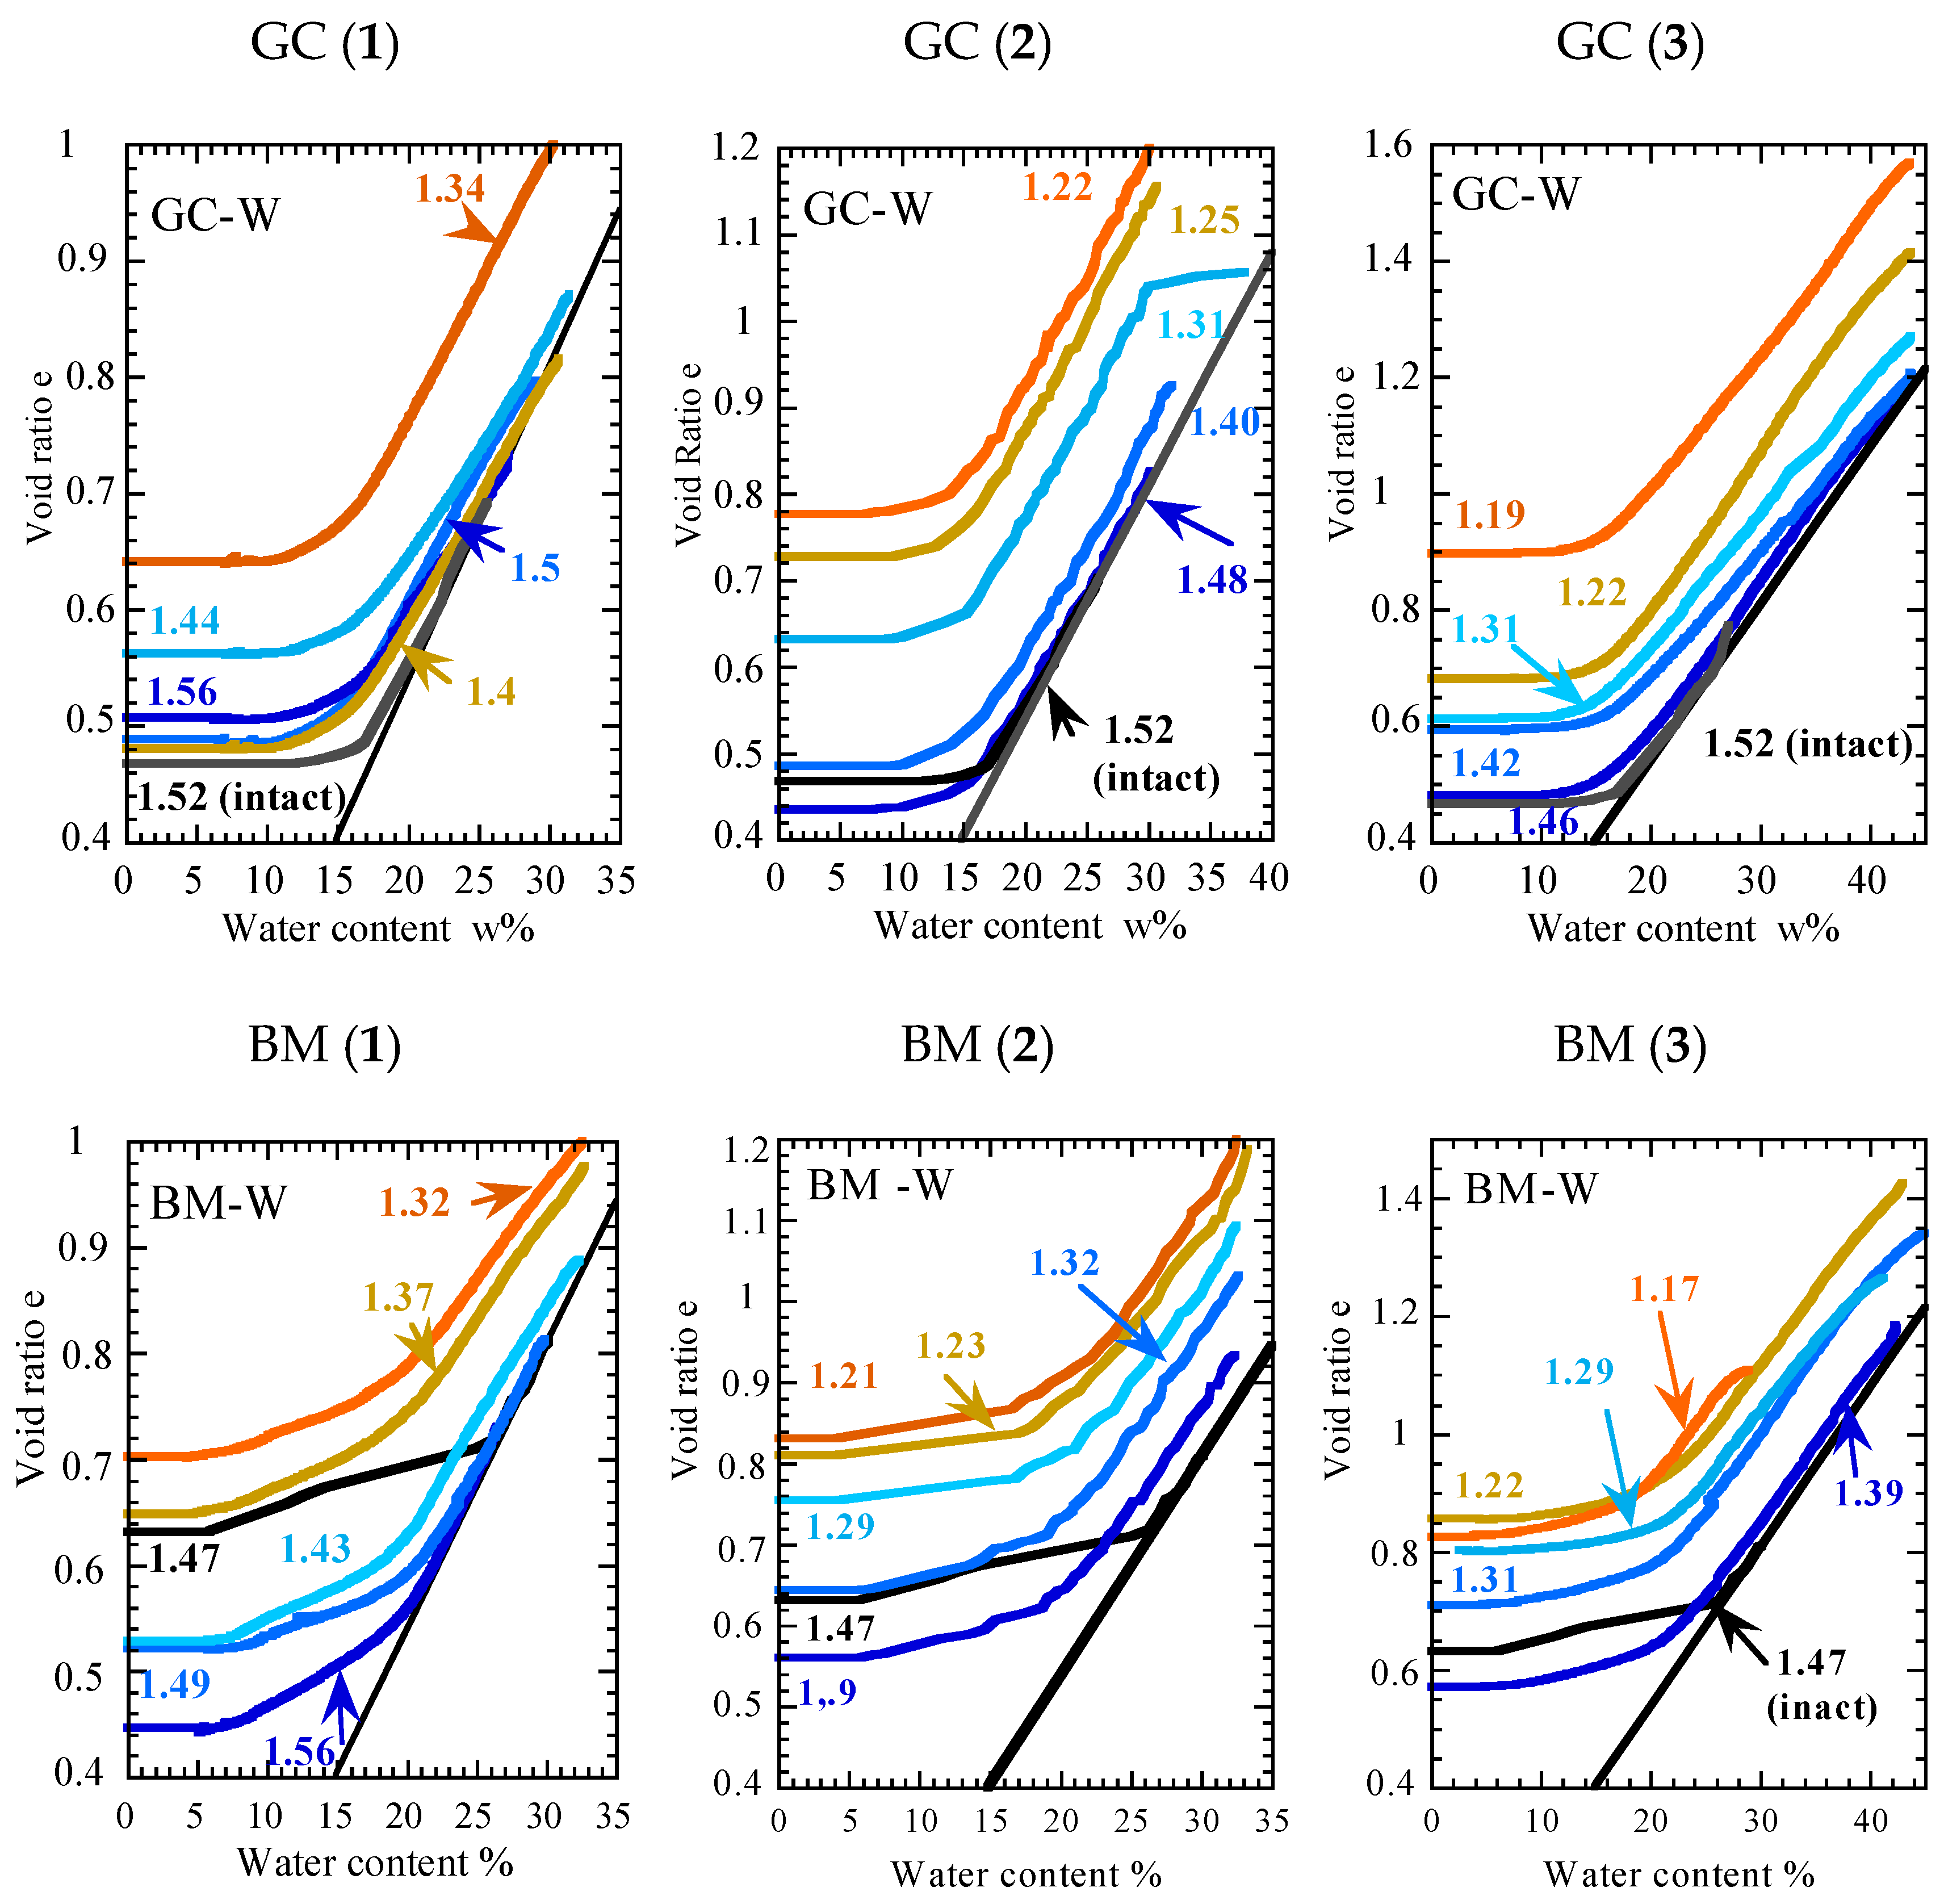
3.1. The Swelling of Statically Compacted W-Disturbed Soils at Various Densities

Since shrinkage may be preceded by a swelling phase, the effect of dry density on the swelling phenomenon was first observed. The usual swelling strain versus time curves, observed in Figure 2, indicate the presence of two phases during the humidification of the soil in the oedometer ring without load (except for the weight of the porous stone and the support of the axial captor positioned at the top of the cylindrical sample). The first swelling phase (up to the inflection point of the curve) is rapid and can be related to a process of water diffusion into the macroporosity [32,33]. The second swelling phase is slower, related to clay hydration at the particle scale, and affects the microporosity. Authors [34,35] proposed to fit the swelling curve versus time with an empirical hyperbolic law (Figure 2(1)) as follows:
d H H 0 = ε s w = G B t
where G is the final swelling amplitude (when equilibrium is reached after a long time), and B is the time to reach half the swelling height compared to the final swelling. From the fitting of the swelling curves and sample characteristics, B can be easily correlated to soil dry density ρd (g/cm3) by exponential Equations (2) and (3).
For GC:
B G C = 7.43 × 10 5 ( e 13.98 ρ d ) with   R = 0.99
For BM:
B B M = 1.33 × 10 10 ( e 23.39 ρ d ) with   R = 0.99
The relationship between G and ρd in Figure 3 shows a decreasing trend as ρd decreases (except for the two lowest densities where an increase in G appears for both BM and GC). The exact behavior remains difficult to estimate given the limited number of swelling tests considered, and the increase in G at low densities needs to be confirmed. Globally, swelling tests confirm the idea that the denser the soil, the higher the B and G values [36]. This means that the low densities favor the rapid filling of macropores, which implies a low value of B, a faster stabilization of the swelling deformation in the long term (related to the time needed to reach a plateau) and a lower amplitude of swelling compared to the denser soils (which is reflected by the decrease in G). These results reflect an amplification of swelling with increasing dry density, which is consistent with other studies [21,37,38].
There are also some differences between clay and marl in terms of swelling amplitude: green clay shows systematically higher volumetric strain than blue marl, even after disturbance and compaction at fairly similar dry densities. The presence of the <0.1 µm pore family in blue marl (associated with carbonate particles) facilitates water entry into the sample, which explains the faster decrease in the B (BM) parameter compared to B (GC) as ρd decreases (Figure 3).

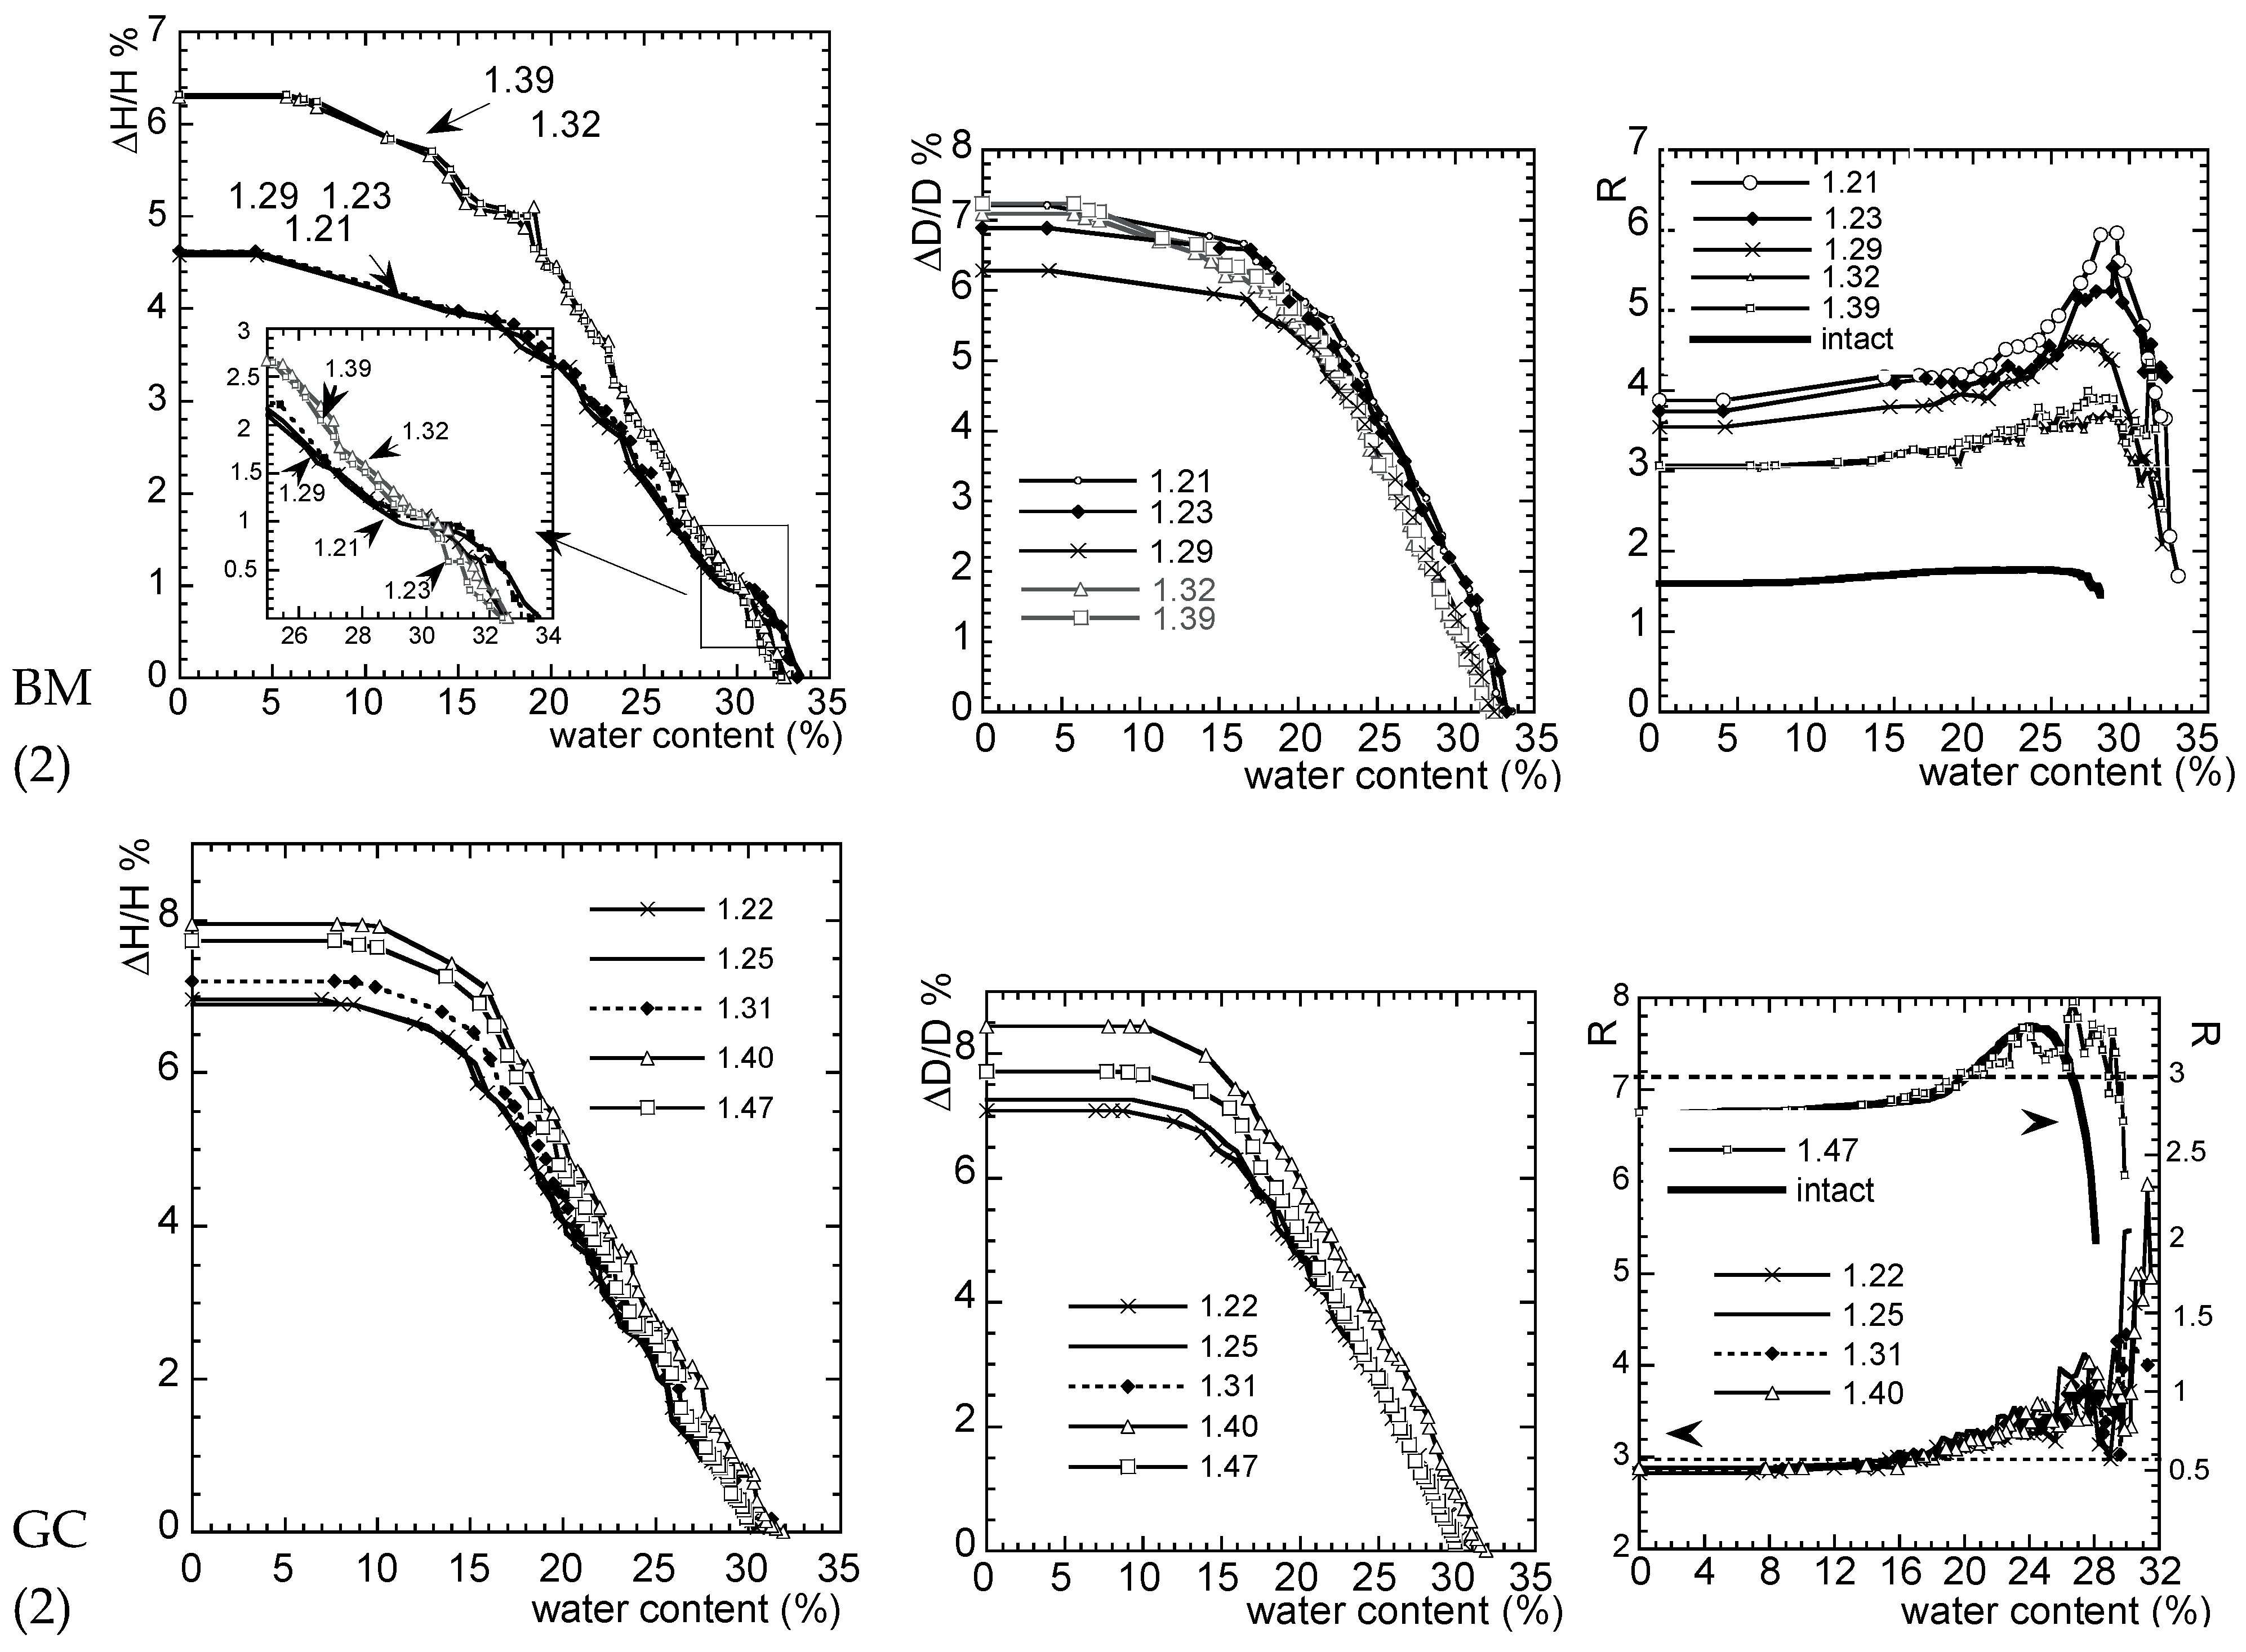
3.2. Effect of the Density on Shrinkage Amplitude Measured on Statically Compacted W-Disturbed Soils (Test Is Preceded or Not by a Free Swelling)

The same typical shrinkage curves (Figure 4) [39,40] are obtained after testing W-disturbed samples statically compacted at different densities (Figure 5). Four zones are generally distinguished: the ‘structural’ shrinkage between wmax and wsw, the ‘normal’ shrinkage between wsw and wa, the residual shrinkage between wa and ws, and the zero shrinkage below ws. ws is the shrinkage limit, i.e., the water content under which drying no longer causes deformation, wa or AEP is the air entry point in micropores, which is the water content at which the micropores in the soil are no longer saturated, wsw is the swelling limit associated with micropores, and wmax is associated with the highest moisture content reached when the macropores are filled (it also corresponds to the air entry point in macropores). An intermediate range could be added between structural and normal shrinkage, corresponding to the end of macro pore drainage. Note that the air entry point wa is associated with the start of micro-pore drainage and corresponds to the first point on the shrinkage curve that no longer follows the saturation line (in the case of a soil without macropores). In presence of macropores, their drainage (before the micropores empty) may cause the soil to become unsaturated before the AEP. In this case, AEP is not positioned on the saturation line, but generally corresponds to the end of the linear part associated with ‘normal’ or ‘proportional’ shrinkage.
The shrinkage curves of disturbed soils compared to intact soils, shown in Figure 5, in e-w% plan, show that the shape of the curves is maintained regardless of the density reached by compaction. The shrinkage curves of W-disturbed GC soils are composed of 2 linear parts and a curvilinear one (as the typical shape previously described). The BM shrinkage curves after disturbance and compaction still have three linear parts with two intermediate curvilinear parts as intact BM soils exhibit. The swelling step before shrinkage seems to make the intermediate linear part partially disappear (especially at low density), suggesting that the microstructure is partially broken by swelling. Indeed, the atypical shape of the shrinkage curves observed on the Argenteuil Blue Marl is hypothetically associated with a particular organization of the carbonate particles (as proof, if the preparation by disturbance cannot completely break the microstructure at particle scale, the dissolution of carbonate with acidic solution makes the intermediate plateau disappear).
Results in Figure 5 also show that the shrinkage limit ws (as defined in the NF P 94-060-2 [41]) does not change when the density of GC or MB W-disturbed samples varies. In fact, the ws (corresponding to the water content at the intersection of the two linear parts of the shrinkage curve) measured on W-BM or W-GC remains equal to 17%, which corresponds to the ws of intact GC soil, but is different from the ws measured on intact BM (ws = 23%). The ‘physical’ shrinkage limit also remains constant around 6–7% when BM-W or intact BM soil are tested; meanwhile, the wS measured on GC-W or intact GC is close to 13%. The high deformability of clayey soil (that may reorganize easily and rapidly when the water content varies) compared with the high structuring of marl, given by the carbonate particles, may explain the difference in behavior between clay and marl. Considering the air entry point (with or without remodeling), the characteristic of intact or W-disturbed GC soils does not change when density varies, while for BM, it varies after remolding from 26.6% to 20% whatever the density varies.
In contrast to intact soils, the shrinkage curves of disturbed soils are gradually shifted away from the saturation line as soil density decreases [42]. However, a distinction can be made between the behavior of initially saturated samples (Figure 5(1)) and initially unsaturated samples (with or without a swelling step prior to shrinkage) (Figure 5(2) or (3)). The ‘normal’ shrinkage is parallel to the saturation line (Figure 5(2) or (3)), indicating that the volume change corresponds to the water loss (during drying, the soil is able to reorganize itself to keep the microporosity saturated). The ‘structural’ shrinkage is not plotted in Figure 5(2,3) as GC and BM samples were not prepared at 100% saturation. Inter-aggregate pores (macroporosity) or inter-block pores (ultra-macroporosity) are unsaturated before the beginning of the shrinkage test (water in such a pore can be assimilated to gravitational water, which can flow freely out of the sample as it shrinks with block reorganization). During normal shrinkage, intra-aggregate pores remain saturated, then they are drained as well as a fraction of the nanopores [43,44]. Thus, there are two air entry points (AEP and wmax correspond to the onset of micropore and macropore emptying, respectively).
Such behavior agrees with a two-dimensional porosity description with micro- and macropores, as proposed by [33]. The PSD measurements in Figure 6 confirm that disturbed soils are characterized by a bi-modal porosity [45] with a larger proportion of macropores >1 µm at low density. The pores with a pore diameter over 100 µm are assimilated to ultra-macropores (spaces between blocks of soil (composed by aggregates of particles) and formed during the initial grinding of dried soil). The size of the micropore family < 1 µm (within aggregates) in GC-W does not seem to be affected by compaction contrary to BM-W (2) and (3), as stared before. The average size of the micropores in disturbed BM samples prepared in the initial unsaturated state varies in density from 0.05 µm to 0.1 µm. In terms of pore quantity, the macropore fraction for GC and BM (ranging from 10 µm to 100 µm) increases with decreasing density. In both cases, the micropores < 0.1 µm seem to be more abundant in intact soils than in disturbed ones at the end of the shrinkage. The nanopores represented by the <5 nm pore fraction in the n/ntot graph in Figure 6 seem to decrease with soil disturbance, especially for GC (1) and BM (1). The nanopore fraction represents the percentage that reaches 100% on the n/ntot curves (the total porosity ntot is estimated from the void ratio e, calculated from the displacement and weight measurement during the shrinkage test). However, the n/ntot curves can be distorted because, at low densities, the ultra-macroporosity (not measured by mercury intrusion but taken into account in the void ratio measurement) can contribute to the apparent decrease in nanopore fraction. Therefore, the nanopore variation needs to be confirmed, as micro- or nanopores were previously considered to be unaffected by compaction.
Contrary to Figure 5(2,3), where normal shrinkage is strictly parallel to the saturation line (the water loss corresponds to the change in soil volume, causing particle reorganization), normal shrinkage in Figure 5(1) is not parallel. The soil volume changes at the beginning of the drying are lower than expected. The slope of the normal shrinkage (also called ‘proportional’) may be explained by considering a parameter linked to the soil rigidity. The deformation from structural and normal shrinkage occurs simultaneously (even though this is contrary to the well-established idea that macropores are drained before micropores, according to thermodynamic considerations). The modelling of the shrinkage curves in the e-w plan, using one of the models proposed in the literature [45], can be applied to complete the description of the soil microstructure. In fact, the macropore volume can be calculated from the shift in the normal shrinkage and the micropore volume from the residual shrinkage.
On the Figure 5, the initial void ratio for each curve, and the final void ratio corresponding to zero water content were positioned. Pairs of points were plotted in Figure 7, versus the dry density of each tested sample. The slopes of the linear fit are given in Table 2. The slope corresponding to the shrunken state is lower than the slope of the line supporting the points at initial water content, except for BM (2) or GC (2).
This result confirm the idea that the densest soils have the lowest shrinkage amplitude, as demonstrated on samples with a wide range of dynamically compacted dry densities [14]. Regarding the atypical behavior of BM (2) or GC (2) showing samples with the lowest densities that seemed to have the lowest shrinkage strain, an explanation was researched. The preparation noted (2) could be at the origin of this behavior, but other physical explanations need to be explored. First, the position of each curve was assumed to be exact, with no error bars on the measurements. Curves show a significant evolution, but in repeatability tests, the results may punctually differ from others considering the following:
  • a variability in the local composition of the sample (in particular, the calcium carbonate content of marl samples—the material may come from different natural blocks extracted from the quarry);
  • a variability in the preparation by the manipulator during the step of manual mixing in the hermetic bag before compaction or during the compaction step (i.e., the way to filling the oedometer ring…), or a variability in the particle size distribution of the ground soil after drying.
Such ‘uncontrolled’ parameters may explain why isolated curves behave atypically (e.g., in Figure 5, the curve GC (1) with ρd = 1.4 g/cm3), especially as the range of the dry density studied is relatively limited (from 1.3 to 1.56 g/cm3 for static compaction). Densities higher than the intact soil density (its characteristic point is positioned on the saturation line in Figure 1) could not be achieved considering the nature of the soil, the fixed moisture content and the available compaction energy.
The low densities are also limited by the inability to manipulate too loose structures that may disaggregate (see Figure 8). The ‘uncontrolled’ variability of the results, and the fitting method by averaging the position of the points, may explain why some slopes increase instead of decreasing. However, the different behavior of BM (2) or GC (2) (never mentioned in the literature) could also be linked to a specific effect of the static compaction mode on the soil microstructure. This effect is, however, erased by the swelling step, considering that the GC (3) and BM (3) curves are not affected, or by a preparation in the saturated state (the water content is known to be an impacting parameter on the compaction efficiency and on pore size distribution). Static compaction may induce a gradient of density in the sample, especially as the sample height increases. Density heterogeneity could play a role, as well as the development of macroporosity (1–100 µm) and ultra-macroporosity (>100 µm between blocks). Such pore volumes are not measured but observed macroscopically (Figure 8).
A gradual loss of contact between blocks of soil may result in a discontinuous matrix at the lowest density. Each block may then shrink individually as intact soil, but the total sample volume will not decrease in a similar proportion considering the loss of contact points between blocks, as it can appear when a crack network develops [46]. Even if cracks are not clearly visible on the sample surface at the end of the shrinkage test, the calculation of ∆D/D0 and ∆H/H0 ratios and the ratio R, which corresponds to (∆V/V0)/(∆H/H0) (Figure 9), can help to detect the occurrence of cracks. Regarding the behavior of W-MB (2), when ∆D/D0 varies slightly with density, ∆H/H0 clearly evolves. The presence, at the low density of a step on ∆H/H0 curves, of W-BM (2) samples could be interpreted as the opening of horizontal cracks or a loss of contact between blocks in the compaction direction. The presence of the step induces a decrease in the shrinkage amplitude instead of an increase, as expected at low soil density.
The ratio R for W-BM (2) also indicates that the anisotropic shrinkage of intact marl is modified after disturbance. The anisotropy results from not only sedimentation by the deposition of oriented clay layers combined with carbonate particles (the orientation disappears during disturbance), but also from compaction. At high density, the ratio R tends to be 3 at zero water content, indicating isotropic behavior, while at low density, R reaches 4, considering the measurement of low ∆H/H0 values (in relation with, hypothetically, the cracks opening). In the case of the denser soil, no cracks seem to develop. Furthermore, the compaction effect on the soil produces an orientation of the microstructural units, favoring an increase in ∆H/H0, which balances the density effect, that is to say, the decrease in pore size in favor of a smaller amplitude of shrinkage. In other terms, the static compaction of the soil at high densities induces a large orientation of particles or aggregates parallel to each other in the soil, which becomes a “continuous” matrix without ultra-macroporosity. By increasing the degree of orientation, the amplitude of shrinkage is increased, even if the global void ratio decreases. Such an explanation can be used to understand why ∆H/H0 or ∆D/D0 (Figure 9), measured on W-GC (2) at high densities, seems to indicate that the high densities are in favor of high shrinkage amplitude. The ratio R (around 3) indicates that the shrinkage strain of intact or disturbed green clay remains isotropic as the water content tends to zero. At the beginning of drying, the shrinkage is not isotropic for either GC or BM. Globally, after a few points, ∆V/V0 for W-BM (2) or dense W-GC-disturbed soil or GC-intact soil becomes higher than 3∆H/H0, which means that the deformation occurs essentially in the direction of compaction (artificial compaction in the laboratory or a natural one during diagenesis on site).

3.3. Effect of the Density on Shrinkage Amplitude on Dynamically Compacted W- or C-Disturbed Soils (Test Is Preceded by a Free Swelling)

W-disturbed BM and GC soils noted (4) in Table 2 were prepared by dynamic compaction at different initial densities. Each set of densities was obtained for two initial water contents. A free-swelling test was carried out in an oedometric cell followed by a free volumetric shrinkage test (the sample weight and dimensions were manually reported at the beginning and at the end of the test). The results shown in Figure 10 relate the air index noted eair,i (i for initial state) and the total void ratio e (Equation (4)) [47]. The air index is the ratio of the volume of air in the sample (Va) to the volume of solid particles (Vs)
e a i r = V a V s = V t o t m d r y ρ s + m w ρ w m d r y ρ s
where ρs = 2.7 g/cm3 and ρw = 1 g/cm3, mdry is the mass of the sample after drying at 105 °C, mw is the mass of water in the sample, and Vtot is the total volume of the sample. Such a representation allows for the identification of soil structures with similar e (linked to the density) but with different saturation states. It allows for testing the effect of initial water contents on swelling–shrinkage tests applied on compacted samples.
The variation of the void ratio e (associated with the strain amplitude) from the initial state to the shrunken state, preceded by a swelling step, on W- and C-disturbed soils in Figure 10 demonstrates that the relationship between eair, i and e is linear and that the slopes of the lines representing the initial states at different water content are parallel and equal to 1 according to Equation (5).
e 0 = e i , a i r + V w , i V s
The points associated with the initial states of the W- and C-disturbed samples are aligned with a shift of the W-disturbed GC and the C- disturbed BM points towards lower densities, i.e., towards the higher value of eair,i. This confirms that the way of disturbance impacting on microstructure affects differently the compactness and the arrangement of the particles of marl and clay during dynamic compaction (the same range of compactive energy was applied to the prepared W-GC (4) or W-BM (4) samples). The W-disturbed GC soil (or C-disturbed BM soil) has a higher resistance to compaction than the C-disturbed GC soil (respectively, W-disturbed BM soil). Note that the initial water content (27% or 30%) has almost no impact on the final state of swelling (nor on the final state of shrinkage).
After swelling, the GC samples reached a gently sloping (slope ≤ 1) common line compared to the aligned initial point, indicating the existence of a common ‘swelling limit’, whatever the type of soil disturbance. The slope slightly less than 1 confirms the idea that the denser the soil is, the higher the swelling amplitude (as observed for statically compacted samples in Figure 10). Even though the carbonate content of the BM sample is different from that of the GC sample, the swelling limit of GC and BM are close in the eair,i—e diagram, which does not agree with previous results on statically compacted samples showing a large difference in swelling amplitude between clay and marl. Hypothetically, the presence of water during swelling, acting as a separator of carbonate particles until they are no longer in contact, could lower the soil friction angle; then, the behavior of marl and clay (with similar clay mineralogy) becomes close during swelling. However, such a hypothesis cannot explain why statically compacted samples behave differently from dynamically compacted ones. On the contrary, the presence of carbonates and cementation in marl may lead to an increase in the friction angle during shrinkage, which explains the clay and marl differences if you consider the shrunken state. Indeed, at the end of the shrinkage after the swelling, final points for GC and BM soils are still aligned, but not on a common line. GC samples reach lower values of void ratio than BM samples (carbonates prevent soil from settlement). Furthermore, aligned points are clearly and systematically not parallel to the lines characterizing the initial state. The slopes (<1) of the fitted lines corresponding to shrunken states indicate that soils with the highest densities (the lowest eair, i) produce the lowest deformation. It is to be noted that if the swelling limit is slightly affected by the preparation mode (W or C), the swelling step before shrinkage seems to suppress the preparation effect on sample drying (above all, for GC) while direct shrinkage remains affected by the preparation mode.
Furthermore, from the behavior of dynamically compacted samples in the eair,i—e diagram, extrapolation to intact soil seems to be possible for clay and marl. Extrapolation of the void ratio is represented by dashed lines in Figure 10 where the positions of experimental measurements on intact soils were noted for comparison. The initial void ratio of the intact soils can be estimated accurately from the measurement of the dried mass, initial volume and initial water content, and from tests on the disturbed samples prepared with the same initial water content but at different densities (Equations (4) and (5) can also be used). Knowing eair,i on intact soil, the void ratio after direct shrinkage on GC or BM intact soils can be estimated from the swelling–shrinkage extrapolation (the C-preparation gives better results for BM soil) while the swelling is estimated with lower accuracy (especially for GC soil). When intact soils are not available, the results demonstrate that disturbed soils can be used to estimate the shrinkage behavior. This method of extrapolation seems to give more interesting results compared with the testing of W- or C-disturbed samples prepared in a similar state to intact soil.
Finally, the behavior of dynamically compacted BM or GC samples after shrinkage in Figure 10 can be more clearly represented in Figure 7 in ρd-e plan. The difference between statically and dynamically compacted soils could not be explained by the characterization of microstructure. No specific effect of the compaction mode on soil organization was observed and quantified on the GC or MB samples from environmental SEM images, whereas [48] observed a modification in the particle arrangement when the compaction mode varied from static to dynamic compaction.
More accurate observations and quantitative measurements will be required to discriminate the structural effect of the compaction mode. The results in Figure 6 also confirm that, as expected from the theory, the density is in favor of a decrease in the shrinkage amplitude (the effect of the density on BM shrinkage is not as marked compared with GC shrinkage, considering the role of carbonates). These results were obtained on only two materials and a limited range of dry densities. For a given eo (the initial void ratio of the soil depends on the dry density and the initial water content), each symbol corresponds to a swelling test (when ∆e > 0) or a shrinkage test (when ∆e < 0). The data agree with the collected results; samples with low dry density (e0 > 1) or high water content do not swell, and shrinkage is the main phenomenon that may impact these soils [49]. Conversely, the highly compacted materials do not shrink (or have low shrinkage) but also have a low swelling amplitude. The fact that high-density soils are usually associated with highly carbonated marl (with a rigid skeleton) can explain this behavior. All soil characteristics are almost always correlated and carbonates generally favor soil compactness, making it denser.

4. Conclusions

In practice, the shrinkage or swelling amplitude of soils, related to the void ratio variation and used for foundation design, depends on several parameters such as the carbonate content of the soil and more generally its mineral composition especially the clay fraction and its nature. Parallel to mineralogy, the soil microstructure impacted by disturbance, the soil density or the soil anisotropy play also a determining role. The difficulty in finding a series of different intact soils where only one property (such as density) varies naturally from one to another compelled to study disturbed soils. The results of this paper should provide elements for a better understanding of the behavior of intact and disturbed soils, which influence engineering practices for geotechnical studies and infrastructure design. The following points were demonstrated:
  • The dry density remains a major parameter that governs the swelling–shrinkage behavior of the soil. The denser the soil is (the soil is characterized by a low void ratio or by low initial water content), the lower the amplitude of shrinkage, and the higher the swelling amplitude appears. On the contrary, looser soils (above all those combined with high-moisture content) favor a high shrinkage strain amplitude, while the swelling deformation decreases (as swelling clay may expand into the soil porosity without modifying the whole sample volume). However, some data sets may not follow this trend and their behavior (even if an explanation may be found) needs to be confirmed by testing other soils. In all cases, dry density should be taken into account in the swelling–shrinkage soil classification;
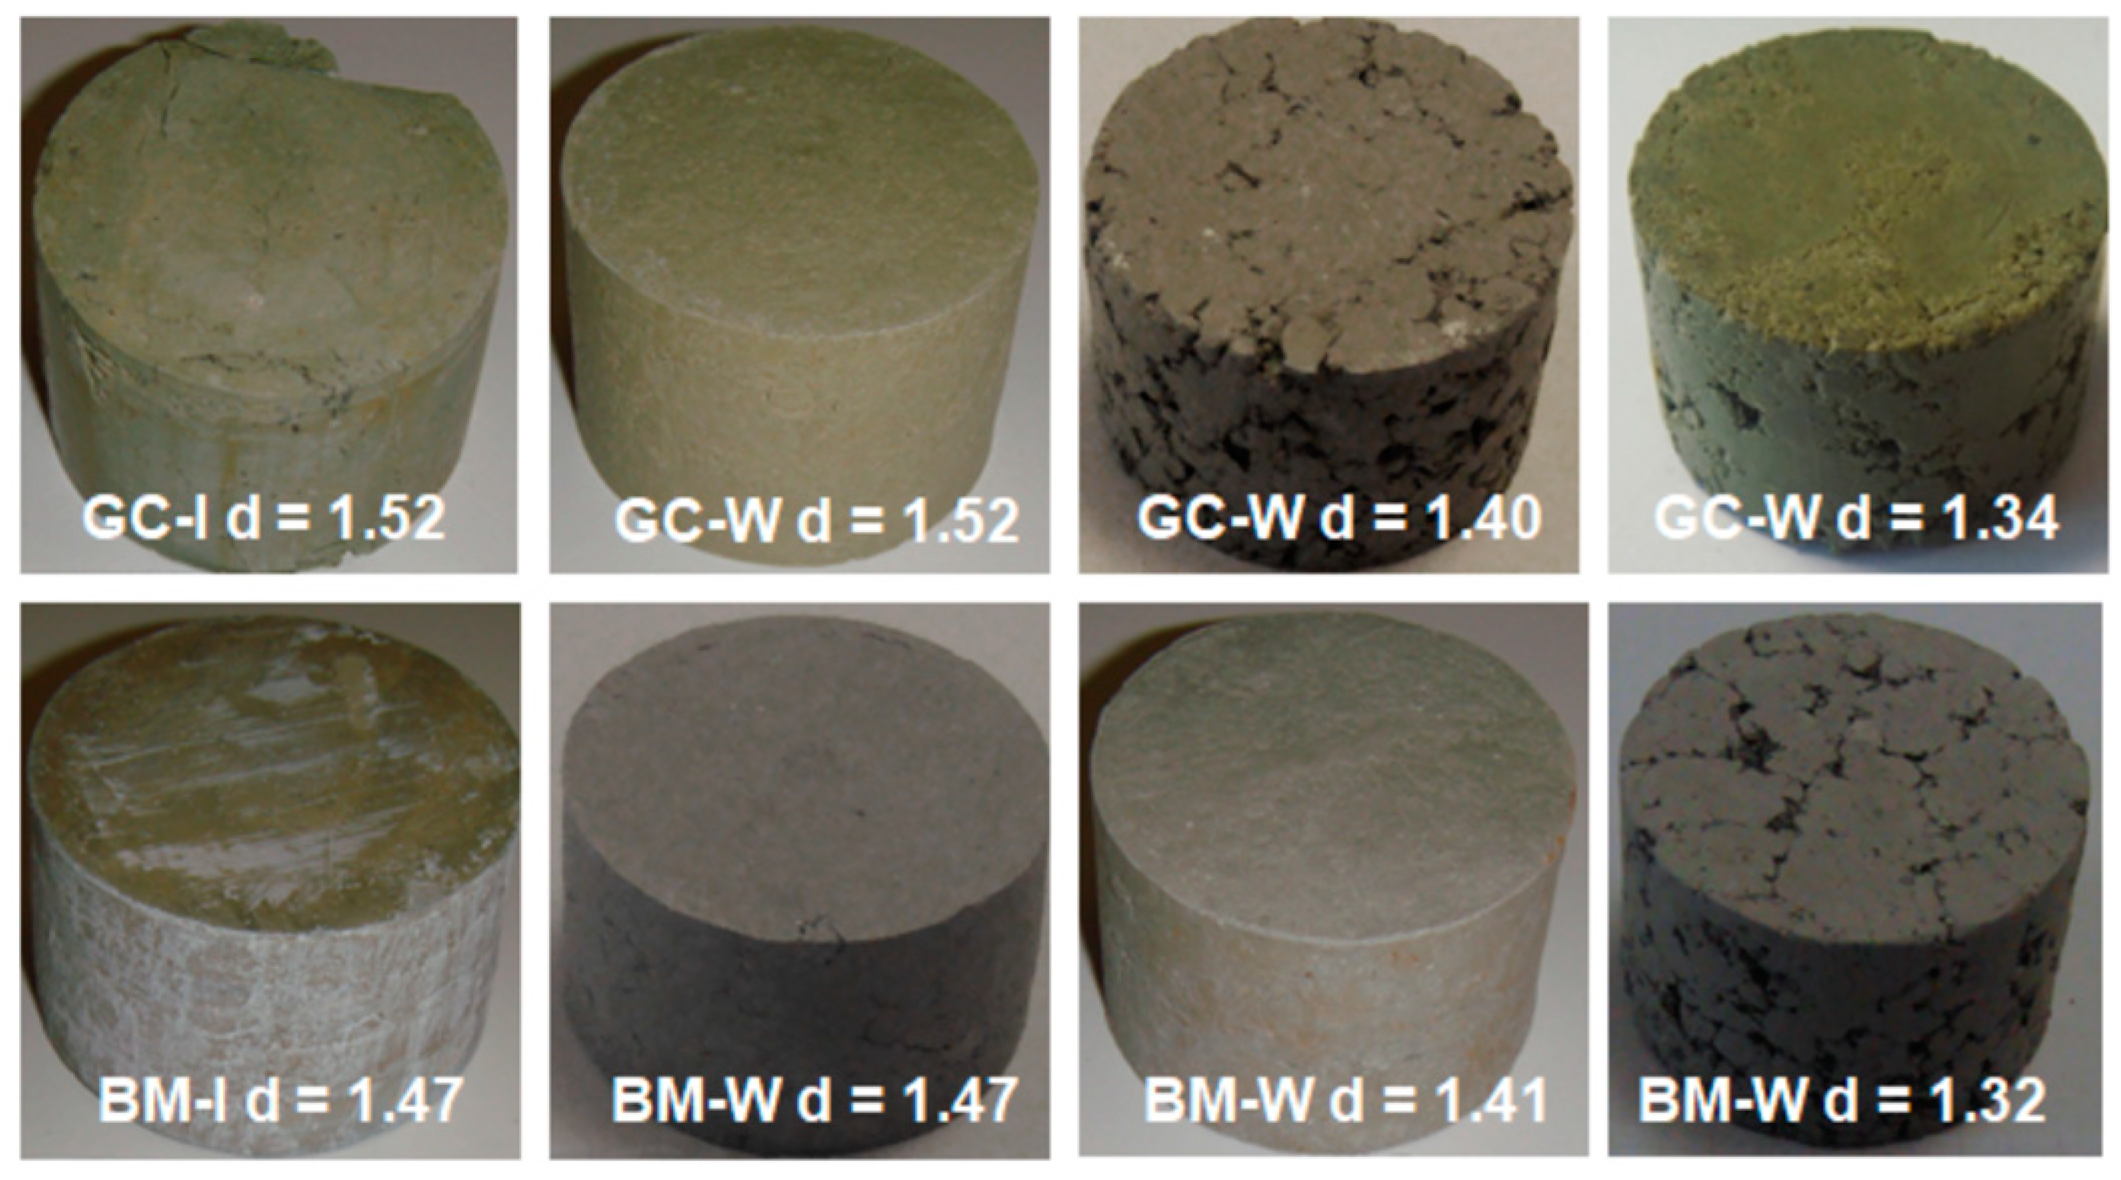
  • The study of intact soils is recommended, especially when the material is characterized by a cemented microstructure, as in the presence of carbonates in marl. Nevertheless, the work on disturbed samples in this paper demonstrated that the shrinkage behavior of intact soils can be obtained from the testing of disturbed soils (extrapolation of swelling behavior gives results with poor accuracy). This is an interesting element to consider in order to develop a methodology for predicting the behavior of intact soils when the direct testing of undisturbed soils is not possible;
  • The mode of compaction (static or dynamic) clearly has an effect on the amplitude of swelling–shrinkage (for similar dry density). Further study at microscale will need to distinguish the soil microstructure responsible for the observed behavior;
  • The results indicate also that conducting a swelling test on W-disturbed samples and a shrinkage test on C-disturbed samples allows us to assess more closely the behavior of intact soil samples. Finally, in situations where working with undisturbed soils is not feasible or too costly, disturbed samples can be used.

Author Contributions

Conceptualization; L.M. and M.D.; Methodology; L.M. and M.D; Formal analysis; L.M., M.D. and F.S.; Draft preparation; L.M. and T.C.; Validation; M.D. and F.S. All authors have read and agreed to the published version of the manuscript.

Funding

This research received no external funding.

Data Availability Statement

The original contributions presented in the study are included in the article, further inquiries can be directed to the corresponding authors.

Conflicts of Interest

The authors declare no conflict of interest.

References

  1. Holtz Wesley, G.; Gibbs Harold, J. Engineering Properties of Expansive Clays. Trans. Am. Soc. Civ. Eng. 1956, 121, 641–663. [Google Scholar] [CrossRef]
  2. Seed, H.B.; Woodward Richard, J.; Lundgren, R. Prediction of Swelling Potential for Compacted Clays. J. Soil Mech. Found. Div. 1962, 88, 53–87. [Google Scholar] [CrossRef]
  3. Gromko Gerald, J. Review of Expansive Soils. J. Geotech. Eng. Div. 1974, 100, 667–687. [Google Scholar] [CrossRef]
  4. Djeran-Maigre, I.; Tessier, D.; Grunberger, D. Importance de La Nature Minéralogique et de La Texture Des Argiles Dans Leur Comportement Mécanique et Hydraulique. In Proceedings of the Colloque Magi, Nancy, France, 21–22 September 1998; pp. 87–92. [Google Scholar]
  5. Al-Shayea, N.A. The Combined Effect of Clay and Moisture Content on the Behavior of Remolded Unsaturated Soils. Eng. Geol. 2001, 62, 319–342. [Google Scholar] [CrossRef]
  6. Mitchell James, K.; Hooper Don, R.; Campenella Richard, G. Permeability of Compacted Clay. J. Soil Mech. Found. Div. 1965, 91, 41–65. [Google Scholar] [CrossRef]
  7. Christodoulias, J. Engineering Properties and Shrinkage Limit of Swelling Soils in Greece. J. Earth Sci. Clim. Chang. 2015, 6, 279. [Google Scholar]
  8. Delage, P.; Audiguier, M.; Cui, Y.-J.; Howat, M.D. Microstructure of a Compacted Silt. Can. Geotech. J. 1996, 33, 150–158. [Google Scholar] [CrossRef]
  9. Audiguier, M.; Geremew, Z.; Laribi, S.; Cojean, R. Caractérisation Au Laboratoire de La Sensibilité Au Retrait-Gonflement Des Sols Argileux. Rev. Fr. Géotech. 2007, 120–121, 67–82. [Google Scholar] [CrossRef]
  10. Diamond, S. Pore Size Distributions in Clays. Clays Clay Miner. 1970, 18, 7–23. [Google Scholar] [CrossRef]
  11. Sridharan, A.; Altschaefflf, A.; Diamond, S. Pore Size Distribution Studies. J. Soil Mech. Found. Div. 1971, 97, 771–787. [Google Scholar] [CrossRef]
  12. Delage, P.; Lefebvre, G. Study of the Structure of the Sensitive Champlain Clay and of Its Evolution during Consolidation. Can. Geotech. J. 1984, 21, 21–35. [Google Scholar] [CrossRef]
  13. Kouassi, P.; Poulin, D.; Girard, H.; Breysse, D. Etude Comparative de Différentes Méthodes de Compactage Par Pétrissage En Laboratoire: Application Au Limon de Xeuilley. In Proceedings of the Magi’50, Nancy, France, 21–22 September 1998; pp. 191–196. [Google Scholar]
  14. Albrecht Brian, A.; Benson Craig, H. Effect of Desiccation on Compacted Natural Clays. J. Geotech. Geoenviron. Eng. 2001, 127, 67–75. [Google Scholar] [CrossRef]
  15. Jain, A.K.; Punmia, B.C.; Jain, E.A.K. Soil Mechanics and Foundations; Laxmi Publications: New Delhi, India, 2005. [Google Scholar]
  16. Villar, M.V.; Lloret, A. Influence of Dry Density and Water Content on the Swelling of a Compacted Bentonite. Appl. Clay Sci. 2008, 39, 38–49. [Google Scholar] [CrossRef]
  17. Dejong, E.D.; Warkentin, B.P. Shrinkage of Soil Samples with Varying Clay Concentration. Can. Geotech. J. 1965, 2, 16–22. [Google Scholar] [CrossRef]
  18. Kleppe, J.; Olson, R.E. Desiccation Cracking of Soil Barriers; ASTM: Philadelphia, PA, USA, 1985; pp. 263–275. [Google Scholar]
  19. Daniel David, E.; Wu, Y.-K. Compacted Clay Liners and Covers for Arid Sites. J. Geotech. Eng. 1993, 119, 223–237. [Google Scholar] [CrossRef]
  20. Komine, H.; Ogata, N. Experimental Study on Swelling Characteristics of Sand-Bentonite Mixture for Nuclear Waste Disposal. Soils Found. 1999, 39, 83–97. [Google Scholar] [CrossRef] [PubMed]
  21. Mrad, M. Modelling the Hydromechanical Behavior of Swelling Unsaturated Soils. Ph.D. Thesis, Institut National Polytechnique, Nancy, France, 2005. [Google Scholar]
  22. Louafi, B.; Dafalla, M. Moisture and Dry Density Influence on Compacted Clay and Clay-Sand Mixtures. Rev. Compos. Matériaux Avancés 2022, 32, 33. [Google Scholar] [CrossRef]
  23. Hamilton, J.J. Foundations on Swelling or Shrinking Subsoils; Canadian Building Digest; no. CBD-184; National Research Council: Ottawa, ON, Canada, 1977. [Google Scholar] [CrossRef]
  24. Subba Rao, K.S. Swell-shrink behaviour of expansive soils-geotechnical challenges. Indian Geotech. J. 2000, 30, 1–68. [Google Scholar]
  25. Gharsalli, J.; Mzali, H. Hazard susceptibility related to clay shrinkage–swelling phenomena in north-eastern Tunisia (Grombalia area). Model. Earth Syst. Environ. 2017, 3, 963–976. [Google Scholar] [CrossRef]
  26. Li, Z.S.; Benchouk, A.; Derfouf, F.E.M.; Abou-Bekr, N.; Taibi, S.; Souli, H.; Fleureau, J.M. Global representation of the drying–wetting curves of four engineering soils: Experiments and correlations. Acta Geotech. 2018, 13, 51–71. [Google Scholar] [CrossRef]
  27. NF P 94-093; Sols: Reconnaissance et Essais—Détermination Des Références de Compactage d’un Matériau Essai Proctor Normal. Essai Proctor Modifié, AFNOR: Paris, France, 2014.
  28. Ferber, V.; Auriol, J.-C.; Cui, Y.-J.; Magnan, J.-P. Wetting-Induced Volume Changes in Compacted Silty Clays and High-Plasticity Clays. Can. Geotech. J. 2008, 45, 252–265. [Google Scholar] [CrossRef]
  29. ASTM D 4546-03; Standard Test Methods for One-Dimensional Swell or Settlement Potential of Cohesive Soils. ASTM International: West Conshohocken, PA, USA, 2003.
  30. AS 1289.7.1.1; Method of Testing Soils for Engineering Purpose. Standards Australia: Sydney, Australia, 2003.
  31. Alonso, E.E.; Lloret, A.; Gens, A.; Battle, F. A New Approach for the Prediction of Long Term Heave. In Proceedings of the Congrès International de Mécanique des sols et des Travaux de Fondations, Rio de Janeiro, Brazil, 13 August 1989; Volume 1, pp. 571–574. [Google Scholar]
  32. Alonso, E.E.; Lloret, A.; Gens, A. Double Structure Model for the Prediction of Long Term Movements in Expansive Materials. In Geomechanics; Beer, G., Booker, J.R., Carter, J.P., Eds.; Balkema: Rotterdam, The Netherlands, 1991; Volume 1, pp. 541–548. [Google Scholar]
  33. Parcevaux, P. Etude Microscopique et Macroscopique Du Gonflement de Sols Argileux; Université de Paris VI/Ecole Nationale Supérieure des Mines de Paris: Paris, France, 1980. [Google Scholar]
  34. Sridharan, A.; Rao, A.; Puvvadi, S. Swelling Pressure of Clays. Geotech. Test. J. 1986, 9, 24–33. [Google Scholar] [CrossRef]
  35. Chaney, R.; Demars, K.; Rao, K.; Rao, S.; Gangadhara, S. Swelling Behavior of a Desiccated Clay. Geotech. Test. J. 2000, 23, 193–198. [Google Scholar] [CrossRef]
  36. Mollins, L.H. The Design of Bentonite-Sand Mixtures. Doctoral Dissertation, University of Leeds, Leeds, UK, 1996. [Google Scholar]
  37. Rao, A.S.; Phanikumar, B.R.; Sharma, R.S. Prediction of Swelling Characteristics of Remoulded and Compacted Expansive Soils Using Free Swell Index. Q. J. Eng. Geol. Hydrogeol. 2004, 37, 217–226. [Google Scholar] [CrossRef]
  38. Tripathy, S.; Rao, K.S.; Fredlund, D.G. Water Content—Void Ratio Swell-Shrink Paths of Compacted Expansive Soils. Can. Geotech. J. 2002, 39, 938–959. [Google Scholar] [CrossRef]
  39. Cornelis, W.M.; Corluy, J.; Medina, H.; Díaz, J.; Hartmann, R.; Van Meirvenne, M.; Ruiz, M.E. Measuring and Modelling the Soil Shrinkage Characteristic Curve. Geoderma 2006, 137, 179–191. [Google Scholar] [CrossRef]
  40. XP P 94-060-2; Essai de Dessiccation: Partie 2: Détermination Effective de La Limite de Retrait Sur Un Prélèvement Non Remanié. AFNOR: Paris, France, 1997.
  41. Peng, X.; Zhang, Z.B.; Wang, L.L.; Gan, L. Does Soil Compaction Change Soil Shrinkage Behavior? Soil Tillage Res. 2012, 125, 89–95. [Google Scholar] [CrossRef]
  42. Monroy, R.; Zdrakovic, L.; Ridley, A. Evolution of Microstructure in Compacted London Clay during Wetting and Loading. Géotechnique 2010, 60, 105–119. [Google Scholar] [CrossRef]
  43. Alaoui, A.; Lipiec, J.; Gerke, H.H. A Review of the Changes in the Soil Pore System Due to Soil Deformation: A Hydrodynamic Perspective. Soil Tillage Res. 2011, 115–116, 1–15. [Google Scholar] [CrossRef]
  44. Mbemba, F.S. Évaluation de La Dessiccation, Du Retrait et de La Fissuration de Matériaux Silteux Peu Plastiques. Master’s Thesis, École Polytechnique de Montréal, Montréal, QC, Canada, 2010. [Google Scholar]
  45. Ying, Z.; Cui, Y.J.; Benahmed, N.; Duc, M. Drying effect on the microstructure of compacted salted silt. Géotechnique 2023, 73, 62–70. [Google Scholar] [CrossRef]
  46. Chertkov, V. The Shrinkage Geometry Factor of a Soil Layer. Soil Sci. Soc. Am. J. 2005, 69, 1671–1683. [Google Scholar] [CrossRef]
  47. Ferber, V. Sensibilité Des Sols Fins Compactés à l’humidification: Apport d’un Modèle de Microstructure; Ecole Centrale Nantes: Nantes, France, 2005. [Google Scholar]
  48. Fabre, R.; Kouassi, P.; Riss, J. Variabilité de Propriétés Physiques Des Sols Argileux à Différents Échelles: Application à Des Sols Compactés Utilisés Pour La Construction de Barrages; Journée métier Géo-Entreprise: Nancy, France, 1998; pp. 27–31. [Google Scholar]
  49. Serratrice, J.F. Retrait-Gonflement Des Sols Argileux et Des Marnes. Rev. Fr. Géotech. 2007, 120–121, 107–120. [Google Scholar] [CrossRef]
Figure 1. Position of the initial states of tested GC and BM samples. (A) Unsaturated samples after dynamic compaction “the initial moisture is constant for each sample series”. (B) Initially saturated and unsaturated samples after static compaction.
Geotechnics 04 00028 g001
Figure 2. The free-swelling curves versus time on (1) green clay (GC-W) and (2) blue marl (BM-W) after W-disturbance and static compaction at various dry densities.
Geotechnics 04 00028 g002
Figure 3. Evolution of B and G parameters with dry density.
Geotechnics 04 00028 g003
Figure 4. Typical shrinkage curve on a macroporous soil (The shrinkage curve is in red color while the dashed line identifies the remarkable points on the curve) [39,40].
Geotechnics 04 00028 g004
Figure 5. Effect of the dry density (g/cm3) on the shrinkage curve of W-disturbed (statically compacted) GC and BM samples: (1) initially saturated samples (initial moisture content varies), (2) initially unsaturated samples (samples are prepared at similar initial water content), and (3) after a free-swelling test on initially unsaturated samples. The saturation line (black line) is calculated with a solid density ρs = 2.7 g/cm3. The color scale from cold (blue) to hot (red) corresponds to a decreasing soil density.
Geotechnics 04 00028 g005
Figure 6. Pore size distribution (PSD) of intact (I) and W-disturbed BM and GC at different densities (static compaction) at the end of a direct shrinkage test after drying at 105 °C. (1) Initially saturated samples (initial moisture content varies), (2) initially unsaturated samples (samples are prepared at similar initial moisture), and (3) after a free-swelling test on initially unsaturated samples. The color or grey levels make easier the curves distinction.
Geotechnics 04 00028 g006aGeotechnics 04 00028 g006b
Figure 7. Relationship between the dry density and the initial and final void ratios after shrinkage on GC-W and BM-W disturbed samples. (1) Shrinkage on statically compacted and initially saturated samples. (2) or (3) Shrinkage with or without an initial swelling step on statically compacted and initially unsaturated samples. (4) Shrinkage on dynamically compacted and initially unsaturated samples. The solid lines correspond to tendencies drawn from experimental points. The tendencies for BM (1) and GC (1) were drawn with dashed lines for easier comparison with the BM or GC (2) to (4) behaviors.
Geotechnics 04 00028 g007
Figure 8. Photos of W-disturbed compacted samples compared with an (I) intact sample of green clay (GC) and blue marl (BM).
Geotechnics 04 00028 g008
Figure 9. Variation of ∆H/H, ∆D/D and the ratio R = (∆V/V)/(∆H/H) versus water content during the shrinkage test on W-BM (2) and W-GC (2) samples, as well as on intact BM and GC soils.
Geotechnics 04 00028 g009
Figure 10. Swelling tests followed by shrinkage tests on W- and C-disturbed GC and BM soils prepared at different densities by dynamic compaction. Blue and red colors refer, respectively, to specimen prepared at initial water content equal to 27% and 30%. Dark and light colors correspond to, respectively, C and W disturbance; eair,i refers to the void ratio occupied by air at initial state. On the right, GC measurements points were drawn in grey to help the comparison with BM. The colored dashed lines correspond to the trend of initial states and the black dashed lines to extrapolation at low eair,i values of the colored trending curves.
Geotechnics 04 00028 g010
Table 1. Specimen preparation (I: intact soil; W: disturbed soil under mud form; C: disturbed soil after cutting; Sh: volumetric shrinkage test, Sw: free-swelling test, M: manual measures, A: automated measures, (s) and (us) are related to samples initially saturated and unsaturated).
Specimen NamePreparation Compaction ModeTest Size of the Cylindrical Specimen (mm)wo %Initial Density ρ0
(g/cm3)
Initial Dry Density ρd,0
(g/cm3)
(1)GC (1)
BM (1)
I, W, C
I, W, C
StaticSw(S)
Sh (S) (A)
D 50 H 3027
30
1.75–1.98
1.77–1.97
1.34–1.56
1.32–1.56
(2)GC (2)
BM (2)
W
W
StaticSh(US) (A)D 50 H 30 30
32.5
1.22–1.48
1.21–1.39
1.59–1.92
1.61–1.84
(3)GC (3)
BM (3)
W
W
StaticSw (US)
followed by Sh (A)
D 50 H 30 30
32.5
1.22–1.48
1.21–1.39
1.59–1.92
1.61–1.84
(4)GC (4)
BM (4)
W, C
W, C
Dynamic Sw (US)
followed by Sh (M)
D 70 H19
D 60 H 20
27
30
1.42–1.78
1.65–1.86
1.14–1.40
1.24–1.43
Table 2. Slopes of linear regressions associated with Figure 7. Preparation of statically compacted samples in (1) initially saturated state, (2) initially unsaturated state, (3) initially unsaturated state followed by free swelling. (4) Preparation of dynamically compacted samples initially unsaturated.
Initial StateShrunk State
GC (1)−0.9−0.76
GC (2)−1.19−1.39
GC (3)−1.47−1.39
GC (4)−1.76 to −1.84−0.30 to −0.48
BM (1)−0.81−0.52
BM (2)−1.36−1.56
BM (3)−1.36−1.16
BM (4) wi = 27%−1.60−1.15
BM (4) wi = 30%−1.48−0.70
Disclaimer/Publisher’s Note: The statements, opinions and data contained in all publications are solely those of the individual author(s) and contributor(s) and not of MDPI and/or the editor(s). MDPI and/or the editor(s) disclaim responsibility for any injury to people or property resulting from any ideas, methods, instructions or products referred to in the content.

