Article

Monotonic Drained and Undrained Shear Behaviors of Compacted Slightly Weathered Tephras from New Zealand †

by
Shaurya Sood
1,*,
Gabriele Chiaro
1,*,
Thomas Wilson
2 and
Mark Stringer
1
1
Department of Civil and Natural Resources Engineering, University of Canterbury, Christchurch 8041, New Zealand
2
Department of Earth and Environment, University of Canterbury, Christchurch 8041, New Zealand
*
Authors to whom correspondence should be addressed.
This manuscript is an extension version of the conference paper: Sood, S.; Chiaro, G.; Wilson, T.; Stringer, M. Monotonic drained and undrained shear strength behaviour of compacted weathered airfall tephras. In Proceedings of the Indian Geotechnical Conference 2022 Volume 1 (IGC 2022); Lecture Notes in Civil Engineering; Jose, B.T., Sahoo, D.K., Shin, E.C., Choudhury, D., Joseph, A., Pai, R.R., Eds.; Springer: Singapore, 2024; Volume 476. https://doi.org/10.1007/978-981-97-1737-8_35.
Geotechnics 2024, 4(3), 843-871; https://doi.org/10.3390/geotechnics4030044
Submission received: 9 August 2024 / Revised: 27 August 2024 / Accepted: 29 August 2024 / Published: 30 August 2024
(This article belongs to the Special Issue Recent Advances in Geotechnical Engineering (2nd Edition))

Abstract

:
This paper reports and discusses the results of a series of monotonic compression drained and undrained triaxial tests performed on three compacted, slightly weathered silty sand tephras. In total, 18 drained and 18 undrained tests were performed on compacted specimens (at Dc ≈ 90 and 100%) isotropically consolidated at confining pressures of 50–200 kPa. It was observed that particle size distribution, weathering state, and mineralogy of the tephra deposits had significant effects on the stress–strain responses, friction angles, stress–dilatancy relations, and critical state characteristics. For instance, the coarser tephra (namely white–grey Kaharoa, that was less affected by weathering processes) showed a primarily dilative response. The effects of chemical composition, namely weathering degree and mineralogy, on geotechnical properties such as friction angle were investigated with an attempt to interlink the two characteristics for heterogeneous tephras. The measured friction angles (ϕ = 32.7°–42.8°), combined with the results of weathering degrees and mineralogical investigations, indicated that silty sand tephras, if properly compacted, are suitable fills for use in typical geotechnical applications.

1. Introduction

Airfall tephras are volcanic materials deposited after eruptions near to, and away from, the vent source. These deposits are abundantly present in the volcanically active regions of the North Island of New Zealand (i.e., the region encompassing Rotorua and Taupo townships is one of the most active hotspots in the world, whereas, the Auckland Volcanic Field (AVF) city consists of over 50 dormant sites). In these areas, the majority of volcanic deposits comprise differently weathered tephras resulting from previous airfall events. The characteristics of these tephras are highly variable depending on the eruption types, deposition environment, chemical composition, and weathering state of the materials [1]. Future eruptions are anticipated to produce fresh tephras that might find use in civil engineering applications or, if undisturbed, will weather to generate additional tephric soils.
The tephra deposits are generally found along slopes, valleys, and the surrounding flat lands. They are easily erodible and often quickly re-mobilized in the form of debris flow and lahar, attaining depths of up to several meters. The longer and active eruption history (625 ka) has led to a substantial volume (>300 km3) of volcanic deposits at the Okataina Volcanic Centre (OVC), located east of Rotorua in the Taupo Volcanic Zone (TVZ) [2]. Also, during the last 190 ka, the Auckland Volcanic Field (AVF) has generated over 1.7 km3 of eruptive deposits [3]. The deposited tephras have caused flooding in the surrounding areas and substantial damage to homes, agricultural fields, and engineering structures. Considering such after-effects of an eruption, the post-event clean-up and storage present additional problems in terms of the necessary disposal and potential reuse of fresh tephras.
Considering Auckland city as a case study, which is home to nearly 1.6 nearly million people, the management of such deposits becomes even more critical to restore the functionality of the area in case of an eruption [4]. Not only local hazards, but also distant hazards from the seven volcanic centers in the TVZ could impact Auckland city. For instance, rhyolitic tephras have been identified as sourced from the Taupo Volcanic Centre, Okataina Volcanic Centre and Mayor Island. Andesitic tephras from Mt. Taranaki and Tongariro Volcanic Centre have also been identified [5]. This shows the variability in the composition of the tephras found in these regions, and the need to have a comprehensive characterization of heterogeneous tephras, including geotechnical, chemical and mineralogical property investigations [6]. Because of their abundance and economic considerations, if proven suitable, such fresh volcanic tephras could be used as preferred construction materials for geotechnical applications. Hence, understanding the mechanical and deformation behavior of different tephras is of paramount importance from a practical engineering viewpoint.
In the last few decades, pyroclastic sediments and tephras have become a topic of interest for many researchers and geotechnical engineers in volcanically active areas including Italy, South America, Japan and New Zealand [7,8,9,10]. Both airfall and flow-type deposits have been examined. One of such silty sand crushable pyroclastic sediment is particularly predominant in the south of Kyushu Island in Kagoshima prefecture, Japan, where it is known as ‘Shirasu’. It is frequently exposed in soft rock escarpments, which are mined for use in reclaimed landfills. Its deformation and pore water pressure build-up behavior under monotonic and cyclic load, as well as strength characteristics such as the angle of internal friction and failure condition, have been reported by several studies [11,12]. Similar types of pyroclastic airfall tephras might exhibit higher breakage under shearing due to complex grain shape, particle fragility, and mineralogical composition. Alongside drained tests, the undrained monotonic behavior on pyroclastic ashes has revealed the rapid build-up of pore water pressure, ultimately leading to failure and causing landslides [13]. The tephras may, therefore, exhibit peak or residual stress state and rapid pore pressure accumulation, ultimately leading to the development of large shear strains and localized failure.
Likewise, for a better understanding of the geotechnical behavior of pyroclastic sediments such as scoria within low-stress level conditions, drained compression tests carried out on loose and dense samples revealed the effects of grain size, dry density, and effective confining stress upon stress–strain behavior [14]. For coarse-grained pumiceous sediments comprising mainly sand-sized particles, it has been found that, under monotonic undrained loading, the relative density does not greatly affect their behavior as both loose and dense specimens show similar responses [15]. At large strain levels, the pumiceous and scoria sands do not achieve the steady state of deformation due to the concurrent breakage of particles. Nonetheless, at the end of respective conditions of drained and undrained loadings, the rate of volume or pore pressure change can be a relative measure to estimate closeness to the steady state (i.e., critical state).
Most previous studies on compacted geo-materials have focused on clay materials, and there has been little attempt to employ compaction on granular materials such as sand, silt, or coarse-grained material such as gravel [16,17,18]. As compacted backfilling materials are expected to perform better when subjected to shearing, the densification of these tephras under proper compaction seems imperative. The degree of compaction (Dc) also permits better density state control and variation in water content in field conditions.
Studies focusing on monotonic drained and undrained behavior of compacted tephric sand–silt mixtures (containing up to 50% fines) of heterogeneous chemical compositions have not been reported to date. Therefore, by filling the knowledge gaps for these types of geomaterials, this study will enable researchers, as well as geotechnical engineers, to better identify the shear characteristics of silty sand volcanic deposits for backfilling operations. In this paper, keeping in mind the above, Dc has been used as the index to describe the packing density state of tephras to be used as geomaterials.
Accordingly, this paper is based on a testing campaign studying the monotonic shear properties of non-plastic rhyolitic and basalt-andesitic silty sand tephra specimens, complementing the results of chemical and mineralogical investigations, as reported earlier by Sood et al. [6]. Because of the unavailability of fresh tephras, slightly weathered tephras were collected from layers corresponding to 0.8, 0.14, and 85 ka in Auckland and Rotorua [1,19]. The study of different tephras enables a wider characterization of airfall deposits of different chemical compositions to be found in Auckland in cases of both inland and distal eruptions.
For these purposes, a series of monotonic drained and undrained triaxial compression tests were performed on compacted airfall tephra samples, containing up to nearly 52% non-plastic fines. The main objectives of this study were to determine: (1) the monotonic drained and undrained behavior, (2) the volumetric and pore-pressure changes, (3) the effect of confining pressure and degree of compaction on shear responses, (4) the extent of particle breakage after testing, and (5) effect of degree of weathering and mineral composition on shear responses. By looking into the chemical compositions of identical or different tephras, the adoption of this procedure can be extended and adopted for other pyroclastic soils (of variable weathering degrees) found worldwide. This approach can likewise be used to study the effect of weathering (under controlled conditions) on the mechanical properties of an individual deposit, which are beyond the scope of the current study. These tests were also analyzed in terms of stress–dilatancy/pore water pressure changes, and also used to develop the critical state line (CSL) of the materials. In cases where the critical state was affected by strain localization or shear band formation, extrapolations were used to better define the stress values at the critical state (deviator stress q and mean effective stress p′).

2. Areas of Soil Sampling

The North Island lies on the Australian Plate and is heavily influenced by tectonic activity and active volcanism due to the subduction of the Pacific Plate below it [20], particularly in the central region including the Taupo Volcanic Zone (TVZ). Mt. Tarawera is a dome volcano in the Okataina caldera of TVZ, located south of Rotorua township (Figure 1). The eruption deposits, namely White Kaharoa Ash (WKA) and Golden Kaharoa Ash (GKA), were formed 0.8 ka and 140 years (1886) ago, respectively [1]. Unlike the TVZ, the volcanoes of Auckland (known as the Auckland Volcanic Field AVF) lie away from the plate boundary, and the type of resultant magma is basalt. Mt. Maungataketake is a small volcano located at the southwest edge of AVF. The age of this volcano has recently been reported to be 85 ka [19]. Pheratomagmatism, along with violent base surges, considered quite hazardous, have been observed near Mt. Maungataketake [21]. Eruptions like wet base surges generating Manugataketake Ash (MA) may occur in the future in Auckland, hence practical engineering knowledge of them can be crucial while using base surge deposits for land reclamations.
The airfall tephras corresponding to the mentioned eruptions [1,21] were collected in bulk by scooping and shoveling for the purpose of remolding in the laboratory. The sampling sites investigated were roadside trenches and quarry pits. The bulk samples were carefully wrapped in thick air and water-tight plastic bags, and then sealed in plastic containers for transport. The samples, as such, were large enough to provide representative soils for physical–chemical classification, compaction, and triaxial testing.

3. Materials and Methodology

The physical, chemical, and compaction properties of tested tephras such as particle size distribution (PSD), specific gravity (Gs), elemental (X-ray fluorescence)–mineralogical (X-ray diffraction) compositions, and maximum dry density (ρdmax) were determined through laboratory tests and reported in Sood at al. [6]. In this paper, they are briefly reported for completeness. The assessment and indication of these properties reveal important characteristics of these tephras. The specimens’ preparation steps involved in triaxial testing are also presented in this section.

3.1. Particle Size Distribution and Specific Gravity

The naturally disturbed airfall tephras (WKA, GKA and MA) investigated in this study correspond to the eruptions of Tarawera 1300 (Kaharoa) and 1886, and Maugataketake 85 ka eventuated in the Rotorua and Auckland regions of New Zealand, respectively. They were named according to their eruption sources and color appearances (e.g., White Kaharoa Ash—WKA). The tephra samples were cleaned from organic contamination and oven-dried at 100 °C for 24 h before any further tests.
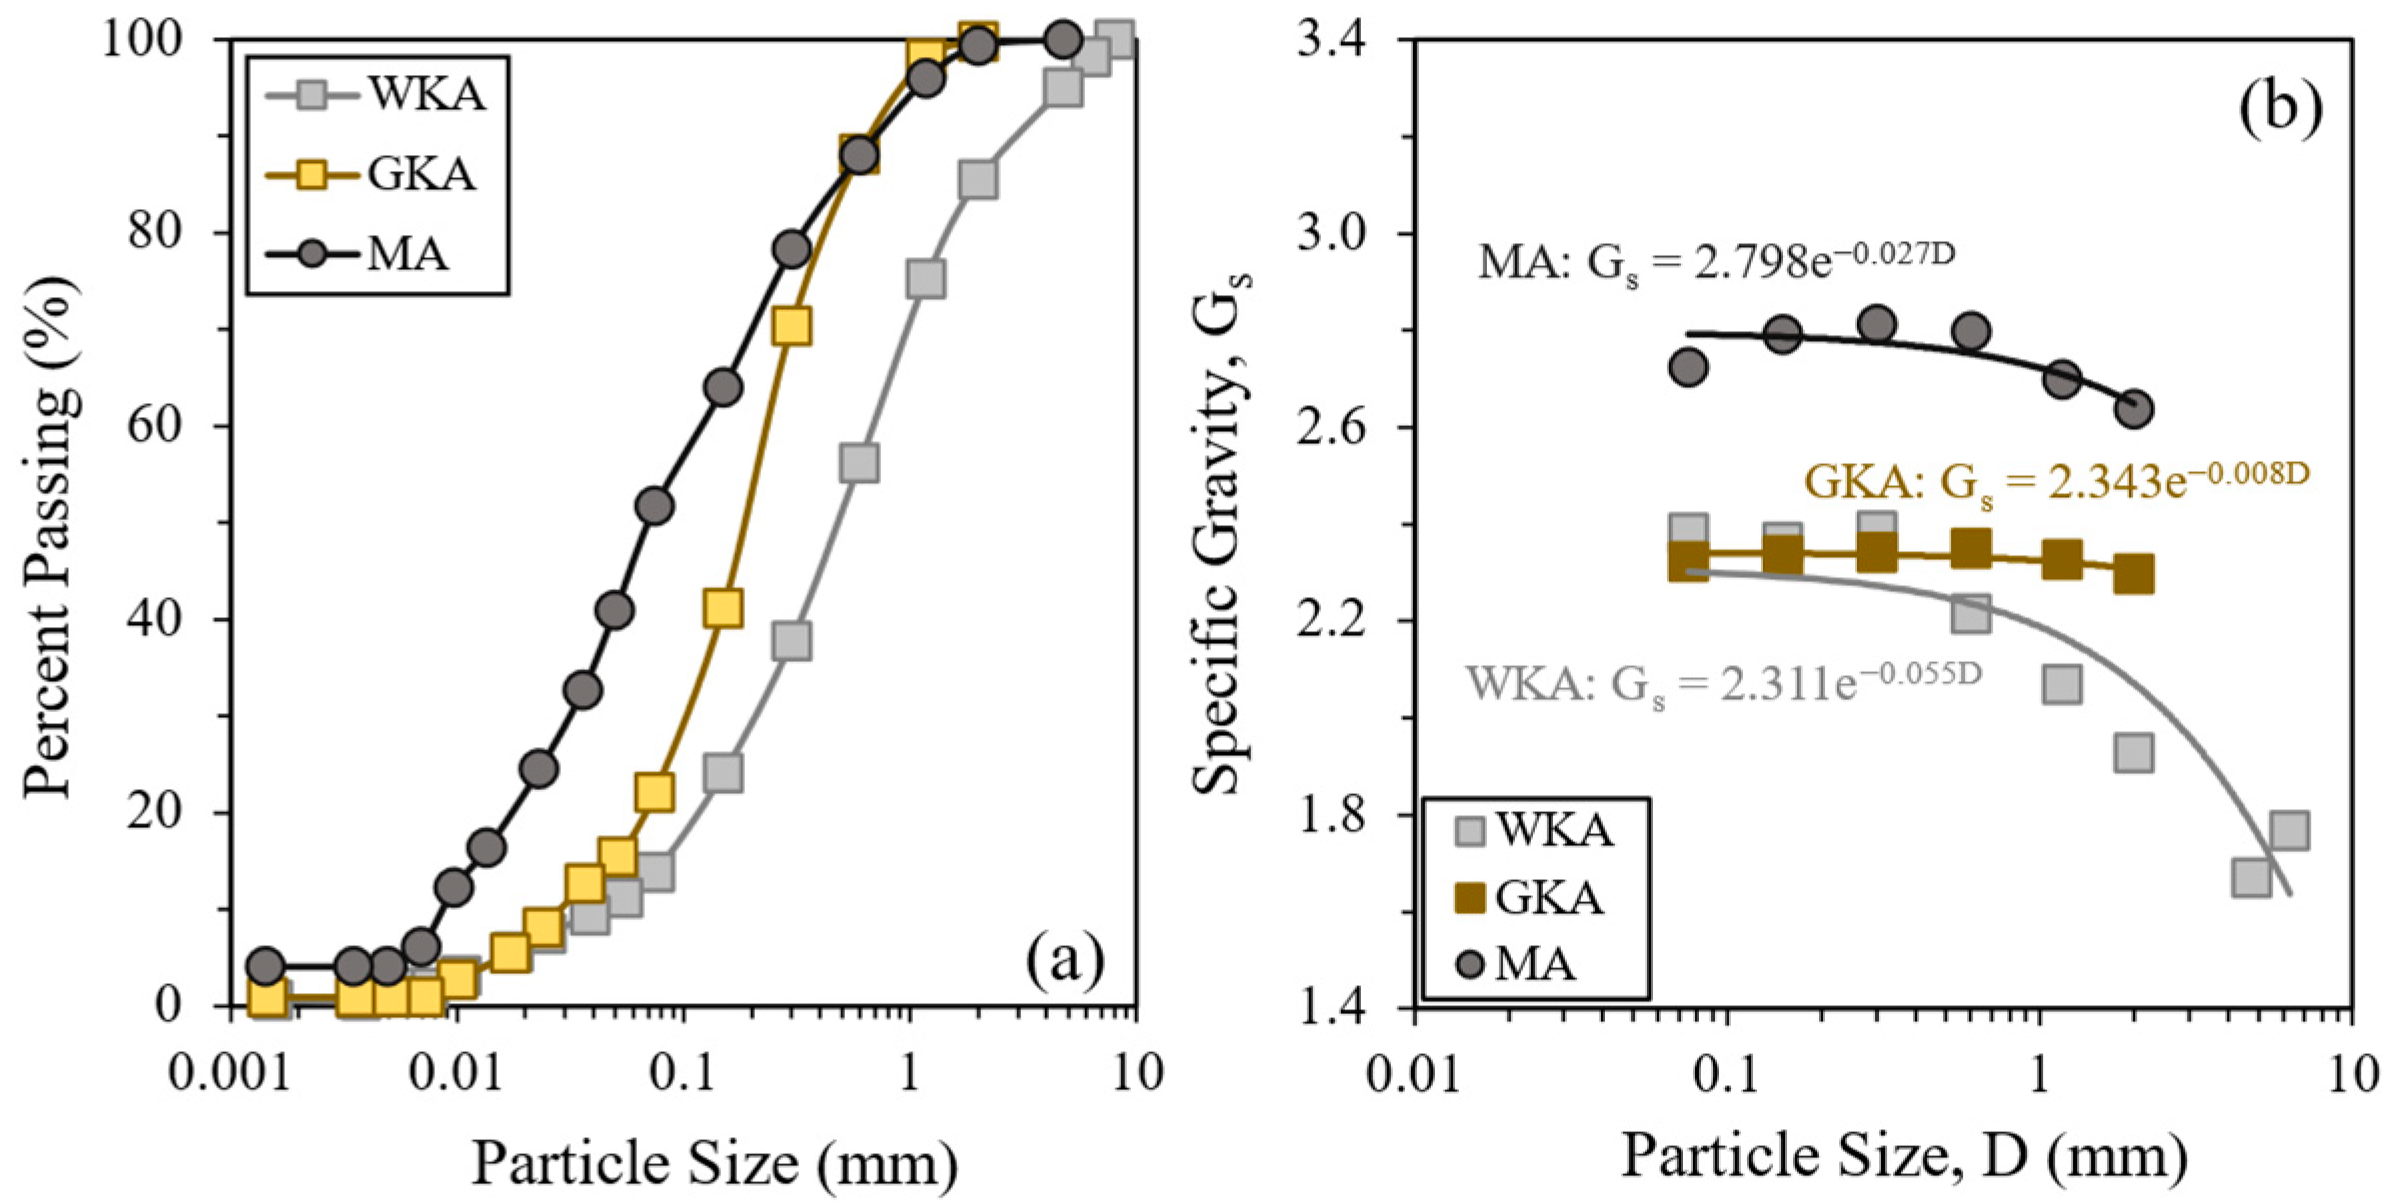
The WKA appeared coarser and hard-grained, with a mixture of granites, granodiorites, pumiceous, and obsidian particles. In contrast, GKA was slightly friable with a mixture of lithics, granitic, pumiceous particles, and MA powdery with basalt and the inclusion of sandstone in it. While the WKA and GKA were predominantly silty sands, the MA containing fines in slightly higher proportion was sandy silt in nature. The fines (<0.075 mm) encompassing these tephras were non-plastic (WKA, GKA), or very slightly plastic (MA). Table 1 and Figure 2 present the physical properties of the studied tephras.
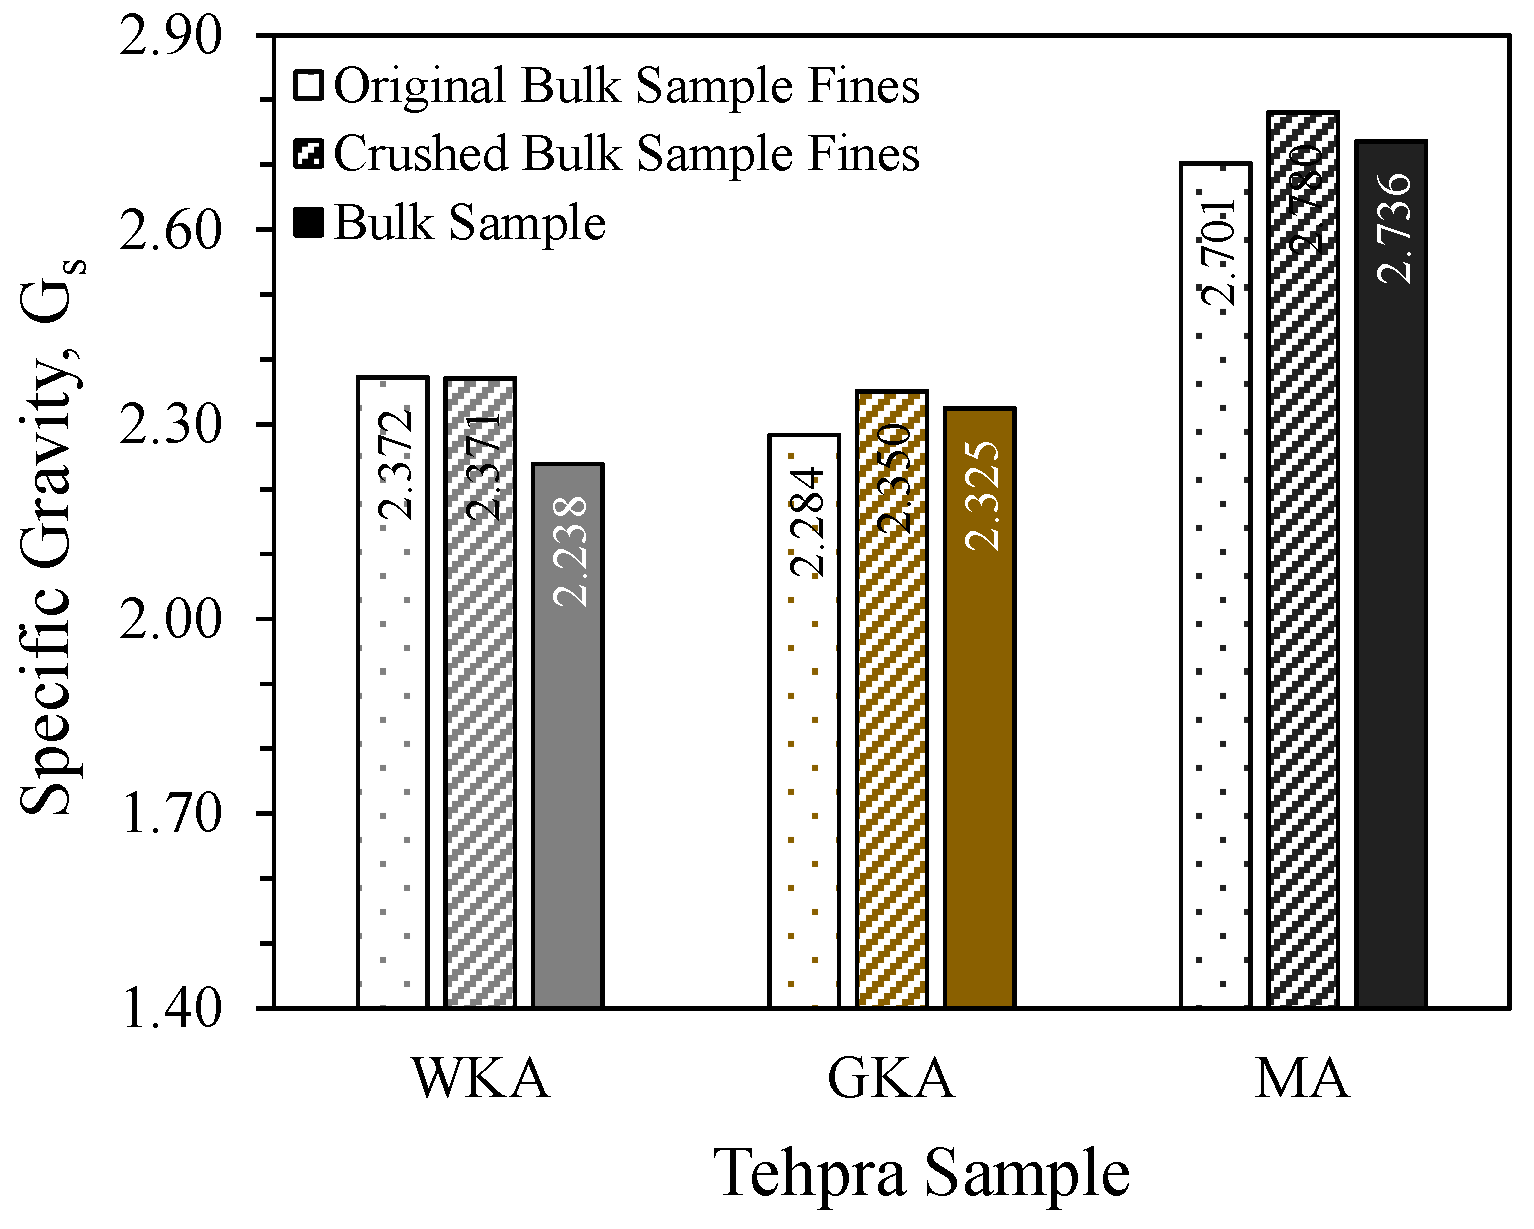
As shown in Figure 2b, the Gs values, measured over the entire particle sizes using a water pycnometer and vacuum application, showcased a decreasing trend with the increase in particle sizes due to the presence of internal voids [6,22,23]. Among the three tephras, two inferences could be made here: (i) the difference in Gs values for bulk sample and bulk fines was highest for WKA due to a more sand-type gradation, and (ii) there was a higher increment (although constant for WKA) in Gs upon crushing bulk fines due to the destruction of finer voids (Figure 3). To account for these changes, a careful selection of Gs for void-filled tephra particles for engineering design applications was, therefore, necessary. In this study, the bulk Gs value was, therefore, used, considering the effect of the entire gradation for compaction curves and shear strength estimation. The bulk Gs values of Kaharoa ashes were comparatively smaller than those of Maungataketake ashes, indicating WKA and GKA as lightweight tephras, and MA as the heavier tephra compared to the Gs = 2.65–2.71 of typical quartz-rich and calcareous sands [24,25,26].
Table 1. Physical properties of studied tephras.
Tephra SampleGravel (%)Sand (%)Fines (%)PI (%)D50 (mm)CuCcSoil Classification (ASTM D2487 [27])Gs Bulk Sample (ASTM D854 [28])
WKA5.081.213.8NP0.5016.31.5Silty Sand (SM)2.238
GKA0.377.622.1NP0.207.71.4Silty Sand (SM)2.325
MA0.048.351.73.70.0714.40.9Sandy Silt (ML)2.736

3.2. Degree of Weathering and Mineralogy

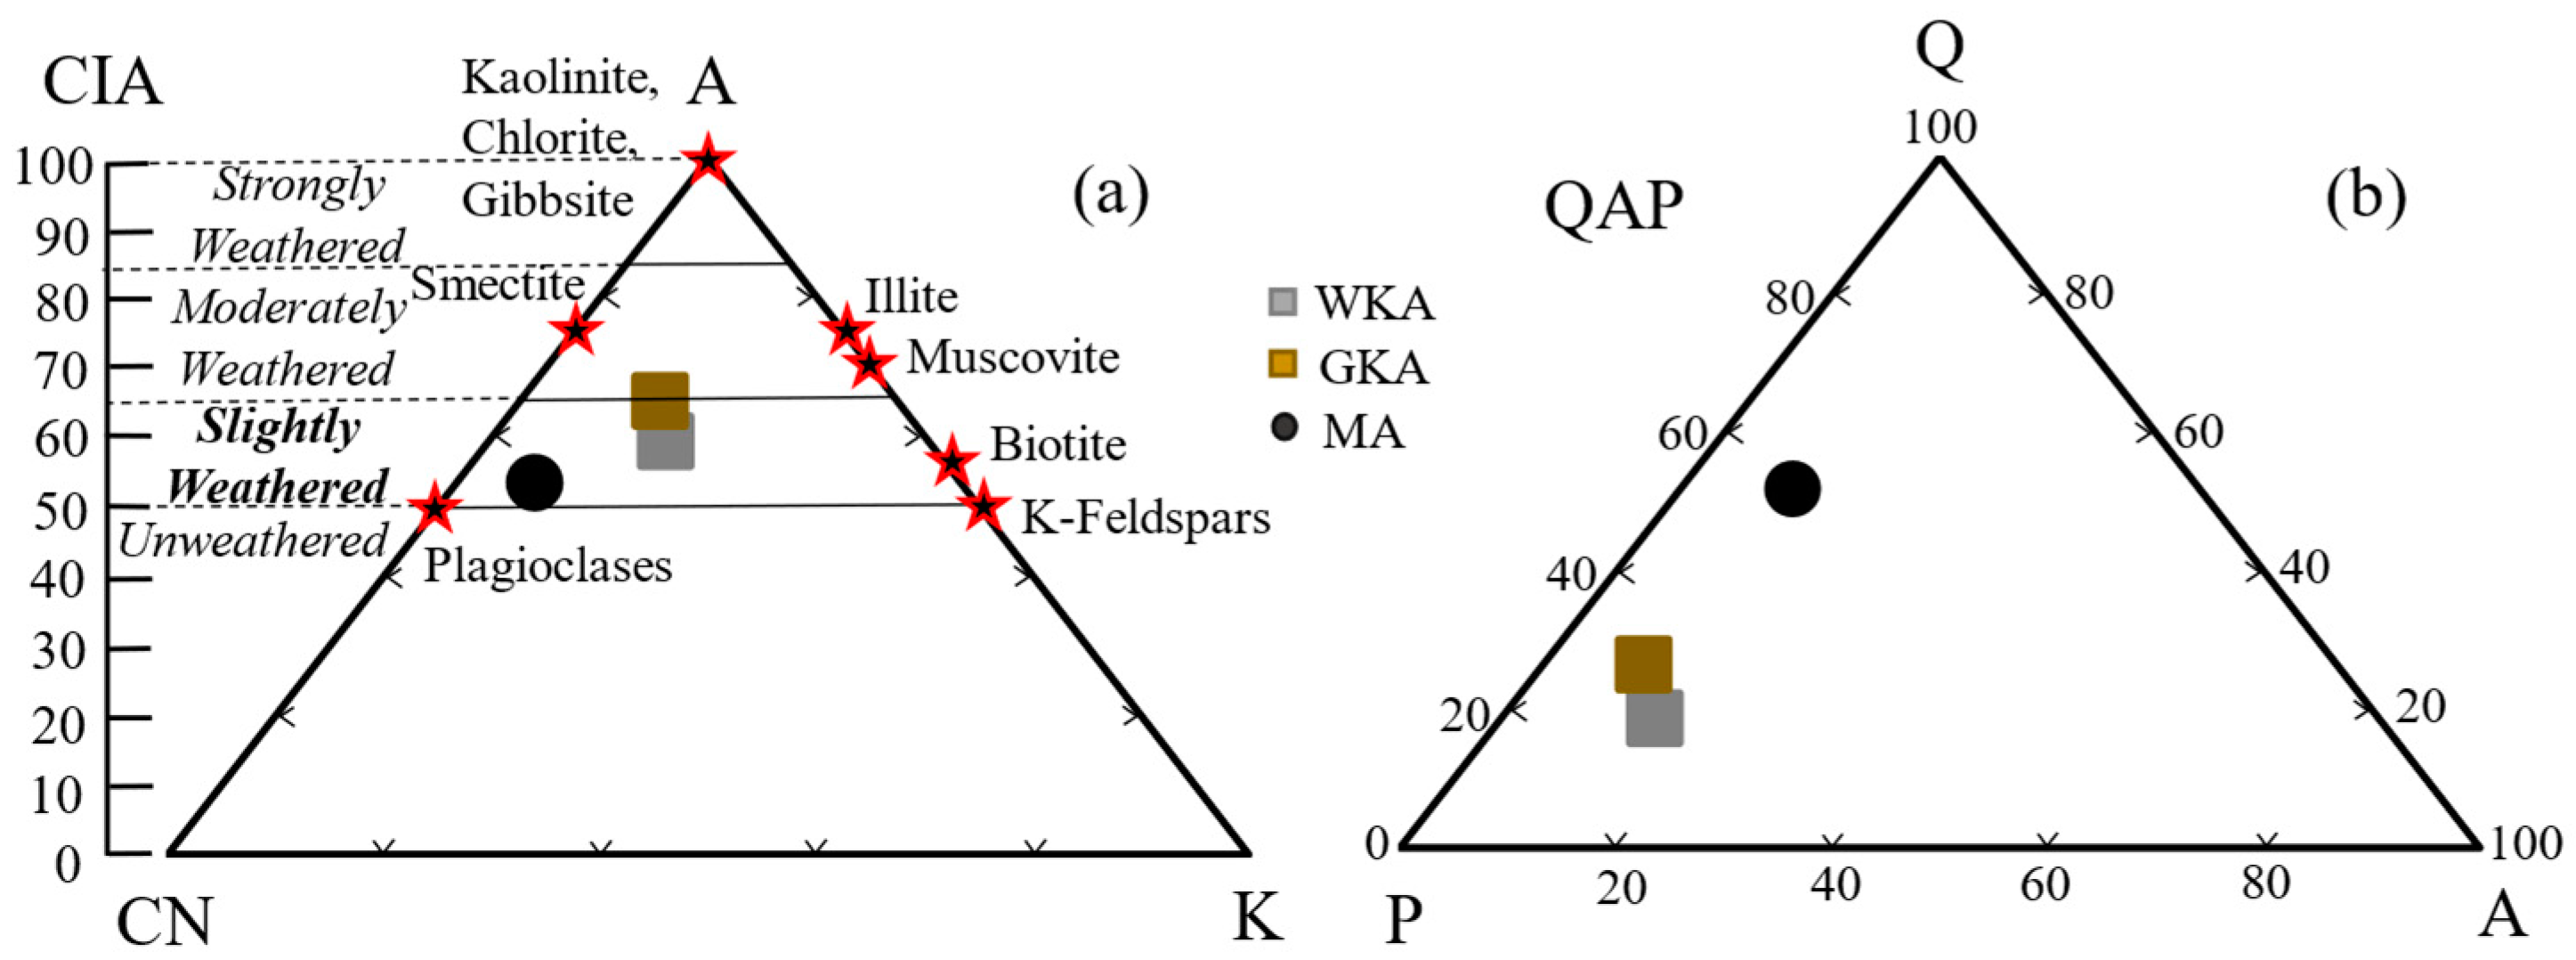
The chemical composition including major oxides (weathering state) and constituting minerals (in wt. %) was determined using X-ray fluorescence and X-ray diffraction techniques, respectively (reported in Table 2 and Table 3). From the oxide compositions, the Rotorua tephras WKA and GKA can be categorized as rhyolites (higher SiO2 and Na2O + K2O), whereas the Auckland tephra MA can be classified as basalt andesitic (lower SiO2 and Na2O + K2O) [29].
These collectively fell in the slightly weathered category in the A (Al2O3)–C (CaO) N(Na2O)–K (K2O) plot, indicating lesser breakdown of feldspars into clayey minerals (plagioclases Na–Ca feldspars and K (alkali) feldspars) (Figure 4). This is known as the Chemical Index of Alteration, CIA [30], and is defined by Equation (1):
CIA = 100 × Al2O3/[Al2O3 + Na2O + K2O + CaO]
Considering the lesser silicate weathering (formation of clayey minerals), heterogeneous nature (rhyolite vs. basalt-andesitic), mobility of Al2O3, and maximum number of chemical components during chemical weathering, the weathering indices such as Weathering Index of Parker (WIP) [31] and Chemical Weathering Index (CWI) [32] were used to better establish the degree of weathering of the studied tephras. The WIP and CWI indices, based on the proportions of alkali and alkaline earth oxides (Na2O, K2O, CaO and MgO), and sesquioxides (TiO2, Al2O3 and Fe2O3) remaining after weathering, are defined as:
WIP = 100 × [(2Na2O/0.35) + (2K2O/0.25) + (CaO/0.70) + (MgO/0.90)]
CWI = 100 × (TiO2 + Al2O3 + Fe2O3)/All Chemical Components
The proportion of minerals and weathering indices have also been illustrated in the complementary study [6]. According to the definitions of WIP and CWI, a smaller WIP value indicates stronger chemical weathering, which is opposite to the CWI formulation (i.e., a higher CWI value indicates higher sesquioxide content, and hence more weathering). From these values, the rhyolitic WKA was designated to be the least weathered out of the three tephras, followed by geochemically ‘similar’ rhyolitic GKA. The remaining basalt andesitic MA tephra was assigned to be the most weathered.
The relative abundances of the amorphous glass phase and crystalline mineral phase including silica (quartz and cristobalite), feldspars, and accessory minerals are presented in Table 3. Out of the three tephras, the MA appeared relatively more crystalline and contained less glass than glassy WKA and GKA tephras. The values of the weathering indices WIP and CWI, and Wt. % of silica and feldspar minerals, were used to further assess the impact of the degree of weathering on the shear behavior and post-shear breakage responses of each tephra sample.

3.3. Compaction Properties

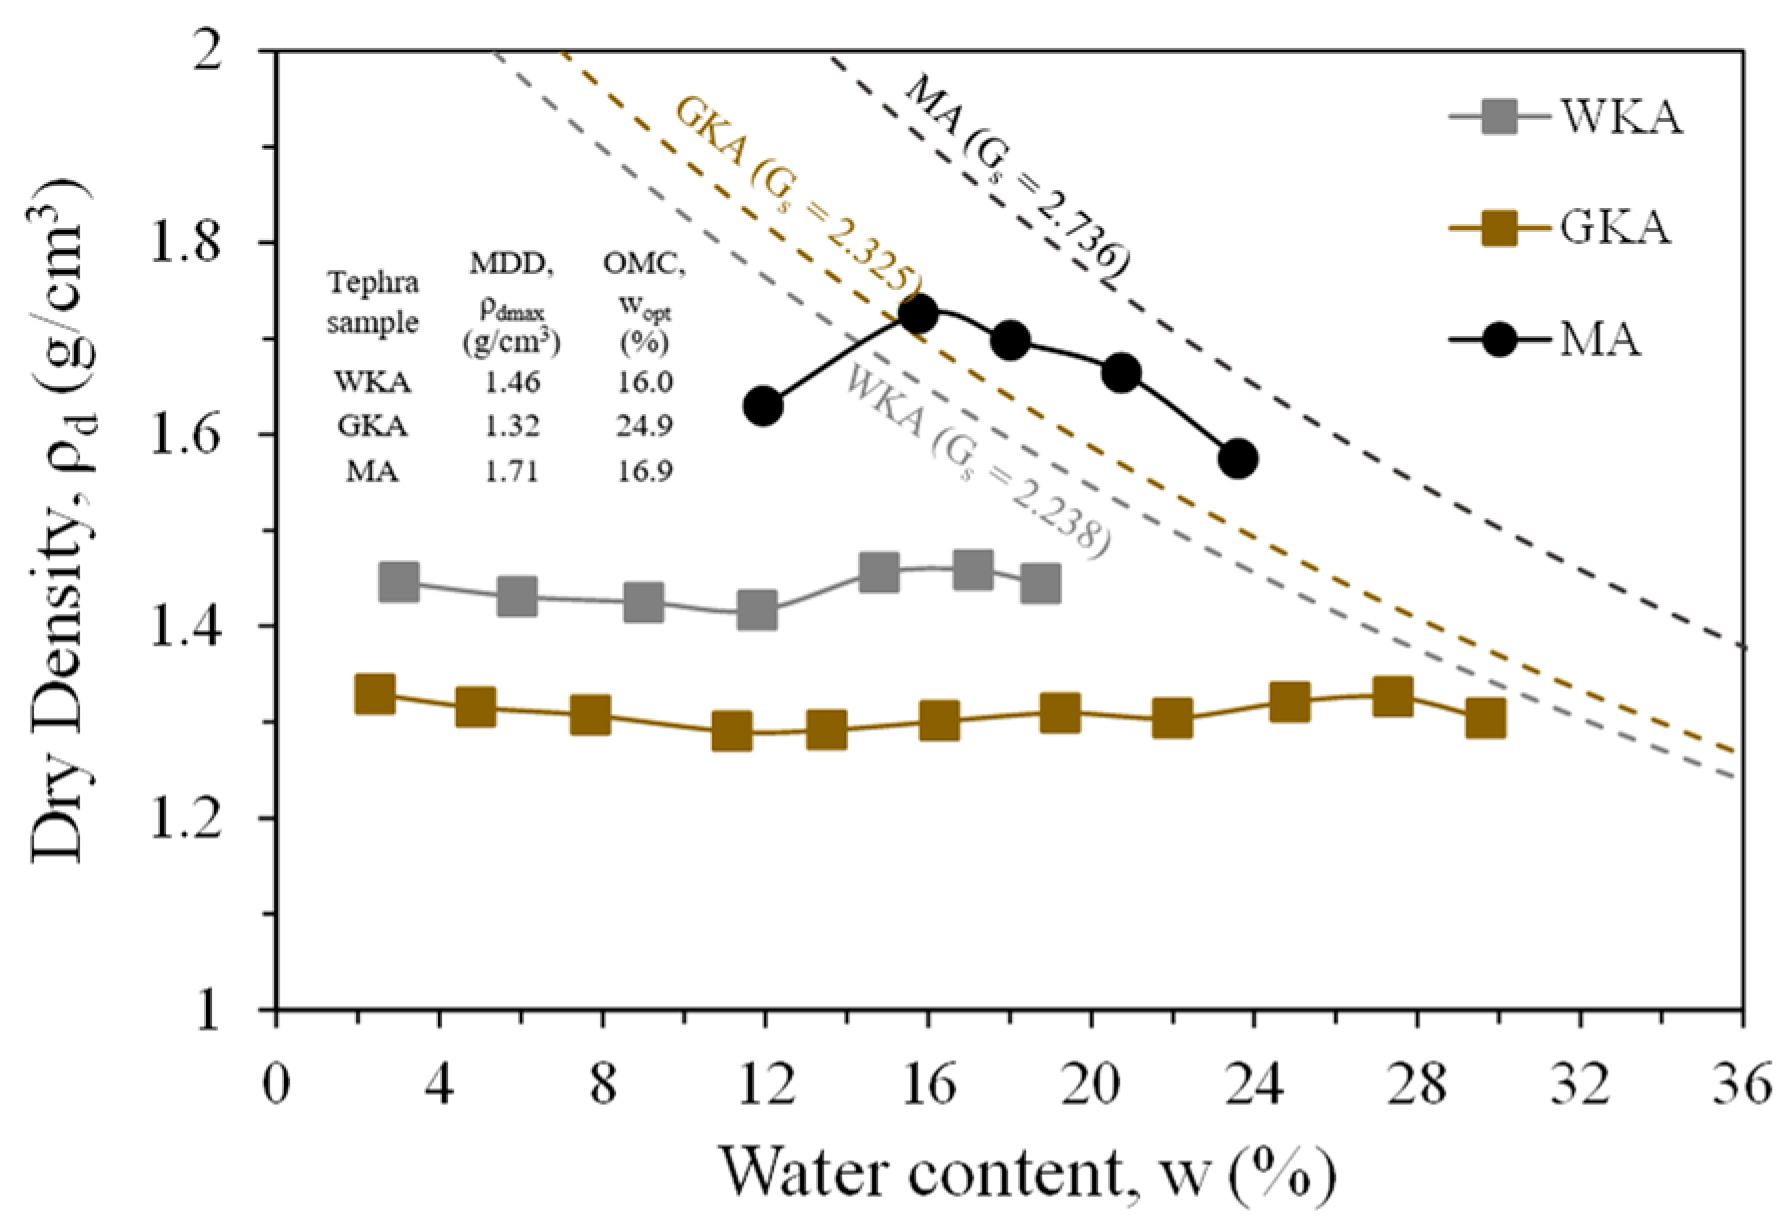
The standard Proctor compaction tests were carried out following the ASTM D698 [33] specifications. Figure 5 presents the dry density (ρd) plotted against the water content (w) for tephra samples. The corresponding zero air void lines, maximum dry densities (ρdmax), and the optimum water contents (wopt) are also presented in Figure 5. For the tested tephras, the obtained ρdmax and wopt fell within the range of 1.14–1.71 g/cm3 and 16.0–24.9%, with GKA and WKA possessing relatively lower ρd than MA. Although geochemically identical, the higher ρdmax of rhyolitic WKA (1.28–1.40 g/cm3) than that of GKA (1.14–1.33 g/cm3) was due to the granular and friable nature of these tephras, respectively (both eventuated from the same Tarawera 1300 eruption, but GKA subjected to more weathering, as established earlier in Section 3.2). The higher ρdmax (1.48–1.71 g/cm3) of MA was due to its basalt–andesitic nature.
The compaction curves for WKA and GKA also implied that their ρd was less affected by the variation in water content due to their non-plastic fines and predominantly sandy nature. The rise and drop in ρd around wopt was also evident for MA, although a much steeper compaction curve was observed (Figure 5). In the tested water contents, the rise, followed by peak attainment, then eventual drop could be explained by the lubrication effects of water around that region for fine-grained and slightly cohesive sandy silt MA.
Therefore, the observed shapes of the compaction curves could be attributed to the slightly weathered nature (non-plastic or very slightly plastic fines) of the silty sand WKA and GKA, and sandy silt MA tephras. The ρdmax and wopt varied from 1.14–1.71 g/cm3 and 16.0–24.9% (low range), respectively, enabling easier water control during compaction.

3.4. Equipment, Specimen Preparation, and Testing Procedure

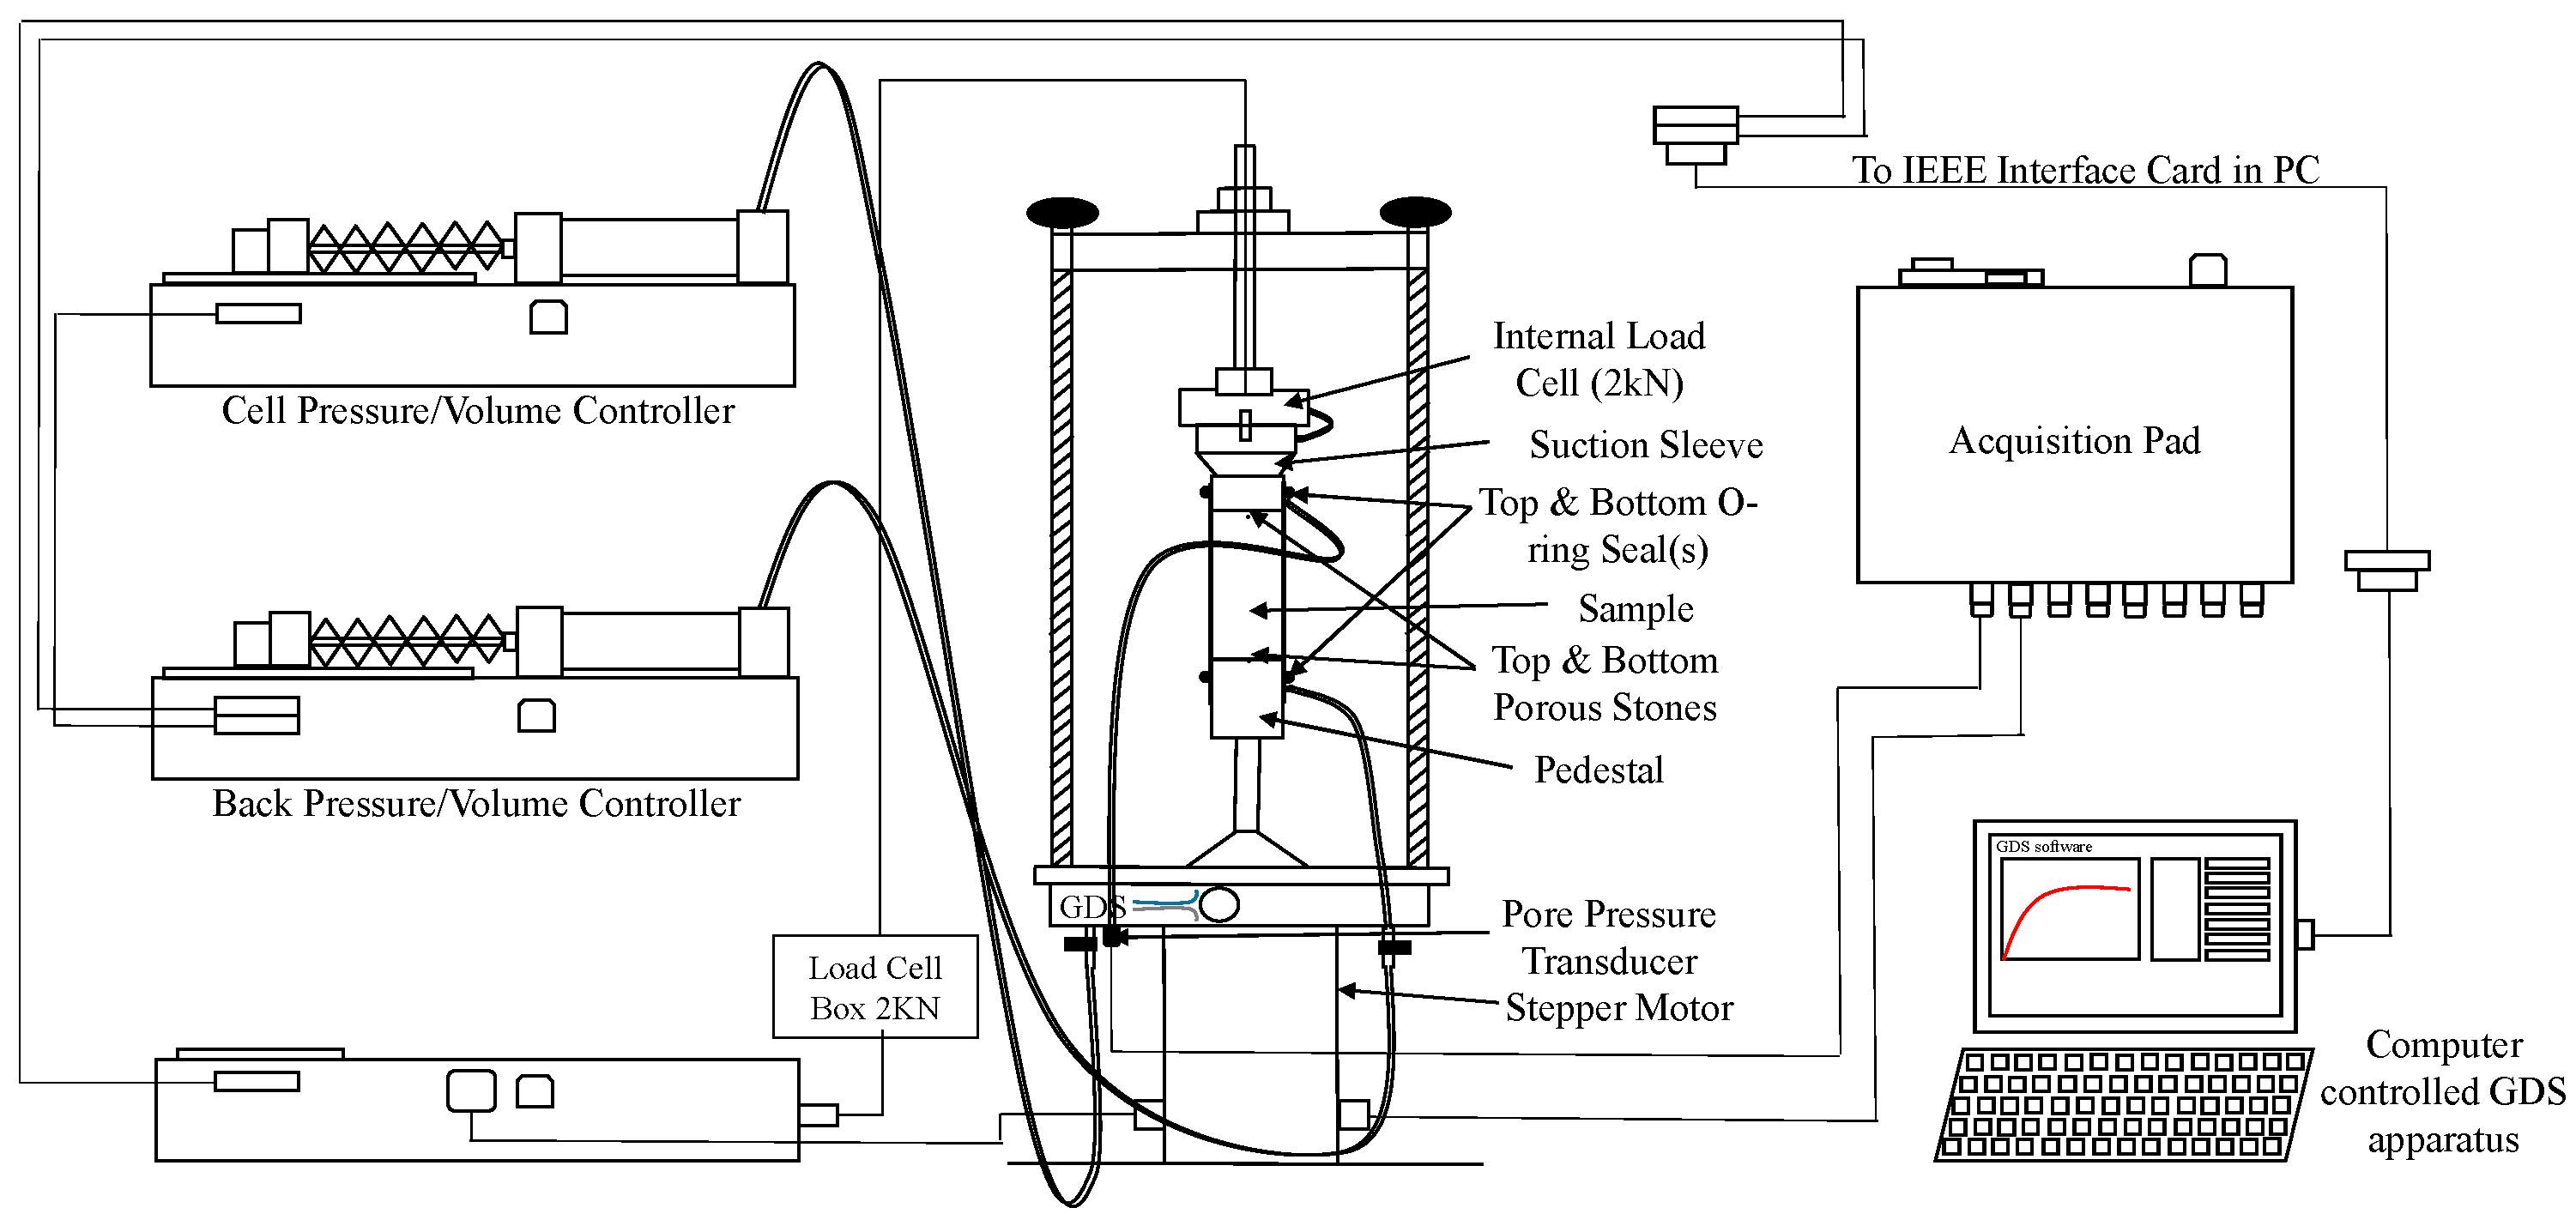
All triaxial tests were carried out in temperature-controlled conditions (22 °C). The advanced stress path GDS triaxial apparatus consisted of a motorized triaxial cell (1700 kPa pressure capacity and 2 kN load cell attached) with a control box (for recording axial force and displacement), two advanced digital controllers for cell and back pressures (200 cm3 capacity of pressure cylinders), and a data acquisition pad. The cell and controllers were connected to the PC via a card connection using IEEE488.2 communication. The GDSLab v2 software was installed on the PC, allowing testing control. The schematic of the apparatus is shown in Figure 6.
To prepare tephra specimens at a degree of compaction (Dc) of 90 and 100% of the standard Proctor (ρdmax), the impact energy applied was varied, while wopt of 16.0%, 24.9%, and 16.9% were utilized for the oven-dried WKA, GKA, and MA tephras, respectively. The specimens were compacted using an impact load (170 g weight subjected to a drop height of 305 mm) in a mold of dimensions of 50 mm in diameter and 100 mm in height. To meet the dry unit weights obtained from the Proctor standard test, calibration was conducted by trial and error with varying compaction energy (i.e., number of blows). The required amount of water was added to the soil samples, which were then compacted in ten layers with the desired number of blows per layer. These varied between 30, 5, and 16 (at Dc ≈ 90%) and 65, 14, and 32 at (Dc ≈ 100%) for WKA, GKA, and MA tephras, respectively. The mass of the moist tephra and the specimen volume were carefully measured after the completion of each layer to ensure the specimens were prepared at the target dry density. Before depositing each subsequent layer, the top surface of the previous compacted layer was scarified to ensure no layering occurred during shearing.
The top surfaces of the bottom pedestal and top cap were lubricated with silicon grease and circular-shaped rubber membrane pieces to avoid any friction effects. In addition, the outer surfaces of the bottom pedestal and the top cap were also silicon-greased to ensure an airtight connection with the membrane. The specimen was then placed onto the bottom pedestal of the triaxial assembly over a porous stone and filter paper. To ensure a sealed system between the specimen and water in the cell, two rubber O-rings were placed on each end of the specimen. A mild vacuum was applied to the specimen to hold it in position while placing the O-rings. Each specimen had a suction cap connecting the top cap to the axial loading system, thus docking the sample before cell installation and water filling. A cell pressure of 20 kPa was then applied while the vacuum was removed simultaneously, before proceeding to CO2 percolation and sample saturation.
The CO2 percolation was continued for a period of 60, 120, and 180 min for WKA, GKA, and MA tephras (longer periods for the finest MA tephra). This pushed out air trapped within the specimen voids and replaced it with more water-soluble CO2. This facilitated full specimen saturation during the water saturation phase. The specimen saturation was carried out using a ramp function pushing water through the specimen and, thereafter, maintaining an effective stress σc′ of 20kPa. The back pressure values required ranged between 350 and 400 kPa. B values greater than 0.95 were observed after saturation. Following saturation, specimen consolidation was performed under effective confining stresses (σc′) of 50, 100, and 200 kPa for varying periods, dependent on the material and density. Consolidation was considered complete when a volume change of less than 5 mm3 was observed over 30 min.
Monotonic drained and undrained shearing was, thereafter, applied to the specimens using axial compression. These enabled the study of volumetric strain and pore pressure evolutions, and the responses plotted afterwards were analyzed with the development of deviatoric loads throughout the tests. All tests were strain-controlled, loading at a rate of 0.2 mm/min for WKA and GKA, and 0.01 mm/min for MA (a lower rate for MA was chosen due to the greater time taken to reach primary consolidation). The triaxial tests were performed up to 35% axial strain to characterize the specimens’ responses under large strains. In the tests, the soils’ behavior approached constant stress and volumetric strain state at higher strain levels with localizations in the specimens. The drained tests involving dilatancy were extrapolated from the peak stress state to account for these irregularities. Also, tests not propagating towards higher strain levels were due to factors such as maximum apparatus axial load being reached.
A total of 18 drained and 18 undrained monotonic compression tests, along with 6 isotropic compression tests, were performed. The details of the testing program are provided in Table 4.

4. Test Results and Discussion

4.1. Effects of Gradation and Chemical Composition on Shear Response

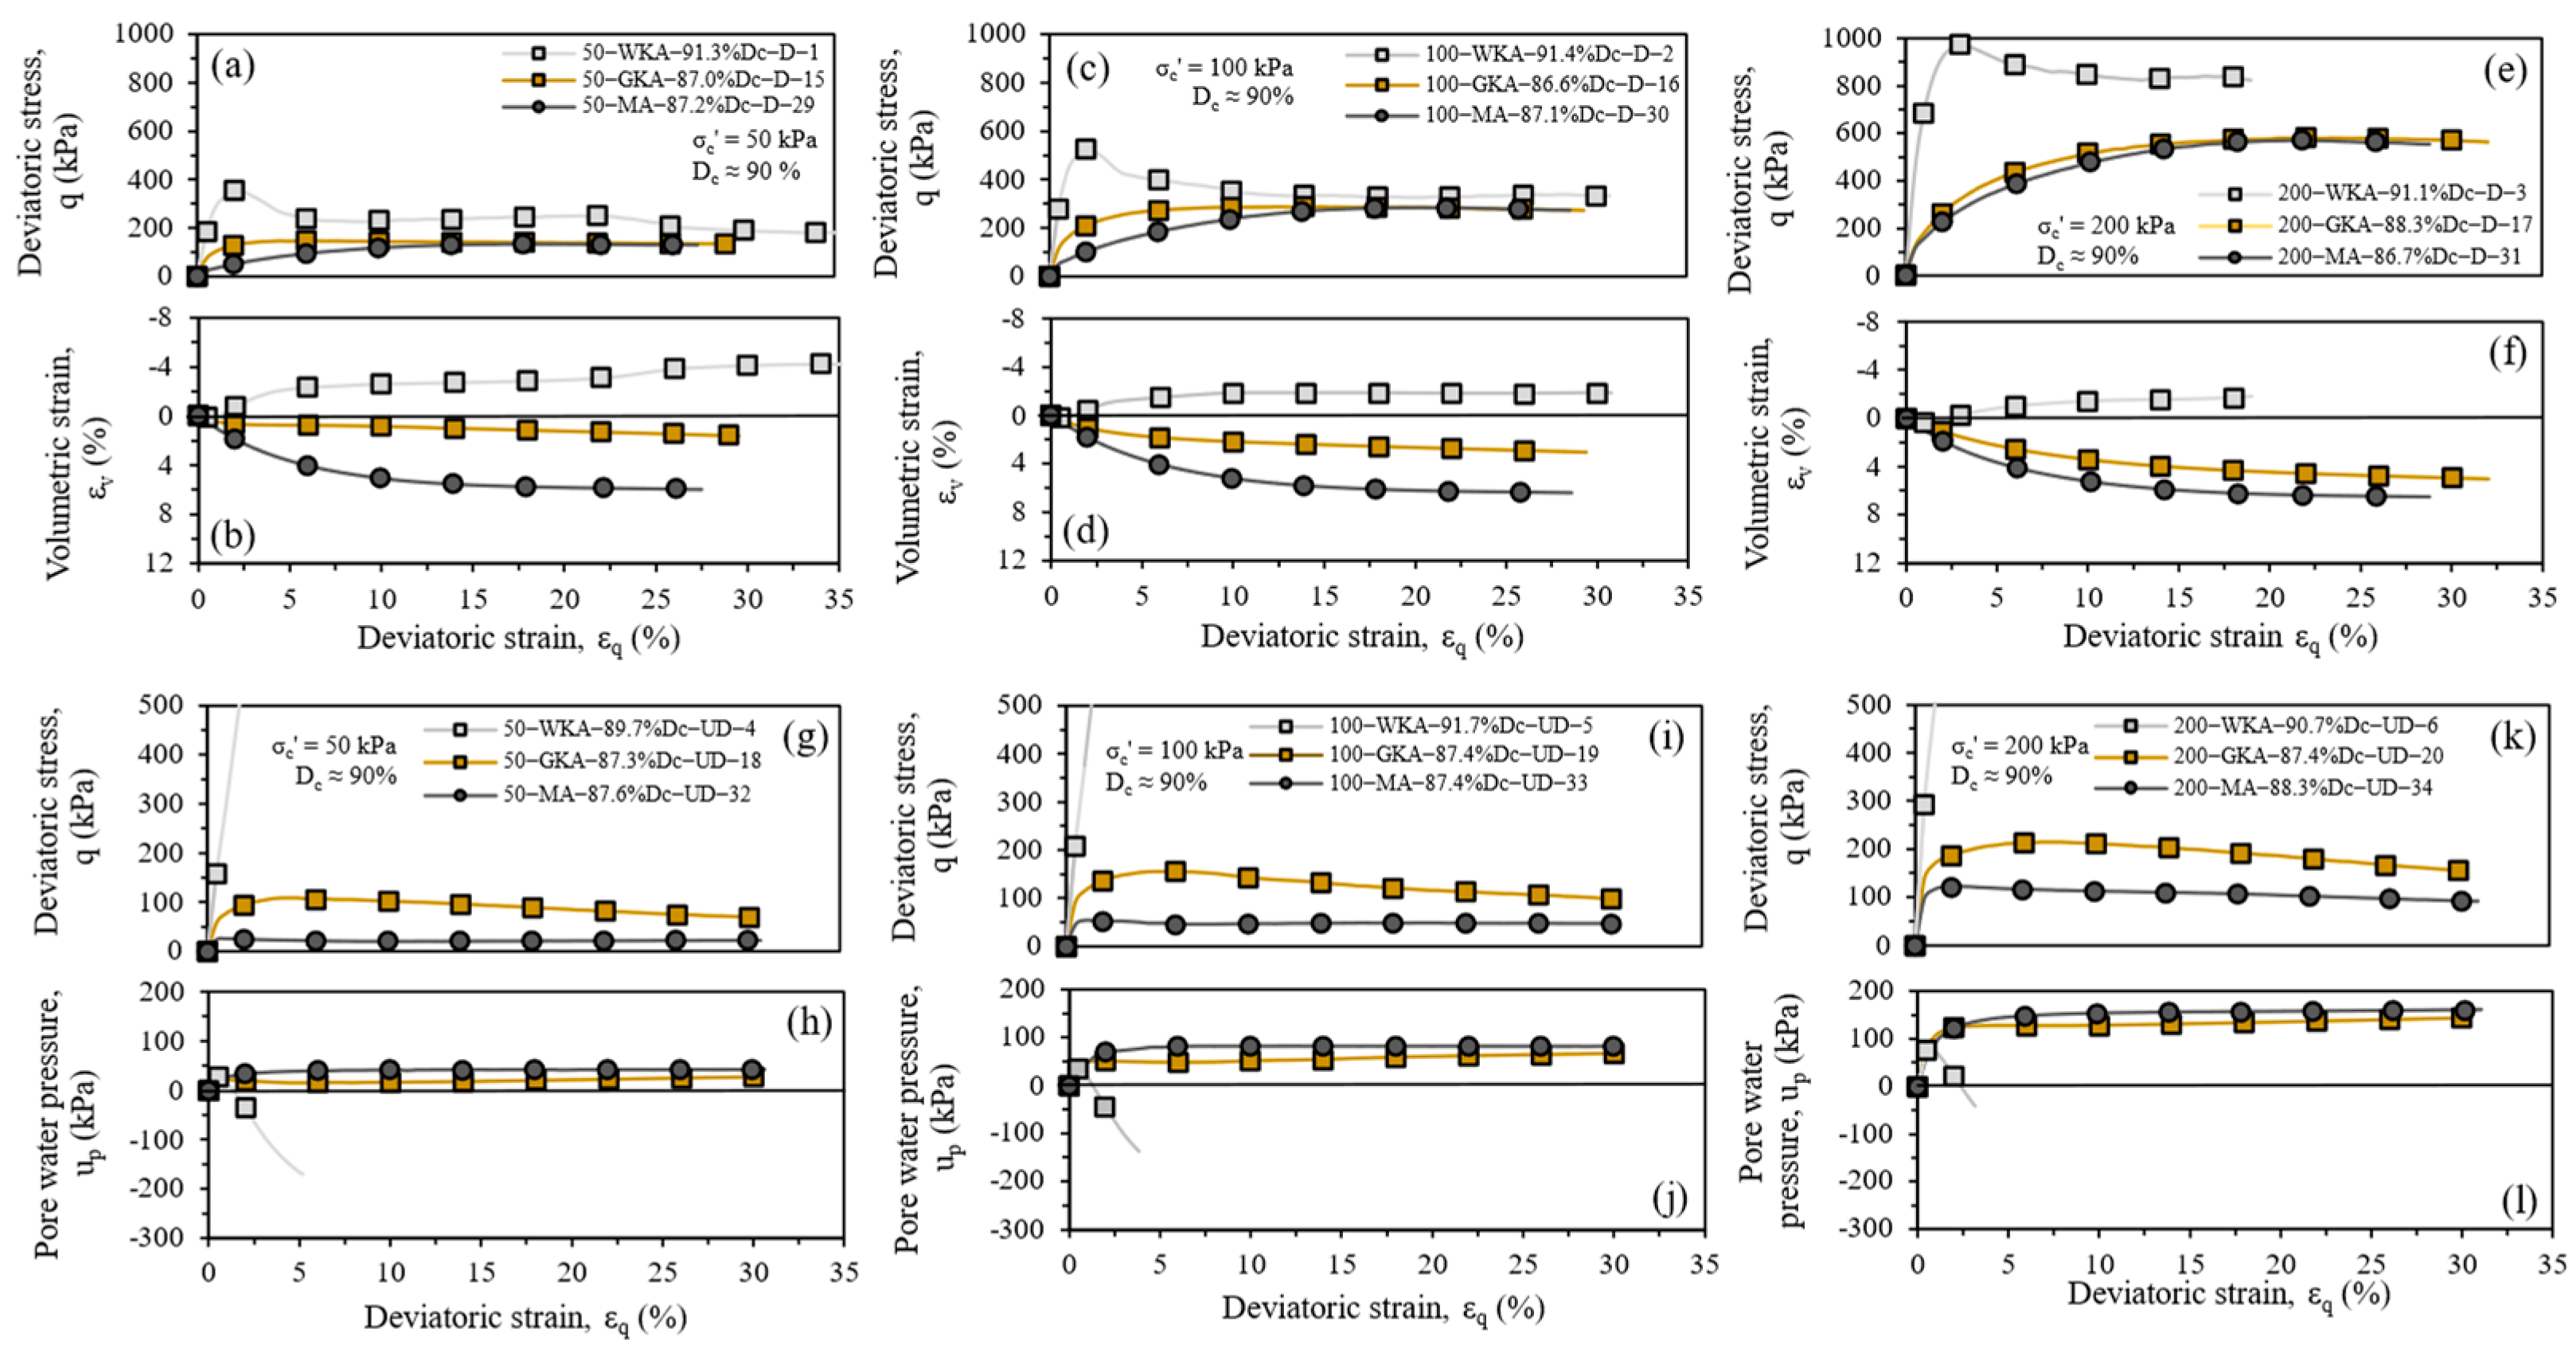
Figure 7 presents the plots of deviatoric stress (q), volumetric strain (εv), and pore water pressure (up) against deviatoric strain (εq) for all three types of tephra with Dc ≈ 90% under σc′ = 50, 100, and 200 kPa. The shear response pattern of tephras was dependent on particle gradation and geochemical characteristics. It was observed that the tephra WKA, with the lowest degree of weathering (as indicated by WIP and CWI values) and coarsest gradation, displayed the highest shear strengths accompanied by a peak attainment at the lower σc′ = 50 kPa (Figure 7a). At the same σc′ level, the shear strength values were smaller for intermediately weathered GKA (slight peak and finer) and most weathered MA (no peak and finest) tephras. With the increase in σc′ from 50 to 200 kPa, the tephras WKA, GKA, and MA possessed relatively higher peak strengths (qp) and/or residual strengths. At a similar Dc (≈90%), the drained stress–strain curves displayed strain-hardening followed by post-peak strain-softening for the granular WKA, and no peak responses for the less granular GKA and dominantly fine-grained MA (Figure 7a,c,e). The rise of σc′ also altered the volumetric deformation behavior of the tephras from positive to negative dilation with volumetric compression taken as positive and dilation as negative. Out of the three tephras, MA was the oldest and fine-grained the most compressive; GKA intermediately weathered but was more compressive than the geochemically identical (and primarily dilative) WKA (Figure 7b,d,f).
As shown in Figure 7g–l, the undrained shear test results up to 200 kPa showed an increasing strain-hardening and dilative response with subsequent lower development of negative pore water pressures for granular-rhyolitic WKA. The obtained stress–strain relationships for WKA showcased stiffer dilative undrained responses at the low strain levels, and had to be stopped due to the capacity of load cell being reached. In comparison to WKA, the tephras GKA and MA exhibited strain-hardening behavior followed by a gradual lowering in shear strength (strain-softening behavior) (Figure 7g,i,k). The higher qp values, with the increase in σc′ from 50 to 200 kPa for GKA than MA, could be attributed to the lesser weathered nature of the former tephra. The accompanied up were evidently higher for fine-grained MA than GKA at the tested σc′, but the responses seemed to be reaching a constant state of deformation, i.e., strain-softening, indicating the eventual loss of water–tephra bonding forces (Figure 7h,j,l). It is well accepted that the peak shear strength is jointly governed by the critical state strength, dilatancy, and interlocking mechanisms [34]. On a similar basis, WKA appeared to possess the highest peak shear resistance among the tested tephras due to better interlocking and higher stress transmission through the coarser, least weathered silty sand assembly.
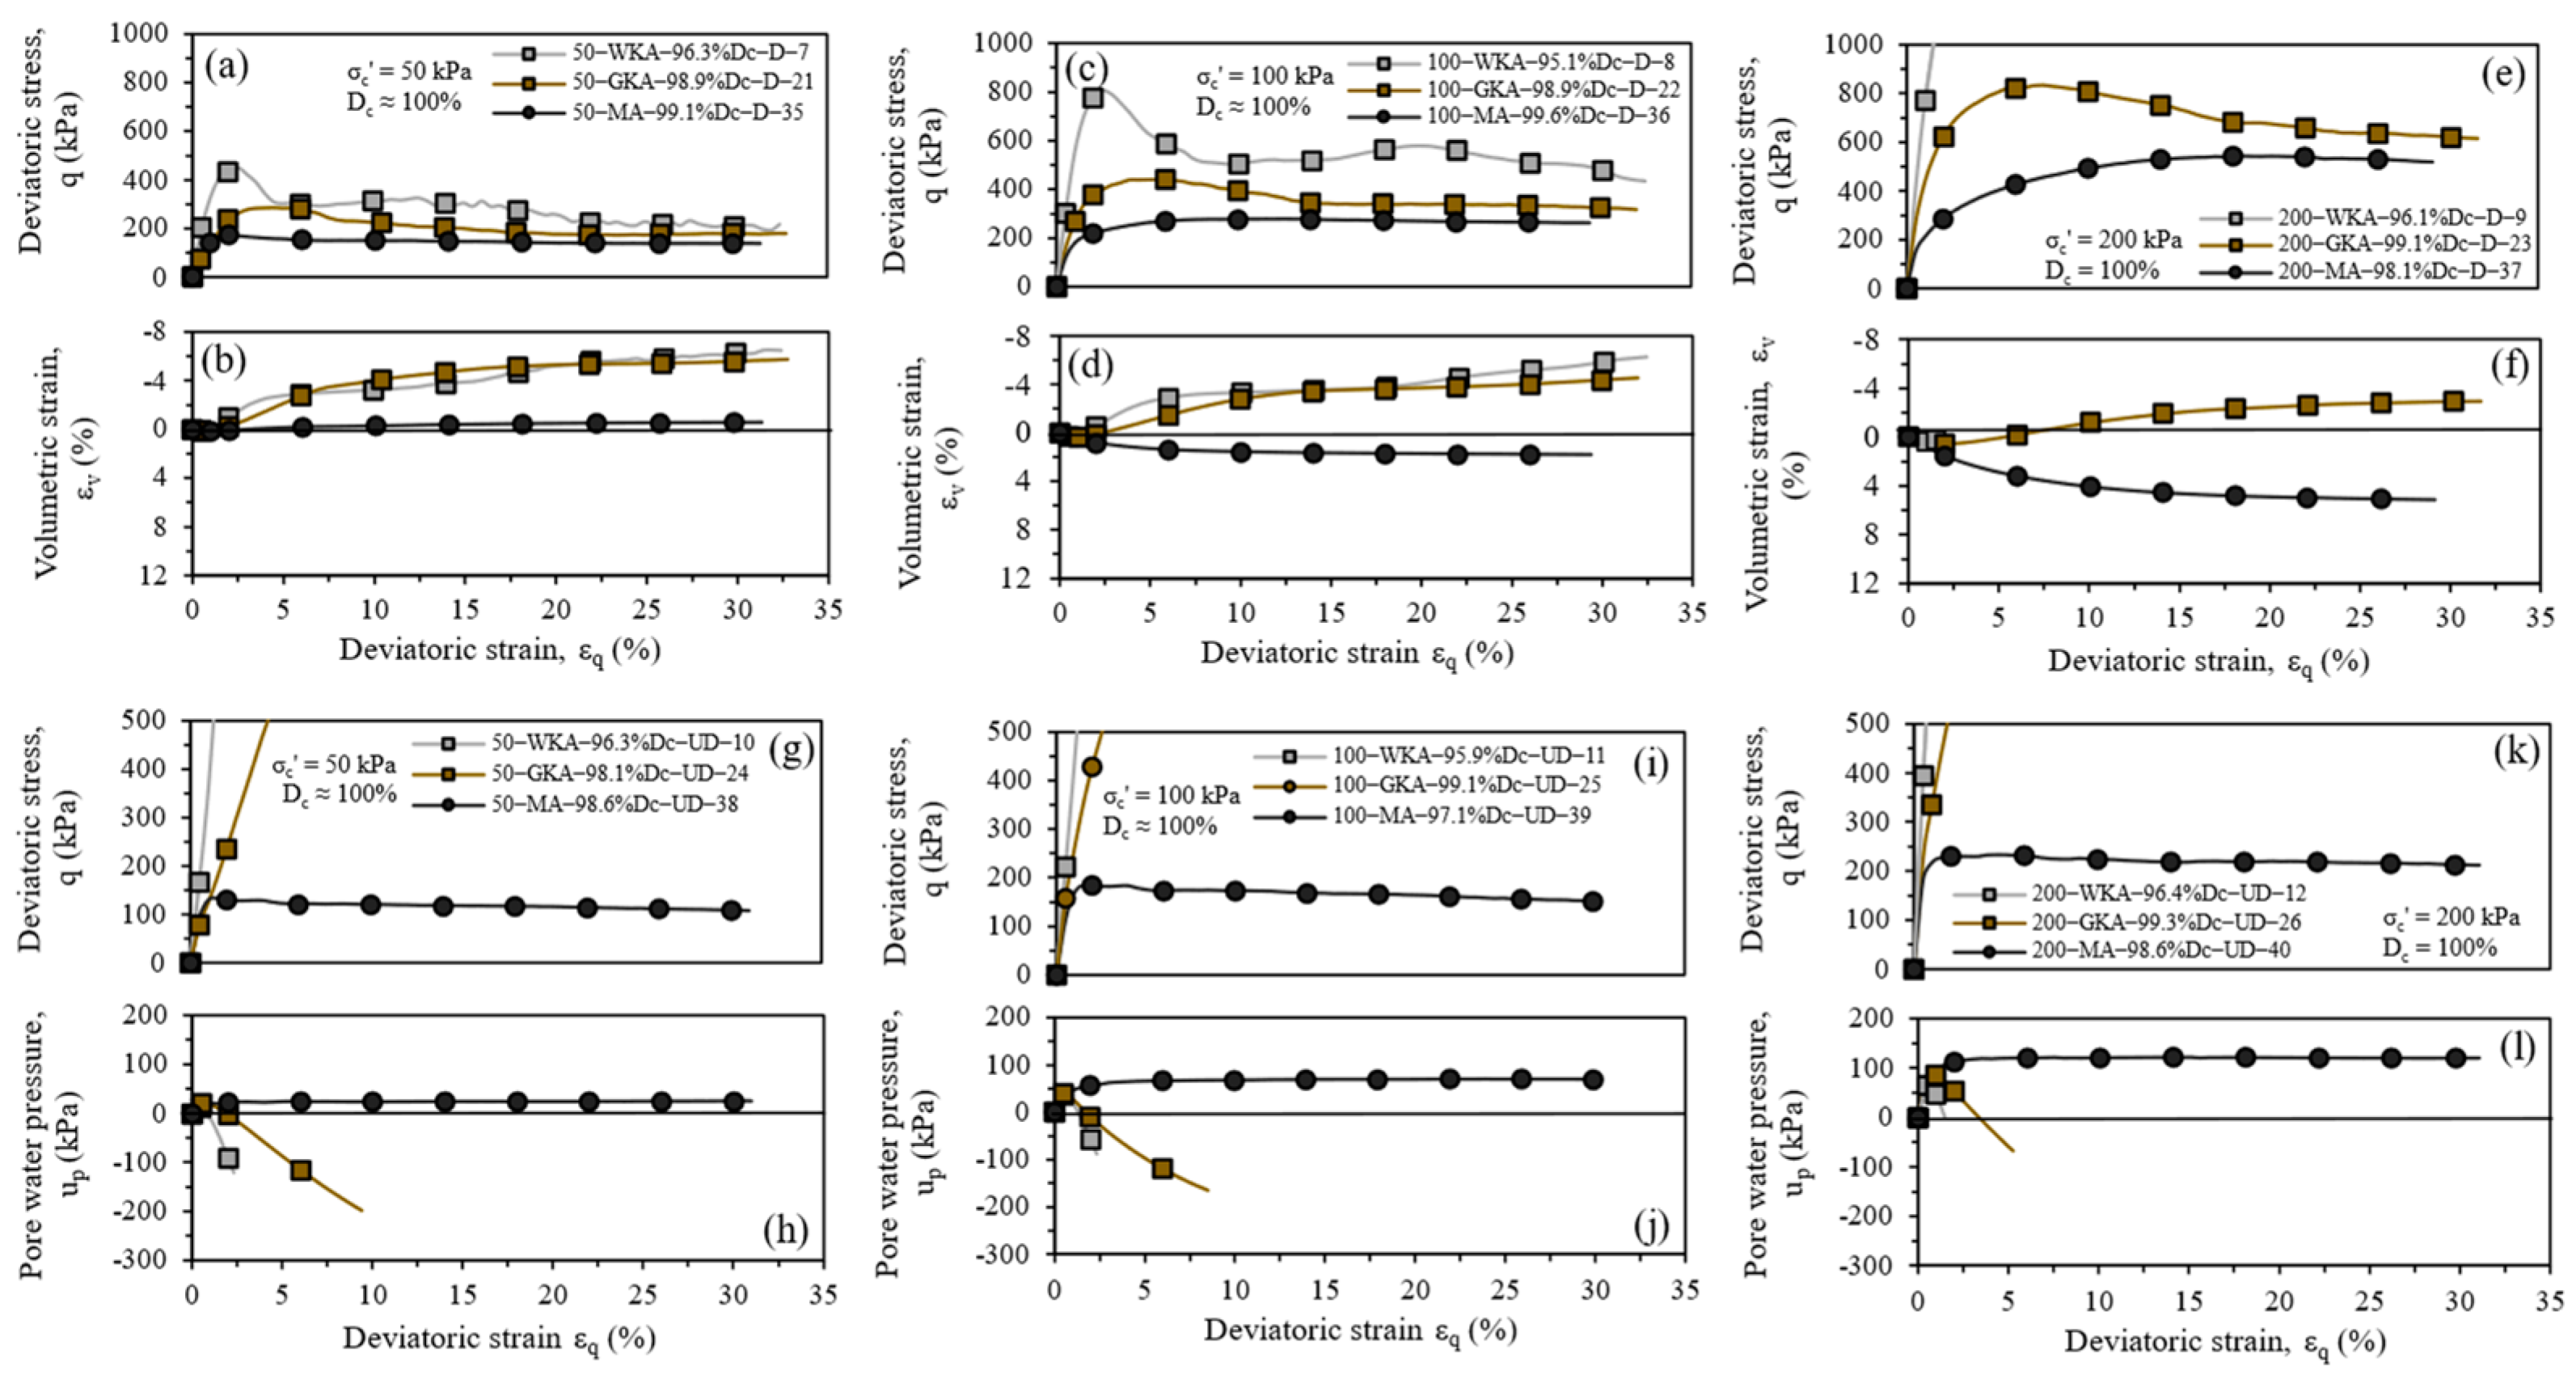
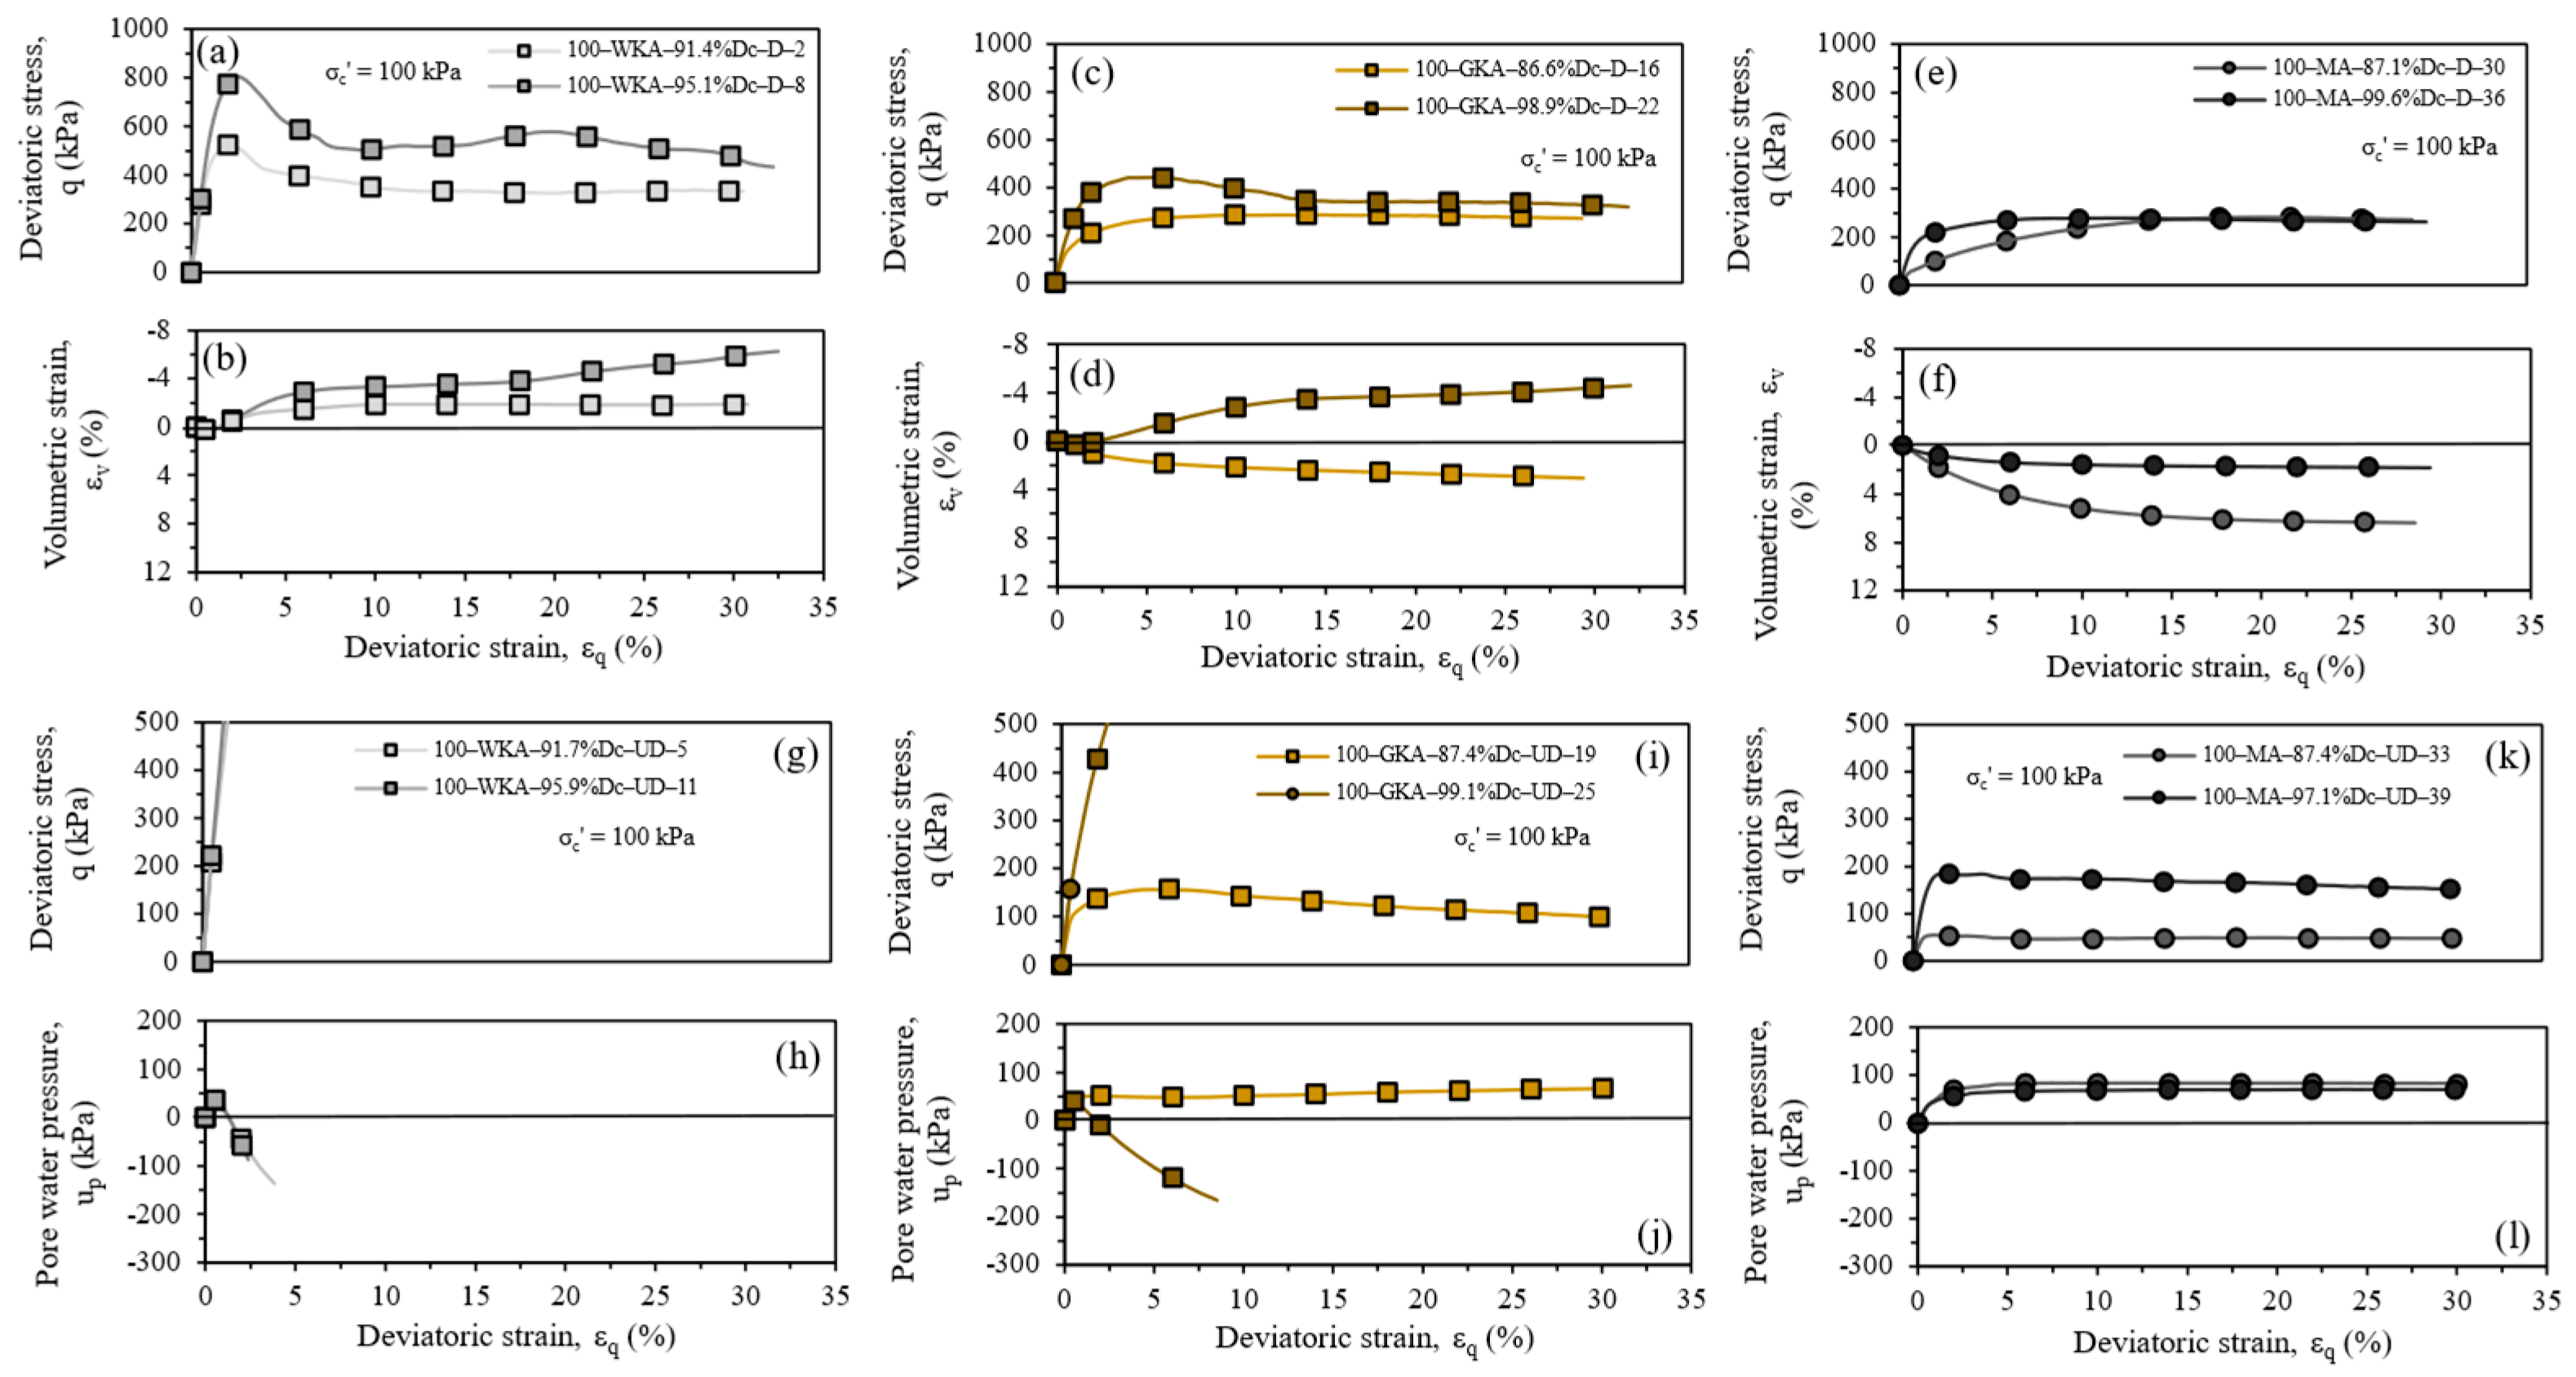
Figure 8 presents monotonic shear responses for the three tephras compacted at Dc ≈ 100% under σc′ = 50, 100, and 200 kPa. At Dc ≈ 100%, under increasing effective confining pressures, the tephras expectedly possessed higher peak and end strengths (Figure 8a–f). In comparison to lower Dc ≈ 90%, the drained stress–strain curves at higher Dc ≈ 100% displayed strain-hardening followed by post-peak strain-softening for GKA (with a similar trend for WKA), whereas the volumetric responses became more dilative, although similar trends of contractive volumetric responses were observed at greater σc′. In terms of undrained strengths at higher Dc ≈ 100% and increasing σc′ (Figure 8g–l), comparatively higher deviatoric stresses and pore water pressures were obtained for MA, whereas the stresses and pore water pressures for GKA turned out to be dilative and negative (identical behavior to WKA).

4.2. Effects of Degree of Compaction and Effective Confining Pressure on Shear Response

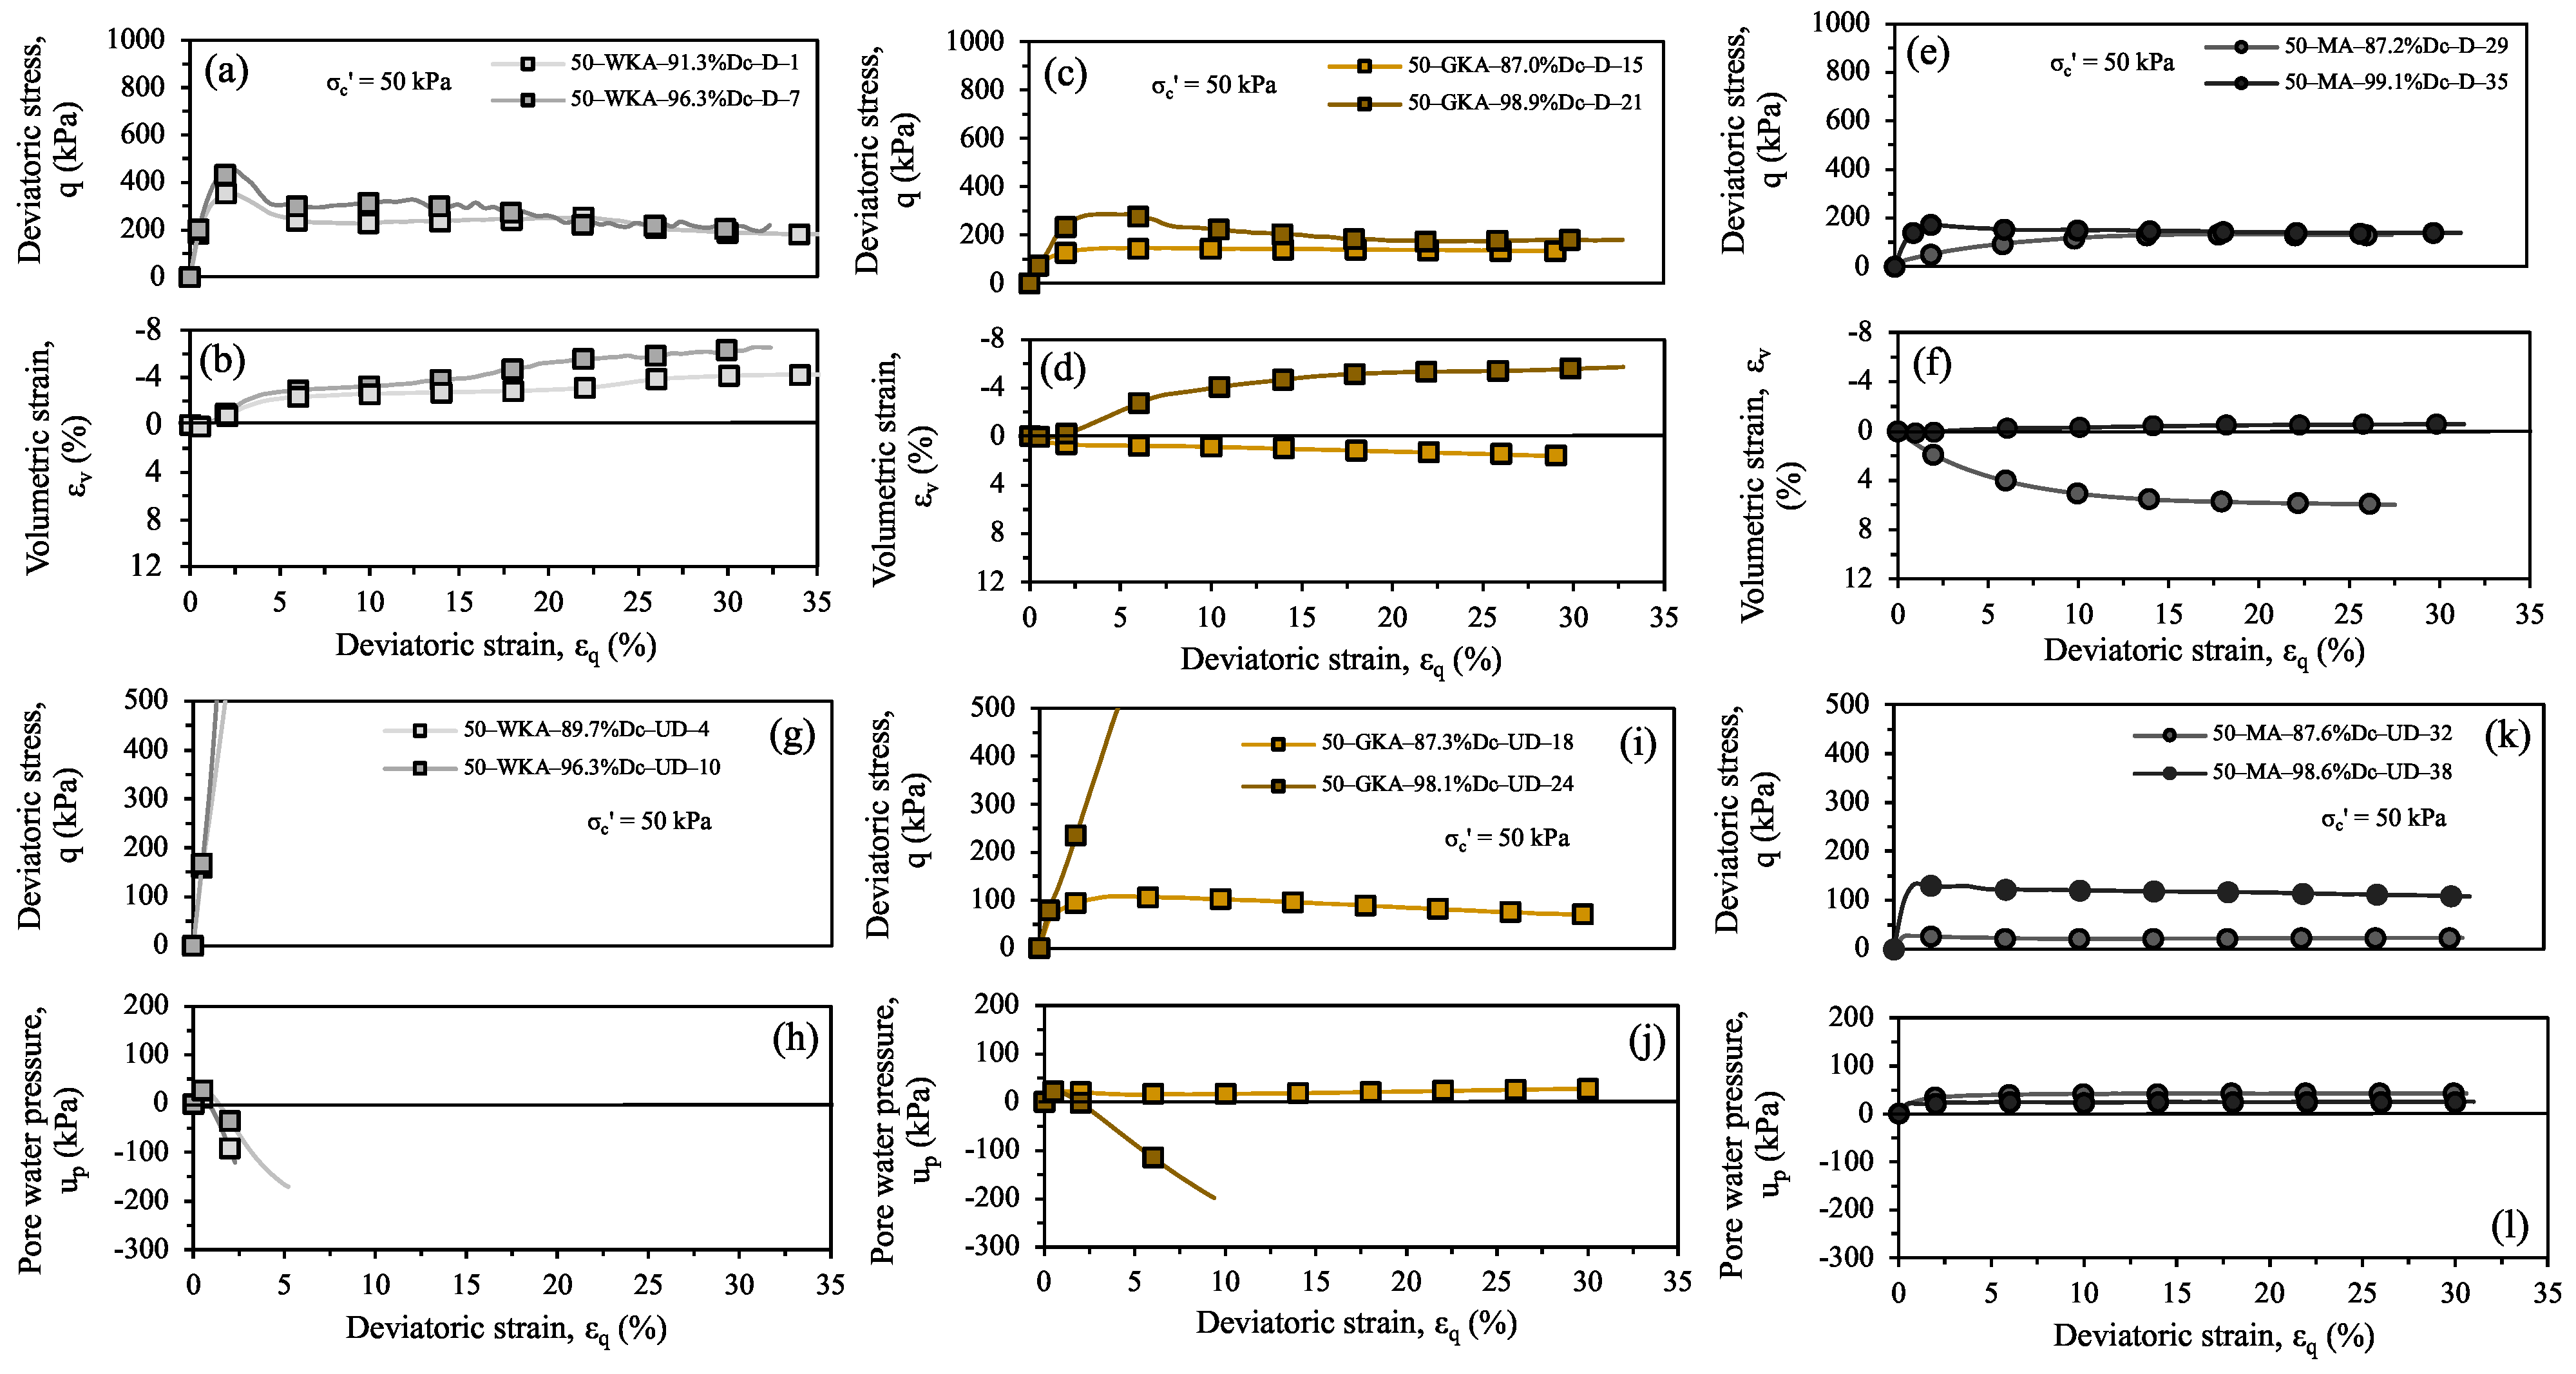
Figure 9, Figure 10 and Figure 11 show the relationships between q, εv, and up against εq for drained and undrained tests on the three tephras at different Dc under σc′ of 50, 100, and 200 kPa.
From the drained tests (Figure 9a–f, Figure 10a–f and Figure 11a–f), it could be determined that a rise in Dc significantly increased the initial slope of stress–strain curve, peak, and end shear strength. In terms of volumetric behavior, the dilation (for WKA, GKA) or less compressive (MA) behavior was intensified when increasing Dc. Alternatively, more compressive behavior was evident when increasing σc′ at the same Dc [35]. As also noticeable, the increasing Dc altered the stress–strain curve towards higher post-peak strain-softening behavior for WKA, and from a no peak to peak behavior for GKA. Peak behavior was non-existent for MA tephra due to its very compressible nature. In addition, the increasing Dc decreased the axial strain level at which the peak shear strength occurred. The interlocking mechanism was activated in the dense specimens at an earlier shearing stage for WKA and GKA specimens, whereas the lesser movement and rearrangement of fine-grained particles restricted the appearance of peak shear strength for MA. Such influences have also been reported for hard-grained and weak-grained sands in previous studies [36,37]. The deviatoric stress q of tephras appeared to be converging to a stable value as the εq progressed at the same σc′, regardless of the Dc. The observation of the relatively constant volume state of specimens at larger strains indicated that the critical state could be reached by tephras [38]. However, appearances of shear bands or localizations might occur after reaching peak stages of shearing.
In the case of undrained tests (Figure 9g–l, Figure 10g–l and Figure 11g–l), the increase in Dc rendered varying stress–strain responses of tephras, with WKA remaining primarily dilative and exhibiting increasing strain-hardening, GKA changing from strain-softening to rising strain-hardening, and MA revealing predominantly strain-softening behavior. This was also reflected in the development of up with responses being negative, transitioning from negative to positive, and remaining entirely positive for WKA, GKA, and MA tephras, respectively.
The changes observed in stress–strain behavior were attributable to particle breakage in the shearing phase. The great influence of particle breakage on the shear strength and deformation of sands in drained and undrained conditions have also been examined in the past studies [9,39,40]. The shear strength dependence on the confinement stress and degree of compaction have been confirmed in this experimental investigation. It was summarized that the shear strength of tephras was dependent upon Dc, σc′, gradation, and mineralogy.
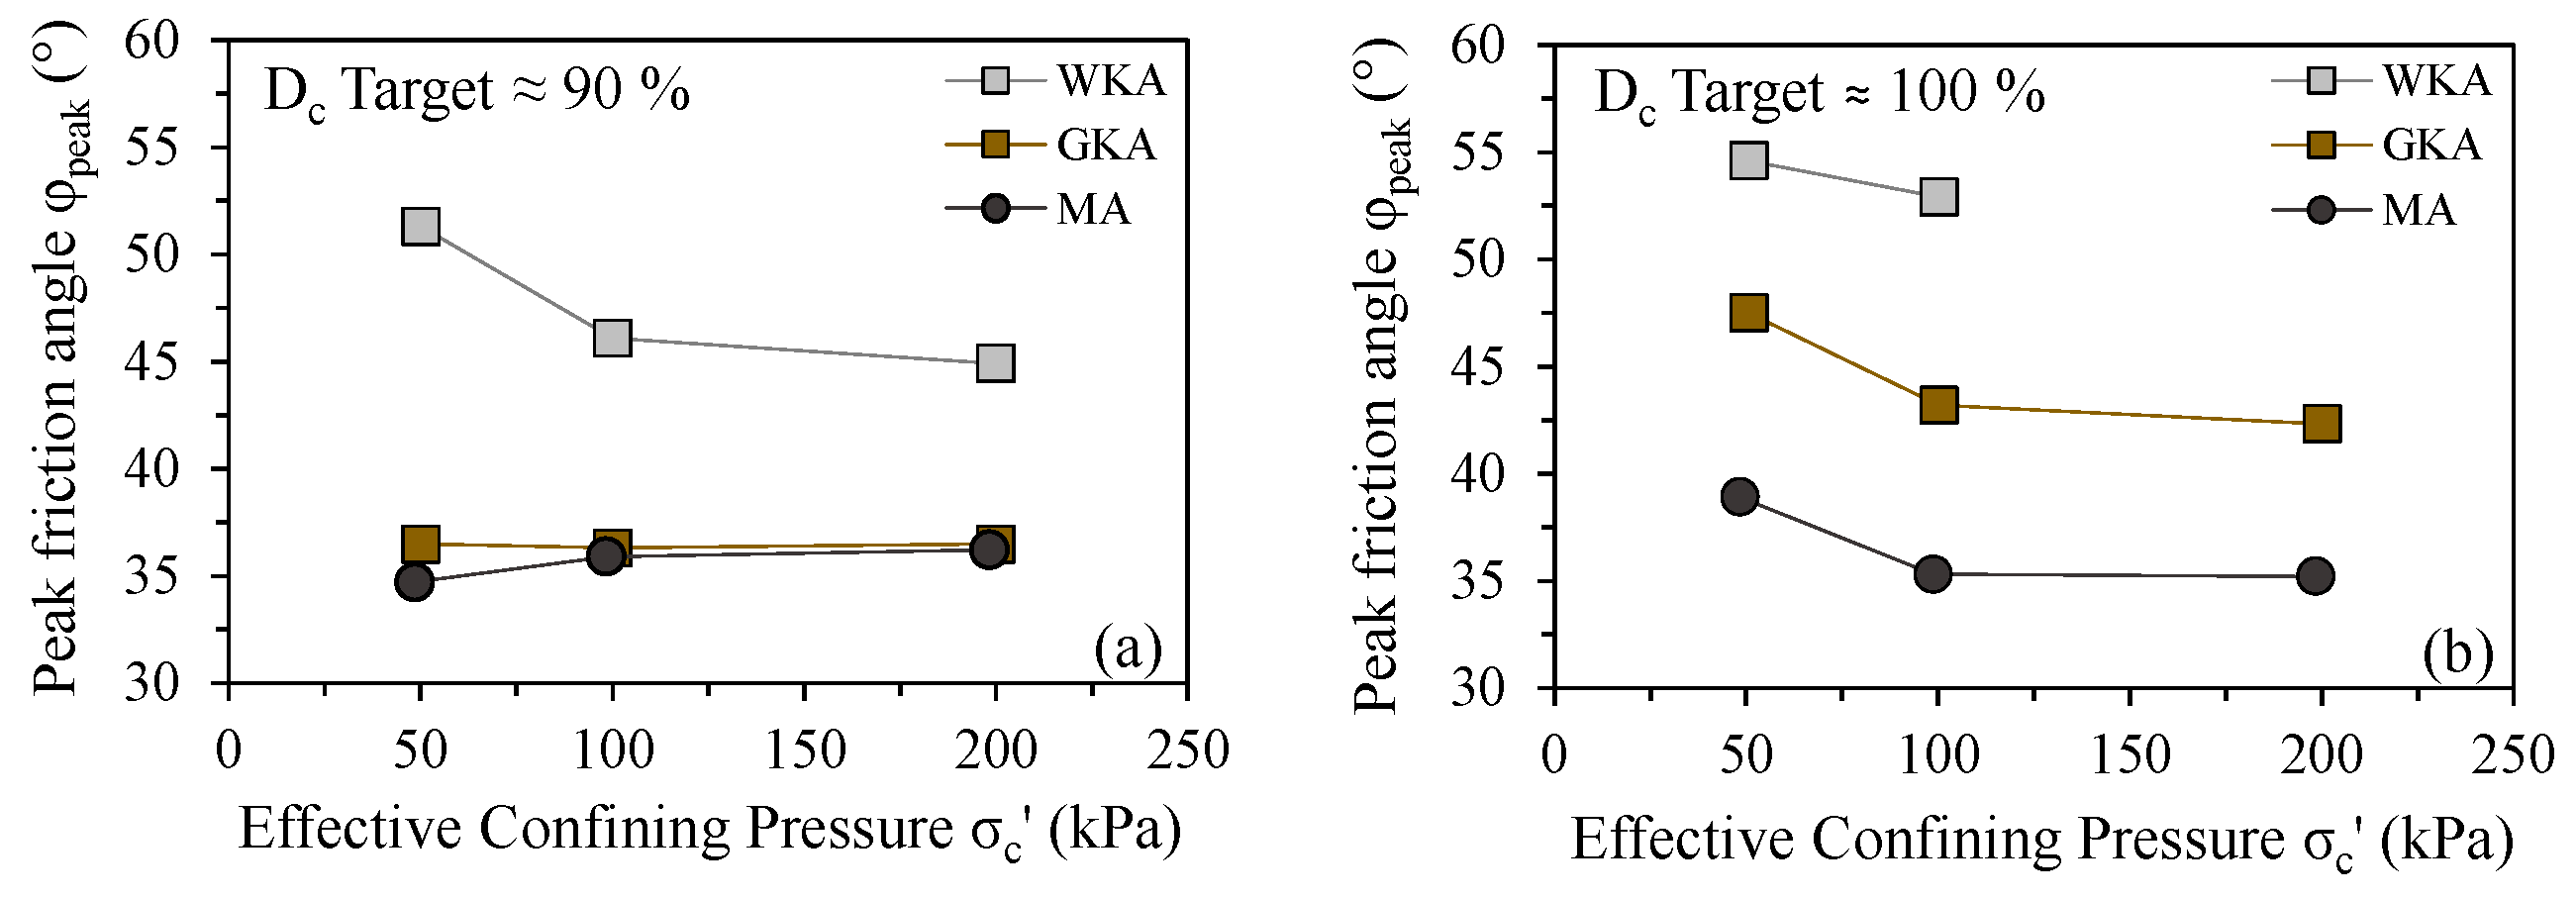
Figure 12 shows the variations in peak friction angle (φpeak) of all three types of tephra with varying levels of σc′. The variations in φpeak with Dc are also displayed in Figure 13. Overall, the test results indicated that the φpeak displayed an increasing tendency with the decrease in σc′ and rise in Dc. Slight deviations existed for MA tephra due to its fine-grained nature. The test results also revealed that a φpeak > 35° was measured for tephras with Dc ≈ 90%. A φpeak > 42° could be acquired for WKA and GKA tephras with Dc ≈ 100%. A higher φpeak indicates a higher shear strength. For WKA, a much higher φpeak with a range of 51~55° was noticed at σc′ = 50 and 100 kPa at both Dc. Among the three tephras, the angular and least weathered grains contributed to a greater interlocking effect, thereafter increasing the inter-particle shear friction and improving the peak shear resistance in WKA. In Figure 14, the friction angle and cohesion values, obtained from the Mohr–Coulomb criterion, are presented in terms of effective and total stress conditions. With reference to the effective stress conditions, the least weathered WKA demonstrated the highest friction angle and least cohesion (φ′ = 41.0°, c′ = 0.2 kPa), followed by the intermediately weathered GKA (φ′ = 35.8°, c′ = 3.7 kPa) and the most weathered MA tephra (φ′ = 33.0°, c′ = 15.0 kPa). In addition, considering total stress conditions for undrained tests, the apparent drop in friction angle φud was evident for GKA and MA tephras. The cohesion values (c′ or cud) ranged up to 26.0 kPa for the tested silty sand tephras. It was noted that the effective friction angle values were greater (WKA) or comparable (GKA and MA) to natural hard-grained sands and other volcanic materials [13,41,42].

4.3. Stress Ratio, Dilatancy, and Pore Pressure Evaluations

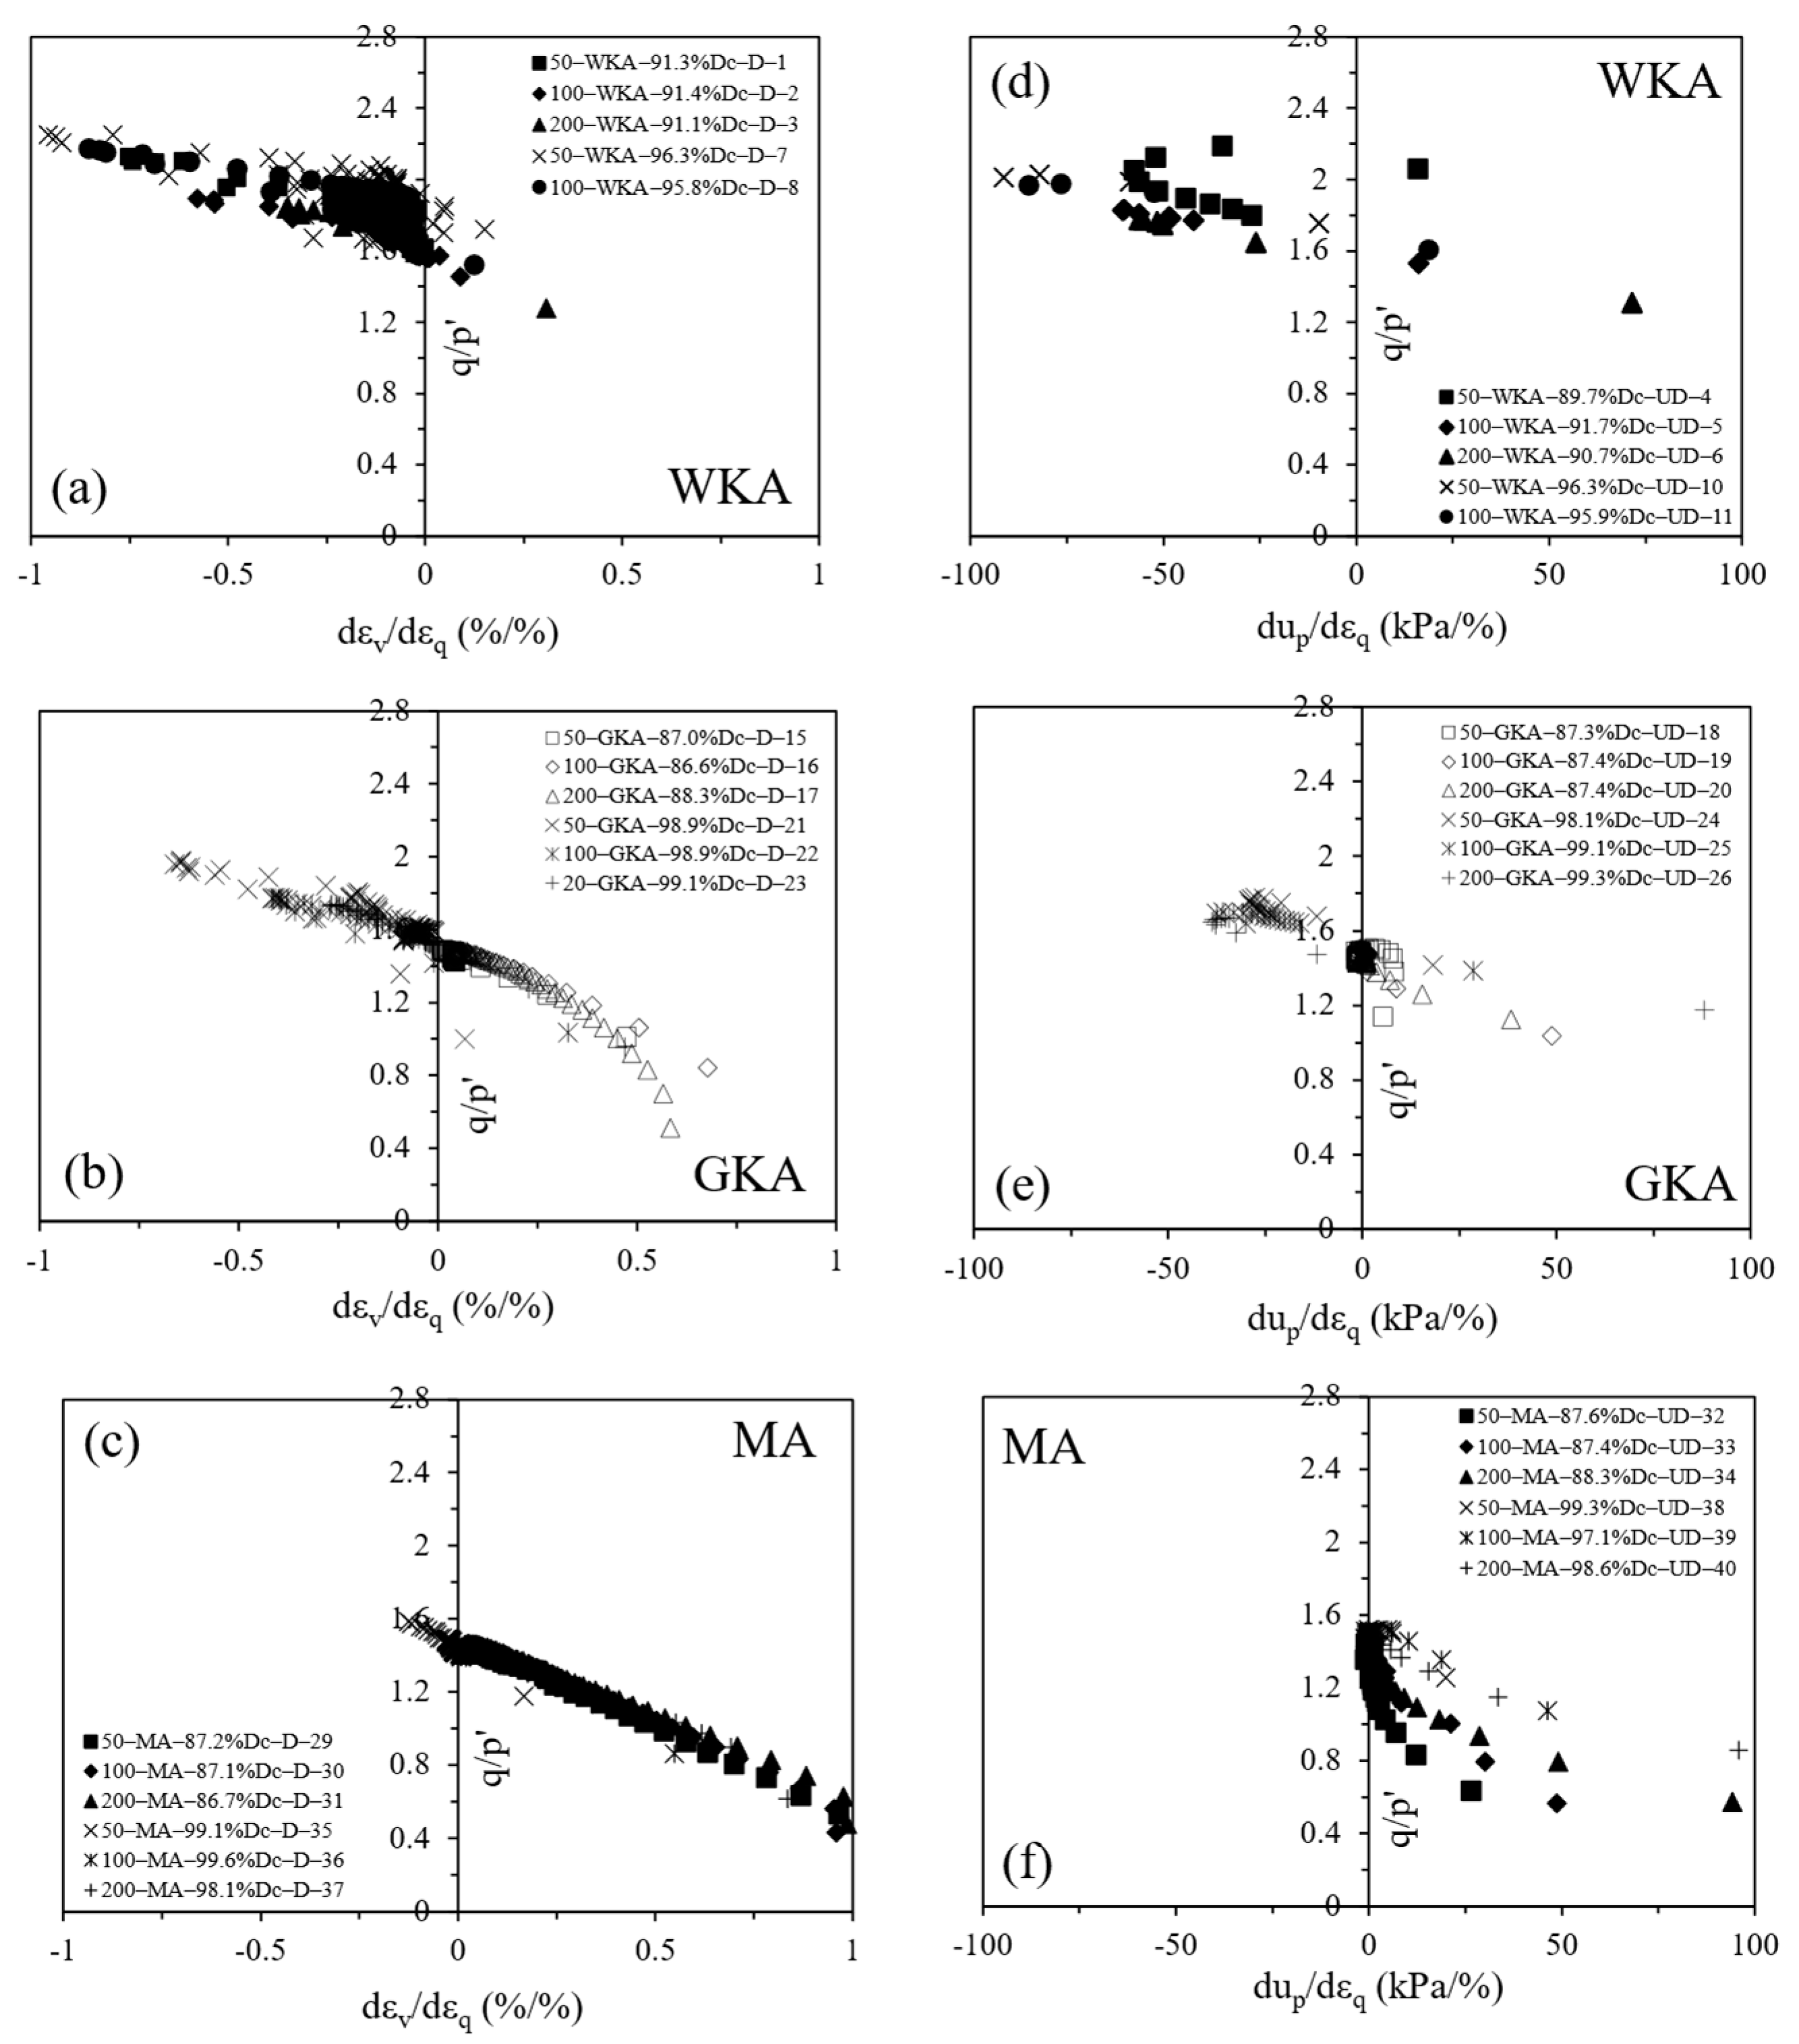
The stress–dilatancy relationship describes the evolution of the stress ratio and strain rate of tephras during drained shearing. Accurate analysis of the stress–dilatancy relationship is important to establish the elastoplastic framework to enable the prediction of soil behavior. In past studies, some well-known expressions have been proposed to characterize the stress–dilatancy features of soils [43,44,45,46,47,48]. The pore pressure changes along with stress ratios were also measured to further establish the responses of tephras during undrained shearing. The changes in value of dilatancy (dεv/dεq) and pore pressure (dup/dεq) corresponding to the stress ratio (η = q/p′, where p′ represents the mean effective stress) obtained at the end of the tests were used as indicative measures to adjudge whether the critical state (dεv/dεq and dup/dεq ≈ 0 at critical state) had been reached. These values are also listed in Table 4. dεv, dεq, and dup are the volumetric strain, deviatoric strain, and pore water pressure increments, respectively.
Figure 15a–c display dilatancy characteristics of the three tephras for different Dc and varying σc′. The results displayed an initial contraction (dεv/dεq > 0) followed by dilation behavior (dεv/dεq < 0) for WKA. The dilation of WKA enhanced with the rise in Dc. This behavior of initial contraction followed by dilation was also noticeable for geochemically identical GKA (to WKA) at higher Dc, but the results became compressive at lower Dc. Similar compressive behavior was predominantly evident for fine-grained and the most weathered MA tephra. As evident in Figure 15a–c and Table 4, the dεv/dεq values obtained at the end for MA were approximately zero, indicating proximity to the critical state.
The changes in pore water pressure (dup/dεq), along with the η of the tephras, are also presented in Figure 15d–f. The undrained response of WKA appeared to be largely dilative, showing the development of negative pore water pressures, along with the tephra itself being away from the critical state (dup/dεq = 0). Similar dilative behavior was also noticed for GKA at higher Dc ≈ 100%, although the development of negative pore water pressures was less in comparison to WKA, owing to its more weathered nature. On the contrary, the GKA at lower Dc ≈ 90% and MA exhibited compressive behavior, along with dissipation of positive pore water pressures and attainment of the closest proximities to the critical state condition (Table 4).
Overall, the WKA and MA demonstrated primarily identical dilative and contractive responses, respectively, for both Dc, but the differences in behavior of GKA at lower and higher Dc were emergent. These distinctive behaviors are discussed in q vs. p′ plots in the next section.

4.4. Critical State and State Parameter

The critical state is defined as the state at which the soil continues to deform at constant stress and constant volume conditions [38]. After the determination of critical state, the state parameter ψ enables the measurement of relative closeness to the critical state. As defined by Been and Jefferies [49] in terms of void ratio, state parameter can be expressed as:
ψ = ec − ecs
where, ec is the void ratio after consolidation and ecs is the void ratio at the critical state.
In the current study, triaxial tests were performed at up to 35% strain levels. Mostly, WKA and GKA (at Dc ≈ 90%) specimens, and MA specimens (showing compression predominantly), were close enough to allow interpretation of the critical state, as they seemed to be approaching steady values of stress, εv and up (or negligible dεv/dεq and dup/dεq by the time of ultimate failure). The conditions at the end of these tests, as also indicated in Table 4, were therefore considered as representative of the critical state. However, by carefully looking at the εv response curves showing predominantly dilation, it was noted that the WKA and GKA (at Dc ≈ 100%), however, did not achieve the critical state fully. The deviations from the constant volume or stress states were accounted for due to shear banding or localization effects in the specimens, prominently after peak attainment. Several authors have suggested extrapolation procedures that allow for improved estimates of critical state conditions under drained and undrained conditions [50,51,52,53,54]. The method of Murthy et al. [52], originally introduced for undrained tests, was applied to drained tests in the current study. However, the remaining drained and undrained tests could not be included in the extrapolation analyses due to the increasing strain-hardening behaviors observed at the end. The typical examples for extrapolating the data to the critical state are given in Appendix A at the end of this paper.
A sigmoidal function was used for curve fitting and extrapolation purposes to determine the critical state. The extrapolation was also carried out considering the effect of localizations in the tested samples using the method suggested by Nova [45], as represented in Equation (5):
D = ( η M ) ( N 1 )
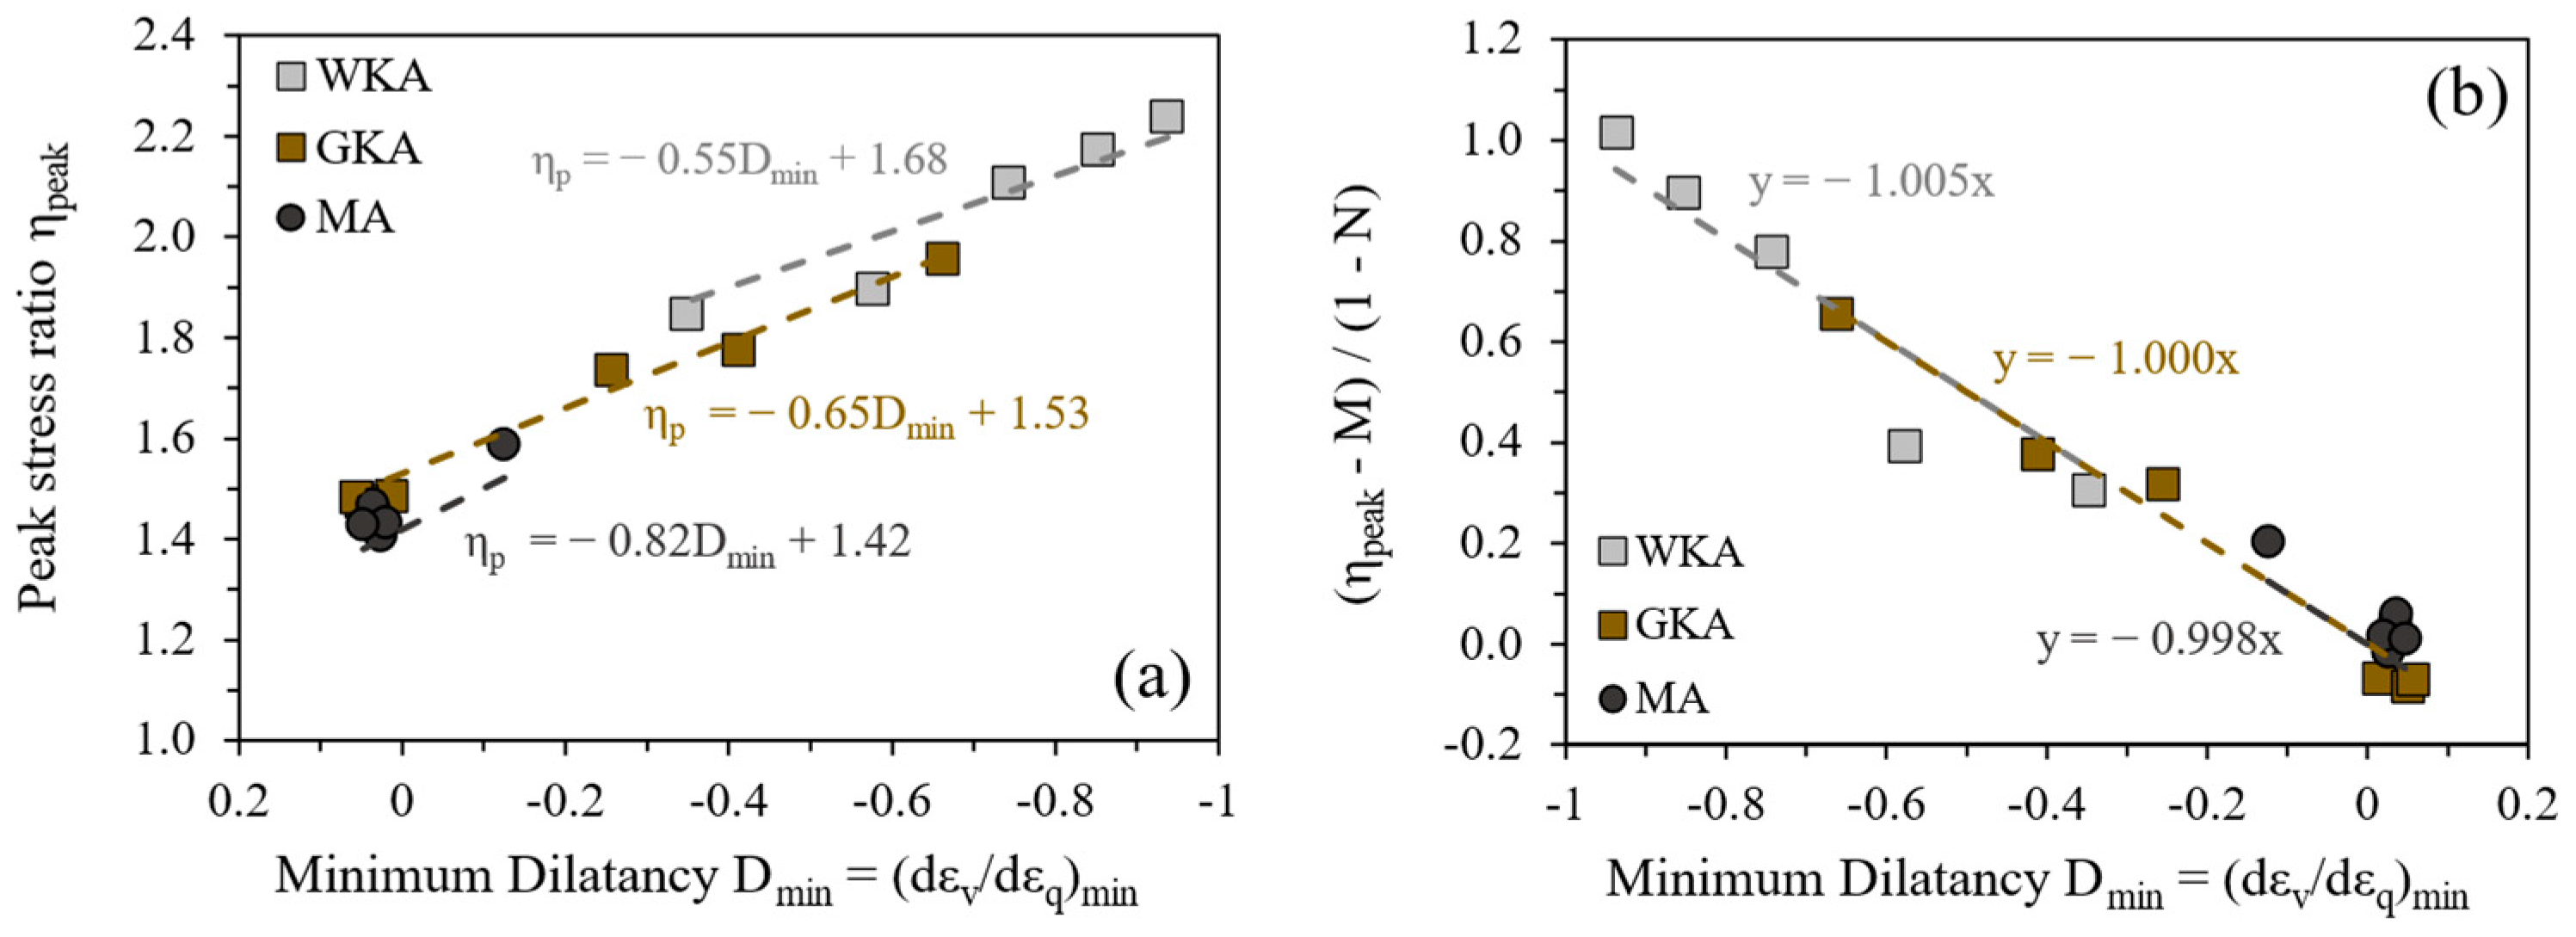
where, N is a density-dependent material property used for the modelling of the mechanical response of granular materials. The Nova’s rule [45] also takes into account the peak strength (ηpeak) of a larger number of tests, rather than the result of a single test. Thus, the flow rule proposed by Nova [45] was employed to assess the dilatancy behavior of different tephras in this study.
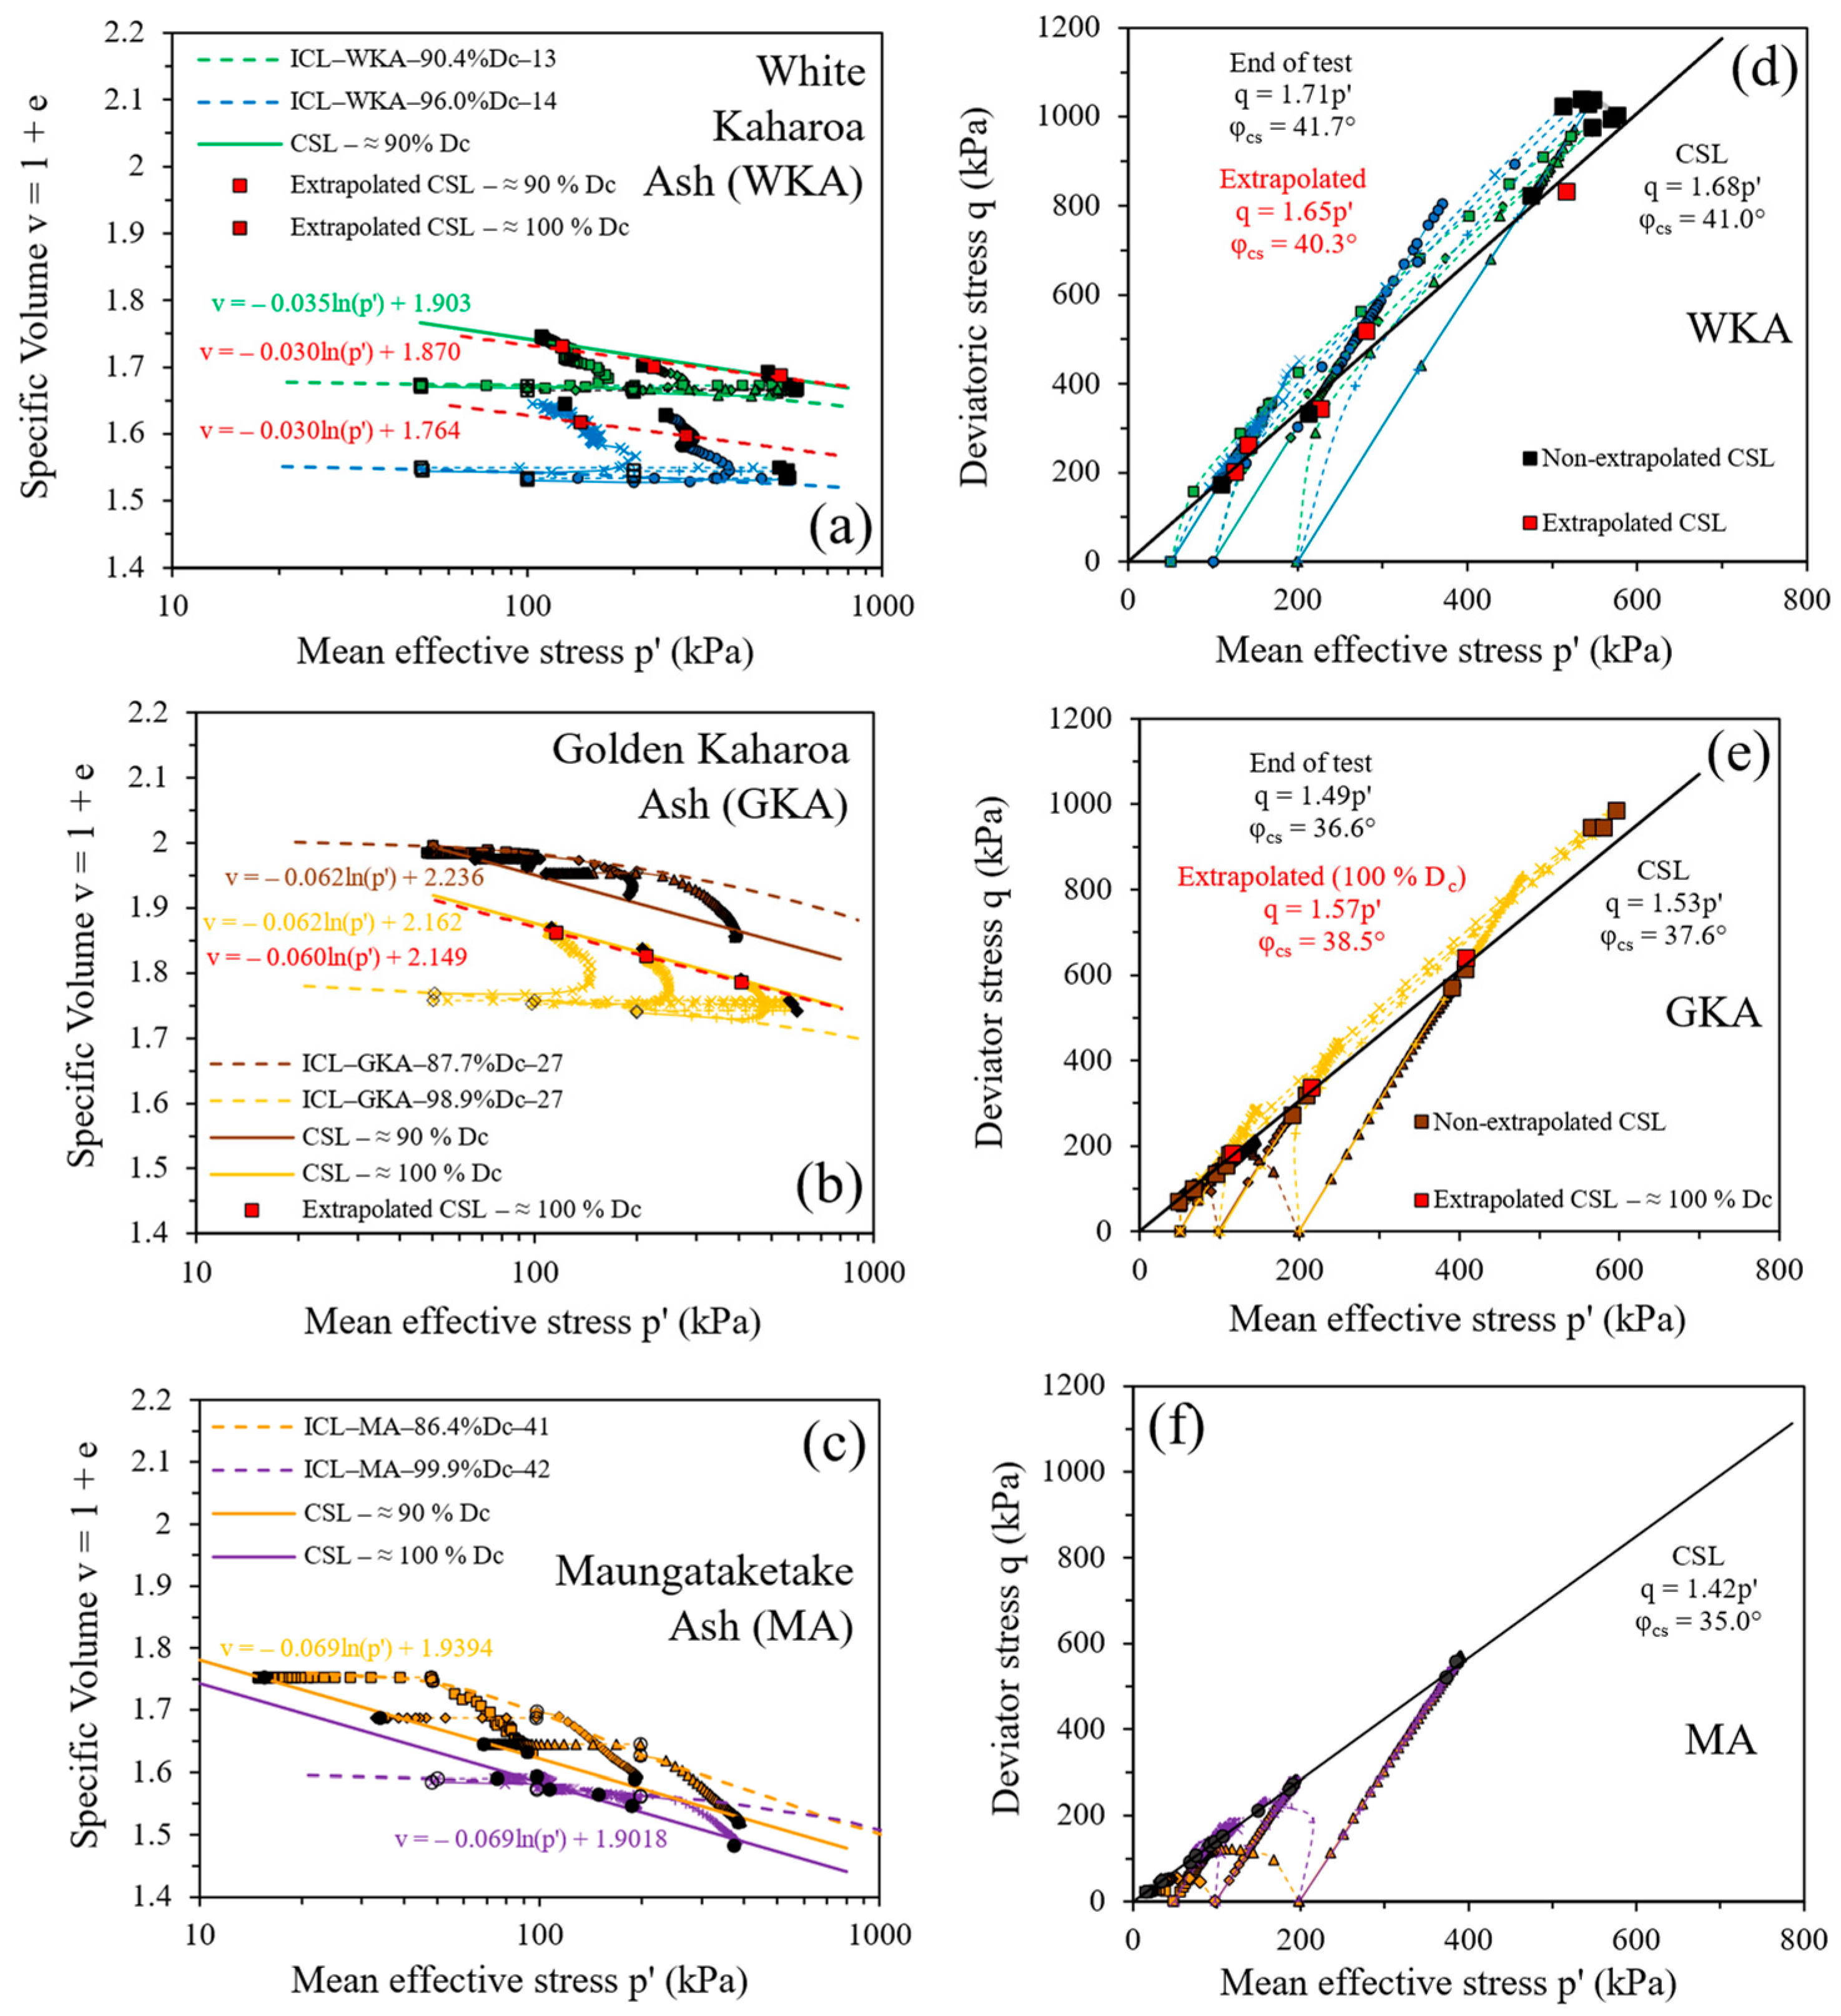
Figure 16 presents the ηpeak and (ηpeak − M)/(1 − N) plotted versus Dmin = (dεv/dεq)min for the three tephras (at different Dc), and the trend lines determined using Nova’s rule [45]. M is the stress ratio at the critical state and is determined as the intercept in the vertical axis of the trend line when the dilation rate (D) is instantaneously zero. M values of 1.68, 1.53, and 1.42 were obtained for WKA, GKA, and MA tephras, respectively. N varying between 0.18–0.45 were higher than the values of natural sands (N value between 0.20–0.30) [55]. The lower N value of MA (=0.18) was attributable to its sandy silt, and highly weathered, nature. The N value has been recommended as an index to assess the breakage of sand, and this approach was employed to examine the breakage of different tephras.

4.5. Critical State Line (CSL) Projection in v–p′ and q–p′ Planes

The evolution of critical state lines (CSL) for tephras is presented hereafter in terms of stress paths for different Dc during drained and undrained shearing. The effects of different Dc and drainage conditions on the behavioral responses and CSL are discussed. For the studied tephras, the change in specific volume (v) with respect to p′ is plotted in Figure 17. The relationship between v and p′ is described in Equation (6):
v = Γ—λ ln p′
where, λ is the slope of the critical state line and Γ is the intercept of the critical state line when p′ = 1 kPa. The calculation of v (=1 + e; where e is the void ratio) is based on the saturated weights and the dimensions of the specimens.
Figure 17 presents the stress paths of the tephras WKA, GKA, and MA during drained and undrained shearing. The data are represented in terms of stress paths in the q vs. p′ and v vs. p′ planes. Multiple critical lines of tephras were identified on the v vs. p′ plane (Figure 17a–c). As noticeable, the CSL of the compacted tephras descended downwards and towards smaller v values with increasing Dc. This seems to be in agreement with other studies carried out by Heitor et al. [56] and Winter et al. [57] on compacted coal wash and clinker ashes. It is interesting to note that the behavior of slightly weathered tephras confirms the critical state soil models, where soil particles are assumed to be rigid. Consistent higher particle crushing has seemed to cause the soil behavior of pure pumiceous sands to deviate largely from the current soil models [15]. However, the well-graded and fine-grained gradations of slightly weathered degree, with lower post-shear breakage values, seemed to comply fairly with critical state soil mechanics due to the protection effect of fines on coarser particles [8,12].
The amount of particle breakage for tephras increased with increasing Dc. The phenomenon of particle breakage led to the generation of smaller particles and fines (<0.075 mm), and the smaller void spaces were filled eventually. The results of particle breakage for the individual tephras are discussed separately in Section 4.7. The rise in the amount of particle breakage during the compaction process firstly altered the original particle gradation for the well-graded (WKA and GKA) and fine-grained tephras (MA) before proceeding to isotropic consolidation and shearing stages. The movement of CSL of geomaterials has been numerically and experimentally examined in the literature, and the initial gradation, particle textures, and mineralogy are regarded as the governing factors in determining the location of critical state lines [58,59,60,61]. It was observed that a family of CSL sands existed due to particle breakage and they paralleled each other. The slope of the critical state line was assumed to be independent of the degree of compaction, and drawn in accordance with the test results in this study. Bandini and Coop [62] and Xiao et al. [63] also noticed that the shift of critical state line was the result of a combination of vertical movement and rotation.
During the shearing stage, the tested triaxial specimens were prone to shear localization or banding occurrences, leading to possible effects on the critical state parameters. To account for such effects in predominantly dilative tephric materials such as WKA and GKA, certain extrapolation procedures were adopted. In the compression plane, extrapolation was shown to have moderate and slight effects on the critical state parameters for WKA and GKA tephras (Figure 17a,b,d,e). Extrapolated data yielded moderately and slightly lesser inclined CSL than the end-of-test data (approaching or near to CS) for WKA and GKA tephras (λext. = 0.030 and 0.060 vs. λend = 0.035 and 0.062). Higher λ for GKA in comparison to WKA was attributable to its finer-grained and more weathered nature. This was also reflected in the highest obtained λ value of 0.069 for primarily compressive MA tephra among the three tephras. The respective values also indicated that the end of the test condition was somewhat closer to the critical state condition in the six dilative drained tests for WKA and GKA tephras, initially appearing to approach the critical state condition. Non-extrapolated and extrapolated CSL lines for WKA and GKA exhibited fair and good agreement in the compression plane, i.e., the lines were essentially parallel to one another (Figure 17a,b), with moderate and slight differences in the CSL intercept at 1 kPa, Γ (1.940 vs. 1.870 for WKA at Dc ≈ 90% and 2.162 vs. 2.149 for GKA at Dc ≈ 100%). It is important to point out that the drained test results for WKA at higher Dc ≈ 100% showed significant dilation, and the expected critical state was evaluated with respect to the extrapolation procedure adopted.
An average Mcs was determined from the end of tests and extrapolated drained tests using the stress ratios q/p′, with the extrapolation procedural steps provided in Appendix A. For the undrained tests, q was observed to be increasing for WKA and GKA (at higher Dc ≈ 100%), therefore, the Mcs determined from drained tests were used only in these cases. The undrained behavior of GKA (at lower Dc ≈ 90%) and MA tephras indicated a special type of behavior upon reaching the critical state (discussed separately below). In comparison to the critical state parameters in the v–ln p′ space, extrapolation was also observed to have moderate effects on the stress ratio at the critical state (Figure 17a,b,d,e). The end of test stress ratio Me = ηe = (q/p′)e was 1.71 (φe = 41.7°) in comparison to the extrapolated Mext. value of 1.65 (φext. = 40.3°) for the WKA tephra. For the GKA tephra (compacted at higher Dc), the M values at the end and upon extrapolation were evaluated as 1.49 (φe = 36.6°) and 1.57 (φext. = 38.5°). The average or overall M values were evaluated as 1.53 (φ = 37.6°) and 1.42 (φ = 35.0°) for GKA and MA tephras. These critical state parameters upon extrapolation are presented in Table 5.
The stress paths also indicated significant differences in the behavior of the studied tephras at the considered degrees of compaction. Being the least weathered and granular of all tephras, the WKA showed a predominantly dilative response in both degrees of compaction and drainage cases. The effect of change in degree of compaction was majorly reflected in monotonic shear behavior for the GKA and MA tephras. It was found that the GKA and MA tephras exhibited some behaviors of common sandy soils, while some unusual behaviors were also evident. At the lower Dc ≈ 90%, the GKA and MA tephras both exhibited compressive drained behavior, but while the undrained response of MA remained compressive, the GKA exhibited a dual undrained behavior with an initial dilation (until the deviator stress reached its peak, qpeak), followed by compression until reaching the residual stress or critical state. With the rise in Dc to ≈100%, the GKA tephra transformed to exhibit a strong dilative behavior (which is typical of common sandy soils), but the MA tephra then showcased an initial dilation followed by compression in its undrained response, particularly at lower confining pressures of σc′ = 50 and 100 kPa. The contractive behavior became more noticeable at a higher confining pressure σc′ = 200 kPa. Such behaviors have also been observed for ‘sensitive’ volcanic [64,65] and ‘non-traditional’ materials [66]. The pore pressures for GKA and MA showed a rise, followed by a very limited flow, and finally stable values (similar to silty and clayey sands). This type of failure seemed more prominent for highly weathered MA among all tested tephras. The divergence was probably induced by the different weathering state and mineralogical composition of the tephras tested.

4.6. State Parameter

Tephra behavior can be better described by the positioning of the current stress and degree of compaction, namely the state parameter (ψ), relative to the CSL. With the critical state approximated, the ψ is hereafter presented, as defined by Been and Jeffries [49] in Equation (4). The values of the ψ plotted against φpeak, in Figure 18a, present improved linear relationships for the extrapolated data (against the end-of-test data), with outliers for GKA (at Dc ≈ 100%) and MA (at Dc ≈ 90%) in undrained conditions.
In undrained shearing, a positive ψ value is typically associated with flow failure, whereas a negative ψ value is associated with non-flow behavior. As also observed in drained shearing, the WKA tephra in undrained shearing (Figure 18c) had negative values of both up and ψ, representing its non-flow or dilative behavior. The geochemically similar but more weathered GKA tephra (w.r.t. mineralogy) at a higher Dc demonstrated identical behavior with lower negative development of up. At higher Dc, the GKA tephra revealed positive values of up (>0) and close to zero values of ψ (≈0). On a similar basis, the MA tephra showed the highest generation of up > 0 and ψ ≈ 0 values, owing to its highly weathered nature. Unlike drained shearing, the deviation of GKA (at lower Dc) and MA (at higher Dc) tephras from presenting ψ > 0 values (to reveal entirely contractive behavior) was due to the initial dilative and then contractive undrained stress path response (as seen in Figure 17).

4.7. Particle Breakage Evaluation

To examine the occurrence of particle breakage after compaction, consolidation, and shearing stages, the grain size distribution curves of tephras after the aforementioned tests were measured using sieve analysis, and then compared with the original gradation. Table 6 presents the breakage values determined using Hardin’s [67] and Miura and Yagi [68] indices for the monotonic compression tests carried out. The selection of these two indices provides a combination of the particle breakage considering the entire gradation along with the generation of fines (<0.075 mm). Among the three tephras, maximum particle breakage appeared to occur for MA, followed by GKA and then WKA tephra. Higher breakages for MA and GKA were attributed to the manner of natural deposition, namely base surge, impact by the overlying tephra leading to a finer gradation [1,21], intermixing (with older soil deposits), and consequent bulk chemical composition yielded for these tephras. In contrast, lower breakage for WKA was a result of its closer vent deposition, leading to coarser gradation, no intermixing with other types of deposit (as observed in GKA and MA tephras), and subsequent lower weathering of geochemically ‘identical’ particles.
In addition, the effect of drainage was clearly visible with higher breakage observed in drained shearing (in comparison to undrained shearing) due to the increase in p′. The higher breakages were also noticeable with the rise in effective confining pressure σc′ [56,57,69]. Also, the numerical values observed through Hardin’s [67] index were comparatively larger than those measured by the Miura and Yagi [68] index. In addition, higher values of breakage at a higher degree of compaction were also evident due to better transmission of applied stresses among contact points in a tightly packed matrix. Figure 19 presents the variation in grain size distribution curves of the tephras compacted to 100% Dc. It was seen that the shift of grading curves increased from WKA→GKA→MA due to an increase in the crushability of the stated tephras. For different particle size groups, the crushing tendencies of larger particles (2–8 mm particle size group) was greater in comparison to smaller sized particles (0.075–2 mm) under similar conditions of confining pressure and packing density. Larger particles are more vulnerable to crushing as they might contain more internal flaws, and the overall shapes are irregular. In addition, the crushable nature could be attributed to the increasing weathering degree and corresponding intermix of silica (quartz) feldspar minerals, as mentioned earlier in Section 3.2. Also, as the gradation curves were relatively close to each other, the average value of the breakages observed in the individual cases were evaluated as 2.7% and 1.0% for WKA, 6.3% and 4.5% for GKA, and 7.8% and 3.0% for MA using Hardin’s [67] and Miura and Yagi [68] indices, respectively. The maximum breakage value obtained fell below 10% (with most of the breakage occurring during compaction), therefore, seeming less significant at the low level of σc′ = 50–200 kPa considered in this study. Considering the well-graded silty sand nature of the samples tested in our study, the breakage values seen were comparatively lower than those containing pure sand [12,14,15,70]. Overall, the particle breakage of volcanic soil, therefore, is influenced by factors such as confining pressure, degree of compaction, particle size, and chemical composition.

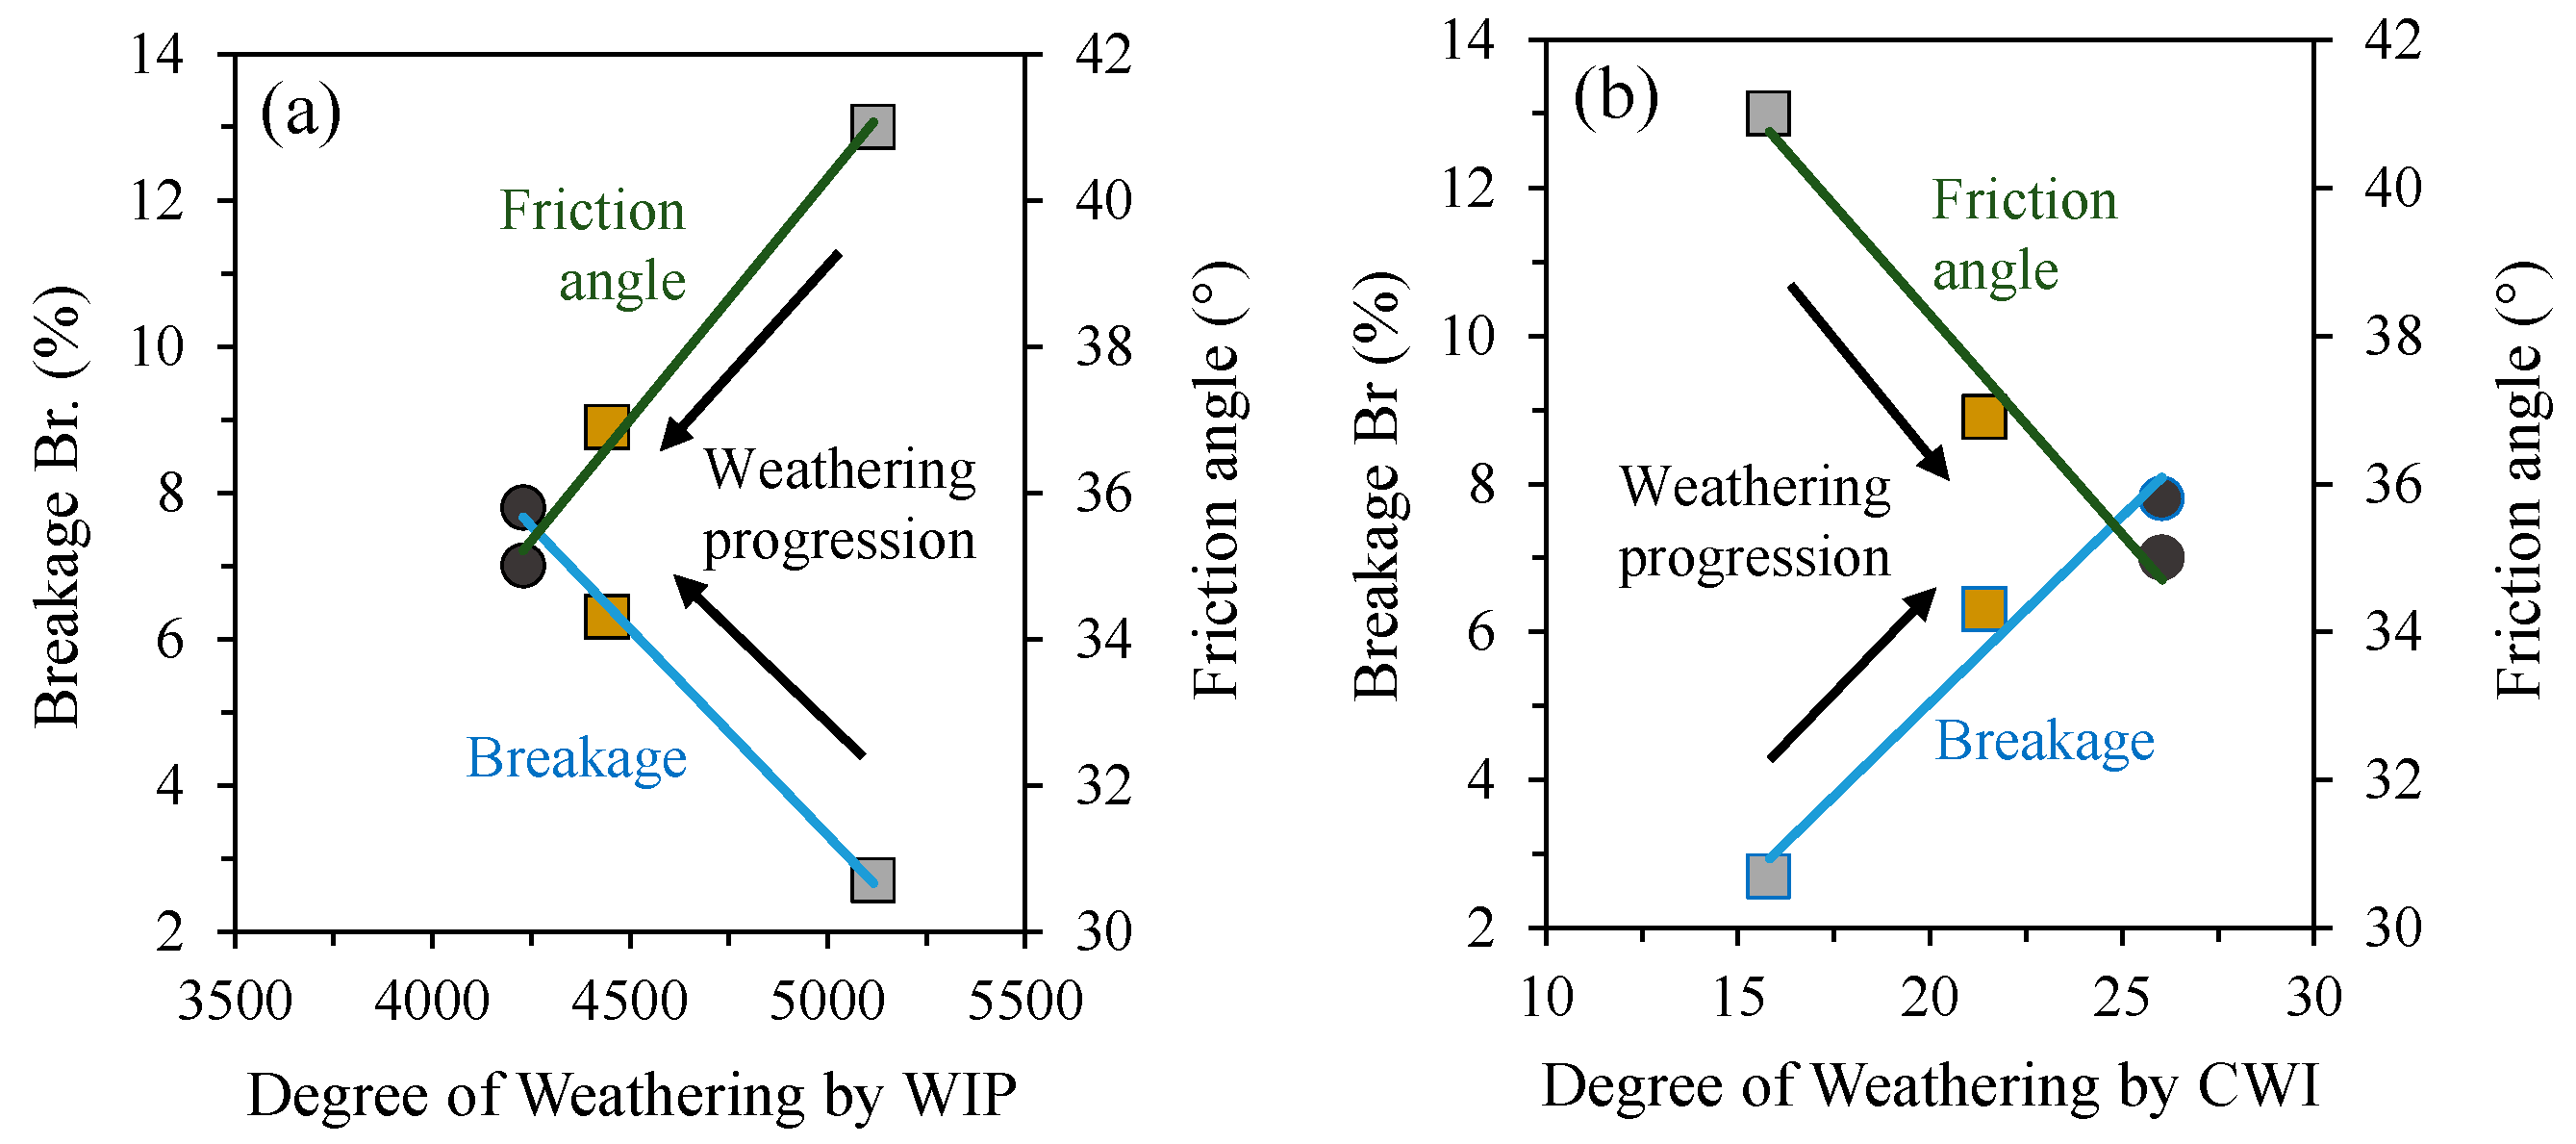
4.8. Effect of Weathering Degree and Mineralogy on Post-Shear Breakage and Friction Angle

As established in the previous Section 4.7, the level of particle breakage observed was in the order: MA > GKA > WKA. The level of breakage in each tephra corresponded to its current weathering state, which was in turn related to its mineralogical composition. As also established in [6], the amount of silica and feldspar minerals were the lowest and highest for WKA tephra, thus making it the least weathered (lower sesquioxides) and coarsest among the three tephras. In contrast to WKA, relatively higher and lower amounts of silica and feldspar minerals in GKA were a result of phreatomagmatic action (magma and water interaction) imposed by the overlying falling tephra on it from the 1886 eruption [1] and intermixing with other deposit types, mainly countryside lithics at a further deposition distance and relatively higher slope, thus making it more weathered (finer and colour change to golden). Despite identical geochemical compositions of rhyolitic WKA and GKA, as seen through XRF data in Table 2, changes in the mineralogical composition due to different deposition locations and weathering processes led to a higher friction angle and post-shear breakage in GKA. Figure 20 shows a comparison among the post-shear breakage values (shown here by Hardin’s [67] index) and average friction angles of tephras against their respective degrees of weathering values determined by WIP and CWI indices. The highest post-shear breakage and lowest friction angle for basalt-andesitic MA were a result of its highly weathered state, as evident from its WIP (lowest) and CWI (highest) values. Correspondingly, the lowest amounts of feldspars were detected in MA, along with the highest silica accountable to lithics intermixing and the base surge nature [21]. The greatest weathering rendered MA a fine-grained silty sand gradation, thus explaining its primarily contractive and constant pore pressure drained and undrained behaviors, respectively.

5. Conclusions and Recommendations for Further Work

Under monotonic shearing conditions, heterogeneous compacted tephras showed different behavioral responses depending on factors such as gradation, weathering state, stress paths, and degree of compaction. Along with the occurrence of particle breakage during shearing, the tephras eventually seemed to be approaching an ultimate state, or critical state, wherein deformations occurred without further change in stresses or volume.
  • While the least weathered WKA (closer to vent) and most weathered MA (base surge) tephras were predominantly dilative and contractive in drained conditions, the drained response exhibited by intermediately weathered GKA (away from the vent) was contractive and dilative at lower and higher degrees of compaction, respectively. In terms of undrained responses, the WKA tephra remained primarily dilative, but flow behavior initiated by dilative and then contractive responses was observed at lower and higher degrees of compaction for GKA and MA tephras, respectively.
  • At large strain levels, the compacted volcanic tephras attained the critical state along with visual and non-visual appearances of localizations. Extrapolations, along with original data, indicated friction angles greater than those observed for loose sand (φ = 30°), along with measured breakage values falling below 10% post-shearing, encouraging the use of these tephras as geomaterials.
  • The critical states formed unique straight lines in the q–p′ and v–ln p′ planes, along with downward movement towards smaller void ratios or specific volumes, and a rise in degree of compaction Dc in the latter plane. Thus, the framework of critical state soil mechanics was applicable to silty sands and sandy silts of volcanic origin.
  • The friction angles at peak states ranged from 35° to 55°, whereas the critical states gave a friction angle of between 35° and 43°, which were dependent on the density and stress conditions. A higher friction angle for White Kaharoa tephra resulted from the tephra’s well-graded particle size distribution, angular particle shape, and mineralogical composition (least weathered nature). Out of the crystalline silica feldspar minerals, the White Kaharoa tephra contained a large quantity of feldspars (≈76%), for which the friction angle attained a maximum of 43° at constant volume state. Thus, the frictional properties of the tephras seemed to be governed by the friction between the feldspar particles.
  • The combined effects of weathering state and mineralogy indicated their influence on geotechnical characteristics such as post-shear breakage and friction angle, with higher weathering of MA resulting in higher shear breakage and lower friction angle. The corresponding highest weathering in MA ultimately reflected its compressive behavior in drained and undrained conditions, respectively. Therefore, the combination of elemental and mineralogical compositions helped in understanding the weathering nature, which further influenced strength/shear and breakage behaviors of compacted tephra deposits.
  • The strength results of this study, combined with results of chemical and mineralogical investigations, indicated that silty sand tephras, if properly compacted, are suitable fills for use in typical geotechnical applications. The effects of chemical compositions on other geotechnical properties such as compressibility and cyclic behavior (i.e., seismic response under undrained cyclic shear loading) will also be presented in the upcoming papers.
  • The tephra samples studied belonged to the slightly weathered category of different chemical compositions, with no clayey minerals. To illustrate the applicability of the proposed method using the degree of weathering as the influential parameter, tests on tephra samples of a more weathered nature and different chemical compositions can be performed.
  • The proposed approach can also be applied to a single tephra weathered to significantly different degrees. Also, by controlling the extent of weathering under laboratory conditions, the impact of weathering on the mechanical properties of an individual volcanic soil can be checked.

Author Contributions

S.S.: conceptualization, investigation, formal analysis, writing—original draft preparation; G.C.: conceptualization, supervision, funding acquisition, writing—review and editing; T.W.: supervision, funding acquisition, writing—review and editing; M.S.: supervision, writing—review and editing. All authors have read and agreed to the published version of the manuscript.

Funding

We wish to acknowledge the financial support provided by Dept. of Civil and Natural Resources Engineering and Dept. of Earth and Environment at the University of Canterbury and the DEVORA program funded by the Auckland Council and the New Zealand Natural Hazards Commission | Toka Tū Ake.

Data Availability Statement

All data and materials are available on request from the corresponding authors.

Acknowledgments

All the tests were conducted at University of Canterbury, Christchurch, New Zealand. We would like to thank Siale Faitotonu and Sean Rees for their valuable help and laboratory assistance.

Conflicts of Interest

The authors declare no conflicts of interest.

List of Symbols and Abbreviations Used in This Study

AVFAuckland Volcanic Field
BrBreakage
CIAChemical Index of Alteration
CSLCritical state line
CWIChemical Weathering Index
DDilation rate
DcDegree of compaction
εqDeviatoric strain
εvVolumetric strain
GKAGolden Kaharoa Ash
GsSpecific gravity
ICIsotropic consolidation
MAMaungataketake Ash
McsStress ratio at critical state
NNova’s parameter
OVCOkataina Volcanic Centre
p′Mean effective stress
p′cPost-consolidation mean effective stress
p′csMean effective stress at the critical state
p′eMean effective stress at the end of test
p′pMean effective stress at the peak
qDeviator stress
qcsDeviator stress at the critical state
qeDeviator stress at the end of test
qpDeviator stress at the end of peak
TVZTaupo Volcanic Zone
upPore water pressure
vSpecific volume
vcSpecific volume after consolidation
vcsSpecific volume at the critical state
veSpecific volume at the end of test
WIPWeathering Index of Parker
WKAWhite Kaharoa Ash
woptOptimum moisture content
XRDX-ray diffraction
XRFX-ray fluorescence
ΓIntercept of the critical state line
ηStress ratio
ηeStress ratio at the end of the test
ηpStress ratio at the peak
λSlope of the critical state line
ρdmaxMaximum dry density
σcEffective confining pressure
φFriction angle
φcsFriction angle at the critical state
φeFriction angle at the end of test
φpFriction angle at the peak
ΨState parameter

Appendix A. Examples to Estimate the Critical State

Some drained tests were suitable for extrapolation using methods proposed by Nova [45], Ghafghazi and Shuttle [51], and Murthy et al. [52]. These involved curve fitting to the existing data using a sigmoidal function, and then extrapolating the fitted curve to a constant volume (drained) condition. For drained tests, the stress ratio–dilatancy plots were plotted for each and multiple tests, and then extrapolated to points of zero dilatancy considering non-occurrences and occurrences of shear banding and localization. The key steps in curve fitting and stress ratio–dilatancy plots are briefly described below.

Appendix A.1. Curve Fitting Using Sigmoidal Function

The complete procedure and types of equation to be used are described in detail in Murthy et al. [52]. The key points of using sigmoidal function for curve fitting using WKA tephra as an example are as follows:
  • The dεv–dεq was determined using the central difference method and is plotted in Figure A1a. In a dilative material such as WKA tephra, there existed a point of inflection in the εv–εq (minimum dilatancy point) relationship, where the rate of volumetric change began to slow and the material afterwards tended to proceed towards a constant volume condition (critical state). This point was referred to as local minimum in the dεv–dεq relationship.
  • A sigmoidal function was then used to fit the dεv–dεq relationship starting at the local minimum, corresponding to the point of inflection in the εv–εq relationship (Figure A1).
  • The sigmoidal function was, thereafter, integrated and applied to the εv–εq (Figure A1b). The residual sum of squares between the fitting curves and test data from the points of inflection to the end of the test were calculated for each of the relationships dεv–dεq and εv–εq.
  • Once the optimum fitting parameters minimizing the error between the fitting curve and test data for each relation were determined, the curves were extrapolated to the constant volume condition (Figure A1b).
Figure A1. (a,b) An illustration of extrapolation to the critical state for a drained test on WKA using sigmoidal function (Test ID—100-WKA-95.8%Dc-D-8).
Geotechnics 04 00044 g0a1

Appendix A.2. Stress Ratio–Dilatancy Plots

In the η–dεv–dεq plots, post ηmax–(dεv–dεq)min the rate of volume change tended to decrease towards zero. The stress ratio M at critical state was found by considering the appearances or non-appearances of visualized localizations [45,54]. In cases of no visualized deformation of localization (Figure A2), the post-peak stress portion in the η–dεv–dεq plot was fitted using Nova’s stress–dilatancy relationship (Figure A2a). The critical state friction angle φ was then estimated from the derived values of M and N. For cases of visualized localizations (Figure A2b), the test results were combined from three different confining stresses σc′ at a certain degree of compaction, and then the critical state stress ratio M was determined by fitting the peak stress ratio points (minimum dilatancy) corresponding to the three confining stresses σc′ in the stress–dilatancy curve (Figure A2b).
Figure A2. Examples of extrapolating the η–dεv–dεq data to obtain M for a WKA sample with (a) no visualized localization, (b) visualized localization.
Geotechnics 04 00044 g0a2

References

  1. Lowe, D.J.; Balks, M.R. Introduction to tephra-derived soils and farming, Waikato-Bay of Plenty, North Island, New Zealand. In Proceedings of the University of Wisconsin-Platteville Education Abroad Program: Winterim Field Trip, Hamilton, New Zealand, 15–17 January 2019; School of Science (Earth Sciences), University of Waikato: Hamilton, New Zealand; p. 82. [Google Scholar]
  2. Cole, J.; Deering, C.D.; Burt, R.M.; Sewell, S.; Shane, P.; Matthews, N. Okataina Volcanic Centre, Taupo Volcanic Zone, New Zealand: A review of volcanism and synchronous pluton development in an active, dominantly silicic caldera system. Earth Sci. Rev. 2014, 128, 1–17. [Google Scholar] [CrossRef]
  3. Kereszturi, G.; Németh, K.; Cronin, S.J.; Agustín-Flores, J.; Smith, I.E.; Lindsay, J. A model for calculating eruptive volumes for monogenetic volcanoes—Implication for the Quaternary Auckland Volcanic Field, New Zealand. J. Volcanol. Geotherm. Res. 2013, 266, 16–33. [Google Scholar] [CrossRef]
  4. Hayes, J.; Wilson, T.M.; Deligne, N.I.; Cole, J.; Hughes, M. A model to assess tephra clean-up requirements in urban environments. J. Appl. Volcanol. 2017, 6, 1. [Google Scholar] [CrossRef]
  5. Green, R.M.; Bebbington, M.S.; Cronin, S.J.; Jones, G. Automated statistical matching of multiple tephra records exemplified using five long maar sequences younger than 75 ka, Auckland, New Zealand. Quat. Res. 2014, 82, 405–419. [Google Scholar] [CrossRef]
  6. Sood, S.; Chiaro, G.; Wilson, T.; Stringer, M. Physical and chemical characteristics of slightly-weathered tephras in New Zealand. Geotech. Geol. Eng. 2024, 42, 4023–4047. [Google Scholar] [CrossRef]
  7. Cecconi, M.; Scarapazzi, M.; Viggiani, G.M. On the geology and the geotechnical properties of pyroclastic flow deposits of the Colli Albani. Bull. Eng. Geol. Environ. 2010, 69, 185–206. [Google Scholar] [CrossRef]
  8. Chaneva, J.; Kluger, M.O.; Moon, V.G.; Lowe, D.J.; Orense, R.P. Monotonic and cyclic undrained behaviour and liquefaction resistance of pumiceous, non-plastic sandy silt. Soil Dyn. Earth. Eng. 2023, 168, 107825. [Google Scholar] [CrossRef]
  9. Miura, S.; Yagi, K.; Asonuma, T. Deformation-strength evaluation of crushable volcanic soils by laboratory and in-situ testing. Soils Found. 2003, 43, 47–57. [Google Scholar] [CrossRef]
  10. Vezzoli, L.; Apuani, T.; Corazzato, C.; Uttini, A. Geological and geotechnical characterization of the debris avalanche and pyroclastic deposits of Cotopaxi Volcano (Ecuador). A contribute to instability-related hazard studies. J. Volcanol. Geotherm. Res. 2017, 332, 51–70. [Google Scholar] [CrossRef]
  11. Haruyama, M. Effect of density on the drained deformation behavior of Shirasu (volcanic sandy soil) under three-dimensional stresses. Soils Found. 1987, 27, 1–13. [Google Scholar] [CrossRef]
  12. Hyodo, T.; Wu, Y.; Hyodo, M. Influence of fines on the monotonic and cyclic shear behaviour of volcanic soil “Shirasu”. Eng. Geol. 2022, 301, 106591. [Google Scholar] [CrossRef]
  13. Picarelli, L.; Olivares, L.; Lampitiello, S.; Darban, R.; Damiano, E. The undrained behaviour of an airfall volcanic ash. Geosciences 2020, 10, 60. [Google Scholar] [CrossRef]
  14. Agustian, Y.; Goto, S. Strength and deformation characteristics of scoria in triaxial compression at low confining stress. Soils Found. 2008, 48, 27–39. [Google Scholar] [CrossRef]
  15. Orense, R.P.; Pender, M.J.; O’Sullivan, A.S. Liquefaction Characteristics of Pumice Sands; Earthquake Commission: Wellington, New Zealand, 2012; p. 131. Available online: https://www.naturalhazards.govt.nz/resilience-and-research/research/search-all-research-reports/liquefaction-characteristics-of-pumice-sands/#:~:text=Pumice%20sands%20have%20higher%20liquefaction,in%20higher%20cyclic%20shear%20resistance (accessed on 5 August 2024).
  16. Iolli, S.; Modoni, G.; Chiaro, G.; Salvatore, E. Predictive correlations for the compaction of clean sands. Transp. Geotech. 2015, 4, 38–49. [Google Scholar] [CrossRef]
  17. De Magistris, F.S.; Tatsuoka, F. Effects of moulding water content on the stress-strain behaviour of a compacted silty sand. Soils Found. 2004, 44, 85–101. [Google Scholar] [CrossRef] [PubMed]
  18. Matsumura, S.; Miura, S.; Yokohama, S. Effects of compaction conditions on cyclic undrained shear properties of sandy-silt soils and its evaluation. J. Jpn. Soc. Civ. Eng. Ser. C (Geosph. Eng.) 2012, 68, 597–609. [Google Scholar] [CrossRef]
  19. Lindsay, J.M.; Leonard, G.S.; Smid, E.R.; Hayward, B.W. Age of the Auckland Volcanic Field: A review of existing data. N. Z. J. Geol. Geophys. 2011, 54, 379–401. [Google Scholar] [CrossRef]
  20. Nicol, A.; Seebeck, H.; Wallace, L. Quaternary tectonics of New Zealand. In Landscape and Quaternary Environmental Change in New Zealand; Shulmeister, J., Ed.; Atlantis Advances in Quaternary Science; Atlantis Press: Paris, France, 2017; Volume 3. [Google Scholar] [CrossRef]
  21. Agustín-Flores, J.; Németh, K.; Cronin, S.J.; Lindsay, J.M.; Kereszturi, G.; Brand, B.D.; Smith, I.E. Phreatomagmatic eruptions through unconsolidated coastal plain sequences, Maungataketake, Auckland Volcanic Field (New Zealand). J. Volcanol. Geotherm. Res. 2014, 276, 46–63. [Google Scholar] [CrossRef]
  22. Wesley, L.D. Determination of specific gravity and void ratio of pumice materials. Geotech. Test. J. 2001, 24, 418–422. [Google Scholar] [CrossRef]
  23. Stringer, M.E. Separation of pumice from soil mixtures. Soils Found. 2019, 59, 1073–1084. [Google Scholar] [CrossRef]
  24. Sood, S.; Chiaro, G.; Wilson, T.; Stringer, M. Comparison of Small-Strain Shear Modulus of Beach and Volcanic Sands; Sitharam, T.G., Kolathayar, S., Jakka, R., Eds.; Earthquake Geotechnics. Lecture Notes in Civil Engineering; Springer: Singapore, 2022; Volume 187, pp. 271–281. [Google Scholar] [CrossRef]
  25. Pokhrel, A.; Chiaro, G.; Kiyota, T.; Cubrinovski, M. Liquefaction characteristics of sand-gravel mixtures: Experimental observations and its assessment based on intergranular state concept. Soils Found. 2024, 62, 101444. [Google Scholar] [CrossRef]
  26. Umar, M.; Chiaro, G.; Kiyota, T.; Ullah, N. Deformation and cyclic resistance of sand in large-strain undrained torsional shear tests with initial static shear stress. Soils Found. 2021, 61, 765–781. [Google Scholar] [CrossRef]
  27. D2487; Standard Practice for Classification of Soils for Engineering Purposes (Unified Soil Classification System). ASTM International: West Conshohocken, PA, USA, 2017.
  28. D854; Standard Test Methods for Specific Gravity of Soil Solids by Water Pycnometer. ASTM International: West Conshohocken, PA, USA, 2014.
  29. Bas, M.L.; Maitre, R.L.; Streckeisen, A.; Zanettin, B.; IUGS Subcommission on the Systematics of Igneous Rocks. A chemical classification of volcanic rocks based on the total alkali-silica diagram. J. Petrol. 1986, 27, 745–750. [Google Scholar] [CrossRef]
  30. Nesbitt, H.W.; Fedo, C.M.; Young, G.M. Quartz and feldspar stability, steady and non-steady-state weathering, and petrogenesis of siliciclastic sands and muds. J. Geol. 1997, 105, 173–192. [Google Scholar] [CrossRef]
  31. Parker, A. An index of weathering for silicate rocks. Geol. Mag. 1970, 107, 501–504. [Google Scholar] [CrossRef]
  32. Sueoka, T. Identification and classification of granite residual soils using chemical weathering index. In Proceedings of the 2nd International Conference on Geomechanics in Tropical Soils, Singapore, 12–14 December 1988; pp. 55–61. [Google Scholar]
  33. D698; Standard Test Methods for Laboratory Compaction Characteristics of Soil Using Standard Effort (12,400 ft-lbf/ft3 (600 kN-m/m3)). ASTM International: West Conshohocken, PA, USA, 2012.
  34. Bolton, M.D. The strength and dilatancy of sands. Géotechnique 1986, 36, 65–78. [Google Scholar] [CrossRef]
  35. Sood, S.; Chiaro, G.; Wilson, T.; Stringer, M. Monotonic drained and undrained shear strength behaviour of compacted weathered airfall tephras. In Proceedings of the Indian Geotechnical Conference 2022 Volume 1 (IGC 2022); Lecture Notes in Civil Engineering; Jose, B.T., Sahoo, D.K., Shin, E.C., Choudhury, D., Joseph, A., Pai, R.R., Eds.; Springer: Singapore, 2024; Volume 476. [Google Scholar] [CrossRef]
  36. Lade, P.V.; Bopp, P.A. Relative density effects on drained sand behavior at high pressures. Soils Found. 2005, 45, 1–13. [Google Scholar] [CrossRef]
  37. Yoshimoto, N.; Hyodo, M.; Nakata, Y.; Orense, R.P.; Hongo, T.; Ohnaka, A. Evaluation of shear strength and mechanical properties of granulated coal ash based on single particle strength. Soils Found. 2012, 52, 321–334. [Google Scholar] [CrossRef]
  38. Roscoe, K.H.; Schofield, A.N.; Worth, C.P. On the yielding of soils. Géotechnique 1958, 8, 22–53. [Google Scholar] [CrossRef]
  39. Hyodo, M.; Hyde, A.F.; Aramaki, N.; Nakata, Y. Undrained monotonic and cyclic shear behaviour of sand under low and high confining stresses. Soils Found. 2002, 42, 63–76. [Google Scholar] [CrossRef]
  40. Hyodo, M.; Wu, Y.; Aramaki, N.; Nakata, Y. Undrained monotonic and cyclic shear response and particle crushing of silica sand at low and high pressures. Can. Geotech. J. 2017, 54, 207–218. [Google Scholar] [CrossRef]
  41. Cho, G.-C.; Dodds, J.; Santamarina, J.C. Particle shape effects on packing density, stiffness, and strength: Natural and crushed sands. J. Geotech. Geoenviron. Eng. 2006, 132, 591–602. [Google Scholar] [CrossRef]
  42. Haruyama, M. Geological, Physical, and Mechanical Properties of “Shirasu” and its Engineering Classification. Soils Found. 1973, 13, 45–60. [Google Scholar] [CrossRef]
  43. Been, K.; Jefferies, M.G. Stress-dilatancy in very loose sand. Can. Geotech. J. 2004, 41, 972–989. [Google Scholar] [CrossRef]
  44. Li, X.S.; Dafalias, Y.F. Dilatancy for cohesionless soils. Géotechnique 2000, 50, 449–460. [Google Scholar] [CrossRef]
  45. Nova, R. A constitutive model for soil under monotonic and cyclic loading. In Soil Mechanics-Transient and Cyclic Loading; Pande, G.N., Zienkiewicz, O.C., Eds.; Wiley: Chichester, UK, 1982; pp. 343–373. [Google Scholar]
  46. Roscoe, K.H.; Schofield, A.N.; Thurairajah, A. Yielding of clays in states wetter than critical. Géotechnique 1963, 13, 211–240. [Google Scholar] [CrossRef]
  47. Rowe, P.W. The stress-dilatancy relation for static equilibrium of an assembly of particles in contact. Proc. R. Soc. Lond. 1962, 269, 500–527. [Google Scholar] [CrossRef]
  48. Schofield, A.N.; Wroth, P. Critical State Soil Mechanics; McGraw-Hill: London, UK, 1968; Volume 310. [Google Scholar]
  49. Been, K.; Jefferies, M.G. A state parameter for sands. Géotechnique 1985, 35, 99–112. [Google Scholar] [CrossRef]
  50. Carrera, A.; Coop, M.R.; Lancellotta, R. Influence of grading on the mechanical behaviour of Stava tailings. Géotechnique 2011, 61, 935–946. [Google Scholar] [CrossRef]
  51. Ghafghazi, M.; Shuttle, D.A. Accurate determination of the critical state friction angle from triaxial tests. In Proceedings of the 59th Canadian Geotechnical Conference, Vancouver, BC, Canada, 1–4 October 2006. [Google Scholar]
  52. Murthy, T.G.; Loukidis, D.; Carraro, J.A.H.; Prezzi, M.; Salgado, R. Undrained monotonic response of clean and silty sands. Géotechnique 2007, 57, 273–288. [Google Scholar] [CrossRef]
  53. Xiao, Y.; Xiang, J.; Liu, H.; Ma, Q. Strength–dilatancy relation of sand containing non-plastic fines. Géotech. Lett. 2017, 7, 204–210. [Google Scholar] [CrossRef]
  54. Yilmaz, Y.; Deng, Y.; Chang, C.S.; Gokce, A. Strength–dilatancy and critical state behaviours of binary mixtures of graded sands influenced by particle size ratio and fines content. Géotechnique 2023, 73, 202–217. [Google Scholar] [CrossRef]
  55. Jefferies, M.G. Nor-Sand: A simple critical state model for sand. Géotechnique 1993, 43, 91–103. [Google Scholar] [CrossRef]
  56. Heitor, A.; Indraratna, B.; Kaliboullah, C.I.; Rujikiatkamjorn, C.; McIntosh, G.W. Drained and undrained shear behavior of compacted coal wash. J. Geotech. Geoenviron. Eng. 2016, 142, 04016006. [Google Scholar] [CrossRef]
  57. Winter, M.J.; Hyodo, M.; Wu, Y.; Yoshimoto, N.; Hasan, M.B.; Matsui, K. Influences of particle characteristic and compaction degree on the shear response of clinker ash. Eng. Geol. 2017, 230, 32–45. [Google Scholar] [CrossRef]
  58. Daouadji, A.; Hicher, P.Y.; Rahma, A. An elastoplastic model for granular materials taking into account grain breakage. Eur. J. Mech. A/Solids 2001, 20, 113–137. [Google Scholar] [CrossRef]
  59. Ghafghazi, M.; Shuttle, D.A.; DeJong, J.T. Particle breakage and the critical state of sand. Soils Found. 2014, 54, 451–461. [Google Scholar] [CrossRef]
  60. Kikumoto, M.; Wood, D.M.; Russell, A. Particle crushing and deformation behaviour. Soils Found. 2010, 50, 547–563. [Google Scholar] [CrossRef]
  61. Wood, D.M.; Maeda, K. Changing grading of soil: Effect on critical states. Acta Geotech. 2008, 3, 3–14. [Google Scholar] [CrossRef]
  62. Bandini, V.; Coop, M.R. The influence of particle breakage on the location of the critical state line of sands. Soils Found. 2011, 51, 591–600. [Google Scholar] [CrossRef]
  63. Xiao, Y.; Liu, H.; Ding, X.; Chen, Y.; Jiang, J.; Zhang, W. Influence of particle breakage on critical state line of rockfill material. Int. J. Geomech. 2016, 16, 04015031. [Google Scholar] [CrossRef]
  64. Chiaro, G.; Kiyota, T.; Umar, M.; Cappellaro, C. Earthquake-induced flow-type slope failure in weathered volcanic deposits—A case study: The 16 April 2016 Takanodai Landslide, Japan. Geosciences 2022, 12, 394. [Google Scholar] [CrossRef]
  65. Mills, P.; Moon, V. Static failure mechanisms in sensitive volcanic soils in the Tauranga Region, New Zealand. In Proceedings of the 11th Australia and New Zealand Young Geotechnical Professionals Conference, Queenstown, New Zealand, 25–28 October 2016. [Google Scholar]
  66. Wang, H.; Koseki, J.; Cai, F.; Nishimura, T. Undrained monotonic triaxial loading behaviors of a type of iron ore fines. Can. Geotech. J. 2018, 55, 1349–1357. [Google Scholar] [CrossRef]
  67. Hardin, B.O. Crushing of soil particles. J. Geotech. Eng. 1985, 111, 1177–1192. [Google Scholar] [CrossRef]
  68. Miura, S.; Yagi, K. Particle breakage of volcanic coarse-grained soils and its evaluation. J. Jpn. Soc. Civ. Eng. JSCE 1997, 561, 257–269. [Google Scholar] [CrossRef]
  69. Tasalloti, S.M.A.; Indraratna, B.; Rujikiatkamjorn, C.; Heitor, A.; Chiaro, G. A laboratory study on the shear behavior of mixtures of coal wash and steel furnace slag as potential structural fill. ASTM Int. Geotech. Test. J. 2015, 38, 361–372. [Google Scholar] [CrossRef]
  70. Liu, X.-Y.; Wang, C.-M.; Liu, H.-L.; Wu, D. An Experimental Investigation of the Mechanical Behavior and Particle Crushing Characteristic of Volcanic Soil. Materials 2022, 15, 5423. [Google Scholar] [CrossRef]
Figure 1. (a) Location of the sampling areas near volcanic centers in Rotorua and Auckland regions in the North Island, New Zealand, and photos of the collected airfall tephras; (b) White Kaharoa Ash (WKA); (c) Golden Kaharoa Ash (GKA); and (d) Manugataketake Ash (MA).
Geotechnics 04 00044 g001
Figure 2. Physical properties of tephras: (a) particle size distribution, and (b) specific gravity Gs.
Geotechnics 04 00044 g002
Figure 3. A comparison between Gs values of bulk sample, original bulk fines, and crushed fines.
Geotechnics 04 00044 g003
Figure 4. (a) Degree of weathering and (b) Relative abundances of quartz (SiO2) Q—feldspar (plagioclases P and alkali feldspars A) minerals in the WKA, GKA, and MA tephra samples.
Geotechnics 04 00044 g004
Figure 5. Compaction curves obtained for WKA, GKA, and MA samples.
Geotechnics 04 00044 g005
Figure 6. Schematic of the GDS triaxial device used in this study.
Geotechnics 04 00044 g006
Figure 7. Deviatoric stress, volumetric strain, and pore water pressure response for the WKA, GKA, and MA tephras prepared at Dc ≈ 90% and sheared under σc′ = 50 kPa (a,b,g,h), 100 kPa (c,d,i,j), and 200 kPa (e,f,k,l).
Geotechnics 04 00044 g007
Figure 8. Deviatoric stress, volumetric strain, and pore water pressure response for the WKA, GKA, and MA tephras prepared at Dc ≈ 100% and sheared under σc′ = 50 kPa (a,b,g,h), 100 kPa (c,d,i,j), and 200 kPa (e,f,k,l).
Geotechnics 04 00044 g008
Figure 9. Influence of degree of compaction on the deviatoric stress, volumetric strain, and pore water pressure of the tephras at σc′ = 50 kPa: (a,b,g,h) WKA, (c,d,i,j) GKA, and (e,f,k,l) MA.
Geotechnics 04 00044 g009
Figure 10. Influence of degree of compaction on the deviatoric stress, volumetric strain, and pore water pressure of the tephras at σc′ = 100 kPa: (a,b,g,h) WKA, (c,d,i,j) GKA, and (e,f,k,l) MA.
Geotechnics 04 00044 g010
Figure 11. Influence of Dc on the deviatoric stress, volumetric strain, and pore water pressure of the tephras at σc′ = 200 kPa: (a,b,g,h) WKA, (c,d,i,j) GKA, and (e,f,k,l) MA.
Geotechnics 04 00044 g011
Figure 12. The variation in the peak friction angle of tephras from drained tests with varying effective confining pressures (a) Dc ≈ 90% and (b) Dc ≈ 100%.
Geotechnics 04 00044 g012
Figure 13. The variation in the peak friction angle of tephras from drained tests with varying degrees of compaction Dc at (a) σc′ = 50 kPa, (b) σc′ = 100 kPa, and (c) σc′ = 200 kPa.
Geotechnics 04 00044 g013
Figure 14. The variation in the friction angle and cohesion of compacted silty sand tephras (a) WKA, (b) GKA, and (c) MA at Dc ≈ 90% (lighter Mohr circles) and Dc ≈ 100% (darker Mohr circles) under effective stresses (dotted—drained and undrained) and total stresses (solid—undrained).
Geotechnics 04 00044 g014
Figure 15. Evolution of dilatancy dεv/dεq and pore pressure dup/dεq, along with stress ratio q/p′ for the three tephras during drained (ac) and undrained (df) shearing.
Geotechnics 04 00044 g015
Figure 16. Relationship between (a) the minimum dilatancy rate and peak stress ratio and (b) illustration of Nova’s rule used in this study.
Geotechnics 04 00044 g016
Figure 17. Critical state lines in the v vs. p′ (ac) and q vs. p′ (df) planes for the studied tephras.
Geotechnics 04 00044 g017
Figure 18. Variation of (a) peak friction angle, (b) volumetric strain, and (c) pore water pressure with state parameter.
Geotechnics 04 00044 g018
Figure 19. Original and grain size distribution curves of tephras (a) WKA, (b) GKA, and (c) MA after compaction, isotropic consolidation, and shearing stages at degree of compaction ≈ 100%.
Geotechnics 04 00044 g019
Figure 20. Geochemical composition and influence of weathering by (a) WIP and (b) CWI chemical indices on average friction angle and average post-shear breakages (arrows indicate weathering progression).
Geotechnics 04 00044 g020
Table 2. Chemical composition and weathering state of studied tephras by XRF.
Tephra SampleMajor Oxide (Wt. %)WIPCWI
SiO2TiO2Al2O3Fe2O3MnOMgOCaONa2OK2OP2O5LOI
WKA75.10.212.31.30.10.21.13.93.40.02.05116.715.8
GKA70.70.213.91.80.10.21.13.62.80.15.54443.021.4
MA57.31.412.38.30.15.26.62.41.60.44.04230.326.0
Table 3. Mineral abundances in the tephra samples by XRD.
Mineral (Wt. %)Tephra Sample
WKAGKAMA
Glass78.3/0.086.2/0.038.5/0.0
Silica4.3/19.94.1/29.527.7/44.9
Feldspars16.4/75.69.2/66.924.7/40.2
Accessories1.0/4.40.5/3.59.2/14.9
Total Crystal Content21.7/100.013.8/100.061.6/100.0
Table 4. Summary of drained and undrained triaxial tests performed in this study.
Test Abbreviation
(“σc′−Tephra−Dc-Drainage−Test No.”)
Actual Degree of Compaction
Dc (%)
Post-ConsolidationPeak StateEnd of Test
p′c (kPa)vcqp (kPa)p′p (kPa)ϕp (°)(dεv/dεq)p or
(dup/dεq)p
qe (kPa)p′e (kPa)ϕe (°)(dεv/dεq)
or
(dup/dεq)e
ve
50−WKA−90−D-1 *^91.3501.670356.0168.951.3−0.754173.6109.838.7−0.0151.745
100−WKA−90−D-2 *^91.41001.671525.7277.346.1−0.591332.5212.038.40.0371.702
200−WKA−90−D−3 *^91.12001.662970.5525.344.9−0.351822.7475.342.2−0.0941.692
50−WKA−90−UD−489.7501.673 976.0648.243.4−26.91.673
100−WKA−90−UD−591.71001.665 994.2650.442.5−42.11.665
200−WKA−90−UD−690.71981.667 1002.3576.042.4−51.61.667
50−WKA−100−D−7 *96.3511.544450.9201.554.6−0.956217.7127.841.60.0201.645
100−WKA−100−D−8 *95.81001.531804.6370.352.9−0.851431.8245.942.8−0.1371.627
200−WKA−100−D−996.12001.536 1037.9548.046.0−0.2941.534
50−WKA−100−UD−1096.3501.549 1023.0512.448.5−91.41.549
100−WKA−100−UD−1195.91001.534 1038.7534.347.2−84.61.534
200−WKA−100−UD−1296.42001.545 1027.5541.846.1−63.71.545
IC−WKA−90−1390.420→12001.677
IC−WKA−100−1496.020→12001.551
50−GKA−90−D−15 ^87.0501.996147.099.036.50.013134.894.935.00.0441.964
100−GKA−90−D−16 ^86.61001.981287.2194.736.30.050272.5189.835.40.0461.921
200−GKA−90−D−17 ^88.32001.955586.7395.536.50.056570.0390.136.00.0431.856
50−GKA−90−UD−18 ^87.3501.986108.972.836.80.88969.148.135.4−1.0301.986
100−GKA−90−UD−19 ^87.41001.975156.3104.036.90.10099.266.836.50.6901.975
200−GKA−90−UD−20 ^87.41981.954214.0144.536.4−0.100153.9108.135.10.9841.954
50−GKA−100−D−21 *^98.9511.769286.2146.347.5−0.662179.7111.932.7−0.0621.871
100−GKA−100−D−22 *^98.91001.758441.3248.743.2−0.412317.6207.837.5−0.0871.838
200−GKA−100−D−23 *^99.12001.740833.0479.842.3−0.256614.3406.537.1−0.0141.791
50−GKA−100−UD−2498.1501.758 944.6564.440.9−22.41.758
100−GKA−100−UD−2599.1981.754 945.5579.439.9−16.21.754
200−GKA−100−UD−2699.32001.743 984.7595.940.4−34.31.743
IC−GKA−90−2787.720→12001.998
IC−GKA−100−2898.920→12001.780
50−MA−90−D−29 ^87.2491.747138.895.534.70.026129.392.234.60.0131.632
100−MA−90−D−30 ^87.1981.698283.3194.435.90.035272.7190.835.30.0191.589
200−MA−90−D−31 ^87.61981.626571.3391.036.00.036557.0385.635.60.0001.521
50−MA−90−UD−32 ^87.2481.75426.532.021.312.222.915.536.30.2001.754
100−MA−90−UD−33 ^87.4981.68853.767.820.530.147.334.134.20.3001.688
200−MA−90−UD−34 ^87.41981.645121.3110.727.612.591.268.732.90.3351.645
50−MA−100−D−35 ^99.1481.585172.7108.938.9−0.125139.198.336.0−0.0051.594
100−MA−100−D−36 ^99.6991.575277.1193.535.30.019260.4186.934.40.0101.547
200−MA−100−D−37 ^98.11981.563544.6381.435.20.047520.3373.234.40.0201.483
50−MA−100−UD−38 ^99.6501.590106.389.436.51.7107.575.135.30.0001.590
100−MA−100−UD−39 ^97.1981.573184.4126.535.9−0.085151.7107.234.9−0.0851.573
200−MA−100−UD−40 ^97.81981.561232.5157.436.31.3212.0149.535.00.1031.565
IC−MA−90−4186.420→12001.760
IC−MA−100−4299.920→12001.596
Notes: Critical state evaluation: * extrapolations applied, ^ closer to and representative of critical state.
Table 5. Extrapolated critical state parameters of the tephras.
Test AbbreviationPost-ConsolidationEnd of Test (e)Extrapolated CS Parameters
p′c (kPa)vc qe (kPa)p′e (kPa)ϕe (°)veqcs (kPa)pcs’ (kPa)vcsMcs
50-WKA-90-D-1 *50.11.670173.6109.838.71.745201.7125.21.7311.61
100-WKA-90-D-2 *100.01.671332.5212.038.41.702343.0226.11.7011.61
200-WKA-90-D-3 *199.81.662822.7475.342.21.692831.9516.71.6871.61
50-WKA-100-D-7 ^50.61.544217.7127.841.61.645261.7140.71.6181.86
100-WKA-100-D-8 ^100.11.531431.8245.942.81.627518.4280.21.5971.85
50-GKA-100-D-21 *50.61.769286.2146.339.31.871181.8115.81.8621.57
100-GKA-100-D-22 *100.11.758441.3248.737.51.838336.0214.01.8261.57
200-GKA-100-D-23 *200.01.740833.0479.837.11.791639.6407.41.7861.57
Notes: * Cases of visualized localizations with approaching critical state and Nova’s rule applied using test results at three effective confining stresses σc′. ^ Cases of non-visualized localizations with non-approaching critical state and Nova’s rule applied on a single test.
Table 6. Breakage characteristics of tephras after shearing.
TestBreakage Br (%)TestBreakage Br (%)TestBreakage Br (%)
H [67]M&Y [68]H [67]M&Y [68]H [67]M&Y [68]
50-WKA-90-D-12.10.750-GKA-90-D-152.53.050-MA-90-D-297.52.7
100-WKA-90-D-22.41.4100-GKA-90-D-164.93.9100-MA-90-D-309.23.5
200-WKA-90-D-32.90.9200-GKA-90-D-177.34.5200-MA-90-D-318.83.8
50-WKA-90-UD-41.30.250-GKA-90-UD-182.53.150-MA-90-UD-328.53.0
100-WKA-90-UD-52.00.7100-GKA-90-UD-193.02.8100-MA-90-UD-337.63.5
200-WKA-90-UD-61.80.6200-GKA-90-UD-205.22.9200-MA-90-UD-347.02.8
50-WKA-100-D-74.10.950-GKA-100-D-217.74.650-MA-100-D-356.32.4
100-WKA-100-D-84.81.3100-GKA-100-D-229.86.5100-MA-100-D-368.64.1
200-WKA-100-D-93.20.9200-GKA-100-D-2311.66.7200-MA-100-D-377.63.5
50-WKA-100-UD-103.21.350-GKA-100-UD-246.54.750-MA-100-UD-386.51.8
100-WKA-100-UD-111.41.3100-GKA-100-UD-258.46.2100-MA-100-UD-398.52.5
200-WKA-100-UD-123.61.2200-GKA-100-UD-266.14.7200-MA-100-UD-407.52.8
IC-WKA-90-131.91.0IC-GKA-90-272.72.4IC-MA-90-416.02.4
IC-WKA-100-143.60.7IC-GKA-100-282.82.0IC-MA-100-427.42.8
Note: H: Hardin’s, and M and Y (Miura and Yagi), indices.
Disclaimer/Publisher’s Note: The statements, opinions and data contained in all publications are solely those of the individual author(s) and contributor(s) and not of MDPI and/or the editor(s). MDPI and/or the editor(s) disclaim responsibility for any injury to people or property resulting from any ideas, methods, instructions or products referred to in the content.