Abstract
This research focuses on the utilization of recently investigated aluminosilicate industrial wastes as precursors to produce non-structural precast alkali-activated concrete pavement blocks. For this purpose, conventional blocks (200 mm × 100 mm × 80 mm) were produced using electric arc furnace slag and municipal solid waste incineration bottom ashes as the sole binders. Portland cement and fly ash blocks were produced as references. The blocks underwent a curing regimen comprising thermal, dry, and carbonation curing stages. Control uncarbonated specimens were subjected to dry curing instead of CO2-based curing to evaluate the influence of carbonation on the blocks’ strength development. The specimens were subsequently examined following EN 1338, which is the European standard for assessing and ensuring the conformity of conventional concrete pavement blocks. The carbonated blocks revealed improved mechanical and physical properties in relation to the uncarbonated ones. All blocks met standard dimensions, showed minimal skid potential (most indicating extremely low potential for slip for reporting unpolished slip resistance values exceeding 75), and had enhanced abrasion resistance due to carbonation, showing 30% and 11% less volume loss due to abrasion for fly ash and bottom ash, respectively. Carbonated blocks performed better than non-carbonated ones, displaying lower water absorption (0.58% and 0.23% less water absorption for bottom ash and slag, respectively) and higher thermal conductivity (20%, 13%, and 8% increase in values for fly ash, slag, and bottom ash, respectively). These results confirm the effectiveness of the accelerated carbonation curing technique in improving the block’s performance. Despite the promising outcomes, further optimization of the alkaline solution and carbonation curing conditions is recommended for future research.
1. Introduction
Since the start of the 1800s, conventional ordinary Portland cement (OPC) has played a central role as the primary binder in construction. It has acquired a notable standing due to its well-established exceptional binding capabilities, contributing substantially to the construction sector ever since [1,2]. The prominence of this binding material can be attributed to its excellent performance, which is evident in many current architectural marvels. These include suspension bridges like the Millau Viaduct, monumental dams such as the Three Gorges Dam and the Hoover Dam, as well as towering skyscrapers like the Burj Khalifa and Taipei 101. These remarkable structures collectively underscore the versatile and enduring nature of this binding material in constructing astounding infrastructures, consequently fueling an unceasing dependence driven by ongoing research that progressively unveils its properties, resulting in a rising number of applications and escalating demand [3,4]. However, OPC is not without its drawbacks, particularly in relation to the environment. In 2021, OPC production reached a staggering 4270 million metric tonnes, giving rise to approximately 2520 million metric tonnes of CO2 emissions into the atmosphere. To provide perspective, this is similar to the collective weight of approximately 5040 Burj Khalifa towers [5]. Notably, the emission quotient stands at 0.6 tonnes of CO2 for every tonne of OPC manufactured [6]. In 2021, the cement industry’s CO2 emissions constituted a significant 8% of the total global emissions produced by all industries during the same year, firmly securing its position among the top 10 contributors to CO2 generation across industries [7,8]. Additionally, over the past two decades, much research has been conducted to further reduce CO2 emissions and combat the impacts of global warming. As the OPC industry represents a substantial contributor to these emissions, cutting them down can play a significant role in supporting worldwide initiatives to address climate change.
Efforts to mitigate emissions originating from OPC production have been pursued through various techniques implemented in previous years. Research efforts have concentrated on diminishing the environmental footprint of OPC by incorporating supplementary cementitious materials (SCMs) like fly ash (FA) and blast furnace slag (BFS). These materials have gained widespread adoption as partial substitutes for OPC, as demonstrated in various studies [9,10,11,12,13,14,15,16,17]. Furthermore, extensive research has been conducted on the utilization of BFS and FA as exclusive or combined constituents in alkali-activated concrete formulations, reporting interesting findings documented in the literature [18,19,20,21,22,23,24,25,26,27,28,29,30]. This has given rise to a ground-breaking environmentally conscious research trend, as both materials are categorized as industrial by-products and are abundantly available to meet partial market requirements. However, the availability of FA and BFS is currently experiencing limitations due to the increasing adoption of renewable energy sources for power generation and the utilization of more environmentally efficient alternatives for steel production [31,32,33].
Recent research has investigated novel aluminosilicate industrial wastes, exploring their chemical composition and potential as binders. Several studies have showcased the binding prowess of materials like electric arc furnace slag (EAFS) and municipal solid waste incinerator bottom ashes (MIBAs) when used as exclusive components in alkali-activated materials (AAMs) [29,32,34,35,36,37,38,39,40,41]. Concrete incorporating these binders typically exhibits diminished mechanical strength and durability [32,35]. This is primarily attributed to the reduced presence of amorphous content in the precursors, leading to increased porosity. Consequently, the cured materials also display alterations in their microstructural composition, which further contributes to the deterioration of their mechanical properties and durability [35,37].
In light of these challenges, recent research in this field has advanced through the utilization of accelerated carbonation to enhance performance during the curing process [29]. Lamaa et al. [40] investigated the performance of FA, EAFS, MIBA, and waste glass rejects (WGR) used as sole binders in alkali-activated concrete production. Mortar-sized specimens of each precursor were subjected to a 7-day accelerated carbonation curing stage (~5 CO2; ~65 RH), yielding notable compressive strength results of 52.5 MPa, 37.0 MPa, 20.0 MPa, and 39.1 MPa for FA, EAFS, MIBA, and WGR mixes, respectively. Moreover, Casanova et al. [32] conducted a study focusing on the strength development of alkali-activated MIBA. The investigation involved subjecting the samples to a predefined curing regimen, which included a carbonation curing phase carried out at 23 ± 3 °C, 60 ± 5% RH, and 5.0 ± 0.1% CO2 concentration for durations of 28 and 91 days. Concerning the control specimens containing FA, notable findings were reported: an evident 20 MPa increase in strength was noted after a carbonation period of 28 days in comparison to those not exposed to carbonation. The FA mixes, after a 91-day CO2 curing, exhibited strength enhancements ranging between 18% and 36% when contrasted with their corresponding uncarbonated counterparts. Turning to the specimens with MIBA, a substantial surge in strength, ranging from 275% to 306%, was observed, with the highest recorded compressive strength reaching 28 MPa after 91 days of carbonation. Likewise, Avila et al. [41] detected enhanced strength development of alkali-activated FA and MIBA following exposure to accelerated carbonation under conditions of 5% CO2 over time. Remarkably, the most substantial improvements in both compressive and flexural strengths were observed in the carbonated mixes (exposed for 28 days) containing 100% MIBA. Specifically, a remarkable 140% increase in compressive strength (8.08 MPa to 19.1 MPa) was noted in comparison to their uncarbonated counterparts. Similarly, for these mixes, an increase of around 185% in flexural strength was noted after 28 days of carbonation (from 1.58 MPa to 4.50 MPa) in comparison with the same mixes that were not subjected to carbonation. As for the mixes formulated with FA as the sole precursor, a notable 30% enhancement in strength was documented following 28 days of carbonation. Additionally, in another experimental study, Kassim et al. [39] investigated alkali-activated mortars with EAFS subjected to forced carbonation for 28 days at 5 ± 0.2% CO2, 23 ± 3 °C, and 60 ± 5% RH. The outcomes were remarkable, revealing a substantial surge in compressive strength by approximately 800% (i.e., 3.9 MPa to 31 MPa) and a noteworthy flexural strength increase of around 500% (i.e., 1.6 MPa to 7.85 MPa) for materials that underwent 28 days of carbonation.
This paper intends to investigate MIBA and EAFS as alkali-activated binders to produce conventional concrete pavement blocks with the goal of replacing OPC pavement blocks currently used for constructing pedestrian pathways. For each binder, sixteen 200 mm × 100 mm × 80 mm pavement blocks were produced, of which eight were exposed to an accelerated carbonation curing regimen while the other eight remained uncarbonated. Optimization of the density and workability were employed to enhance the characteristics of the mixes, with a specific focus on attaining favourable attributes for the production of concrete pavement blocks. These were evaluated according to the standard for conventional concrete pavement blocks, EN 1338 [42]. A comparison between carbonated and uncarbonated blocks was carried out to understand the influence of accelerated carbonation curing on the mechanical performance and microstructure of the blocks. OPC and FA blocks were produced as references. This step aimed at proving the binding ability of each binder as well as the influence of the carbonation curing stage on the performance of the blocks. This experimental work represents an innovative initiative to harness novel industrial waste materials in concrete manufacturing. Additionally, it explores the viability of accelerated carbonation curing as a strategy to enhance mechanical performance. This technique has the potential to offset the decline in performance that can occur due to the replacement of OPC with less efficient alkali-activated binders. Unlike previous studies on similar binders that primarily focused on producing mortar specimens, this study uniquely emphasizes the production of industry-ready concrete pavement blocks. This approach involves a comprehensive strategy that includes optimized mix design, specialized production processes, and curing regimes specifically tailored for such specific applications.
2. Materials and Methods
2.1. Binders
In this investigation, CEM I 42.5 R was used as the benchmark binding material, as per the specifications outlined in EN 197-1 [43].
The control binding agent for the AAMs consisted of FA sourced from the power plant facilities of Energies of Portugal in Portugal. As the FA already met the stipulated particle size criteria (with an average particle size of less than 45 µm), no preliminary processing was necessary.
MIBA was procured from the waste-to-energy plant at the periphery of Lisbon, Portugal, operated by Valorsul. Prior to its use as a precursor, MIBA went through preparatory steps, namely the elimination of impurities (such as metals, paper, and plastic), desiccating at 105 °C, and the necessary comminution based on previous experience [39,40,41] to align with the typical particle size distribution needed for binders.
Concerning the EAFS, defined as a derivative of the process of steel recycling, it was sourced from a local recycling facility in Portugal. Much like the method used for MIBA, size reduction was necessary for EAFS owing to its extensive particle size distribution, aside from the presence of very coarse particles.
2.1.1. Density
The density measurements of OPC, FA, MIBA, and EAFS (in their unbound/dry conditions) were conducted using a gas pycnometer (MICROTRAC BELPycno Ver 1.14 L by Microtrac Inc., Montgomeryville, PA, USA) with helium gas at atmospheric pressure. The apparent skeletal density measurements obtained through a gas pycnometer for FA, MIBA, EAFS, and OPC were recorded as 2431 kg/m3, 2704 kg/m3, 3770 kg/m3, and 3115 kg/m3, respectively [40].
2.1.2. X-ray Fluorescence
The raw materials’ chemical composition was previously analysed by X-ray fluorescence spectrometry (XRF), using a ZSX PRIMUS IV instrument (Rigaku Co., Tokyo, Japan) operating at a 4 kW power output [40]. The study of Lamaa et al. [40] presents the raw materials’ chemical compositions as determined by XRF analysis, which will be summarized here. The combined oxides Al2O3 + Fe2O3 + SiO2 constituted 88.7%, 64.3%, 56.4%, and 26.4% of the compositions of FA, MIBA, EAFS, and OPC, respectively. Among the alkali-activated precursors, FA presented the highest amount of SiO2. Experience dictates that it is usually present in amorphous phases and thus more likely to contribute to the resulting materials’ strength development. Even though MIBA contained a reasonably high amount of SiO2, most of it may be present in crystalline form, thereby showing limited reactivity and thus mechanical performance. EAFS, on the other hand, presented a relatively low amount of SiO2, which naturally reduces the number of silicate chains resulting from the alkali-activation reaction process. Nevertheless, it does contain a relatively high amount of CaO that can actively contribute to overall performance upon carbonation. EAFS also contains a notable iron content that has magnetic attributes. The alkali-activated precursor derived from EAFS displayed magnetic properties, as evidenced by neodymium magnet testing [44]. Elevated levels of Fe(III) may prompt the formation of precipitates of iron oxide (Fe2O3). These constituents can curtail overall reactivity, limiting the variety of accessible reactive species and constraining the degree of polymerization and the formation of networks. Consequently, this may result in reduced strength and durability in alkali-activated materials.
2.1.3. X-ray Diffraction
X-ray diffraction (XRD) analyses were conducted by utilizing the Bruker D8 Discover A25 device (Bruker Co., Billerica, MA, USA) equipped with Cukα radiation (λ = 1.54050 Å, 40 kV, and 30 mA). Goniometric scans were executed from 10° to 70° (2θ) at a scanning velocity of 0.016 2θ·s−1. Diffractogram peaks were compared with those in the JCPDS library [45] to identify crystalline phases. The study of Lamaa et al. [40] showed the X-ray diffractograms of OPC, FA, EAFS, and MIBA. OPC exhibited well-defined peaks corresponding to calcium silicate oxides (Ca2SiO4) and gypsum (CaSO4·2H2O). FA’s prominent crystallographic phases included lime (CaO), quartz (SiO2), mullite (3Al2O3·2SiO2), and maghemite (Fe2O3). This observation aligns with findings reported in some studies [46,47]. Notably, a broad reflection peak spanning 15° to 35° 2θ was present, suggesting the substantial presence of amorphous phases. For EAFS, the primary crystalline phases detected were dicalcium silicate (Ca2SiO4), gehlenite (Ca2Al2SiO7), and wustite (FeO), accompanied by minor phases like magnesioferrite. In the XRD spectrum of MIBA, identified crystalline phases encompassed quartz (SiO2), calcite (CaCO3), magnetite (Fe2+Fe3+2O4), microcline (KAlSi3O8), magnesium carbonate (MgCO3), fayalite ((Fe2+)2SiO4), and other minor minerals. An observation of non-crystalline phases (with reflection peaks from 20° to 40° 2θ) was evident, primarily attributed to the waste glass fraction, albeit to a lesser extent than FA.
2.1.4. Particle Size Distribution
For the determination of particle size distribution (PSD) in each binder, a Mastersizer S analyzer (Malvern Instruments, Malvern Panalytical Ltd., Worcestershire, UK) was employed [40], utilizing ethanol as a dispersant, and subjected to 5 min of sonication before analysis. The samples of OPC, FA, and EAFS exhibited a comparable two-peaked distribution pattern. For both EAFS and OPC, the peak occurred at around 25 µm, although OPC displayed a more condensed peak in contrast to EAFS. Furthermore, these two binders revealed a reduced peak at around 0.35 µm, suggesting a notable abundance of extremely fine particles. The distribution of FA exhibited a comparable pattern, albeit with a broader distribution centred around 20 µm (peak). Similarly, FA exhibited a minor peak at 0.35 µm. On the other hand, MIBA displayed a slender peak at 39 µm, accompanied by a low peak at 0.35 µm.
Prior investigations conducted by the authors have encompassed a morphological analysis of FA, MIBA, and EAFS particles utilizing scanning electron microscopy imaging and mapping [39,48]. An examination undertaken by Kassim et al. [39] revealed that particles of EAFS exhibited non-uniform shapes with pronounced angularity. Furthermore, the morphology of MIBA and FA was scrutinized previously [48], revealing spherical characteristics for FA, while the bottom ash particles exhibited angular edges and a porous microstructure. This suggested the potential need for a greater water content to achieve the desired workability level in the case of MIBA.
2.1.5. Thermogravimetric Analysis/Differential Thermal Analysis
Thermogravimetric analysis (TGA) and differential thermal analysis (DTA) were performed using a Setaram Setys Evolution 16/18 apparatus (Setaram Instrumentation, Caluire-et-Cuire, France), employing alumina crucibles under both air and argon atmospheres. The heating rate was set at 5 °C·min−1, covering a temperature range of 20–1000 °C [40]. In the study of Lamaa et al. [40], the curves of the TGA/DTA test for all binders were portrayed. The OPC presented a typical behaviour spectrum, except for the slight mass losses at 420 °C and 600 °C. In the former, a mass loss of approximately 0.4% of portlandite occurred due to the dihydroxylation of Ca(OH)2. The slight reduction in portlandite signifies its modest hydration rate and effective preservation. Starting at 600 °C, the loss is due to the decarbonation of calcium carbonate-derived compounds. This indicates that the cement may have been more hydrated than expected, wherein the resulting Ca(OH)2 of this process may have subsequently been carbonated over time, thus justifying the relatively high amount of CaCO3.
The TGA findings for FA revealed two distinct phenomena. The first concerns mass loss initiating at 400 °C, conceivably attributed to unburned coal particles within FA (as indicated by an exothermic peak in the DTA profile). Furthermore, the endothermic peak from ~600 °C onward suggests a potential minor loss of CO2 from some carbonates.
Concerning MIBA, mass losses manifested across four phases. The initial mass reduction might have been attributed to sample dehydration (up to approximately 105 °C). Subsequent, continuous losses could be attributed to the breakdown of phosphates and organic substances. Furthermore, a weight loss of around ~650 °C could be associated with the decarbonation of magnesite and calcite.
In contrast to other binders, EAFS exhibited an increase in mass. The X-ray diffractogram of the sample following TGA analysis (subjected to temperatures up to 1000 °C) revealed this consistent mass increase. Predominantly observed at around ~400 °C and ~620 °C, this phenomenon was found to be attributed to the oxidation of wustite, initially transitioning into magnetite and subsequently into hematite.
2.1.6. Fourier-Transform Infrared Analysis
The study of Lamaa et al. [40] illustrated the results of Fourier-transform infrared analysis (FTIR) for OPC, FA, MIBA, and EAFS, the results of which are summarized here:
OPC
- o
- 1622 cm−1—O–H bending characteristic of water [49];
- o
- 1443 cm−1—asymmetric stretching vibrations of CO3 in calcite derived due to the carbonation of CaO [49];
- o
- 1141 cm−1 and 1126 cm−1—symmetrical and asymmetrical stretching vibration modes of tetrahedral SO4 groups, respectively, present in gypsum [49];
- o
- 992 cm−1 and 846 cm−1—stretching vibrations of the Si–O links within the tetrahedral SiO4 groups present in C2S [49];
- o
- 887 cm−1 and 922 cm−1—symmetrical and asymmetrical stretching vibrations of the Si–O links within the tetrahedral SiO4 groups present in C3S [49];
- o
- 712 cm−1—AlO4-tetrahedral groups present in C3A;
- o
- 660 cm−1—FeO4-tetrahedral groups in C4AF;
- o
- 660 cm−1 and 597 cm−1—asymmetrical bending vibrations of SO4 in gypsum;
- o
- 517 cm−1 and 447 cm−1—symmetric and antisymmetric bending of the O–Si–O bonds present in C3S, respectively [50].
FA
- o
- 1166 cm−1 and 1070 cm−1—Si–O–Si asymmetrical stretching vibrations attributed to mullite and quartz [51,52];
- o
- 794 cm−1 and 775 cm−1—Si–O–Si symmetrical stretching vibrations, constituting a distinctive quartz pair [52];
- o
- 669 cm−1, 547 cm−1 and 459 cm−1—O–Al–O vibrations associated with the presence of mullite [49].
EAFS
- o
- 1634 cm−1—O–H bending of water;
- o
- 1425 cm−1—asymmetric stretching of CO32− [49];
- o
- 975 cm−1, 914 cm−1, 889 cm−1, and 850 cm−1—elongation of Si–O bonds within tetrahedral SiO4 groups [50,53];
- o
- 712 cm−1—AlO4-tetrahedral groups in C3A;
- o
- 660 cm−1—FeO4-tetrahedral groups;
- o
- 517 cm−1—O–Si–O bonds [50].
MIBA
- o
- 1629 cm−1—O–H bond vibrations (water);
- o
- 1427 cm−1, 874 cm−1, and 713 cm−1—CO32− vibrations [54];
- o
- 1160 cm−1 and 1060 cm−1—asymmetrical stretching of Si–O–Si linked to quartz;
- o
- 790 cm−1 and 775 cm−1—symmetrical stretching of the Si–O–Si bonds characteristic of a quartz doublet;
- o
- 551 cm−1 and 463 cm−1—Si–O vibrations of quartz [52].
2.2. Aggregates
Within this study, two distinct categories of aggregate were incorporated: siliceous sand and calcareous gravel. Regarding the sands, 0/2 fine sand and 0/4 coarse sand were employed, following the specifications outlined in standard EN 12620 [55]. The sand gravel, characterized by its calcareous nature, exhibited a particle size ranging from 2 mm to 5.6 mm. Prior to their integration, all aggregates underwent drying at 105 °C.
2.3. Alkaline Activator
The alkali activator employed was a liquid mixture created with sodium hydroxide (NaOH), sodium silicate solution (Na2SiO3), and water. Sodium hydroxide pellets of high purity, possessing a solid-state composition of 98% purity and a density of 2.13 g/mL, were used. Additionally, a sodium metasilicate solution of the same grade was incorporated, characterized by a silicon oxide (SiO2) content of 26.4 ± 1.5%, a sodium oxide (Na2O) content of 8 ± 0.6%, a SiO2/Na2O ratio of 3.3 ± 0.1, a water content of 65.6 ± 2%, and a density of 1.355 g/mL. The sodium hydroxide was dissolved in tap water sourced from EPAL, a national Portuguese water company, as per the specifications of Directive 98/83/CE [56].
2.4. Admixtures
SikaPlast-717, categorized as a naphthalene-based superplasticizer, played the role of a water-reducing admixture (WRA) in the study. This particular admixture is formulated with synthetic organic water-based dispersants, embodying a density of 1.21 ± 0.03 g/mL and maintaining a pH level of 10 ± 1.
A setting time retarder was considered necessary and thus incorporated. Sodium tetraborate decahydrate (with 37% B2O3), also commonly known as borax, was dissolved within the alkaline solution in all formulations.
2.5. Testing Methods
The cohesion of the recently prepared mixtures was assessed following the specifications provided in EN 1015-3 [57]. The Proctor compaction test [58] was used to determine the optimal water content to achieve maximum dry density. The blocks were tested following the standard for conventional concrete pavement blocks [42] as follows (Figure 1):

Figure 1.
Flowchart indicating the sequential implementation of the standard testing methods.
- (a)
- Visual aspect, shape, and dimensions—EN 1338 [42] was used to inspect the visual aspect, shape, and dimensions of the blocks. This testing procedure involved conducting a meticulous visual examination of all blocks to ensure their uniformity, consistent texture and dimensions, flatness of their surfaces, and absence of any flaws;
- (b)
- Slip/skid resistance—The unpolished slip resistance value (USRV) of the specimen was measured using pendulum friction test equipment to assess its frictional properties on the upper face, following the guidelines outlined in EN 1338 [42]. During this test, the pendulum friction test equipment featured a spring-loaded slider made of standard rubber, which was affixed to the end of the pendulum. By swinging the pendulum, the reduction in the height of the swing, as measured by a calibrated scale, was used to determine the frictional force between the slider and the test surface;
- (c)
- Compressive and splitting tensile strengths—The determination of the splitting tensile strength was carried out following the guidelines of EN 1338 [42]. During this test, a compressive load was applied to two strips in contact with the longest length of the block (one positioned at the bottom and another at the top). The load was applied gradually until the block experienced failure and split into two halves. While the blocks were not required to undergo a compressive strength test as per the standard, this test was included to evaluate their ability to withstand compression forces. The blocks were subjected to a compressive load using the same method employed for the splitting tensile load, albeit without the utilization of strips;
- (d)
- Abrasion resistance—The abrasion resistance of the blocks was determined through the Böhme test, in accordance with the standard EN 1338 [42]. During this test, square slab samples extracted from the blocks were positioned on the Böhme disc abrader. The test track of the abrader was coated with standard abrasive material. Subsequently, the disc was rotated, and the specimens were subjected to an abrasive load for a specified number of cycles;
- (e)
- Total water absorption—The total water absorption was determined in accordance with standard EN 1338 [42] by assessing the percentage of mass loss of a specimen after it was soaked in water and subsequently dried in an oven at 105 ± 5 °C;
- (f)
- Thermal conductivity—The thermal conductivity of the blocks was determined using the ISOMET 2114 device from Applied Precision Ltd. (Berkshire, UK).
2.6. Optimization of Mixes Production and Method
2.6.1. Optimization of the Mix Density
The initial phase of the work involved conducting preliminary trials to ascertain the ideal water-to-binder (w/b) ratio for producing conventional concrete pavement blocks with optimal compaction, cohesion, and workability. To achieve this, a modified Proctor compaction test [58], commonly employed in soil mechanics, was used to determine the optimal water content to achieve maximum dry density. The results obtained from this test facilitated the creation of a graph illustrating the relationship between the w/b ratio and the dry bulk density.
For this stage, all binders, including OPC, FA, MIBA, and EAFS, were tested. A range of w/b ratios (0.25, 0.30, 0.35, 0.40, and 0.45) was used to produce five mixes (volume of 1.3 L each) per binder, each with a different water content. Subsequently, these mixes underwent the Proctor test procedure [58], performed in accordance with the LNEC E 197 [59] standard. The test procedure was modified to suit the characteristics of the studied mixes since the original test was developed for compacting soil. The test involved introducing each mix into a cylindrical metal mould in three layers and compacting each layer using a drop hammer with a predetermined number of blows. Finally, the dry density (dry unit weight) of the compacted material was determined through mass measurement by following the equation (Equation (1)) defined by the standard:
where:
- γd = dry density of the material (kg);
- W = weight of the mould filled with the mix (kg);
- Wm = weight of the mould (kg);
- w = water content of the material (%);
- V = volume of the mould (0.956 L).
The composition of the mixes (in kg/m3) is shown in Table 1. For alkali-activated binders, the Na2O/precursor percentage chosen was 10%, while the SiO2/Na2O mass ratio was set at 1.0. In response to initial trials indicating a tendency for rapid setting, particularly in mixes involving FA, a 4% mass proportion of setting retarder was incorporated and dissolved in the alkaline solution for all alkali-activated mixes.

Table 1.
Mix composition for all binders used in the Proctor test (kg/m3).
2.6.2. Optimization of the Compaction Method
As a preliminary stage, an optimum compaction method to produce full-scale pavement blocks (200 mm × 100 mm × 80 mm) was defined. Trial tests were performed to determine a standard reproducible method that could be adopted to guarantee the uniformity and homogeneity of the produced blocks. As the blocks would be hand-moulded, three variables were considered: (i) the number of layers to fill the mould; (ii) the manual procedure to compact each layer; and (iii) the procedure for mechanical compaction (using a hydraulic press) once the mould is filled. After preliminary trials, the following production method was established:
- (i)
- Number of layers: two layers were added and manually compacted (about half the height of the block and between half the height of the block and the upper edge of the mould), followed by another (last and thinner) layer up to the edge of the mould not manually compacted;
- (ii)
- Manual compaction: 20 strokes (hand-tamping) were applied to each layer using a hand tamper and distributed across the surface;
- (iii)
- Mechanical compaction: After performing the manual compaction, the upper plate of the mould (Figure 2a) is placed on top of the remaining mould. At this stage, the upper plate is still not in contact with the remaining mould. The mould is then placed under the hydraulic press (Figure 2b) and compacted with an average force of 150 kN, the value when the compaction is completed (i.e., when the upper plate of the mould is in contact with the remaining mould).
 Figure 2. Mould used (a) before filling and (b) filled and under compaction.
2.7. Production, Curing, and Testing
2.7.1. Part 1—Definition of a Unified Mix Design for All Binders
After determining the optimum water content for each binder that ensures adequate workability and compactability of the blocks, a common effective w/b ratio of 0.25 was chosen based on the results obtained for the highest dry unit weight (density) while maintaining a low water content to produce pavement blocks with MIBA and EAFS as sole precursors, as well as FA and OPC ones as reference samples. All mixes were produced with an extra amount of water added to compensate for the aggregates’ water absorption of ~1% (total w/b ratio of ~0.3). In addition, the blocks were subjected to an identical curing regimen comprising thermal, dry, and carbonation curing stages. To assess the influence of carbonation on the strength development of the blocks, a variation of the described curing process was also investigated, in which the final carbonation curing period was replaced by the same period but with dry curing. The carbonated and uncarbonated blocks were tested for their performance in accordance with the standard of conventional concrete pavement blocks [42]. The blocks were visually inspected first and then tested for compressive and splitting tensile strengths, slip/skid resistance, abrasion resistance, total water absorption, and thermal conductivity. Keeping the same mix design and curing process for all blocks of different binders allowed direct results comparison.
For each binder, 16 blocks were produced, of which eight were carbonated. For each block, a 2 L mix was prepared. The mixes’ compositions (in kg/m3) are shown in Table 2. For alkali-activated binders, the Na2O/precursor percentage chosen was 10%, while the SiO2/Na2O ratio was 1.0. As preliminary trials showed flash setting, especially in the FA mixes, a 4% mass proportion of setting retarder was incorporated and dissolved in the alkaline solution for all alkali-activated mixtures. Moreover, to attain the necessary consistency (slump flow of 105 ± 5 mm), a 2% WRA was introduced to all mixes.
Table 2.
Mix composition (kg/m3) for all binders used in Part 1.
The moulding process started immediately after preparing each mix following the predefined procedure mentioned earlier. Once the moulding process of the blocks was finished, the AAM blocks were immediately extruded and subjected to thermal curing in a thermal chamber for 24 h at 70 °C. In the case of OPC blocks, these were transported to the dry curing chamber immediately after production. After this stage, eight blocks of each family were subjected only to dry curing and placed in a chamber with 65 ± 10% RH and 23 ± 2 °C for 28 days. The other eight blocks were subjected to dry curing, under the same above-stated conditions, for 21 days, followed by 7 days in a carbonation chamber at 5% CO2, 23 ± 2 °C, and 60 ± 10% RH (Table 3). Following the curing process, the specimens (carbonated versus uncarbonated) were subjected to testing in accordance with the standard [42] (Table 4).
Table 3.
Curing stages and number of specimens per type of binder.
Table 4.
Number of specimens per binder (both carbonated and uncarbonated) subjected to each test.
2.7.2. Part 2—Definition of an Optimized Mix Design for Each Binder
Based on the results obtained in Part 1, a new experimental campaign similar to the previous one was then carried out with optimized mix design, curing regime, and testing procedures. The resulting blocks’ performance was re-evaluated in accordance with the standard for conventional concrete pavement blocks, EN 1338 [42].
In terms of mix design, in this part of the experimental campaign, the optimal water content for each binder was used based on previously reported results (Section 2.6.1) as a step to achieve maximized performance, improved workability, and compactness results. The mix composition and w/b ratio for each binder are shown in Table 5. For alkali-activated binders, the Na2O/precursor percentage was kept at 10% and the SiO2/Na2O ratio at 1.0. The same amount of setting retarder was used for all alkaline solutions. Moreover, a 1.5% WRA was added to OPC and MIBA mixes, while only 1% was added to EAFS mixes. No WRA was added to FA mixes. The mixes were moulded following the procedure previously described (Section 2.6.2), then demoulded and cured. The same curing regime as that defined in the previous part of the experimental campaign was implemented for FA, MIBA, and EAFS blocks (Table 3). However, for the OPC blocks, the thermal curing stage was replaced by a wet curing stage (Figure 3). To that end, right after demoulding, the OPC blocks were consistently water-sprayed on all sides three times a day over three days, then transported to the dry chamber and afterwards to the carbonation chamber (8 specimens only for carbonation).
Table 5.
Mix composition (kg/m3) for all binders used in Part 2.

Figure 3.
Comparison between the pavement block production and curing procedures adopted for each part of the experimental campaign [42].
As planned, all blocks were tested afterwards, following the testing procedures previously described. It should be noted that, during the previous part of the experimental campaign (Part 1), it was observed that the steel surfaces of the hydraulic press plates did not fully cover the block surface as intended. This discrepancy was attributed to irregularities in the surface of the blocks resulting from the production process. Consequently, the metal plates, which were designed to make even contact with the entire block surface, only made contact with the “highest” point/area of the uneven surface. To address this issue and ensure consistent and uniform contact between the block and the hydraulic press plates, in this part of the campaign (Part 2), a layer of gypsum was applied to both the upper and lower surfaces of the blocks prior to testing. This gypsum layer served to create a smooth and levelled surface, facilitating proper alignment and contact between the hydraulic press plates and the block during the compressive and splitting tensile strength testing. By implementing this solution, the potential impact of uneven block surfaces on the mechanical strength test results was minimized, ensuring more reliable and accurate data for analysis and interpretation (Figure 4).

Figure 4.
Pavement blocks of (a) EAFS, (b) MIBA, (c) FA, and (d) OPC.
3. Results
3.1. Fresh-State Performance—Optimum Mix Design
After compacting each mix, the mass of the compacted material and the dry bulk density γd (kg/m3) were calculated (Figure 5). The optimum water content for each binder is the one that corresponds to the highest dry density. It is found that, in general, mixes from each binder showed a decrease in density with the increase in w/b ratio, with a w/b ratio of 0.25 leading to the highest dry density and a w/b ratio of 0.45 resulting in the lowest.

Figure 5.
Relationship between the w/b ratio and dry bulk density.
For FA mixes, samples with a w/b ratio of 0.25 showed the highest density with a value of 1835 kg/m3, while values of 1777 kg/m3, 1696 kg/m3, 1615 kg/m3, and 1593 kg/m3 were reported for mixes with w/b ratios of 0.30, 0.35, 0.40, and 0.45, respectively.
For OPC, the density of the 0.25 mix was 1764 kg/m3, which decreased to 1666 kg/m3 at 0.35; however, it increased to 1677 kg/m3 for the mix with w/b 0.40 and then decreased again to 1604 kg/m3 for the 0.45 mix.
Concerning EAFS, similarly to FA, it showed a steady decrease in dry density with the increase in water content, with 1783 kg/m3, 1776 kg/m3, 1731 kg/m3, 1689 kg/m3, and 1618 kg/m3 for w/b ratios of 0.25, 0.30, 0.35, 0.40, and 0.45, respectively.
Moreover, the density of MIBA mixes decreased with increasing water content; however, no values were reported for w/b 0.40 and 0.45 due to the observed volume expansion (Figure 6) caused by the release of hydrogen gas generated by the reaction of the metallic aluminium present in MIBA, with the alkaline solution. Other studies have reported similar behaviour [41,48,60].

Figure 6.
Visible volume expansion of MIBA seconds after compaction to the mould’s top surface level.
The decrease in density with the increase in w/b ratio for all binders can be explained by the increased mix’s water content, which has a lower density than the other components it is replacing. With the increase in the proportion of water in the mix, it functions as a lubricant, reducing inter-particle friction and promoting particle separation during compaction. This can prevent a proper arrangement of binder and aggregates, thus leading to reduced overall density and materials with lower cohesion. Furthermore, while an increase in water content may initially create the appearance of higher mix density by filling the pores of the fresh mix, it also leads to the replacement of binders with greater density when the water proportion in the mix rises, leading to a lower bulk density.
3.2. Part 1—Defining a Unified Mix Design for All Binders
3.2.1. Visual Aspect, Shape, and Dimensions
Figure 7 displays the results obtained from the inspection of the specimens’ dimensions. Except for FA mixes, all specimens exhibited similar sizes, with length, width, and thickness slightly surpassing 200 mm, 100 mm, and 80 mm, respectively. Although a few of these values exceeded the initial expectations, they generally remained within the limits specified by standard EN 1338 [42] (with tolerances of ±2 mm for length and width and ±3 mm for thickness). This divergence in dimensions can be attributed to the suboptimal extraction process of the specimens from the steel mould. The use of an industrialized process with appropriate moulds and extraction apparatus is likely to minimize such variations. Conversely, FA mixes displayed significant variability. The FA blocks, upon extraction, demonstrated a degree of slump, evident in the lower thickness (Figure 7c) and increased length and width values (Figure 7a,b). These results indicate a higher than necessary water content, despite the reasonably low w/b ratio of 0.25. This highlights the need to reduce the water content to improve the dimensional stability of the FA blocks.

Figure 7.
Average (a) length, (b) width, and (c) thickness results of the blocks, obtained in Part 1 of the experimental campaign (U—uncarbonated; C—carbonated).
3.2.2. Slip/Skid Resistance
Figure 8 shows the USRV results of the blocks measured using pendulum friction test equipment. The pendulum measurements gave minimum and maximum values of 60 and 85.5, respectively.

Figure 8.
Slip/skid resistance results of blocks with OPC, FA, MIBA, and EAFS, obtained in Part 1 of the experimental campaign (U—uncarbonated; C—carbonated).
OPC specimens exhibited values of 82.5 and 88.5 for carbonated and uncarbonated specimens, respectively, indicating a high level of roughness. In turn, the carbonated and uncarbonated specimens of MIBA showed values of 79 and 84.5, respectively, indicative of a decent surface roughness. Similarly, the EAFS blocks proved to be adequate for pavement block production after reporting values over 80 for both carbonated and uncarbonated specimens. Moreover, the FA blocks showed the lowest slip resistance, with values of 60 and 70.5 for carbonated and uncarbonated specimens, respectively.
OPC, MIBA, and EAFS specimens showed results exceeding 75, which, according to the standard [42], are classified as having an extremely low potential for slip. This characteristic proves these blocks are well-suited for pedestrian sidewalks, offering sufficient roughness to reduce skidding and thereby enhancing safety. Additionally, when compared to conventional natural stones typically used for pedestrian sidewalks, the MIBA and EAFS pavement blocks show comparability in providing adequate roughness, contributing to improved safety measures. FA specimens, despite having the lowest slip resistance results, can be classified as having a low slip potential, showing pendulum test values ranging between 40 and 74.
The accelerated carbonation curing stage showed minimal impact on the surface roughness. The differences between the carbonated and uncarbonated specimens are insignificant and were likely caused by the production process.
3.2.3. Splitting Tensile and Compressive Strengths
The results of the splitting tensile and compressive strength tests carried out according to EN 1338 [42] are represented in Figure 9 and Figure 10, respectively.

Figure 9.
Splitting tensile strength of blocks with OPC, FA, MIBA, and EAFS, obtained in Part 1 of the experimental campaign (U—uncarbonated; C—carbonated).

Figure 10.
Compressive strength of blocks with OPC, FA, MIBA, and EAFS, obtained in Part 1 of the experimental campaign (U—uncarbonated; C—carbonated).
The carbonated FA blocks showed the highest splitting tensile strength after reporting 4.85 MPa and 5.55 MPa for uncarbonated and carbonated specimens (Figure 9), respectively, exceeding the minimum value set by the standard for conventional concrete pavement blocks (3.6 MPa). Similarly, an increase in compressive strength was noticed for carbonated FA blocks compared to the uncarbonated ones, indicating 73.8 MPa for the former and 68.4 MPa for the latter (Figure 10). The improved performance observed for FA blocks can be attributed to the presence of highly reactive amorphous aluminosilicate phases when exposed to an alkaline environment. These phases undergo dissolution and subsequent coagulation, forming sodium aluminosilicate hydrate (N-A-S-H) phases, primarily in the form of Si-O-Si bridges given the high amount of silica in the raw materials. The formation of these chains contributes to overall strength development [61]. In addition to the presence of amorphous phases, the SiO2/Na2O ratio plays a crucial role in strength development. By maintaining a SiO2/Na2O ratio of 1.0, which was determined through a previous optimization stage, additional Si4+ species are generated from the sodium silicate. These species contribute to the formation of further strength-enhancing phases.
Unexpectedly, the OPC blocks showed relatively low values of splitting tensile strength: 2.20 MPa and 2.75 MPa for uncarbonated and carbonated blocks, respectively. In terms of compressive strength, the carbonated and uncarbonated OPC specimens indicated close results (21.6 MPa and 21.8 MPa, respectively). This poor performance is directly linked to the low w/b ratio (0.25) used for all mixes, including those of OPC. As a result, the OPC mix was visibly dry. In addition, no wet curing was used at this stage to homogenize the curing process for all blocks and thus facilitate the comparison of results. Thus, the OPC blocks failed to meet the standard due to incomplete hydration.
The MIBA blocks showed insignificant microstructural improvements after carbonation. Carbonated specimens presented values of 21.9 MPa and 1.27 MPa, while uncarbonated specimens reported 20.5 MPa and 1.26 MPa of compressive and splitting tensile strengths, respectively.
The EAFS blocks showed the lowest performance among the binders. 12.9 MPa and 9.20 MPa were the compressive strengths reported for carbonated and uncarbonated specimens, respectively, while 0.96 MPa and 0.65 MPa were recorded as the splitting tensile strengths for carbonated and uncarbonated EAFS samples, respectively. Despite showing slight improvement in performance after carbonation, the EAFS blocks failed to meet the minimum strengths set by the standard.
Although they demonstrate binding abilities in alkali activation settings, the mechanical performance of MIBA and EAFS blocks falls short of that achieved by FA blocks. This disparity can be attributed to the lower number of amorphous phases present in MIBA and EAFS when compared to those in FA. Consequently, the formation of strength-enhancing C-(N)-A-S-H phases is less pronounced in these materials. Furthermore, MIBA contains notable amounts of metallic aluminium from several sources, such as bottle caps, cans, and aluminium foil. This metallic aluminium undergoes oxidation upon contact with the alkaline solution, resulting in the release of hydrogen gas (H2) during the plastic state of the mixture. The evolution of gas leads to the formation of entrained gas pockets and increased porosity in the resulting specimens. Consequently, the specimens exhibit protuberances and are larger than expected, as indicated in Figure 7.
In summary, the superior performance observed in FA blocks can be attributed to the abundance of amorphous phases and the generation of strength-enhancing N-A-S-H phases. In contrast, MIBA and EAFS blocks exhibit lower amorphous phase content and, in the case of the former, face challenges related to the presence of metallic aluminium, which results in an expansive reaction and increased porosity in the final specimens.
Regarding the impact of the accelerated carbonation curing stage, although of low significance, a positive effect was observed for all binders. The presence of CO2 in a microstructure, characterized by a moderate mechanical performance and an adequate porosity level, can trigger the decalcification of calcium-bearing phases (both Si-based and others). This decalcification process results in the precipitation of carbonates within adjacent voids and potentially leads to the formation of amorphous Si gel, which in turn can contribute to the development of larger polymer chains and thus to improved performance [62].
Nevertheless, in contrast with previous studies where notable improvements were observed after carbonation, the MIBA blocks in this particular investigation showed negligible differences. This can be attributed to the use of larger specimens, which necessitate significantly more time to achieve comparable levels of carbonation under the same conditions (atmospheric pressure, 5% CO2, and 60% relative humidity). In fact, when applying a phenolphthalein solution to the fractured surfaces of the blocks after a 7-day carbonation period, the predominantly pinkish colour indicated a minimal reduction in pH levels during this timeframe. This stands in contrast to observations from previous studies [32,39,41,63], implying a relatively slower rate of carbonation (in this case) within the given period.
3.2.4. Abrasion Resistance
The volume losses due to abrasion obtained using the Böhme test apparatus are illustrated in Figure 11. Firstly, comparing the average volume loss between uncarbonated (OPC-U, FA-U, and MIBA-U) and carbonated (OPC-C, FA-C, and MIBA-C) specimens provided contradictory information as the accelerated carbonation curing appears to have varying effects on each binder. For instance, for OPC blocks, the carbonated specimens showed a higher average volume loss (52 cm3) than the uncarbonated ones (39 cm3), indicating a potential reduction in abrasion resistance due to accelerated carbonation.
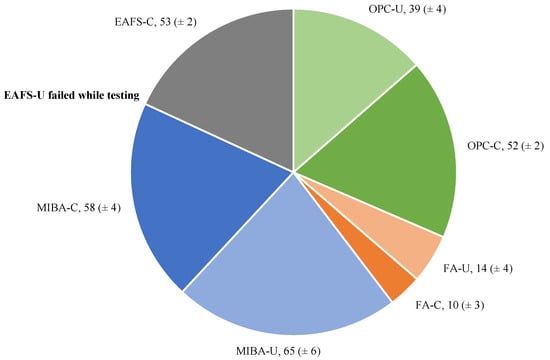
Figure 11.
Average volume loss (in cm3) due to abrasion of the blocks for all binders, obtained in Part 1 of the experimental campaign.
In contrast, for FA blocks, the carbonated specimens exhibited lower average volume loss values (10 cm3) than the uncarbonated ones (14 cm3), suggesting that accelerated carbonation of the FA blocks improved their resistance to abrasion. Similarly, for MIBA blocks, the average volume loss of the carbonated specimens (58 cm3) was lower than that of the uncarbonated specimens (65 cm3), indicating a possible positive impact of accelerated carbonation on the abrasion resistance of MIBA blocks. Similar cases of microstructural performance enhancement for alkali-activated MIBA exposed to induced carbonation curing were reported in other studies from the literature [32,41].
It is worth noting that the uncarbonated EAFS specimen failed during the test, while the carbonated counterpart did not. This outlier represents an important observation, highlighting the impact of accelerated carbonation on the EAFS blocks’ microstructural performance. Similar behaviour related to microstructural improvements was reported by other studies, reinforcing the positive influence of accelerated CO2 curing on the mechanical performance of alkali-activated slag [39,64]. However, further investigation is necessary to understand the reasons behind this observation. In addition to volume loss analysis, investigating the microstructural differences between uncarbonated and carbonated specimens, as well as variations among different binders, can provide insight into the underlying mechanisms affecting abrasion resistance.
Based on the classification outlined in the standard, it is evident that the FA specimens, whether carbonated or uncarbonated, successfully fulfilled the criteria for class 4 (Marking I). Consequently, these specimens are deemed suitable for application as pavement blocks in areas characterized by substantial pedestrian and vehicular traffic. Conversely, the OPC, MIBA, and EAFS blocks are classified in the lowest category (class 1-Marking F) for concrete pavement blocks, making them appropriate solely for lighter pedestrian and vehicular usage scenarios such as gardens.
3.2.5. Total Water Absorption
Figure 12 presents the total water absorption by percentage of (dry) mass for all binders, for both carbonated and uncarbonated specimens.

Figure 12.
Comparison of water absorption for carbonated and uncarbonated specimens by binder type, obtained in Part 1 of the experimental campaign.
As expected, FA’s dense microstructure showed the lowest average water absorption of all the tested blocks: 2.88% and 3.31% for uncarbonated and carbonated specimens, respectively. The results indicated that the carbonation did not lead to improvements in the microstructure of FA. However, the FA blocks met the standard after presenting water absorption values lower than 6% (the maximum limit set by EN 1338 [42]) and can be classified as class 2 (Marking B) and therefore suitable for paving block use. The OPC specimens reported average values of 6.88% and 5.99% for uncarbonated and carbonated blocks, respectively. After carbonation, the OPC specimen met the standard for pavement blocks, whereas the uncarbonated one did not, thus highlighting the impact of forced carbonation on the formation of a denser microstructure for this binder. Similarly, the average water absorption was 7.64% and 7.06% for uncarbonated and carbonated MIBA specimens, respectively, suggesting a decrease in porosity owing to carbonation. However, the same was not observed for EAFS blocks, which presented the highest average water absorption for the carbonated specimen (7.79%), but a lower absorption for the uncarbonated block (6.51%).
3.2.6. Thermal Conductivity
Figure 13 presents the thermal conductivity results. The uncarbonated OPC and FA specimens reported the highest thermal conductivity of 1.53 W/(m·K) and 1.52 W/(m·K), respectively, followed by the carbonated ones reporting 1.49 W/(m·K) and 1.44 W/(m·K) for OPC-C and FA-C, respectively. As expected, MIBA blocks showed lower thermal conductivity results of 1.09 W/(m·K) and 1.03 W/(m·K) for uncarbonated and carbonated blocks, respectively. The lowest thermal conductivity results were seen for EAFS blocks, with 0.94 W/(m·K) and 0.91 W/(m·K) for EAFS-U and EAFS-C, respectively.

Figure 13.
Thermal conductivity results determined using the ISOMET 2114′s surface probe, obtained in Part 1 of the experimental campaign.
The difference between the carbonated and uncarbonated specimens of all binders was insignificant, and thus comparing the effects of carbonation for this test may be inconclusive. The results demonstrate that OPC and FA specimens possess higher thermal conductivity due to their denser microstructures. On the other hand, MIBA and EAFS blocks exhibited lower thermal conductivity values, indicating a comparatively higher porosity level. However, it is important to note that the influence of other factors and properties on the overall thermal performance of the pavement blocks should be considered for a comprehensive analysis.
3.3. Part 2—Defining an Optimized Mixed Design for Each Binder
3.3.1. Visual Aspect, Shape, and Dimensions
Figure 14 shows the block dimensions obtained after inspection. Despite increasing the water content for OPC, MIBA, and EAFS mixes, they presented acceptable dimensions again, ranging within the limits defined by the standard EN 1338 [42]. However, this was not the case for FA, despite keeping the w/b at 0.25. FA blocks showed significant dimensional changes after demoulding, mainly settlement due to self-weight. This settlement can be seen in Figure 14c, which represents the thickness of the blocks. As a recommendation, the water content for FA needs to be reduced (e.g., w/b 0.22) to reduce the workability of the mixes. Further optimizations need to be made to achieve reduced workability without affecting cohesion, thus avoiding the behaviour reported during this part of the experimental campaign.

Figure 14.
Average (a) length, (b) width, and (c) thickness of the blocks, obtained in Part 2 of the experimental campaign.
3.3.2. Slip/Skid Resistance
The USRV results determined using the pendulum friction test equipment are presented in Figure 15. A reduction in the slip/skid resistance can be observed when compared to the previous part of the experimental campaign (Part 1). The reason behind this is the increase in the water content for OPC, MIBA, and EAFS mixes, which increased the smoothness of the blocks’ top surface. Nevertheless, the results still lie within an acceptable range (low to extremely low slipping potential) according to the standard [42]. The OPC-C, FA-U, and MIBA-U USRV results exceeded 75 and were classified as having an extremely low potential for slipping. Moreover, the remaining specimens showed USRV results ranging between 40 and 74, indicating a low potential for slipping. Therefore, all blocks showed acceptable slip/skid results and are suitable to be used as pavement blocks.

Figure 15.
Slip/skid resistance results of blocks with OPC, FA, MIBA, and EAFS, obtained in Part 2 of the experimental campaign.
The differences between the carbonated and uncarbonated specimens did not follow any given trend, and they were mainly caused by the production process. Again, the carbonation curing stage did not influence the surface roughness of the blocks.
3.3.3. Splitting Tensile and Compressive Strengths
The splitting tensile and compressive strength results are shown in Figure 16 and Figure 17, respectively. Again, the FA blocks showed the highest performance, exceeding a value of 11 MPa for the splitting tensile strength and an 80 MPa compressive strength for the uncarbonated blocks. A considerably lower splitting tensile strength value was reported for the carbonated FA specimens. However, this phenomenon did not extend to the compressive strength results, which yielded a value of 77.8 MPa. This finding suggests that the deformation previously reported in FA blocks had an impact on their performance during the testing process. Despite keeping the same w/b ratio for the FA mixes, a significant strength increase (~10 MPa increase in compressive strength for FA-U) was seen in comparison with the previous part of the experimental campaign (Part 1), where no adjustments to the block surface levels had been made, thus demonstrating the importance of such a step for more reliable results.

Figure 16.
Splitting tensile strength of blocks with OPC, FA, MIBA, and EAFS, obtained in Part 2 of the experimental campaign.

Figure 17.
Compressive strength of blocks with OPC, FA, MIBA, and EAFS, obtained in Part 2 of the experimental campaign.
Furthermore, the increase in the w/b ratio, the addition of a wet curing stage, and the adjustment of the surface levels significantly increased the performance of OPC blocks. The splitting tensile strength values almost doubled, being 4.1 MPa and 4.9 MPa for uncarbonated and carbonated OPC specimens, respectively, compared to 2.20 MPa and 2.75 MPa reported in the previous part of the experimental campaign (Part 1). For the compressive strength, the values obtained for OPC-U and OPC-C specimens were 58.6 MPa and 62.7 MPa, respectively, compared to only 21.8 MPa and 21.61 MPa reported in the previous part of the campaign (Part 1) when a lower water content was used.
Both FA and OPC specimens met the standard for concrete pavement blocks after exhibiting splitting tensile strength values higher than 3.6 MPa [42].
Regarding the MIBA specimens, low compressive and splitting tensile strength results were obtained due to the excessive formation of hydrogen gas resulting from the reaction between the aluminium content and the alkaline solution. This reaction led to increased porosity and microstructural disturbances within the MIBA blocks. Moreover, the EAFS showed improvements in compressive strength results, as 17.8 MPa and 19.4 MPa were obtained for EAFS-U and EAFS-C, respectively. However, the splitting tensile strength results revealed insignificant improvements compared to the results from the previous part of the campaign (Part 1), i.e., 1.3 MPa and 1.2 MPa for EAFS-U and EAFS-C, respectively. Other studies have also reported a negative influence of accelerated carbonation curing on the mechanical performance of alkali-activated slag [65,66,67]. One possible reason could be the need for further optimization, mainly due to the factors influencing the carbonation curing method such as temperature, CO2 percentage, pressure, relative humidity, and curing duration. Furthermore, the ongoing precipitation of calcium and sodium carbonates in the few existing voids of dense microstructures leads to slight expansion, which causes microcracking and thus decreased mechanical performance. This effect may worsen as a result of the decalcification of structural phases such as C-(A-)S-H.
Again, very small changes in strength were caused by carbonation curing, prompting the need for more optimized carbonation curing conditions for both MIBA and EAFS.
3.3.4. Abrasion Resistance
The average mass loss due to abrasion for each binder obtained using the Böhme test apparatus is presented in Figure 18. For OPC blocks, the carbonated specimens showed higher resistance to abrasion (37 g loss) compared to the uncarbonated ones (43 g loss). This contrasts with what was reported in the previous part of the campaign (Part 1), where the carbonated OPC specimens unexpectedly showed lower resistance to abrasion compared to the uncarbonated ones.

Figure 18.
Average weight loss (g) due to abrasion of the blocks for all binders, obtained in Part 2 of the experimental campaign.
FA-C blocks showed similar resistance to abrasion (18 g loss) to FA-U (19 g loss), unlike what was reported previously, where the carbonated FA block showed higher resistance to abrasion compared to the uncarbonated specimen.
Moreover, unlike the improvement in abrasion resistance shown by the MIBA-C blocks compared to the MIBA-U blocks, in this part of the campaign, the opposite was seen where the carbonated MIBA blocks showed slightly lower resistance to abrasion after losing an average of 76 g, compared to 70 g for the uncarbonated MIBA specimens.
As for EAFS blocks, the carbonated specimen showed the highest loss in weight and thus the lowest resistance to abrasion. However, the EAFS-U blocks failed again while testing, similar to what happened previously in Part 1 when a lower water content was used in the mix.
3.3.5. Total Water Absorption
The total water absorption by percentage of (dry) mass for carbonated and uncarbonated OPC, FA, MIBA, and EAFS blocks is presented in Figure 19. FA-U and FA-C blocks showed very close values of water absorption (3.53% and 3.52%, respectively) and were comparable to the results reported in the previous part of the experimental campaign (Part 1), where 2.88% and 3.31% were obtained for FA-U and FA-C blocks, respectively.

Figure 19.
Comparison of water absorption for carbonated and uncarbonated specimens for all binders, obtained in Part 2 of the experimental campaign.
Significant improvements were observed for OPC blocks, which displayed water absorption values of 4.26% (OPC-U) and 3.98% (OPC-C) in Part 2 of the campaign but 6.88% and 6.00% in Part 1 (when a w/b ratio of 0.25 was used).
As abovementioned, the increase in water content for MIBA mixes trapped the hydrogen gas released by the reaction of aluminium content with the alkaline solution, increasing the porosity and thus the water absorption of the MIBA blocks. Consequently, these specimens showed an increase in water absorption in this part of the campaign (8.32% and 9.53% for MIBA-U and MIBA-C, respectively), when compared to the values reported previously (7.64% and 7.06%).
Furthermore, comparable results (7.16% and 6.93% for EAFS-U and EAFS-C, respectively) to those obtained previously for a w/b ratio of 0.25 (6.51% and 7.79%) were obtained for EAFS blocks.
Inconclusive changes were caused by accelerated carbonation curing for any of the binders.
3.3.6. Thermal Conductivity
Figure 20 shows the thermal conductivity results of the carbonated and uncarbonated specimens for all binders. OPC-U and FA-C blocks displayed the highest thermal conductivity values (1.42 W/(m·K) and 1.39 W/(m·K), respectively). In turn, OPC-C and FA-U blocks presented lower thermal conductivity values (1.12 W/(m·K) and 1.10 W/(m·K), respectively), which suggests the presence of a higher porosity compared to OPC-U and FA-C, respectively. Furthermore, the carbonated MIBA block exhibited a higher thermal conductivity (0.76 W/(m·K)) than the MIBA-U one (0.70 W/(m·K)), indicating a denser microstructure. Similarly, the carbonated block of EAFS showed a higher thermal conductivity (0.92 W/(m·K)) than its uncarbonated counterpart (0.80 W/(m·K)).

Figure 20.
Thermal conductivity results determined using the ISOMET 2114′s surface probe, obtained in Part 2 of the experimental campaign.
FA, MIBA, and EAFS blocks presented increased thermal conductivity performance/value after exposure to accelerated carbonation (unlike the results reported in Part 1 of the campaign, where the opposite phenomenon was reported for all binders), proving the positive influence of this curing stage on the microstructure of the aforementioned alkali-activated binders.
4. Conclusions and Recommendations
This study aimed at understanding the technical viability of using alkali-activated aluminosilicate industrial wastes to produce concrete pavement blocks according to European standards, in an attempt to fully replace ordinary Portland cement.
Preliminary fresh-state trials were conducted to identify the optimal water content for each binder, ensuring acceptable workability, compactability, and cohesiveness for pavement block production. A modified Proctor compaction test revealed that density decreased with increasing water-to-binder ratios. Binders with the lowest water content exhibited the highest density, with fly ash showing the highest values at a water-to-binder ratio of 0.25. The choice of water influences mix workability, compactability, and density, highlighting the importance of selecting the appropriate water-to-binder ratio for various applications.
Two parts of an experimental campaign were conducted to compare carbonated and uncarbonated blocks and demonstrate the effect of a forced carbonation process on the performance of an alkali-activated binder. In the first part, water content and curing conditions were standardized across all binders, including Portland cement, to ensure a reliable comparison. While accelerated carbonation curing improved the performance of most alkali-activated blocks, some cases, particularly with fly ash, exhibited micro-cracks and reduced mechanical performance due to limited space for the precipitation of calcium or sodium carbonates.
Despite expectations, the results of the first part did not show significant changes in performance after carbonation, especially in terms of compressive and splitting tensile strengths. This discrepancy was likely due to the fixed water content used for all binders, disregarding variations in chemical composition and the importance of an optimized water-to-binder ratio for each. Furthermore, using the same curing regime for Portland cement and alkali-activated materials resulted in underperforming results for cement mixes, highlighting the need for tailored curing stages considering each binder’s hydration conditions.
The second part of the campaign aimed at enhancing the accuracy of results by addressing previous findings. Optimized water content for each binder mix was adopted to improve workability, compactability, and performance, ensuring an adequate microstructure to check the influence of carbonation. Additionally, thermal curing for alkali-activated binders was replaced with wet curing for Portland cement blocks, meeting conventional hydration requirements. Adjustments to the splitting tensile and compressive strength tests were made to ensure reliable results.
Results from the second part showed significant performance improvements, especially for Portland cement blocks, with compressive strength comparable to fly ash-based blocks. However, despite carbonation-related enhancements, the electric arc furnace slag and municipal solid waste incinerator bottom ash binders did not meet minimum standard requirements for concrete pavement blocks in terms of splitting tensile and compressive strengths.
These findings offer insights into optimal water-to-binder ratio and mix designs for alkali-activated concrete pavement blocks, enhancing their industrial applicability. The study also demonstrates the positive impact of CO2-curing on the mechanical performance of alkali-activated calcium aluminosilicate-based binders. Recommendations for future research include optimizing alkaline solutions, mix designs, and carbonation curing techniques for each binder, warranting further investigation.
Author Contributions
Conceptualization, R.V.S. and A.P.C.D.; methodology, R.V.S., A.P.C.D. and B.A.S.; formal analysis, G.L.; investigation, G.L., D.K. and B.A.S.; writing—original draft preparation, G.L.; writing—review and editing, R.V.S., A.P.C.D. and J.d.B.; supervision, R.V.S., A.P.C.D. and J.d.B.; project administration, R.V.S. and A.P.C.D.; funding acquisition, R.V.S. All authors have read and agreed to the published version of the manuscript.
Funding
This research was funded by the FCT—Foundation for Science and Technology—through the research project EXPL/ECI-EGC/0288/2021 (ECO2Alkrete). This work is also part of the research activity carried out at Civil Engineering Research and Innovation for Sustainability (CERIS) in the framework of project UIDB/04625/2020 funded by the FCT.
Institutional Review Board Statement
Not applicable.
Informed Consent Statement
Not applicable.
Data Availability Statement
The data presented in this study are available on request from the corresponding author.
Acknowledgments
The authors acknowledge the support of Civil Engineering Research and Innovation for Sustainability (CERIS), the IST, and the University of Lisbon.
Conflicts of Interest
The authors declare no conflicts of interest.
References
- Mindess, S.; Young, J.F.; Darwin, D. Concrete, 2nd ed.; Prentice Hall, Pearson Education, Inc.: Hoboken, NJ, USA, 2003. [Google Scholar]
- Kurdowski, W. Cement and Concrete Chemistry; Springer: Berlin/Heidelberg, Germany, 2014; p. 699. [Google Scholar]
- Belaïd, F. How does concrete and cement industry transformation contribute to mitigating climate change challenges? Resour. Conserv. Recycl. Adv. 2022, 15, 200084. [Google Scholar] [CrossRef]
- Uwasu, M.; Hara, K.; Yabar, H. World cement production and environmental implications. Environ. Dev. 2014, 10, 36–47. [Google Scholar] [CrossRef]
- At the Top, Burj Khalifa, Fact Sheet. Available online: www.atthetop.ae (accessed on 9 August 2023).
- IEA. Cement Roadmap. Available online: http://www.iea.org/publications/freepublications/publication/Cement_Roadmap_Foldout_WEB.pdf (accessed on 2 November 2015).
- Klappholz, S. Cement and Construction Industries Gather Together to Find Solutions for a Net Zero CO2 Emissions Future; World Cement: Farnham Surrey, UK, 2022. [Google Scholar]
- Ramsden, K. Cement and Concrete: The Environmental Impact. Available online: https://psci.princeton.edu/tips/2020/11/3/cement-and-concrete-the-environmental-impact (accessed on 9 August 2023).
- Ashraf, W. Carbonation of cement-based materials: Challenges and opportunities. Constr. Build. Mater. 2016, 120, 558–570. [Google Scholar] [CrossRef]
- Lothenbach, B.; Scrivener, K.; Hooton, R.D. Supplementary cementitious materials. Cem. Concr. Res. 2011, 41, 1244–1256. [Google Scholar] [CrossRef]
- Juenger, M.C.G.; Siddique, R. Recent advances in understanding the role of supplementary cementitious materials in concrete. Cem. Concr. Res. 2015, 78, 71–80. [Google Scholar] [CrossRef]
- Yang, K.-H.; Jung, Y.-B.; Cho, M.-S.; Tae, S.-H. Effect of supplementary cementitious materials on reduction of CO2 emissions from concrete. J. Clean. Prod. 2015, 103, 774–783. [Google Scholar] [CrossRef]
- Wu, B.; Ye, G. Development of porosity of cement paste blended with supplementary cementitious materials after carbonation. Constr. Build. Mater. 2017, 145, 52–61. [Google Scholar] [CrossRef]
- Von Greve-Dierfeld, S.; Lothenbach, B.; Vollpracht, A.; Wu, B.; Huet, B.; Andrade, C.; Medina, C.; Thiel, C.; Gruyaert, E.; Vanoutrive, H.; et al. Understanding the carbonation of concrete with supplementary cementitious materials: A critical review by RILEM TC 281-CCC. Mater. Struct. 2020, 53, 136. [Google Scholar] [CrossRef]
- Tang, P.; Chen, W.; Xuan, D.X.; Zuo, Y.; Poon, C.S. Investigation of cementitious properties of different constituents in municipal solid waste incineration bottom ash as supplementary cementitious materials. J. Clean. Prod. 2020, 258, 120675. [Google Scholar] [CrossRef]
- Sevim, O.; Alakara, E.H.; Guzelkucuk, S. Fresh and Hardened Properties of Cementitious Composites Incorporating Firebrick Powder from Construction and Demolition Waste. Buildings 2023, 13, 45. [Google Scholar] [CrossRef]
- Sevim, O.; Demir, İ.; Alakara, E.H.; Guzelkucuk, S.; Bayer, İ.R. The Effect of Magnetized Water on the Fresh and Hardened Properties of Slag/Fly Ash-Based Cementitious Composites. Buildings 2023, 13, 271. [Google Scholar] [CrossRef]
- Palomo, A.; Grutzeck, M.W.; Blanco, M.T. Alkali-activated fly ashes: A cement for the future. Cem. Concr. Res. 1999, 29, 1323–1329. [Google Scholar] [CrossRef]
- Fernández-Jiménez, A.; Palomo, A. Composition and microstructure of alkali activated fly ash binder: Effect of the activator. Cem. Concr. Res. 2005, 35, 1984–1992. [Google Scholar] [CrossRef]
- Bakharev, T. Geopolymeric materials prepared using Class F fly ash and elevated temperature curing. Cem. Concr. Res. 2005, 35, 1224–1232. [Google Scholar] [CrossRef]
- Somna, K.; Jaturapitakkul, C.; Kajitvichyanukul, P.; Chindaprasirt, P. NaOH-activated ground fly ash geopolymer cured at ambient temperature. Fuel 2011, 90, 2118–2124. [Google Scholar] [CrossRef]
- Ryu, G.S.; Lee, Y.B.; Koh, K.T.; Chung, Y.S. The mechanical properties of fly ash-based geopolymer concrete with alkaline activators. Constr. Build. Mater. 2013, 47, 409–418. [Google Scholar] [CrossRef]
- Lee, N.K.; Lee, H.K. Setting and mechanical properties of alkali-activated fly ash/slag concrete manufactured at room temperature. Constr. Build. Mater. 2013, 47, 1201–1209. [Google Scholar] [CrossRef]
- Fernandez-Jimenez, A.M.; Palomo, A.; Lopez-Hombrados, C. Engineering properties of alkali-activated fly ash concrete. ACI Mater. J. 2006, 103, 106–112. [Google Scholar] [CrossRef]
- Chi, M.; Huang, R. Binding mechanism and properties of alkali-activated fly ash/slag mortars. Constr. Build. Mater. 2013, 40, 291–298. [Google Scholar] [CrossRef]
- Gao, X.; Yu, Q.L.; Brouwers, H.J.H. Reaction kinetics, gel character and strength of ambient temperature cured alkali activated slag–fly ash blends. Constr. Build. Mater. 2015, 80, 105–115. [Google Scholar] [CrossRef]
- Puertas, F.; Martínez-Ramírez, S.; Alonso, S.; Vázquez, T. Alkali-activated fly ash/slag cements: Strength behaviour and hydration products. Cem. Concr. Res. 2000, 30, 1625–1632. [Google Scholar] [CrossRef]
- Ismail, I.; Bernal, S.A.; Provis, J.L.; San Nicolas, R.; Hamdan, S.; van Deventer, J.S.J. Modification of phase evolution in alkali-activated blast furnace slag by the incorporation of fly ash. Cem. Concr. Compos. 2014, 45, 125–135. [Google Scholar] [CrossRef]
- Lamaa, G.; Duarte, A.P.C.; Silva, R.V.; de Brito, J. Carbonation of Alkali-Activated Materials: A Review. Materials 2023, 16, 3086. [Google Scholar] [CrossRef]
- Martinez-Lopez, R.; Ivan Escalante-Garcia, J. Alkali activated composite binders of waste silica soda lime glass and blast furnace slag: Strength as a function of the composition. Constr. Build. Mater. 2016, 119, 119–129. [Google Scholar] [CrossRef]
- Wang, R.; Mirza, N.; Vasbieva, D.G.; Abbas, Q.; Xiong, D. The nexus of carbon emissions, financial development, renewable energy consumption, and technological innovation: What should be the priorities in light of COP 21 Agreements? J. Environ. Manag. 2020, 271, 111027. [Google Scholar] [CrossRef]
- Casanova, S.; Silva, R.V.; de Brito, J.; Pereira, M.F.C. Mortars with alkali-activated municipal solid waste incinerator bottom ash and fine recycled aggregates. J. Clean. Prod. 2021, 289, 125707. [Google Scholar] [CrossRef]
- Suescum-Morales, D.; Bravo, M.; Silva, R.V.; Jiménez, J.R.; Fernandez-Rodriguez, J.M.; de Brito, J. Effect of reactive magnesium oxide in alkali-activated fly ash mortars exposed to accelerated CO2 curing. Constr. Build. Mater. 2022, 342, 127999. [Google Scholar] [CrossRef]
- Liu, J.; Hu, L.; Tang, L.; Ren, J. Utilisation of municipal solid waste incinerator (MSWI) fly ash with metakaolin for preparation of alkali-activated cementitious material. J. Hazard. Mater. 2021, 402, 123451. [Google Scholar] [CrossRef] [PubMed]
- Kurda, R.; Silva, R.V.; de Brito, J. Incorporation of Alkali-Activated Municipal Solid Waste Incinerator Bottom Ash in Mortar and Concrete: A Critical Review. Materials 2020, 13, 3428. [Google Scholar] [CrossRef]
- Ren, J.; Hu, L.; Dong, Z.J.; Tang, L.P.; Xing, F.; Liu, J. Effect of silica fume on the mechanical property and hydration characteristic of alkali-activated municipal solid waste incinerator (MSWI) fly ash. J. Clean. Prod. 2021, 295, 126317. [Google Scholar] [CrossRef]
- Ozturk, M.; Bankir, M.B.; Bolukbasi, O.S.; Sevim, U.K. Alkali activation of electric arc furnace slag: Mechanical properties and micro analyzes. J. Build. Eng. 2019, 21, 97–105. [Google Scholar] [CrossRef]
- Traven, K.; Češnovar, M.; Ducman, V. Particle size manipulation as an influential parameter in the development of mechanical properties in electric arc furnace slag-based AAM. Ceram. Int. 2019, 45, 22632–22641. [Google Scholar] [CrossRef]
- Kassim, D.; Lamaa, G.; Silva, R.V.; de Brito, J. Performance Enhancement of Alkali-Activated Electric Arc Furnace Slag Mortars through an Accelerated CO2 Curing Process. Appl. Sci. 2022, 12, 1662. [Google Scholar] [CrossRef]
- Lamaa, G.; Suescum-Morales, D.; Duarte, A.P.C.; Silva, R.V.; de Brito, J. Optimising the Performance of CO2-Cured Alkali-Activated Aluminosilicate Industrial By-Products as Precursors. Materials 2023, 16, 1923. [Google Scholar] [CrossRef]
- Avila, Y.; Silva, R.V.; de Brito, J. Alkali-Activated Materials with Pre-Treated Municipal Solid Waste Incinerator Bottom Ash. Appl. Sci. 2022, 12, 3535. [Google Scholar] [CrossRef]
- EN-1338; Concrete Paving Blocks—Requirements and Test Methods. European Committee for Standardization: Brussels, Belgium, 2003; p. 76.
- EN 197-1; Cement. Composition, Specifications and Conformity Criteria for Common Cements. European Committee for Standardization: Brussels, Belgium, 2000; p. 50.
- Ozturk, M.; Akgol, O.; Sevim, U.K.; Karaaslan, M.; Demirci, M.; Unal, E. Experimental work on mechanical, electromagnetic and microwave shielding effectiveness properties of mortar containing electric arc furnace slag. Constr. Build. Mater. 2018, 165, 58–63. [Google Scholar] [CrossRef]
- JCPDS. Joint Committee on International Centre for Diffraction Data; Powder Diffraction File, PDF-4/Organics 2003; International Centre for Diffraction Data: Newtown Square, PA, USA, 2003. [Google Scholar]
- Rashad, A.M.; Zeedan, S.R. The effect of activator concentration on the residual strength of alkali-activated fly ash pastes subjected to thermal load. Constr. Build. Mater. 2011, 25, 3098–3107. [Google Scholar] [CrossRef]
- Cho, Y.-K.; Yoo, S.-W.; Jung, S.-H.; Lee, K.-M.; Kwon, S.-J. Effect of Na2O content, SiO2/Na2O molar ratio, and curing conditions on the compressive strength of FA-based geopolymer. Constr. Build. Mater. 2017, 145, 253–260. [Google Scholar] [CrossRef]
- Suescum-Morales, D.; Silva, R.V.; Bravo, M.; Jiménez, J.R.; Fernández-Rodríguez, J.M.; de Brito, J. Effect of incorporating municipal solid waste incinerated bottom ash in alkali-activated fly ash concrete subjected to accelerated CO2 curing. J. Clean. Prod. 2022, 370, 133533. [Google Scholar] [CrossRef]
- Hidalgo López, A.; García Calvo, J.L.; García Olmo, J.; Petit, S.; Alonso, M.C. Microstructural Evolution of Calcium Aluminate Cements Hydration with Silica Fume and Fly Ash Additions by Scanning Electron Microscopy, and Mid and Near-Infrared Spectroscopy. J. Am. Ceram. Soc. 2008, 91, 1258–1265. [Google Scholar] [CrossRef]
- Lucia, F.-C.; Torrens-Martín, D.; Morales, L.M.; Sagrario, M.-R. Infrared Spectroscopy in the Analysis of Building and Construction Materials. In Infrared Spectroscopy; Theophile, T., Ed.; IntechOpen: Rijeka, Croatia, 2012; p. Ch. 19. [Google Scholar]
- Garcia Calvo, J.L.; Sanchez Moreno, M.; Alonso Alonso, M.C.; Hidalgo Lopez, A.; Garcia Olmo, J. Study of the Microstructure Evolution of Low-pH Cements Based on Ordinary Portland Cement (OPC) by Mid- and Near-Infrared Spectroscopy, and Their Influence on Corrosion of Steel Reinforcement. Materials 2013, 6, 2508–2521. [Google Scholar] [CrossRef]
- Criado, M.; Fernández-Jiménez, A.; Palomo, A. Alkali activation of fly ash: Effect of the SiO2/Na2O ratio. Microporous Mesoporous Mater. 2007, 106, 180–191. [Google Scholar] [CrossRef]
- Aziz, I.H.; Zulkifly, K.; Sakkas, K.; Panias, D.; Tsaousi, G.M.; Bakri, M.M.A.A.; Yong, H.C. The Characterization of Steel Slag by Alkali Activation. OALib 2017, 04, 80267. [Google Scholar] [CrossRef]
- García Lodeiro, I.; Macphee, D.E.; Palomo, A.; Fernández-Jiménez, A. Effect of alkalis on fresh C–S–H gels. FTIR analysis. Cem. Concr. Res. 2009, 39, 147–153. [Google Scholar] [CrossRef]
- EN-12620:2002+A1:2008; Aggregates for Concrete. European Committee for Standardization: Brussels, Belgium, 2008; p. 56.
- Europeia, U. Diretiva 98/83/CE do Conselho, de 3 de novembro de 1998, relativa à qualidade da água destinada ao consumo humano. J. Of. Das Comunidades Europeias. L 1998, 330, 32–54. [Google Scholar]
- EN-1015-3; Methods of Test for Mortar for Masonry—Part 3: Determination of Consistence of Fresh Mortar (By Flow Table). European Committee for Standardization: Brussels, Belgium, 1999; p. 10.
- ASTM-D698; Standard Test Methods for Laboratory Compaction Characteristics of Soil Using Standard Effort (12,400 ft-lbf/ft3 (600 kN-m/m3)). ASTM: West Conshohocken, PA, USA, 2012.
- LNEC-E-197; Solos—Ensaio de Compactação. National Laboratory in Civil Engineering (LNEC—Laboratório Nacional de Engenharia Civil): Lisbon, Portugal, 1966; p. 8.
- Nithiya, A.; Saffarzadeh, A.; Shimaoka, T. Hydrogen gas generation from metal aluminum-water interaction in municipal solid waste incineration (MSWI) bottom ash. Waste Manag. 2018, 73, 342–350. [Google Scholar] [CrossRef] [PubMed]
- Provis, J.L.; van Deventer, J.S.J. Alkali Activated Materials: State-of-the-Art Report, RILEM TC 224-AAM; RILEM State—Art Report; Springer: Berlin/Heidelberg, Germany, 2014. [Google Scholar] [CrossRef]
- Li, Z.; He, Z.; Shao, Y. Early age carbonation heat and products of tricalcium silicate paste subject to carbon dioxide curing. Materials 2018, 11, 730. [Google Scholar] [CrossRef]
- Carvalho, R.; Silva, R.V.; de Brito, J.; Pereira, M.F.C. Alkali activation of bottom ash from municipal solid waste incineration: Optimization of NaOH- and Na 2SiO3-based activators. J. Clean. Prod. 2021, 291, 125930. [Google Scholar] [CrossRef]
- Bernal, S.A.; de Gutierrez, R.M.; Provis, J.L.; Rose, V. Effect of silicate modulus and metakaolin incorporation on the carbonation of alkali silicate-activated slags. Cem. Concr. Res. 2010, 40, 898–907. [Google Scholar] [CrossRef]
- Nedeljković, M.; Zuo, Y.; Arbi, K.; Ye, G. Carbonation Resistance of Alkali-Activated Slag Under Natural and Accelerated Conditions. J. Sustain. Metall. 2018, 4, 33–49. [Google Scholar] [CrossRef]
- Puertas, F.; Palacios, M.; Vázquez, T. Carbonation process of alkali-activated slag mortars. J. Mater. Sci. 2006, 41, 3071–3082. [Google Scholar] [CrossRef]
- Bakharev, T.; Sanjayan, J.G.; Cheng, Y.B. Resistance of alkali-activated slag concrete to carbonation. Cem. Concr. Res. 2001, 31, 1277–1283. [Google Scholar] [CrossRef]
Disclaimer/Publisher’s Note: The statements, opinions and data contained in all publications are solely those of the individual author(s) and contributor(s) and not of MDPI and/or the editor(s). MDPI and/or the editor(s) disclaim responsibility for any injury to people or property resulting from any ideas, methods, instructions or products referred to in the content. |
© 2024 by the authors. Licensee MDPI, Basel, Switzerland. This article is an open access article distributed under the terms and conditions of the Creative Commons Attribution (CC BY) license (https://creativecommons.org/licenses/by/4.0/).