Article

Durability Evaluation of Polyurethane-Bound Porous Rubber Pavement for Sustainable Urban Infrastructure

1
Centre for Pavement and Transportation Technology, Department of Civil and Environmental Engineering, University of Waterloo, 200 University Avenue West, Waterloo, ON N2L 3G1, Canada
2
Department of Civil and Environmental Engineering, University of Waterloo, 200 University Avenue West, Waterloo, ON N2L 3G1, Canada
3
Department of Civil Engineering, McMaster University, 1280 Main St. West, Hamilton, ON L8S 4L8, Canada
*
Author to whom correspondence should be addressed.
Constr. Mater. 2024, 4(2), 382-400; https://doi.org/10.3390/constrmater4020021
Submission received: 12 February 2024 / Revised: 1 April 2024 / Accepted: 9 April 2024 / Published: 15 April 2024

Abstract

:
Permeable pavements are vital in sustainable urban water management, addressing critical challenges while enhancing environmental resilience. This study focuses on the innovative polyurethane-bound Porous Rubber Pavement (PRP), which possesses high permeability and elasticity due to its unique composition of stone and crumb rubber aggregates with polyurethane binders. PRP’s useful benefits, such as noise reduction, efficient snow/ice management, and others, enhance its appeal, emphasizing the necessity for a thorough investigation into its performance and characteristics, especially in North America. To address these gaps, this paper comprehensively analyzes PRP’s durability and performance, including its strength range, failure criteria, and susceptibility to moisture-induced damage. Various testing methods are utilized, such as evaluating the abrasion loss of the stone aggregate, rutting, stripping due to moisture susceptibility, resistance to degradation from impact and abrasion, and permeability tests. This study evaluates five distinct mix compositions with varied proportions of aggregates and binders. Further, it investigates the effects of different binder types on PRP performance, such as aromatic and aliphatic binders obtained from various sources. Upon the analysis of the comprehensive test results, it was found that the mix characterized by increased rubber aggregates and a high binder content demonstrated a superior performance across various tests for PRP applications. This mix exhibited an enhanced resistance to abrasion, raveling, rutting, and permanent deformation, showcasing its durability and functionality. Additionally, when combined with an aliphatic binder, it displayed an optimal performance even in challenging freeze–thaw conditions, making it a recommended choice for long-term pavement solutions.

1. Introduction

Permeable pavements serve a dual purpose by providing structural support for traffic loading while concurrently facilitating effective water management [1,2]. They imitate the natural water cycle by holding, evaporating, infiltrating, and filtering runoff. These pavements are recognized as an effective strategy for enhancing the sustainability of surface water management in urban areas. Additionally, they contribute to strengthening resilience against climate change impacts and flood events [3,4,5,6].
In our contemporary landscape, where urban areas are rapidly expanding, the proliferation of impermeable surfaces is a growing concern, emphasizing the urgent need for sustainability and resilience in water management. With urban growth comes an increase in impermeable surfaces, hindering groundwater retention and disrupting natural hydrological processes and ecosystems. Impermeable pavements are typically constructed with multiple layers of granular materials sealed with a waterproof surface to protect against moisture and wear. On the other hand, permeable pavement systems feature a highly porous structure in their surface, base, and sub-base layers, promoting water infiltration and storage. This approach contrasts with conventional methods that focus on sealing pavements to prevent moisture damage and deterioration [3]. However, an impermeable pavement exacerbates the surface runoff volume and rate while impeding the replenishment of underground water tables. Consequently, this phenomenon poses a significant threat to natural ecosystems and contributes to disruptions in urban life, including disasters and accidents [7].
Despite their effectiveness in managing urban water and enhancing sustainability, permeable pavements often struggle with durability compared to conventional pavements. The weaker nature of permeable pavements, attributed to their open porosity, makes them more susceptible to various environmental factors such as ultraviolet (UV) radiation, air, and water, contributing to accelerated aging and rapid deterioration over time. This deterioration manifests as crack failures and a shortened service life, exacerbated by clogging issues that further diminish porosity and overall durability [8,9]. A recent study focused on the impact of environmental and vehicle factors on large-void permeable pavements’ raveling resistance, revealing that environmental factors, particularly increased UV aging and freeze–thaw cycles, significantly affect performance. Additionally, higher speeds and pressures from vehicles contribute to an increased raveling loss and reduced durability [9].
Therefore, research on permeable pavements continually aims to find an optimal solution that addresses both strength and durability. Within this context, the polyurethane-bound Porous Rubber Pavement stands out as a new and innovative type of pavement material.
PRP comprises stone and crumb rubber aggregates combined with polyurethane binders, allowing for a high degree of permeability. PRPs can exhibit a significant proportion of interconnected air voids, reaching levels of up to 40% [10]. This permeability aids in preventing hydroplaning, glare, and surface runoff issues. Moreover, incorporating a considerable quantity of crumb rubber aggregates enhances the elasticity of PRP, making it a highly flexible material. Consequently, this combination of permeability and elasticity results in a superior performance in reducing the tire-road noise compared to traditional pavement types [11,12]. Due to its shifting rigid–flexible behavior, PRP can deform ice on its surface to facilitate de-icing and reduce snow buildup during winter, while also accommodating ground movement and root intrusion damage better than conventional pavements [13,14]. The use of recycled crumb rubber aggregates in PRP enhances environmental sustainability by preventing tires from being discarded in landfills, which can have detrimental environmental effects such as space occupation, fire hazards, toxic emissions, water contamination, pest breeding, and long-term pollution [10,15].
In addition, polyurethane can be made using vegetable oil-based polyol, representing a sustainable choice that decreases reliance on petrochemicals and supports environmental goals by minimizing the environmental footprint of conventional production methods [16]. Previous studies also indicate that polyurethane binders in permeable pavements enhance the traffic surface performance, aggregate connections, material strength, and aging slowdown [7,10]. Furthermore, PRP’s energy-efficient production at room temperature (25 °C ± 1 °C) reduces greenhouse gas (GHG) emissions, providing an environmentally friendly alternative to traditional hot mix products [17].
PRP, although promising for sustainability, is underexplored in North America and is primarily utilized in low-traffic areas, pedestrian paths, and playgrounds, unlike certain European and Asian countries where it is mainly employed as a surface-wearing course. There is a notable lack of research focusing on the unique composition of PRP. This study aims to address the lack of understanding regarding PRP’s performance and characteristics, which have not been thoroughly explored. It seeks to contribute valuable insights to the academic community by addressing PRP’s identified shortcomings, including issues with raveling resistance, adhesion failure, and overall durability [18,19].
This research was conducted as part of a comprehensive study at the University of Waterloo and specifically focuses on assessing PRP’s durability in the North American climate [20]. Its durability estimates the service life, making it crucial to evaluate the benefits of permeable pavement materials [21]. The open porous nature of this pavement type often leads to a weaker pavement and raveling, making durability assessments essential.
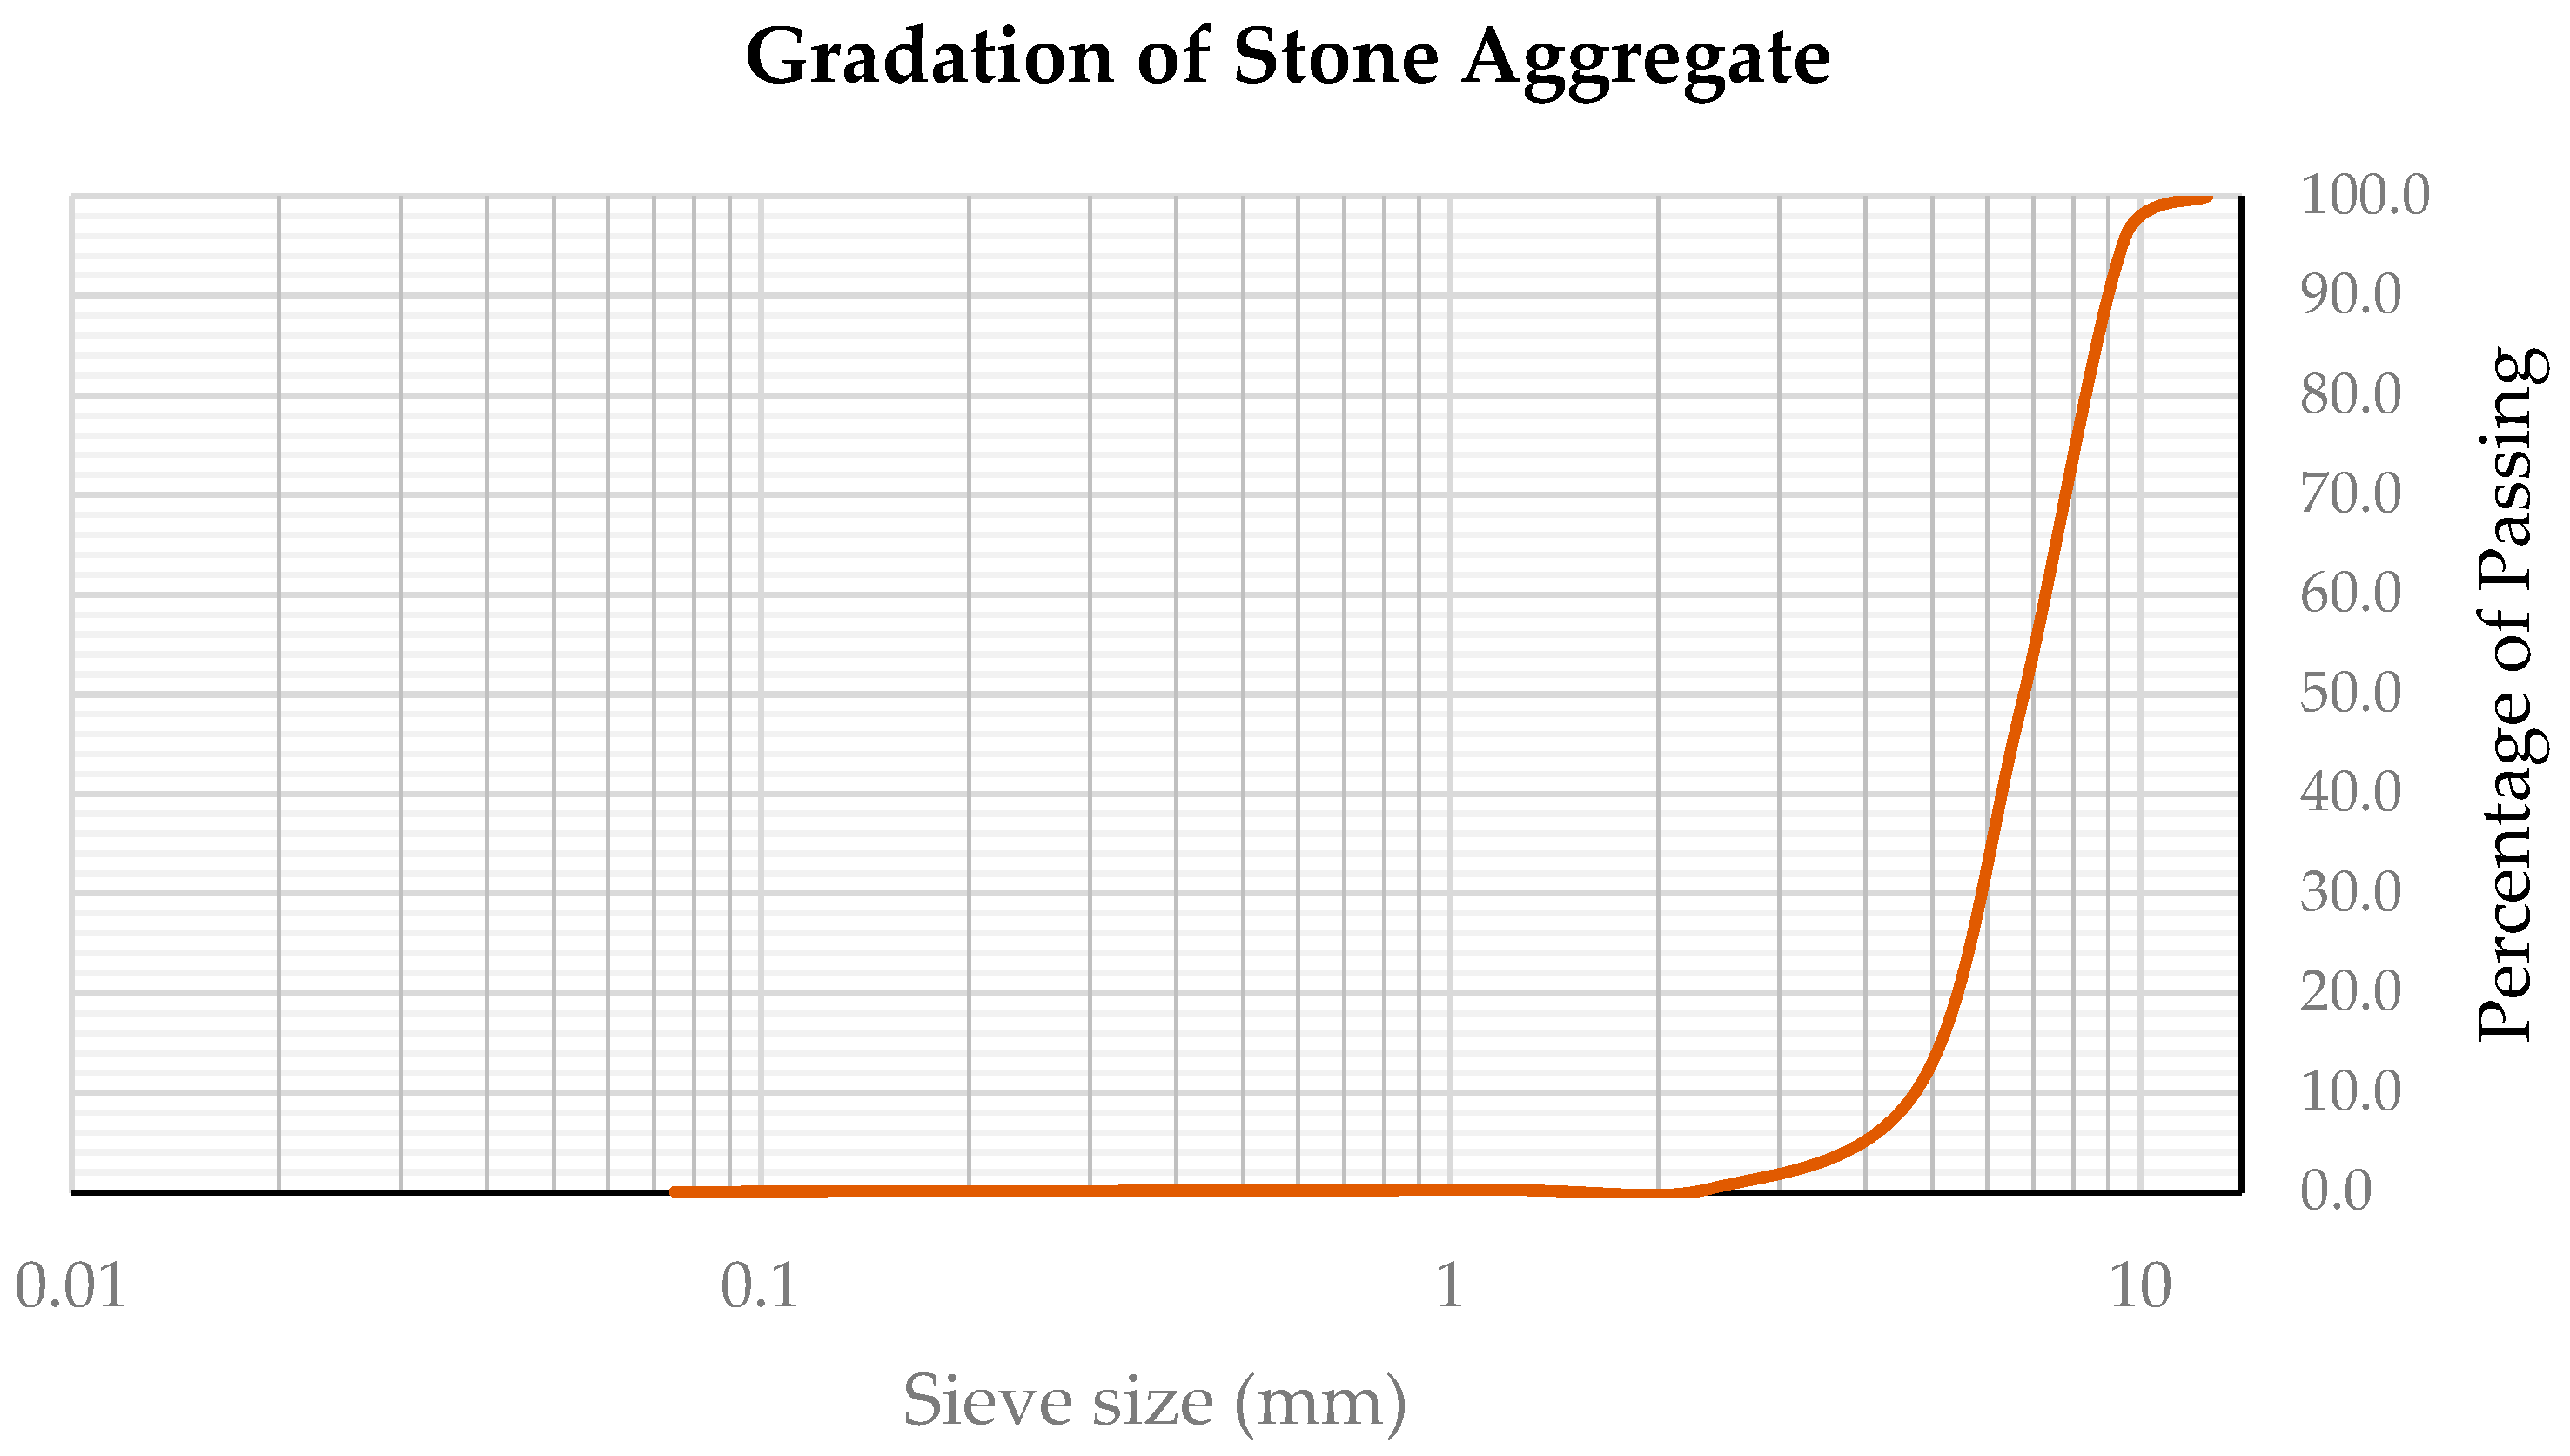
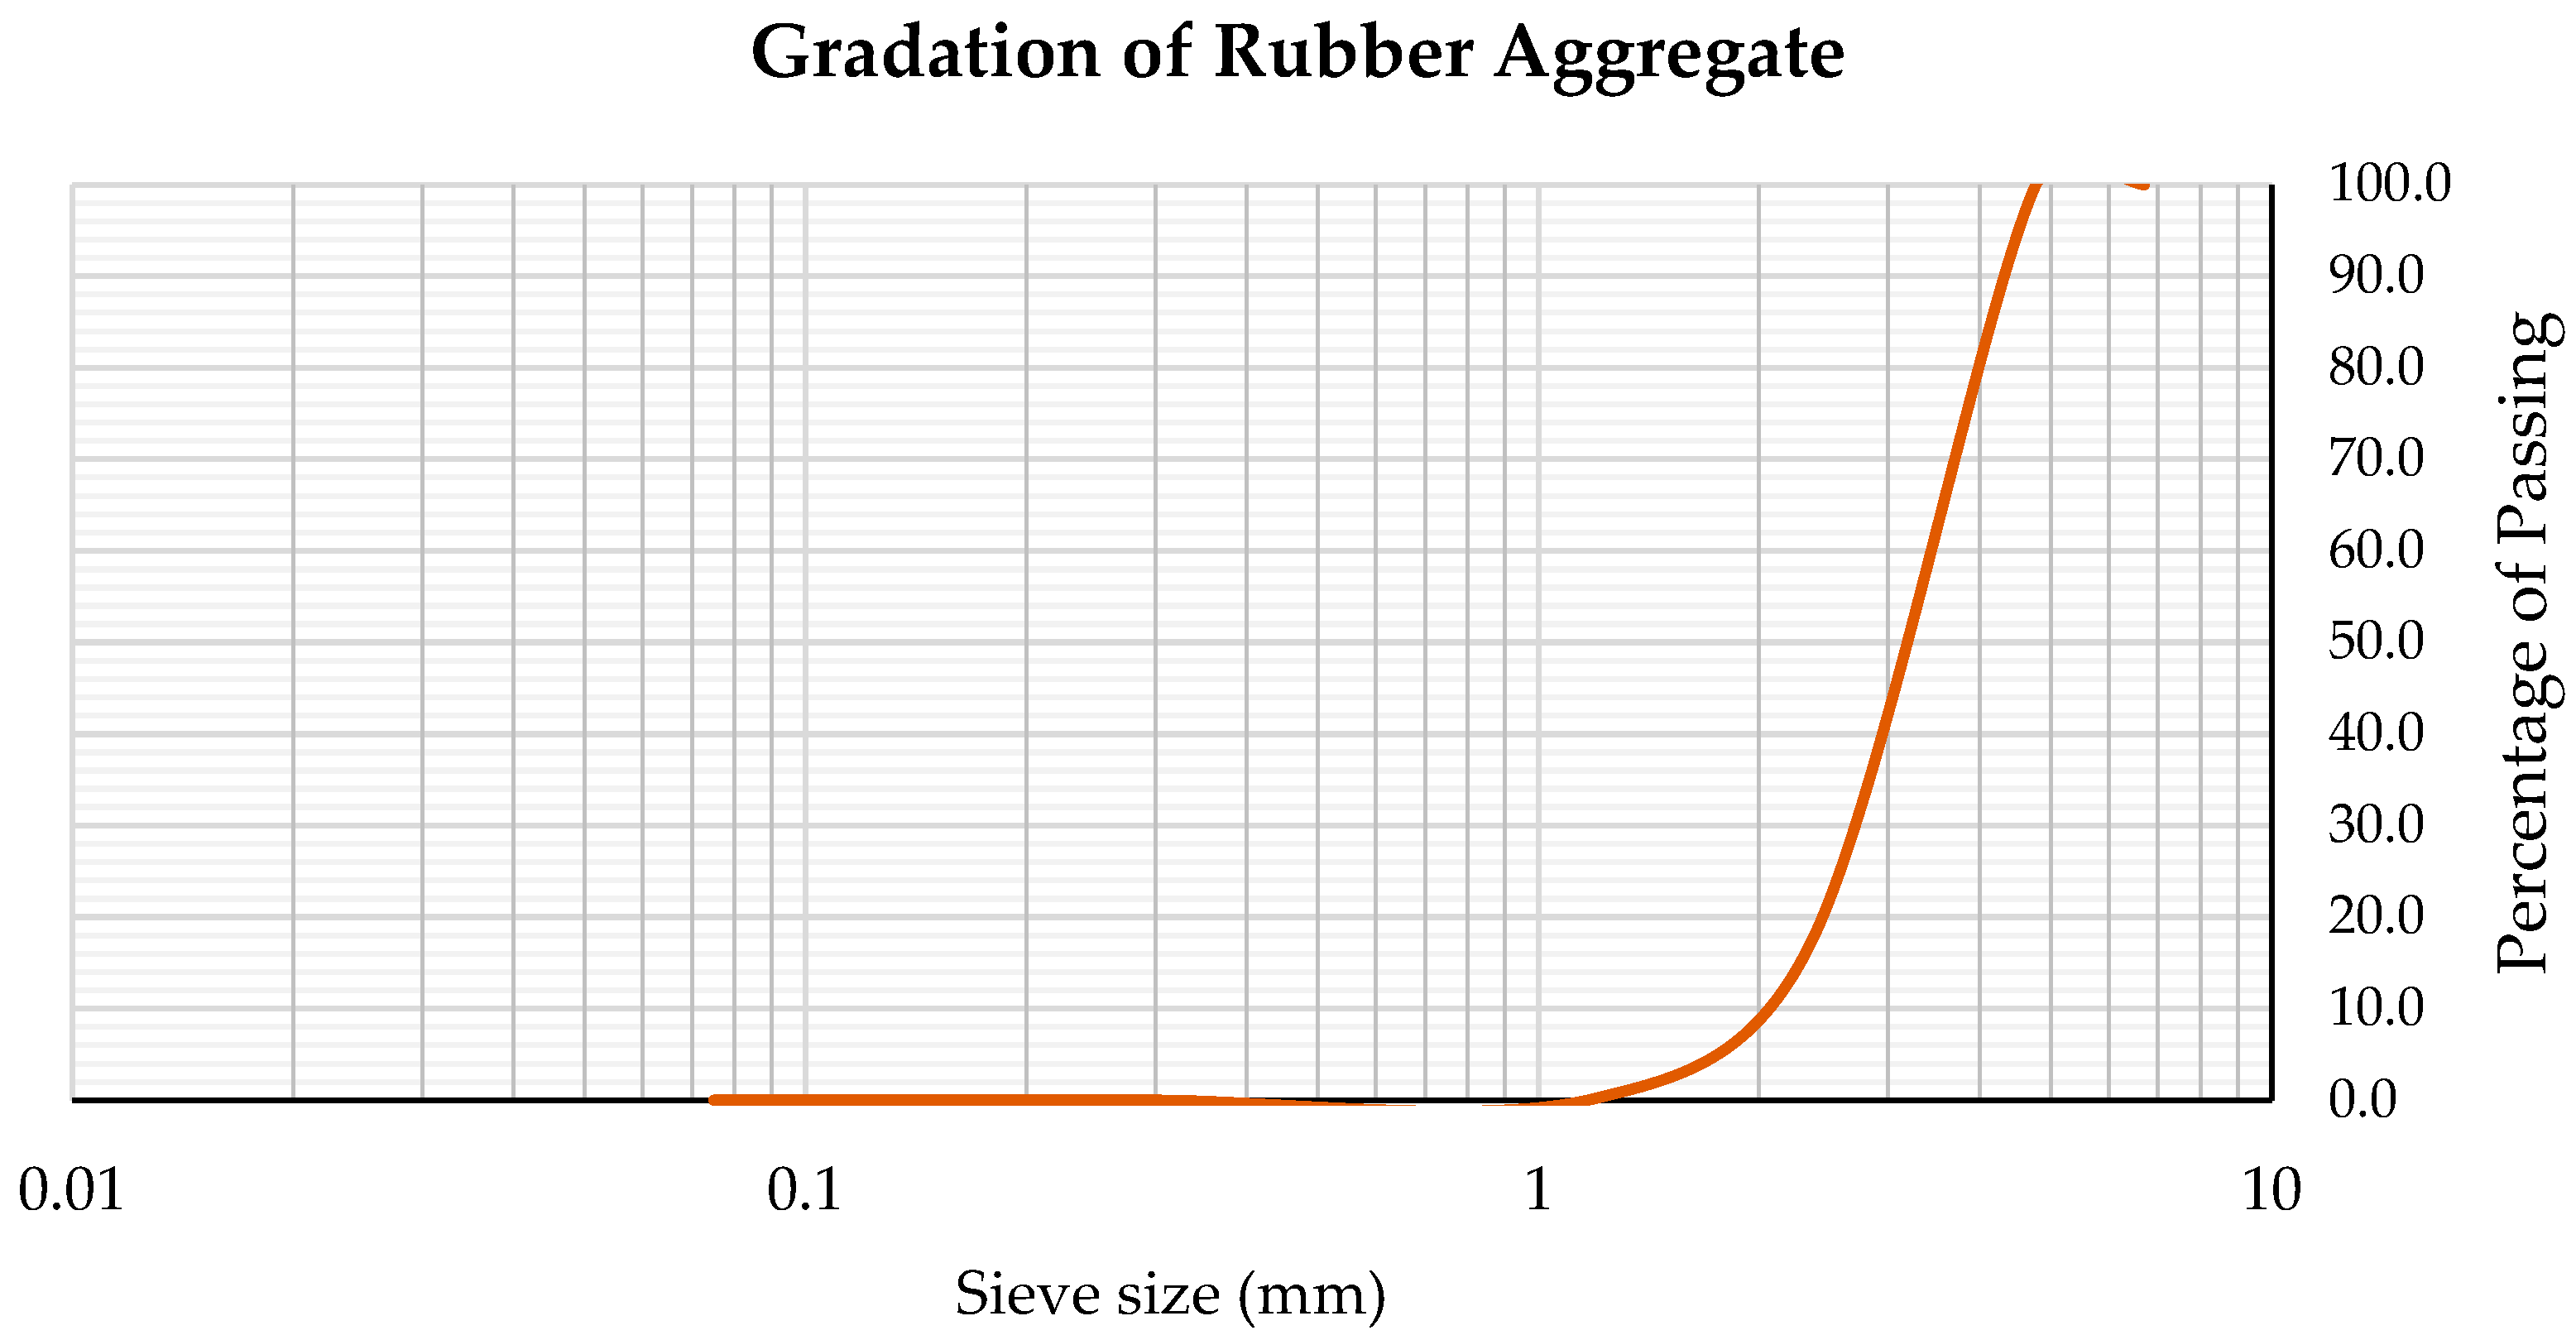
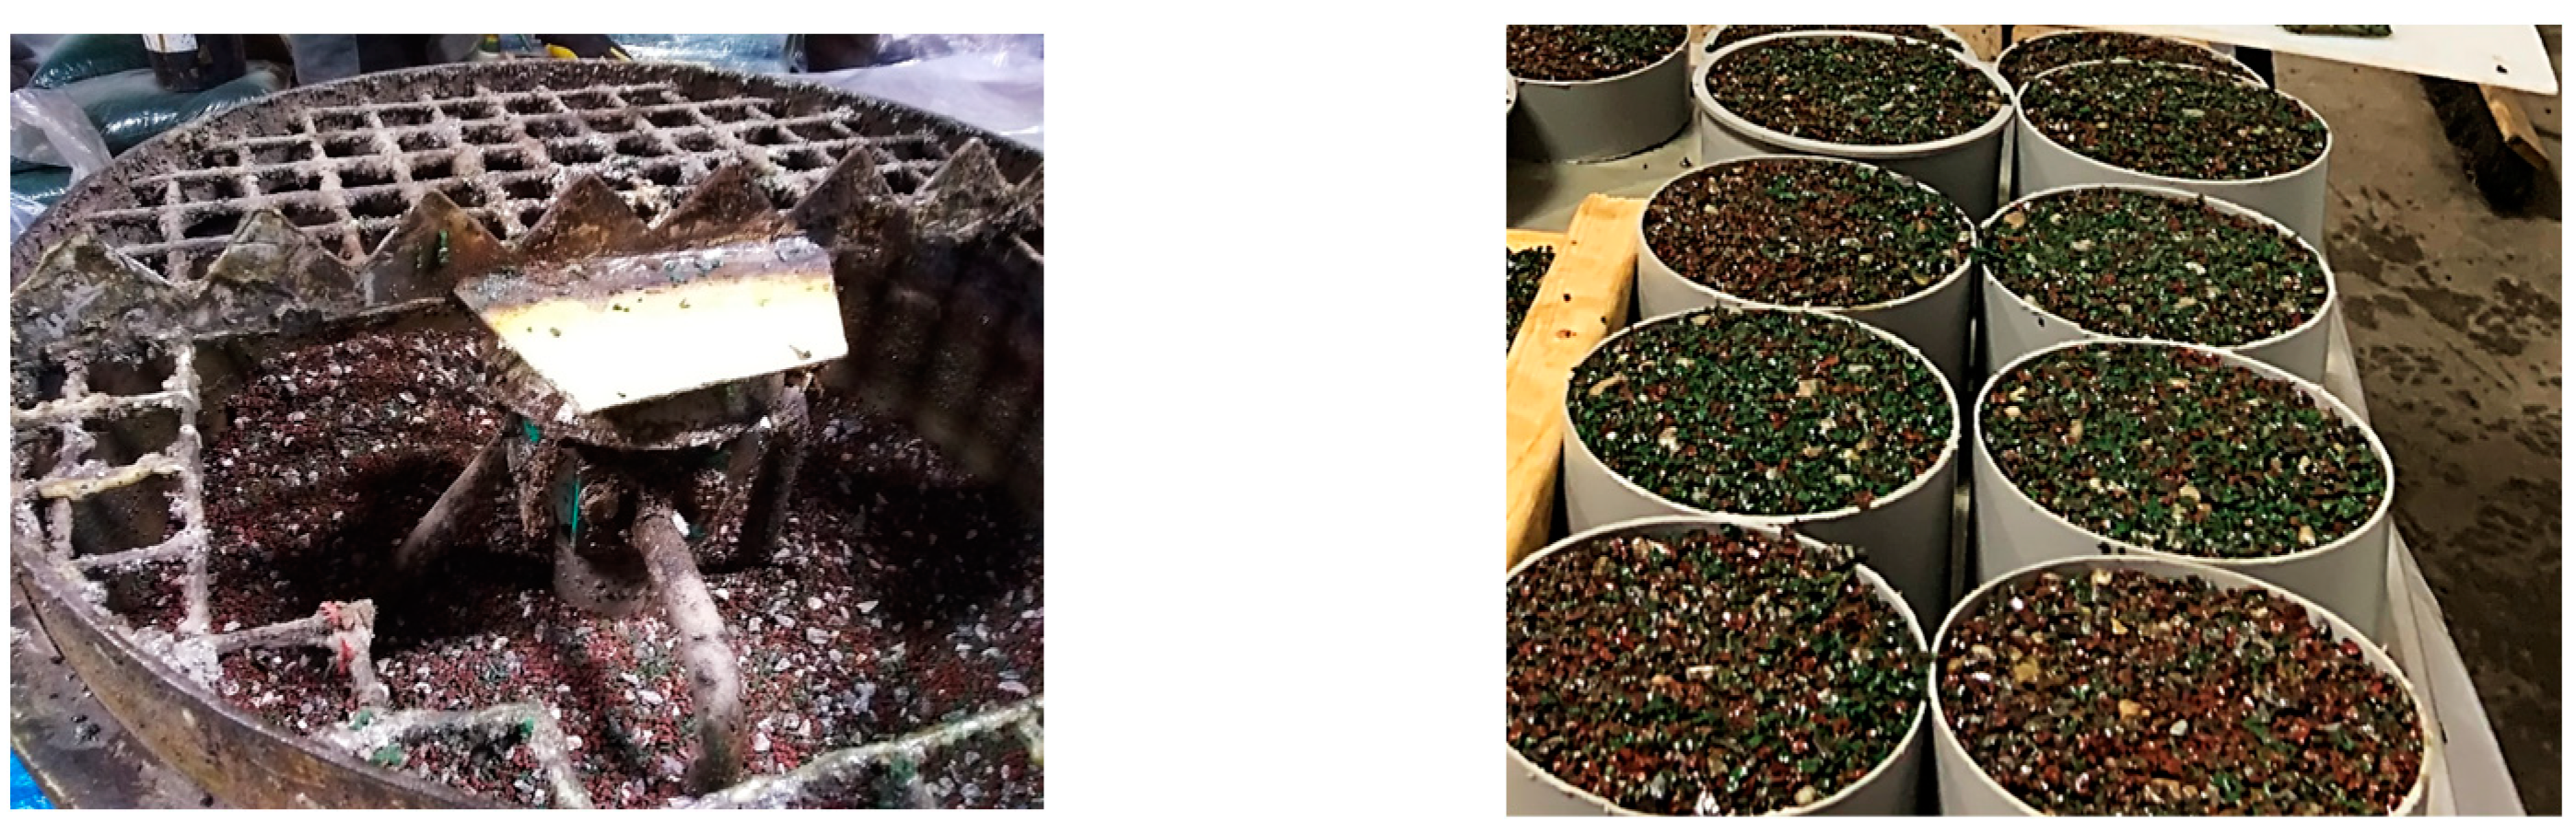
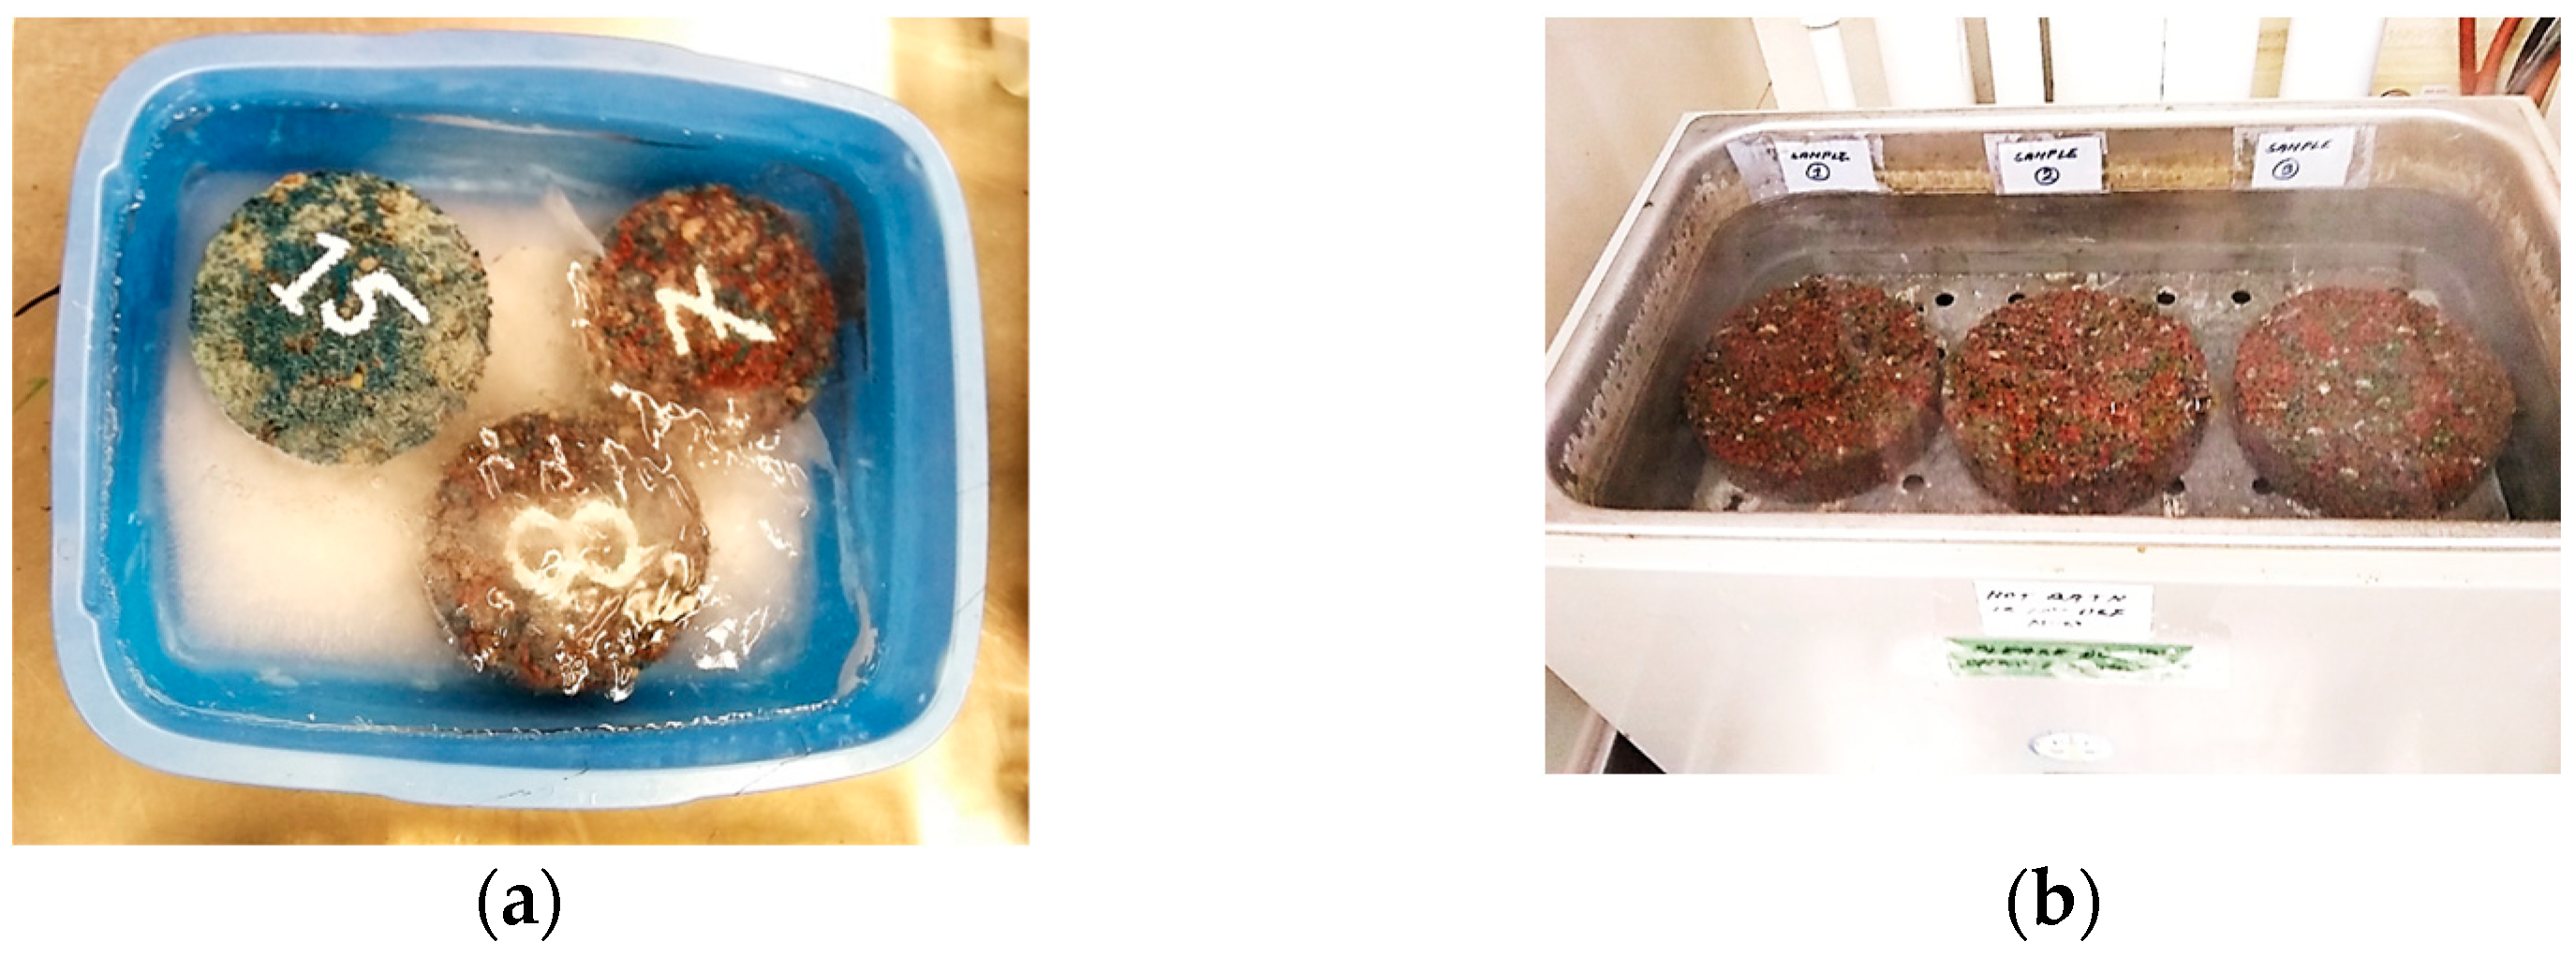
This paper investigates PRP’s strength range, failure criteria, and susceptibility to moisture-induced damage, utilizing various testing methods such as evaluating the abrasion loss of the stone aggregate, rutting, stripping due to moisture susceptibility, resistance to degradation from impact and abrasion, and permeability tests. The research methodology involves testing both the current commercial mix (Control Mix) and four new laboratory-developed mixes, along with control mixes prepared using four different binder types. Through these comprehensive investigations, this study aims to provide an understanding of PRP’s performance and durability characteristics in the North American climate.

2. Materials and Methodology

2.1. Mix Design and Materials

In this research, the Control Mix refers to the current mix that has been used commercially. Four new types of mixes were also tested in the laboratory, determined through factorial analysis. In these four new mixes, different proportions of stone aggregates, rubber aggregates, and polyurethane binder were used in the Control Mix. All mix proportions were calculated based on weight. The Control Mix consists of 45.25% stone aggregates (A), 45.25% rubber aggregates (R), and 9.5% polyurethane binder (B). New Mix 1 comprises 55% A, 37.5% R, and 7.5% B; New Mix 2 consists of 75% A, 17.5% R, and 7.5% B; New Mix 3 includes 55% A, 33% R, and 12% B; and New Mix 4 is composed of 75% A, 13% R, and 12% B. This approach facilitated a comprehensive evaluation of five distinct mix compositions. The polyurethane binder also can perform differently in the mixes if their types and sources are changed. Thus, four mixes with different types of the binder were also tested, where the proportion of the material in these mixes was kept the same as the Control Mix. The binders used were B1-aromatic for the Control Mix (in both cases, i.e., mixes with different compositions and mixes with different binders); and B2-aromatic, B2-aliphatic, and B3-aromatic for the other mixes. Aromatic binders containing Methylene diphenyl diisocyanate (MDI)-mixed isomers with aromatic parts absorb ultraviolet rays and turn yellow over time (known as ambering). This color change is cosmetic and does not affect the binder’s mechanical properties. Aliphatic binders lack aromatic parts and thus do not change color when exposed to ultraviolet rays, but they are typically pricier than aromatic ones [21,22]. New mixes and different binder types are listed in Table 1 and Table 2. All the mixes used the same rubber and granite stone aggregates. The particle size distribution of the stone aggregate is shown in Figure 1, while Figure 2 shows the distribution of the rubber aggregate. Through sieve analysis, it was found that a limited range of stone and rubber aggregates in PRP mixes ensures high permeability. Stone aggregates range mainly from 4.75 mm to 9.5 mm, while rubber aggregates range between 2.36 mm and 4.75 mm. The materials for this study were supplied by Stormflow Surfacing, Stratford, ON, Canada, our industrial partner.

2.2. Sample Preparation and Conditioning

For laboratory testing, samples were manually prepared using custom-designed plastic molds based on test protocols. Mixing and casting occurred at room temperature (25 °C ± 1 °C) due to the minimal temperature impact on the polyurethane binder’s viscosity [17]. Stone and rubber aggregates were dry-mixed for 30 to 60 s, followed by adding liquid polyurethane for homogeneous mixing. Ten initial samples were tested for air voids to adjust charging amounts for achieving target ranges. Vegetable oil facilitated demolding. Compaction with a hand-held vibrator aimed to reduce air voids, but the results showed minimal impact, indicating that the air void content is composition-dependent. The empirical study concluded that each mix has a unique air void range determined by its composition. Consequently, we focused on testing the durability of different mixes based on this understanding without specifically discussing the air voids of each mix in the subsequent analyses. Figure 3 shows the equipment and molds used in sample preparation.
To assess the raveling resistance of samples with various mix compositions and binders, as well as unconditioned samples, a separate set of conditioned samples underwent testing. This included evaluating the impact of freeze–thaw cycles on the raveling resistance. The conditioning process followed a modified test method, involving subjecting a separate set of samples to specific conditions. Initially, a partial vacuum of 660 mm Hg (26 inches) was applied for 10 min to saturate the compacted samples to whatever saturation level was achieved. The saturated specimens were then submerged in water during freezing cycles to maintain their saturation. Each freeze–thaw cycle consisted of freezing the samples at −18 °C for 16 h, followed by thawing in 60 °C hot water for 8 h, completing one cycle. This freeze–thaw procedure was repeated five times for comprehensive testing [23,24]. Figure 4 shows the conditioning process of the PRP samples.

2.3. Abrasion Loss of Stone Aggregate

The same granite aggregates were used for all mixes that were prepared for testing. The aggregates’ resistance to abrasion was determined using the Micro-Deval apparatus. The test was conducted according to ASTM D6928-17. The Micro-Deval test involved subjecting the aggregates to continuous rolling with steel balls for a specified duration to simulate abrasion under traffic conditions. This process aimed to assess the aggregates’ resistance to wear and degradation over time. Following the abrasion process, thorough washing removed loose particles and debris for an accurate abrasion loss measurement. The resulting abrasion loss values were calculated according to ASTM D6928-17 to evaluate the durability of the aggregates [25].

2.4. Hamburg Wheel Tracking Test

To evaluate the rutting, stripping, and moisture susceptibility of the compacted specimen, the Hamburg Wheel Tracking Test was used. The test was conducted in accordance with AASHTO T324-17. The permanent deformation rate from moving concentrated loads could be derived for the submerged samples through this test. This method is used to determine the premature failure of the sample mixture. The weakness of the aggregates structure, low binder stiffness, or moisture damage is the reason for this premature failure. The rut depth and the number of passes to failure are obtained through the test, and the stripping inflection point (SIP) could be calculated from those measurements, as shown in Figure 5. It is important to simulate real traffic on the pavement to get the actual result. The load applied on the Hamburg wheel tracking machine wheel is 705 ± 4.5 N (158 ± 1.0 lb) [26]. The test temperature is 53 ± 1 °C. Figure 6 shows samples under the wheel load of the Hamburg wheel tester and after removing the load.

2.5. Los Angeles Abrasion Resistance Test

The abrasion resistance test was done by following ASTM C1747/C1747M-13 [27], ‘Standard Test Method for Determining Potential Resistance to Degradation of Pervious Concrete by Impact and Abrasion.’
The materials’ resistance to degradation due to the combined effect of impact and abrasion is determined through this test in a rotating steel drum. The mass loss of the specimen is considered to determine the abrasion loss of the material shown in Figure 7 [27]. Usually, three specimens are placed in the Los Angeles machine without steel spheres. The device usually rotates for 30 to 33 min to complete 500 revolutions. However, the Los Angeles Machine was unavailable in the lab during this research. So, a medium-sized concrete mixer was used for conducting this test. This particular piece of equipment needed to run for at least 13 min to complete 500 revolutions. For this test, 500 revolutions were repeated three times. That means the samples were abraded in the machines three times. Each time was prolonged for 13 min. Initially, the samples’ weights were recorded. Then, after every 13 min, the samples’ weight was again recorded to determine the abrasion loss.

2.6. Permeability Test

The permeability of the PRP samples was tested using an NCAT Asphalt Permeameter, as shown in Figure 8. ASTM-C1701/C1701M was followed to perform the test. In this research, we used a permeameter comprising four tiers made from transparent plastic material. The lowermost tier has the largest cross-sectional area, while the upper tiers show a gradual reduction in cross-section. The initial step in conducting the permeability test involves the temporary sealing of the permeameter at the surface of the samples. Subsequently, a specified mass of water is introduced into the ring, and the duration required for complete water infiltration is carefully measured. For this particular test, we consider the diameter of the second tier, which measures 15.52 cm2 [28,29].
The formula used for calculating the infiltration rate is expressed as follows:
I = K M D 2 t
where,
  • I = Infiltration rate, mm/h or in./h;
  • M = Mass of infiltrated water, kg or lb;
  • D = Inside diameter of infiltration ring, mm or inches;
  • t = time required for the measured amount of water to infiltrate the concrete;
  • K = 4,583,666,000 in SI units or 126,870 in inch–pound units.

3. Result and Analysis

3.1. The Durability of Stone Aggregate

The Micro-Deval abrasion test determined the abrasion loss of the granite aggregates, as shown in Figure 9. The abrasion loss of the granite aggregate was found to be relatively high. The usual range for Micro-Deval abrasion loss is 17% to 20% [25]. However, the abrasion loss for the stone aggregate that has been used in the current PRP mixtures was found to be 22.25%, which indicates that this aggregate is not strong enough to ensure the strength of the PRP surface.

3.2. Permanent Deformation, Rutting, and Stripping

3.2.1. Permanent Deformation and Rutting for Mixes with Different Compositions

The Hamburg wheel test was conducted to determine the rutting resistance and moisture susceptibility of the PRP mixtures. In total, 20 specimens were prepared (four specimens for each mixture) and tested using the Hamburg wheel tracking machine.
The PRP mixtures showed a good rutting resistance, as shown in Table 3. The average rutting deformation for the different types of mixes ranged from 0.3 mm to 2.8 mm. The results are demonstrated in Figure 10 and Figure 11. During the 10,000 cycles, some more considerable rut depths were found but were mostly temporary. The reason behind this behavior was that the PRPs are very flexible materials which possess an elastic behavior. Thus, deflection occurs during the loading conditions on the material’s surface; however, the deflection disappears when the load is removed. From the analysis of the laboratory test results, it is evident that there is a notable difference in the rutting performance among mixes. New Mix 4 exhibited the highest rutting depth of 2.8 mm, whereas New Mix 2 showed the lowest rutting depth of 0.3 mm. This observation can be attributed to the specific mix design characteristics of these two mixes.
Both New Mix 4 and New Mix 2 share the common feature of having the highest percentage of stone aggregates at 75%, which contributes to their overall strength and stability. Moreover, both mixes consist of a lower percentage of crumb rubber aggregates, which are 13% and 17.5%, respectively. This lower percentage of crumb rubber in both mixes plays a role in reducing the elasticity and resistance to deformation, which impacts their rutting performance. However, the key differentiating factor lies in their binder content. New Mix 4 contains the highest percentage of polyurethane binder at 12%, while New Mix 2 has the lowest binder content at 7.5%.
The increased binder content in New Mix 4 leads to a more compact mixture under the loading conditions, resulting in higher rut depths and, subsequently, greater permanent deformation during testing. Conversely, despite having the highest percentage of stone aggregates for strength, New Mix 2 undergoes less compaction due to its lower binder content, resulting in lower rutting depths. Therefore, the combination of a higher stone aggregate content for strength and stability, along with varying binder percentages, directly influences the rutting performance of the porous rubber pavement mixes. Moreover, New Mix 3 also exhibited a lower rut depth of 0.8 mm in testing despite its high 12% binder content. This mix consisted of 55% stone aggregates and 33% rubber aggregates, which contributed to its lower rutting. The higher binder content improved component cohesion, while the increased rubber aggregates provided elasticity, helping resist permanent deformation. This balance influenced its rutting performance under load conditions.
It was not possible to establish a statistical correlation between air voids and rutting.

3.2.2. Stripping Related Abrasion for Mixes with Different Compositions

Due to rutting and moisture-induced damage, stripping-related abrasion was also found to be very small. It was found that moisture is absorbed by the stone aggregates of the samples. So, immediately after the test, the weight of the samples was found to be higher than the initial weight. However, after drying out the samples, there was little reduction observed in the weight of the samples, which ranges between 2.6% and 0.1%, as shown in Figure 12 and Table 4. The stripping-related abrasion observed aligns with the rutting and permanent deformation characteristics detailed in Section 3.2.1. Since New Mix 4 exhibited the highest permanent deformation (rutting), its stripping-related abrasion was correspondingly higher at 2.6%. In contrast, New Mix 2 and New Mix 3 showed lower permanent deformation and had the lowest stripping-related abrasion at 0.1% each.

3.2.3. Permanent Deformation and Rutting for Samples with Different Binders

The Hamburg Wheel Tracking test was conducted to evaluate permanent deformation and rutting in samples containing various types of binders, with four samples tested for each binder type. In total, sixteen samples were tested. Except for B2-aliphatic, all other samples were aromatic binders, but their sources differed. Samples with B2-aliphatic binder showed the lowest permanent deformation compared to other samples, which was 1.1 mm. The B2-aromatic and B1-aromatic binder samples showed a permanent deformation of 2.6 mm and 1.4 mm, respectively. However, samples with B3-aromatic showed the highest deformation and failed after the test. In Section 3.2.4, we discussed the temperature sensitivity of the B3-aromatic binder. Our investigation demonstrated the binder’s temperature sensitivity through high-temperature tensile strength testing, revealing a considerable decrease in the Indirect Tensile Strength from 85 kPa to 34.07 kPa after conditioning at 60 °C for two hours. These findings directly correspond to the substantial deformation and eventual failure observed in B3-aromatic samples during testing, considering the conditioning water temperature of 53 °C used in the Hamburg Wheel Tracking Test. Thus, the analysis revealed that while aliphatic binders generally offer better performance in terms of rutting and permanent deformation, the source of aromatic binders also plays a crucial role in their performance characteristics. Additionally, the analysis highlights the importance of considering temperature tolerance, as variations in binder sources can result in a differing performance under elevated temperature conditions. The results are presented in Figure 13 and Figure 14 and Table 5.

3.2.4. Stripping-Related Abrasion for Samples with Different Binders

Stripping-related abrasion due to permanent deformation and moisture-induced damage was calculated for the samples with different binders after Hamburg Wheel testing. The trend observed indicated that mixes with a lower rut depth and, consequently, lower permanent deformation experienced less stripping-related abrasion, whereas mixes with a higher rut depth and permanent deformation showed higher stripping-related abrasion, establishing a direct correlation between the rut depth, permanent deformation, and abrasion. For the samples with the B1-aromatic binder and B2-aromatic and B2-aliphatic binder, the abrasion loss percentage was found to be small, ranging between 0.3% and 0.6%. However, samples with B3-aromatic failed after the test and the abrasion loss was found to be 30.3%. The results are shown in Table 6 and Figure 15. All the samples were prepared with the same stone aggregates, and the absorption for this aggregate was a little higher. Thus, just after, the test samples’ weight for the first three types, i.e., B1-aromatic, B2-aliphatic, and B2-aromatic, were higher than the initial weight. However, the weight losses were measured after drying the tested samples to determine the abrasion loss. Further testing was conducted for high-temperature tensile strength to explain the failure of the sample with B3-aromatic. It was found that the B3-aromatic binder was temperature-sensitive. The Indirect Tensile Strength at room temperature for this sample was found to be 85 kPa. However, right after conditioning the samples at 60 °C for two hours, the Indirect Tensile Strength result was found to be 34.07 kPa. This lower tensile strength indicates that the probable reason for the failure of the samples with B3-aromatic was the temperature sensitivity of the binder. The Hamburg Wheel Tracking test uses a conditioning water temperature of 53 °C.

3.3. Raveling Resistance Due to Combined Effect of Impact and Abrasion

Raveling resistance is a critical performance for PRP materials since it directly influences the durability of the pavement material exposed to traffic loading. From the study of the previous piece of research and evidence from the field applications, it was found that PRP is not very raveling-resistant. For this research, the raveling resistance was evaluated through Los Angeles abrasion loss testing for both conditioned and unconditioned samples. One set of samples underwent five harsh freeze–thaw conditionings before being tested for raveling resistance.

3.3.1. Raveling Resistance for Samples with Different Mixes

For conditioned samples, the abrasion loss was highest in New Mix 2 (25.31%) and lowest in New Mix 3 (6.49%). Similarly, unconditioned samples exhibited consistent results, with New Mix 2 showing the highest abrasion loss (13.23%) and New Mix 3 the lowest (4.54%). These variations in the abrasion resistance can be attributed to the mix design of each. Moreover, the conditioned samples underwent freeze–thaw cycles, resulting in moisture-induced damage that subsequently reduced their durability and performance [17,31]. Xu H. et al. (2015) further explained that freeze–thaw cycles cause three primary changes in pavement materials: existing pores enlarge, separate voids merge, and new voids form [32,33]. Consequently, the mixes experience a loss in density due to increased voids, leading to decreased strength. As expected, the conditioned samples exhibited higher abrasion loss due to raveling compared to the unconditioned samples from the same mix. This difference can be attributed to the structural changes caused by freeze–thaw cycles, which result in a reduced material density and, consequently, higher susceptibility to abrasion.
New Mix 2 contains the highest percentage of stone aggregates (75%), the lowest percentage of binder (7.5%), and a lower percentage of rubber aggregates (17.5%). Conversely, New Mix 3 has the lowest percentage of stone aggregates (55%), the highest percentage of binder (12%), and a relatively higher percentage of rubber aggregates (33%).
The characteristics of New Mix 2, with its higher stone aggregate content and lower binder percentage, resulted in adhesion issues and less integration in the samples. This led to weaker bonding and integration, contributing to the higher raveling observed during the abrasion test.
On the other hand, New Mix 3, with its lower stone aggregate percentage but higher binder and rubber aggregate content, achieved better adhesion and bonding. The higher rubber aggregate content facilitated good compaction due to its elastic properties, filling gaps between aggregates and creating strong bonds with the binder, resulting in less raveling observed during testing. Raveling resistance test result for conditioned and unconditioned samples with different mixes are shown in Figure 16 and Figure 17, respectively.
The factorial analysis showed that, for conditioned samples, when the aggregate is increased by 10%, abrasion is increased by 3.84 g. When the binder is increased by 2.25%, abrasion is decreased by 5.57 g.
On the other hand, for unconditioned samples, when the aggregate is increased by 10%, abrasion is increased by 1.65 g; when the binder is increased by 2.25%, abrasion is decreased by 2.68 g.

3.3.2. Raveling Resistance for Samples with Different Binders

Abrasion due to raveling, as discussed for samples with different mix types, was similarly evaluated for samples with different binder types. These samples were also categorized into conditioned samples exposed to five freeze–thaw cycles and unconditioned samples. The results indicated that the abrasion loss in conditioned samples was consistently higher than that in unconditioned samples, regardless of the binder type. However, among the samples with different binders, there was variability in the extent of binder deterioration after conditioning. Some binders showed more significant deterioration due to moisture than others, resulting in higher rates of abrasion loss after conditioning.
The test results showed that the B2-aromatic binder deteriorated more than the other binders after freeze–thaw conditioning. In unconditioned samples, the highest abrasion loss was found in samples with the B1-aromatic binder (9.94%) and the lowest in the samples with B2-aliphatic (2.75%). Unconditioned samples with B2-aromatic showed an abrasion of 3.76%. After conditioning, samples with B2-aromatic showed a very high abrasion loss of 15.37%. However, all other samples with different binders showed an increased abrasion loss after conditioning the sample. For the B1-aromatic binder, this loss was 12.4%, for B2-aliphatic, it was 7.53%, and for B3-aromatic, it was 8.89%. In both the conditioned and unconditioned samples, the sample with the B2-aliphatic binder showed a better performance. The test results for the raveling resistance for the conditioned and unconditioned samples with different binders are shown in Figure 18 and Figure 19, respectively.
Due to the limitations of our research scope, conducting separate binder tests was not feasible to investigate the extent of binder deterioration after the freeze–thaw condition.

3.4. Permeability of PRP Materials

3.4.1. Permeability of Samples with Different Mixes

The permeability of porous pavements could depend on the material’s interconnected air voids, internal structure, and base and subgrade conditions. However, the laboratory test (as shown in Figure 20) of the Porous Rubber Pavement for permeability was mostly affected by the materials’ interconnected air voids and internal structures. It gives comparative information among different types of mixes. When the permeability of different new mixes was measured, New Mix 2 showed the highest permeability, which was 168,080 mm/h, as shown in Table 7. The lowest permeability was observed in New Mix 3 (98,628 mm/h). The probable reason could be the composition differences in the mixes that also contributed to the internal structure and porosity of the material. New Mix 2 consists of the highest percentage of stone aggregate (75%), a lower percentage of rubber aggregate (17.5%), and the lowest percentage of binder (7.5%). Thus, larger stone aggregates form comparatively rigid and large interconnected voids, leading to a higher permeability. However, New Mix 3 consists of a lower percentage of stone aggregates, a higher percentage of rubber aggregates and the highest percentage of the binder. The gradation of the rubber aggregates was smaller than 4.75 mm and created smaller interconnected flexible voids, which reduced the permeability of the mixes. In addition, a portion of the highest percentage of binder becomes foam during the cure time with the contact of moisture, clogs some pores, and is also responsible for lower permeability.

3.4.2. Permeability of Samples with Different Binders

For samples with different binders, the permeability remains relatively consistent, ranging from 130,082 mm/h to 122,234 mm/h, as shown in Table 8. This stability suggests that the binder density or properties have a minimal impact on porosity; instead, the governing factor is the mix’s composition. It is important to note that all mixes with different binders have the same composition as the Control Mix, with only variations in the binder sources.
Although the permeability of laboratory samples may not perfectly reflect PRP’s effectiveness in water filtration under real-world conditions influenced by factors like subgrade conditions and site topography, the observed high permeability in lab tests implies that PRP should retain sufficient permeability in practical scenarios. The lab results demonstrated considerably higher permeability rates than Canada’s maximum recorded rainfall rate of 298.8 mm/h [34,35], suggesting that PRP’s internal structure and composition, despite variations in mixes or the use of different binders, facilitate efficient water drainage, ensuring ample permeability across diverse field conditions.

4. Conclusions

Durability testing is crucial for assessing the suitability of permeable pavement materials before their extensive use. PRP represents a new type of pavement material in the North American climate, and its durability characteristics still need to be fully understood. This research aims to evaluate the durability properties of PRP, providing guidelines for researchers to choose optimal mixtures for subsequent trial sections. The summarized results are outlined below:
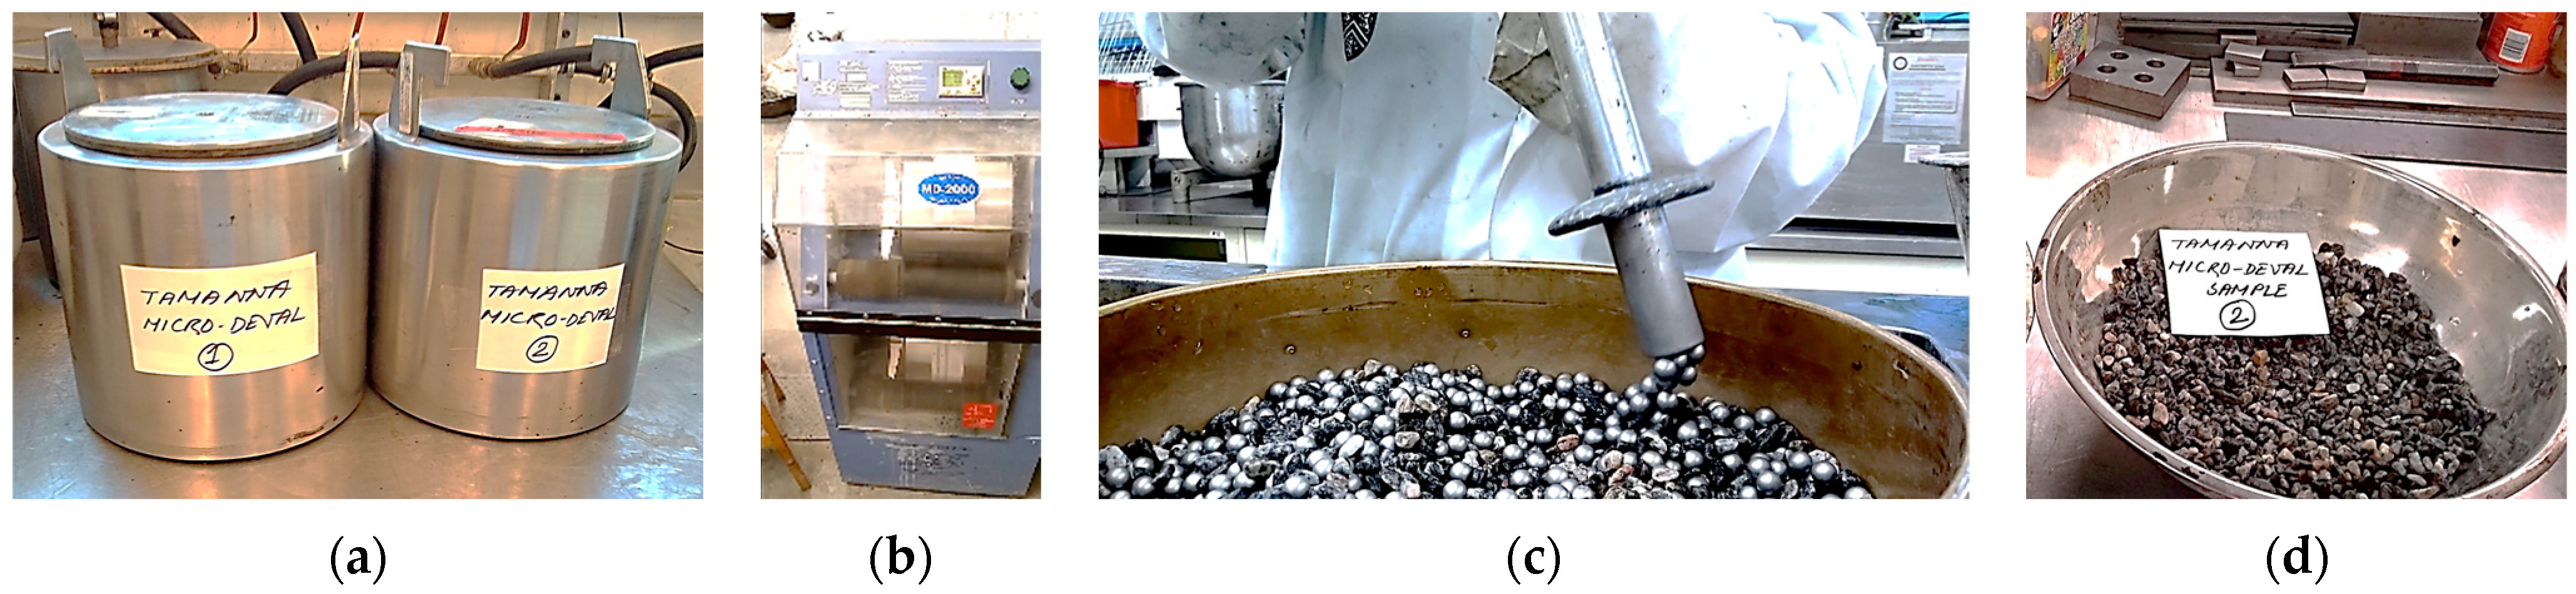
  • The abrasion test results indicate that the granite aggregate used in PRP mixtures has an abrasion loss of 22.25%, exceeding the typical range and indicating insufficient strength for ensuring PRP surface durability.
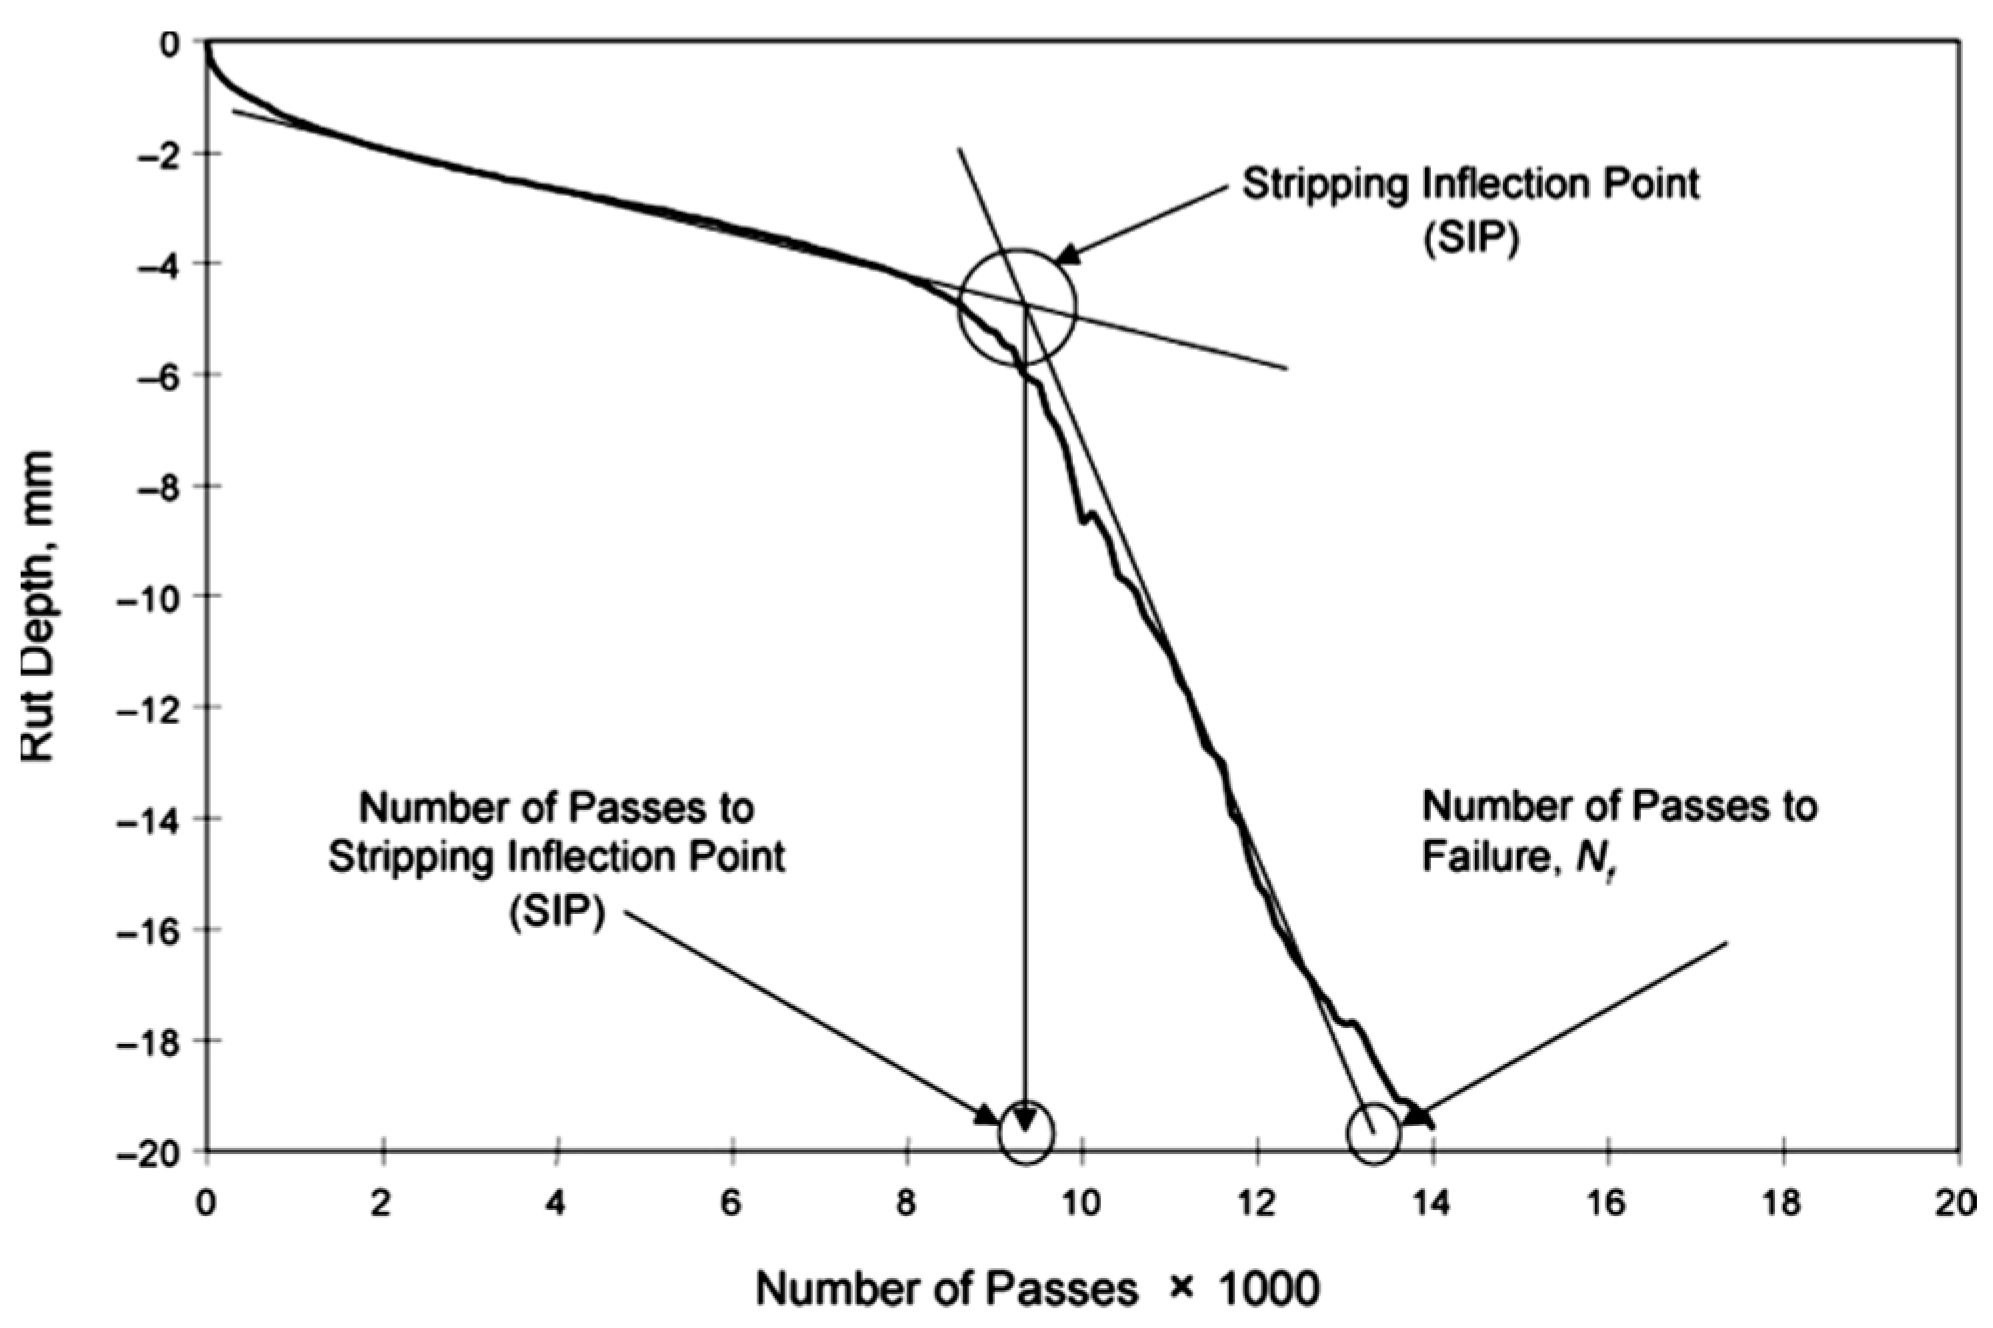
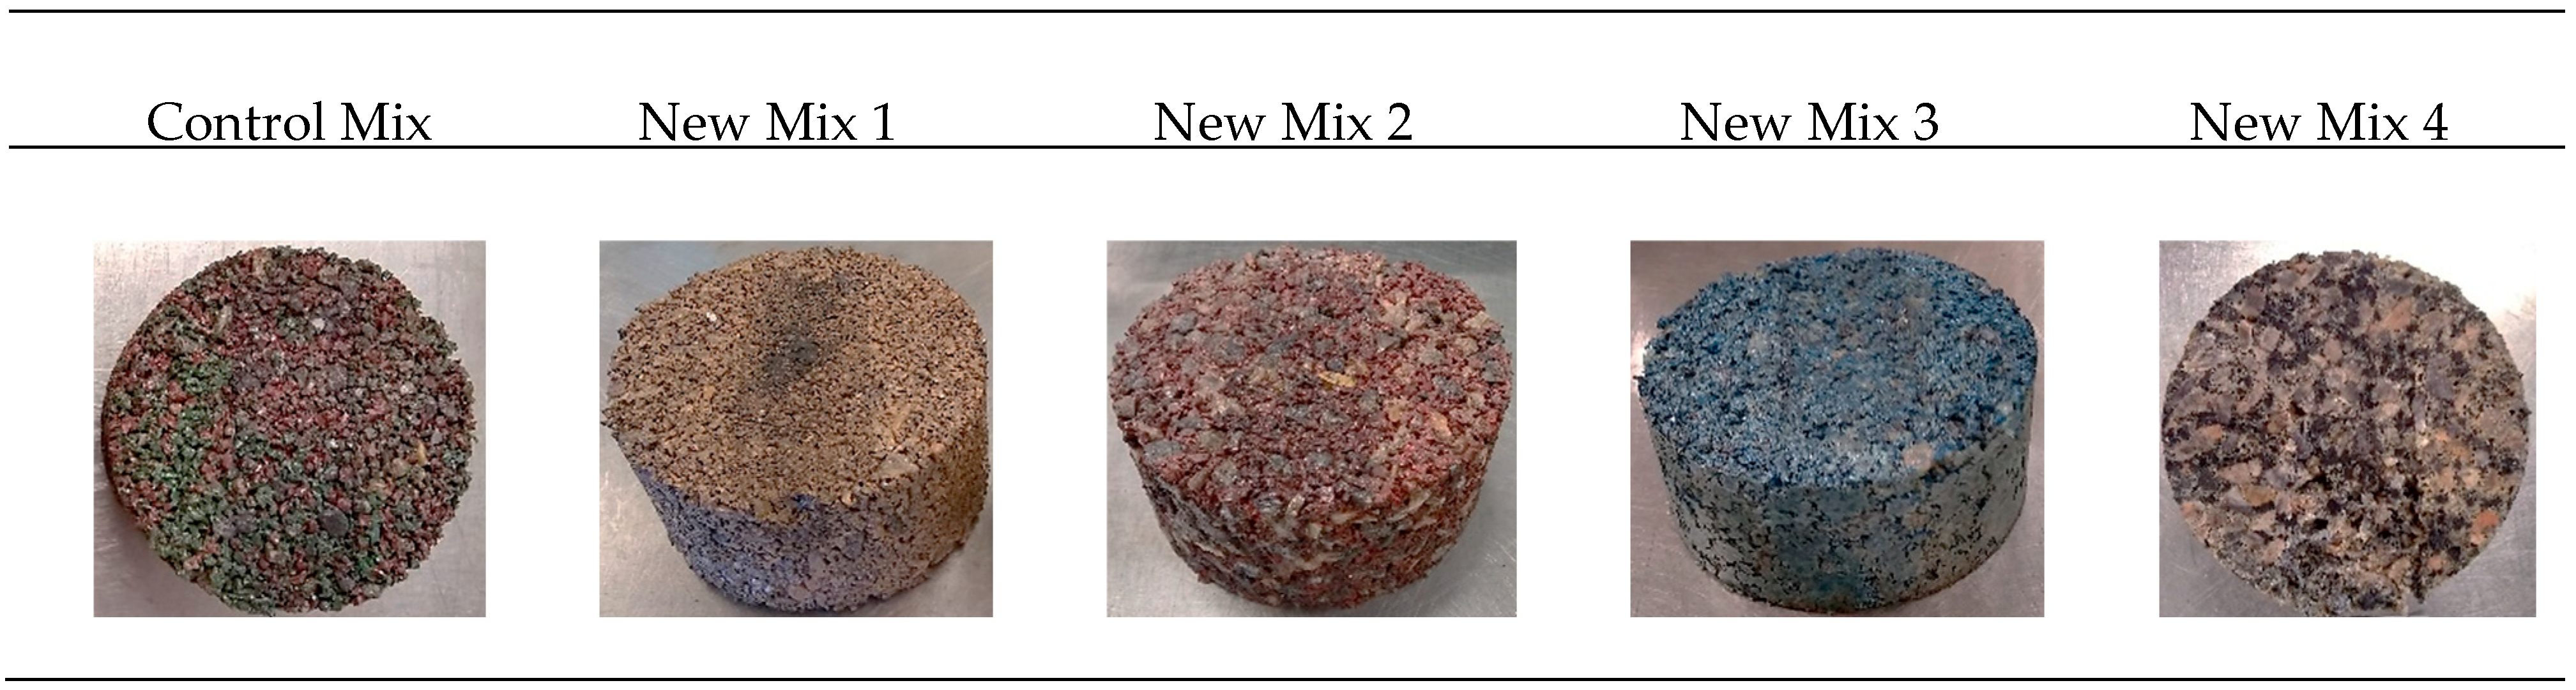
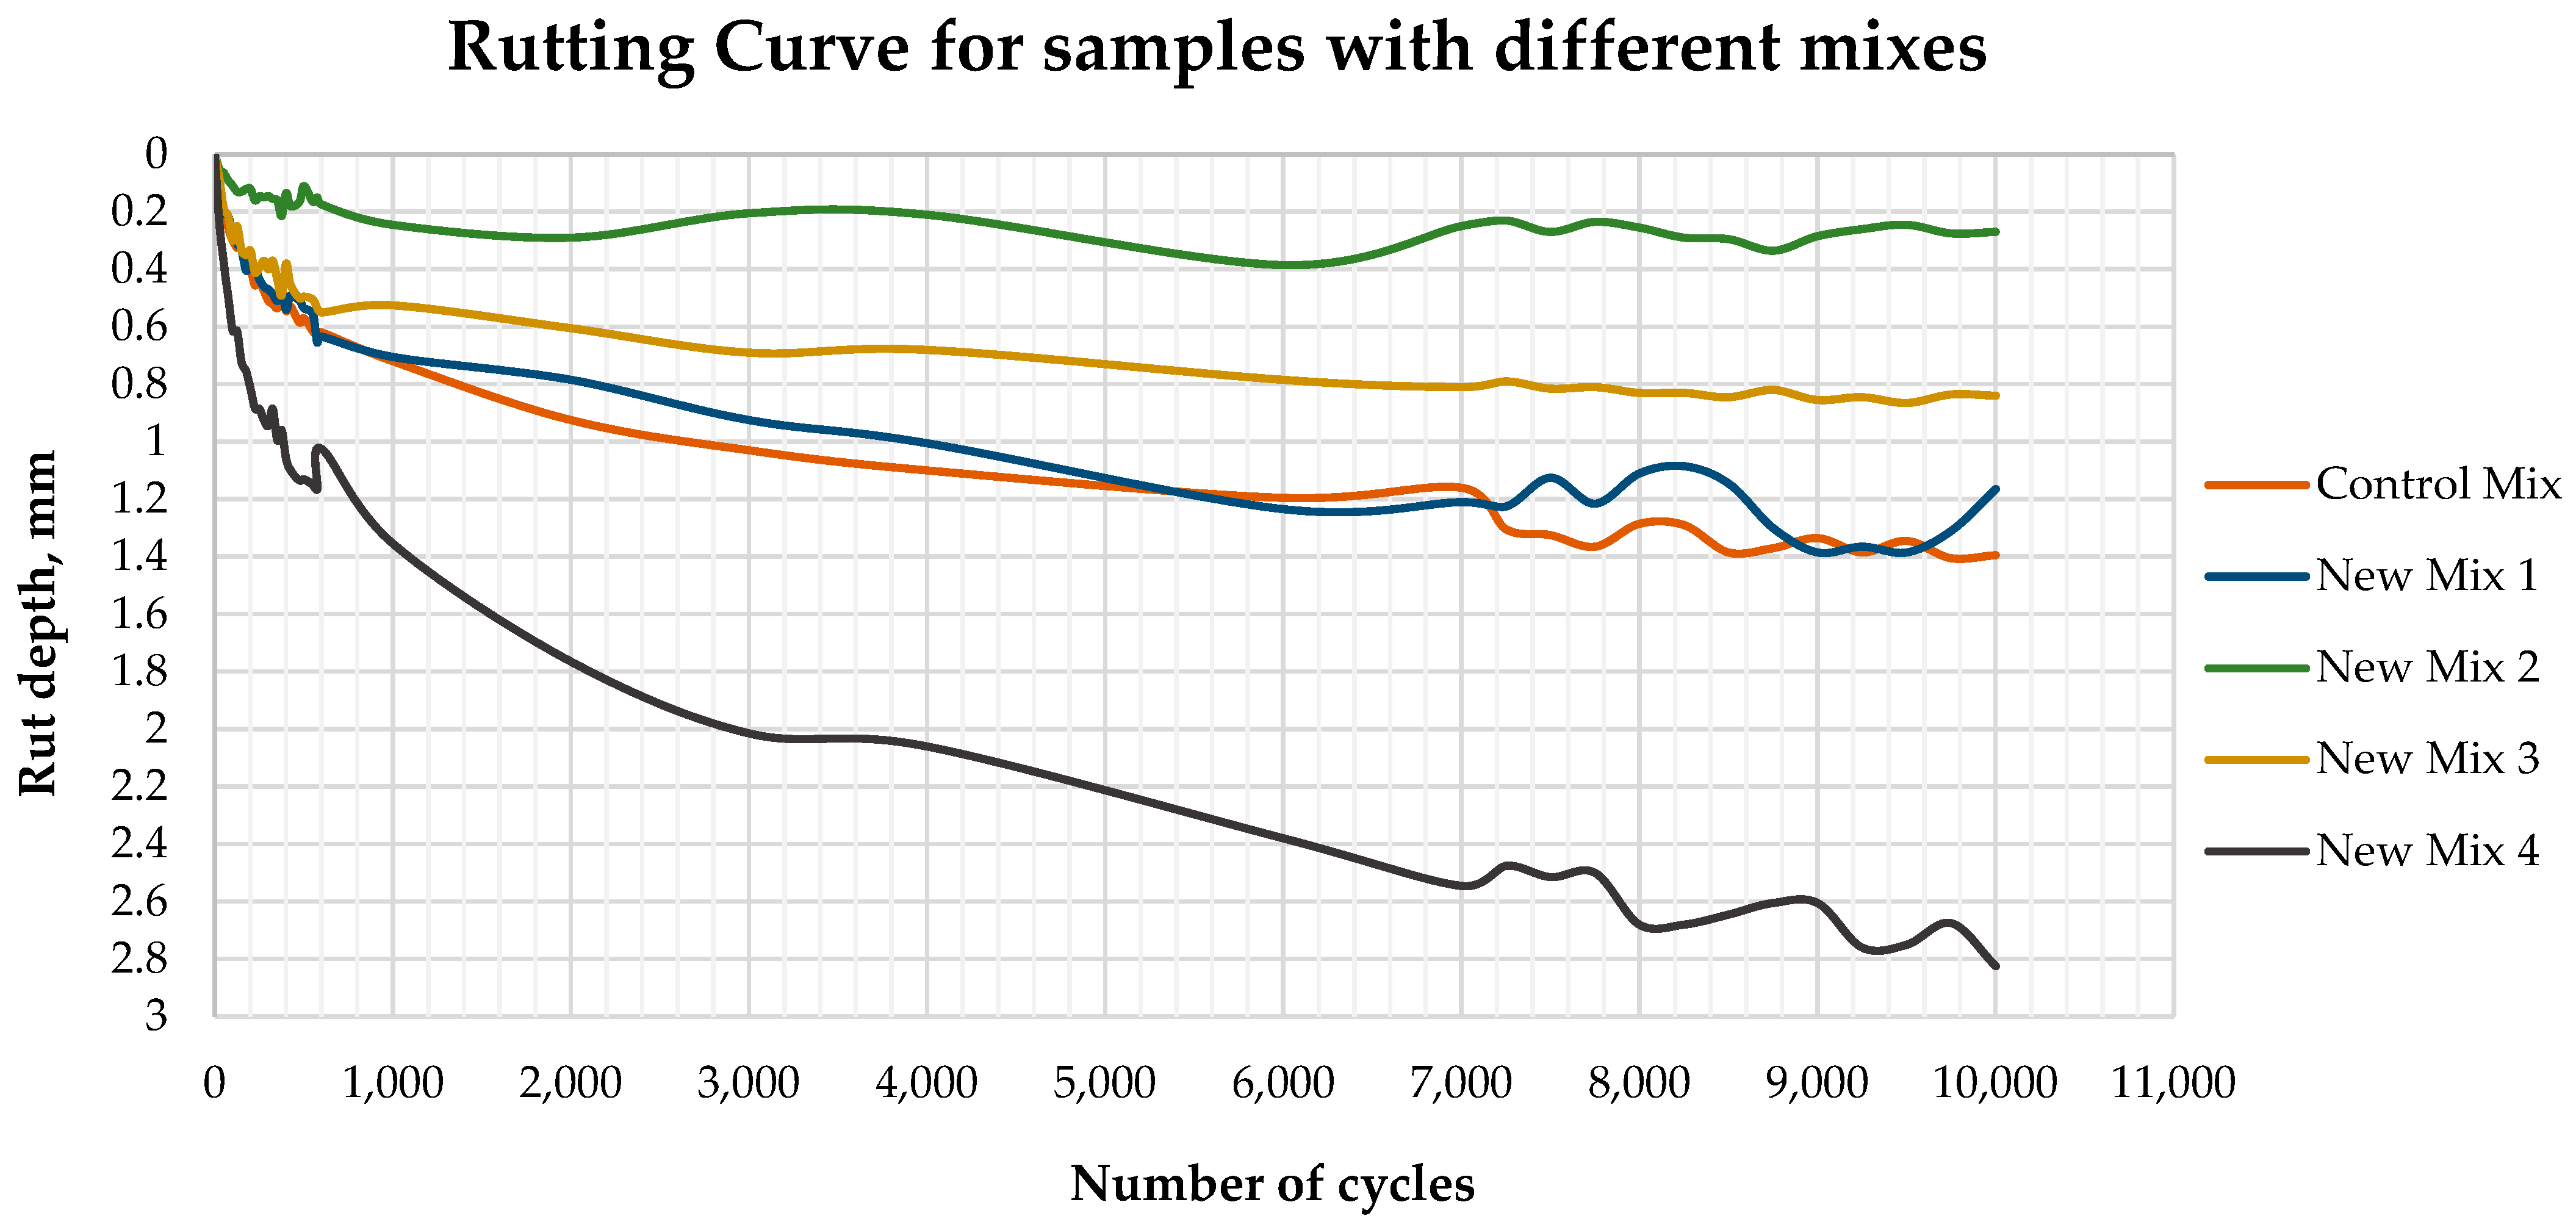
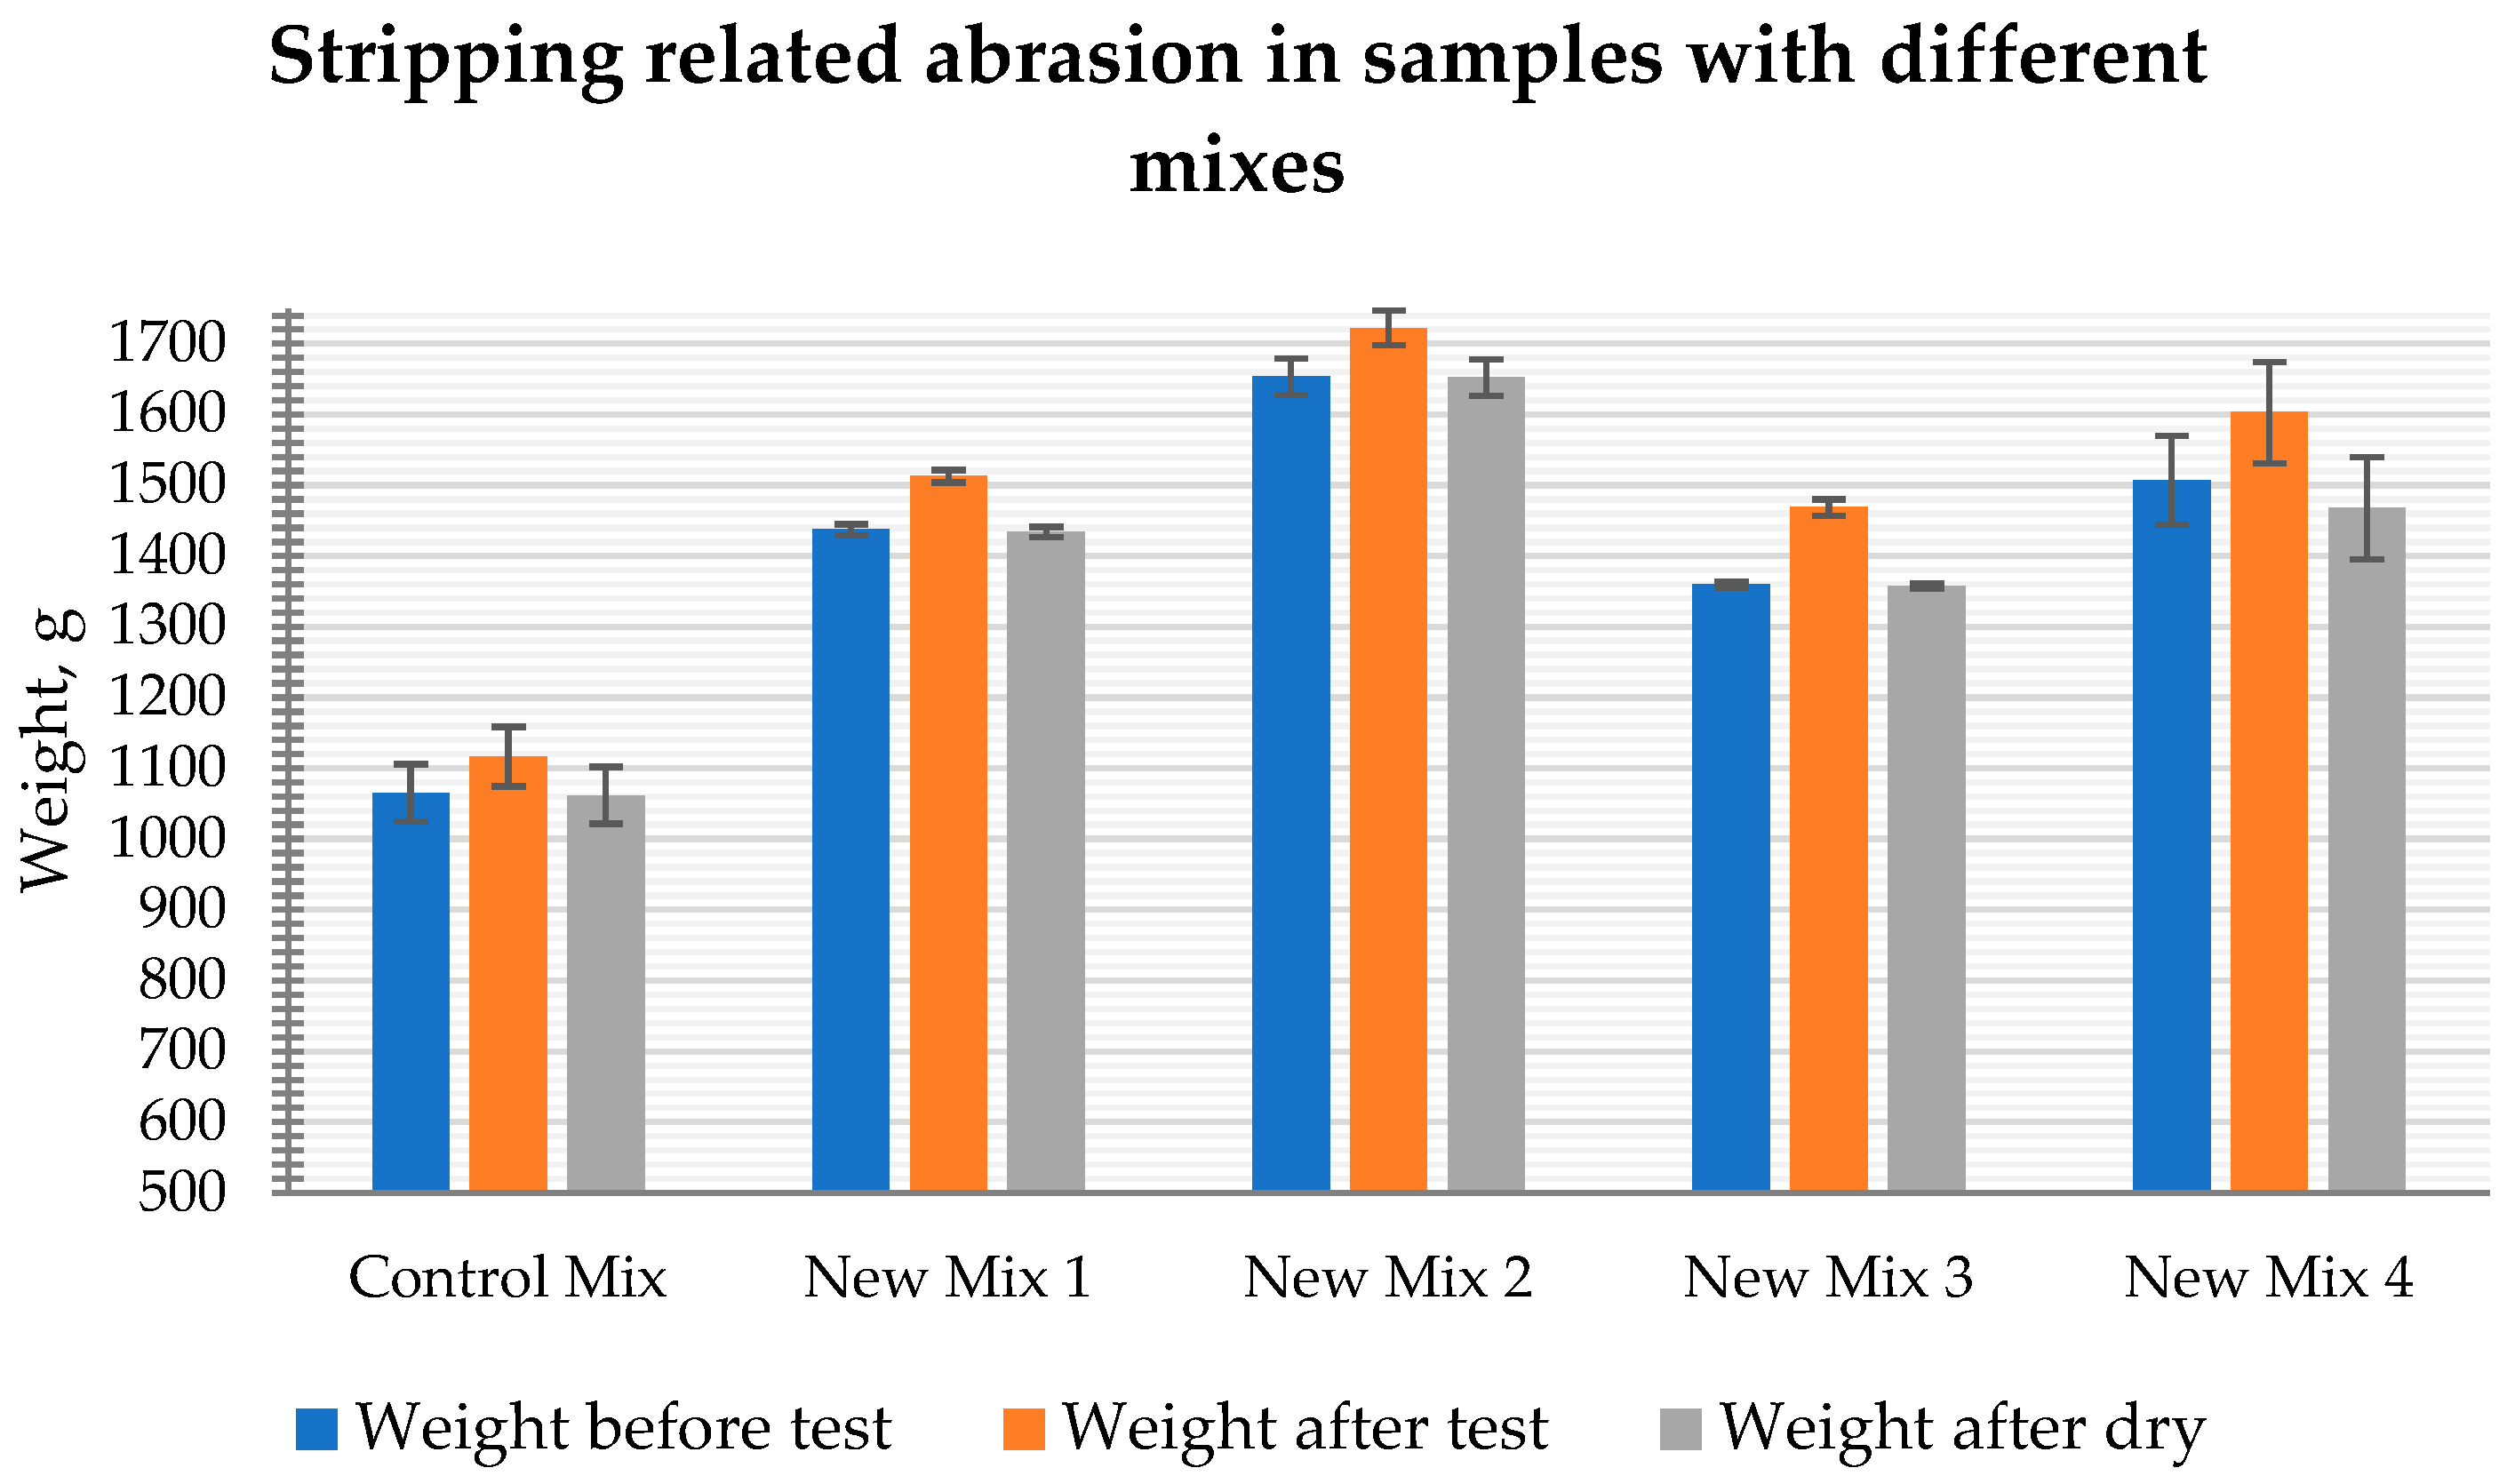
  • The laboratory tests revealed that PRP materials showed good resistance to rutting. Among the mixes with different compositions, New Mix 4, with the highest polyurethane binder content and stone aggregates, showed the highest rutting (2.8 mm), while New Mix 2 showed the lowest rutting (0.3 mm) due to it having the lowest binder content and highest stone aggregates. New Mix 3, with increased rubber aggregates and the highest binder, exhibited an improved resistance to permanent deformation. Minimal stripping-related abrasion (ranging from 2.6% to 0.1%) aligned with rutting characteristics: New Mix 4 had 2.6%, while New Mix 2 and New Mix 3 each had 0.1%.
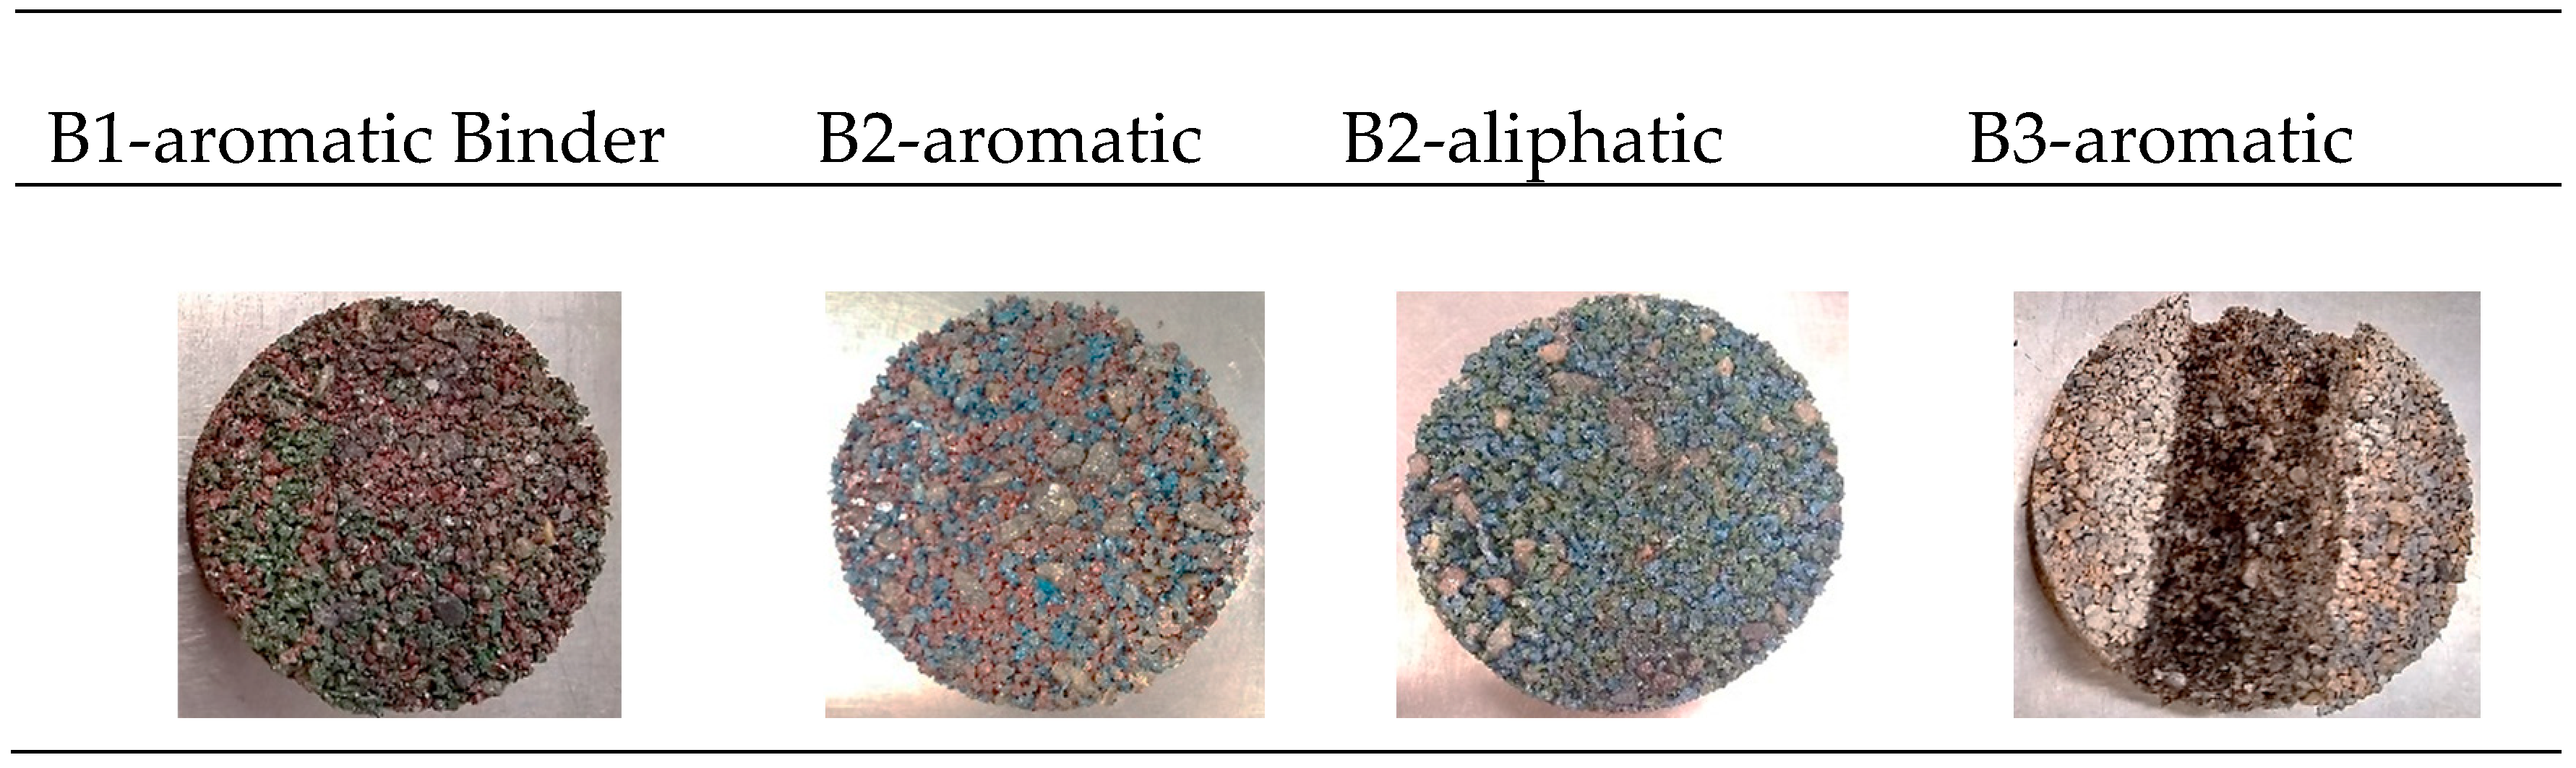
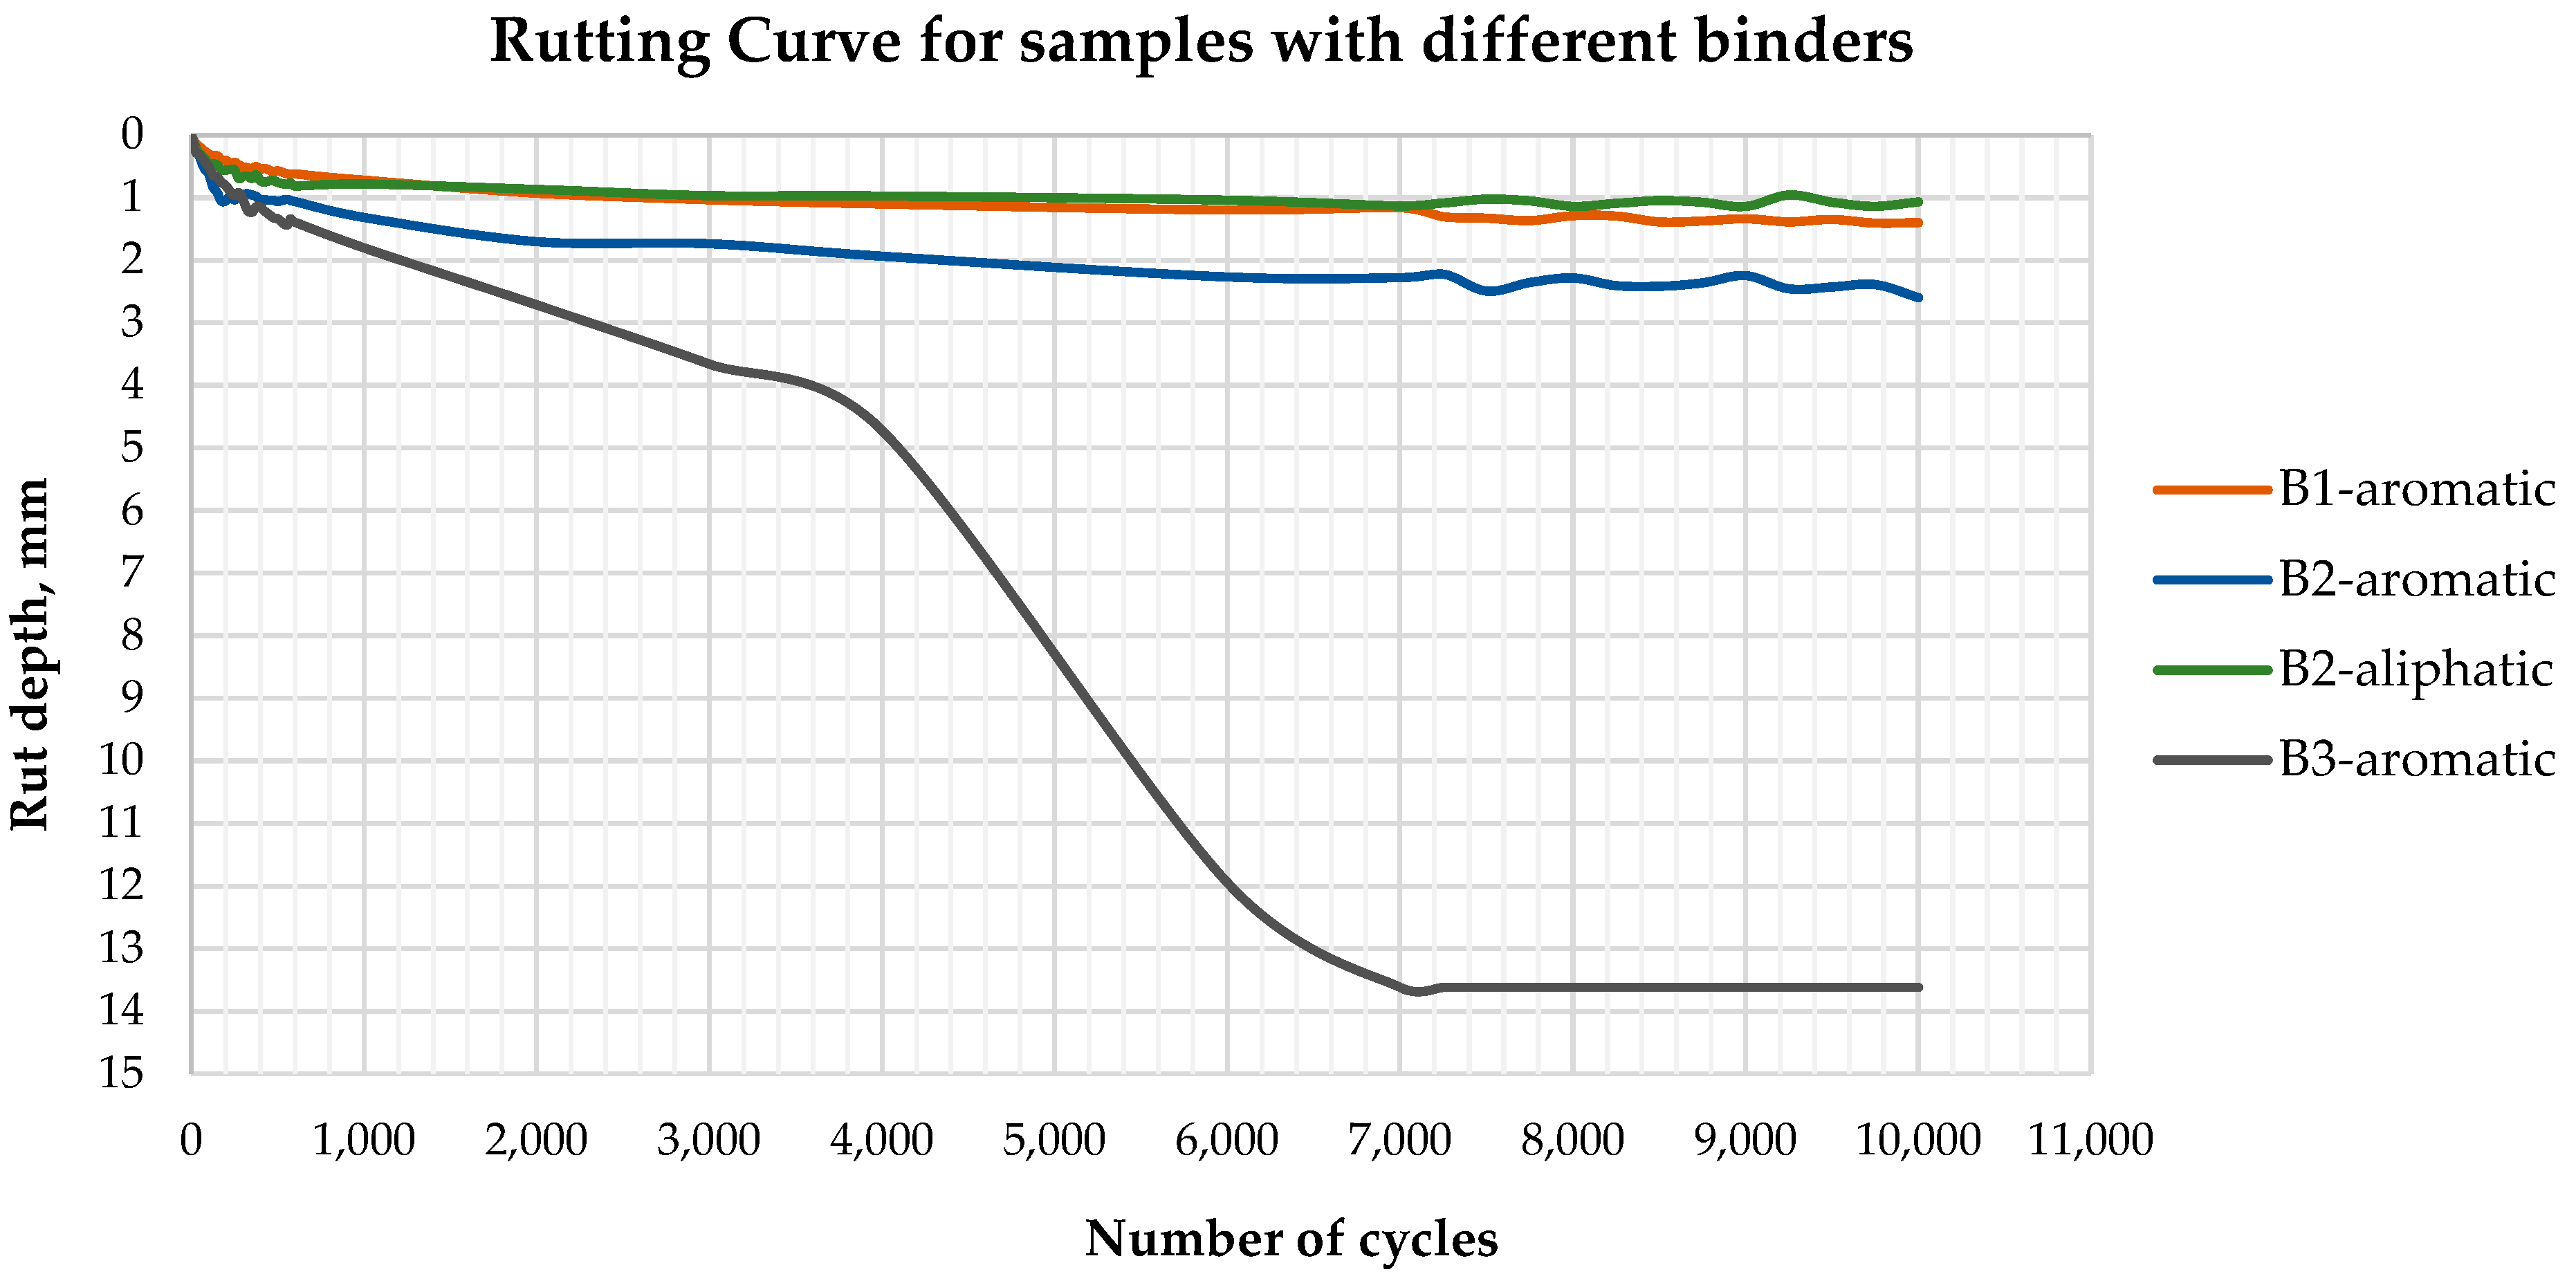
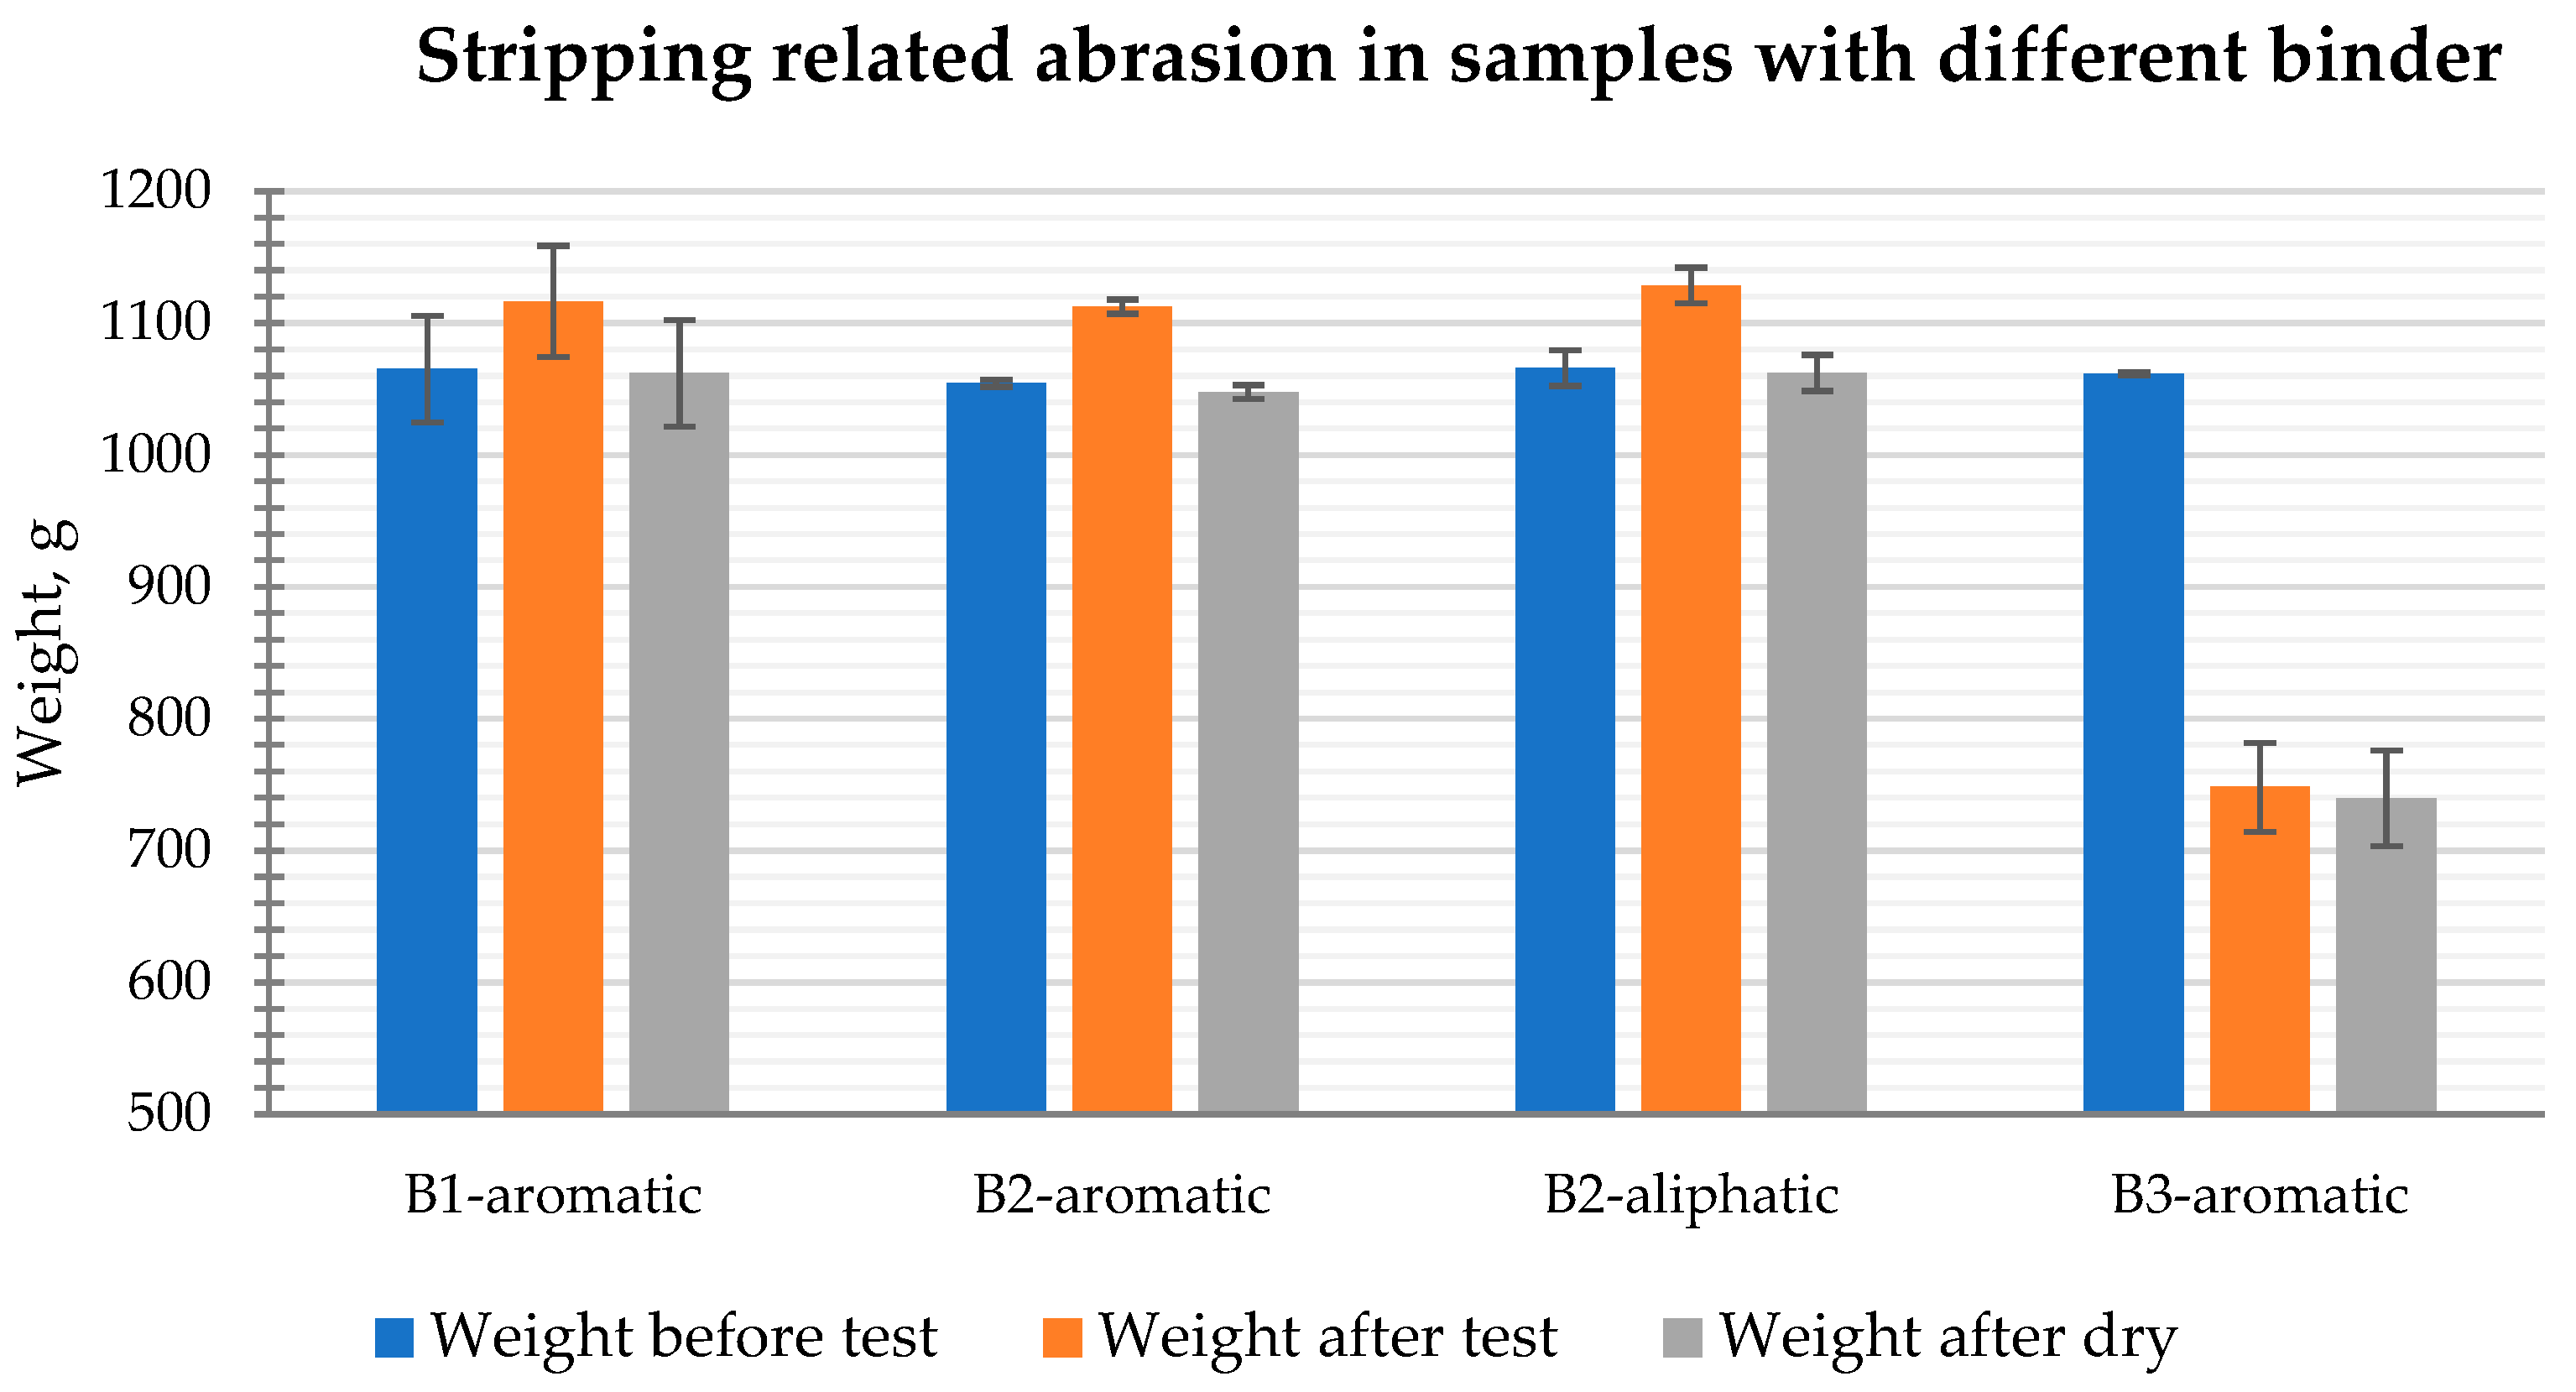
  • The test conducted for rutting and permanent deformation revealed that samples with the B2-aliphatic binder had the lowest permanent deformation at 1.1 mm, showcasing a superior performance compared to samples with aromatic binders. Conversely, samples with the B3-aromatic binder exhibited the highest deformation and failed the test due to temperature sensitivity. This trend correlated with stripping-related abrasion, where mixes with the B1-aromatic, B2-aromatic, and B2-aliphatic binders experienced abrasion loss ranging from 0.3% to 0.6%, contrasting with higher levels of abrasion in mixes with a higher rut depth and permanent deformation, as observed in the failure of the B3-aromatic binder samples with a substantial 30.3% abrasion loss.
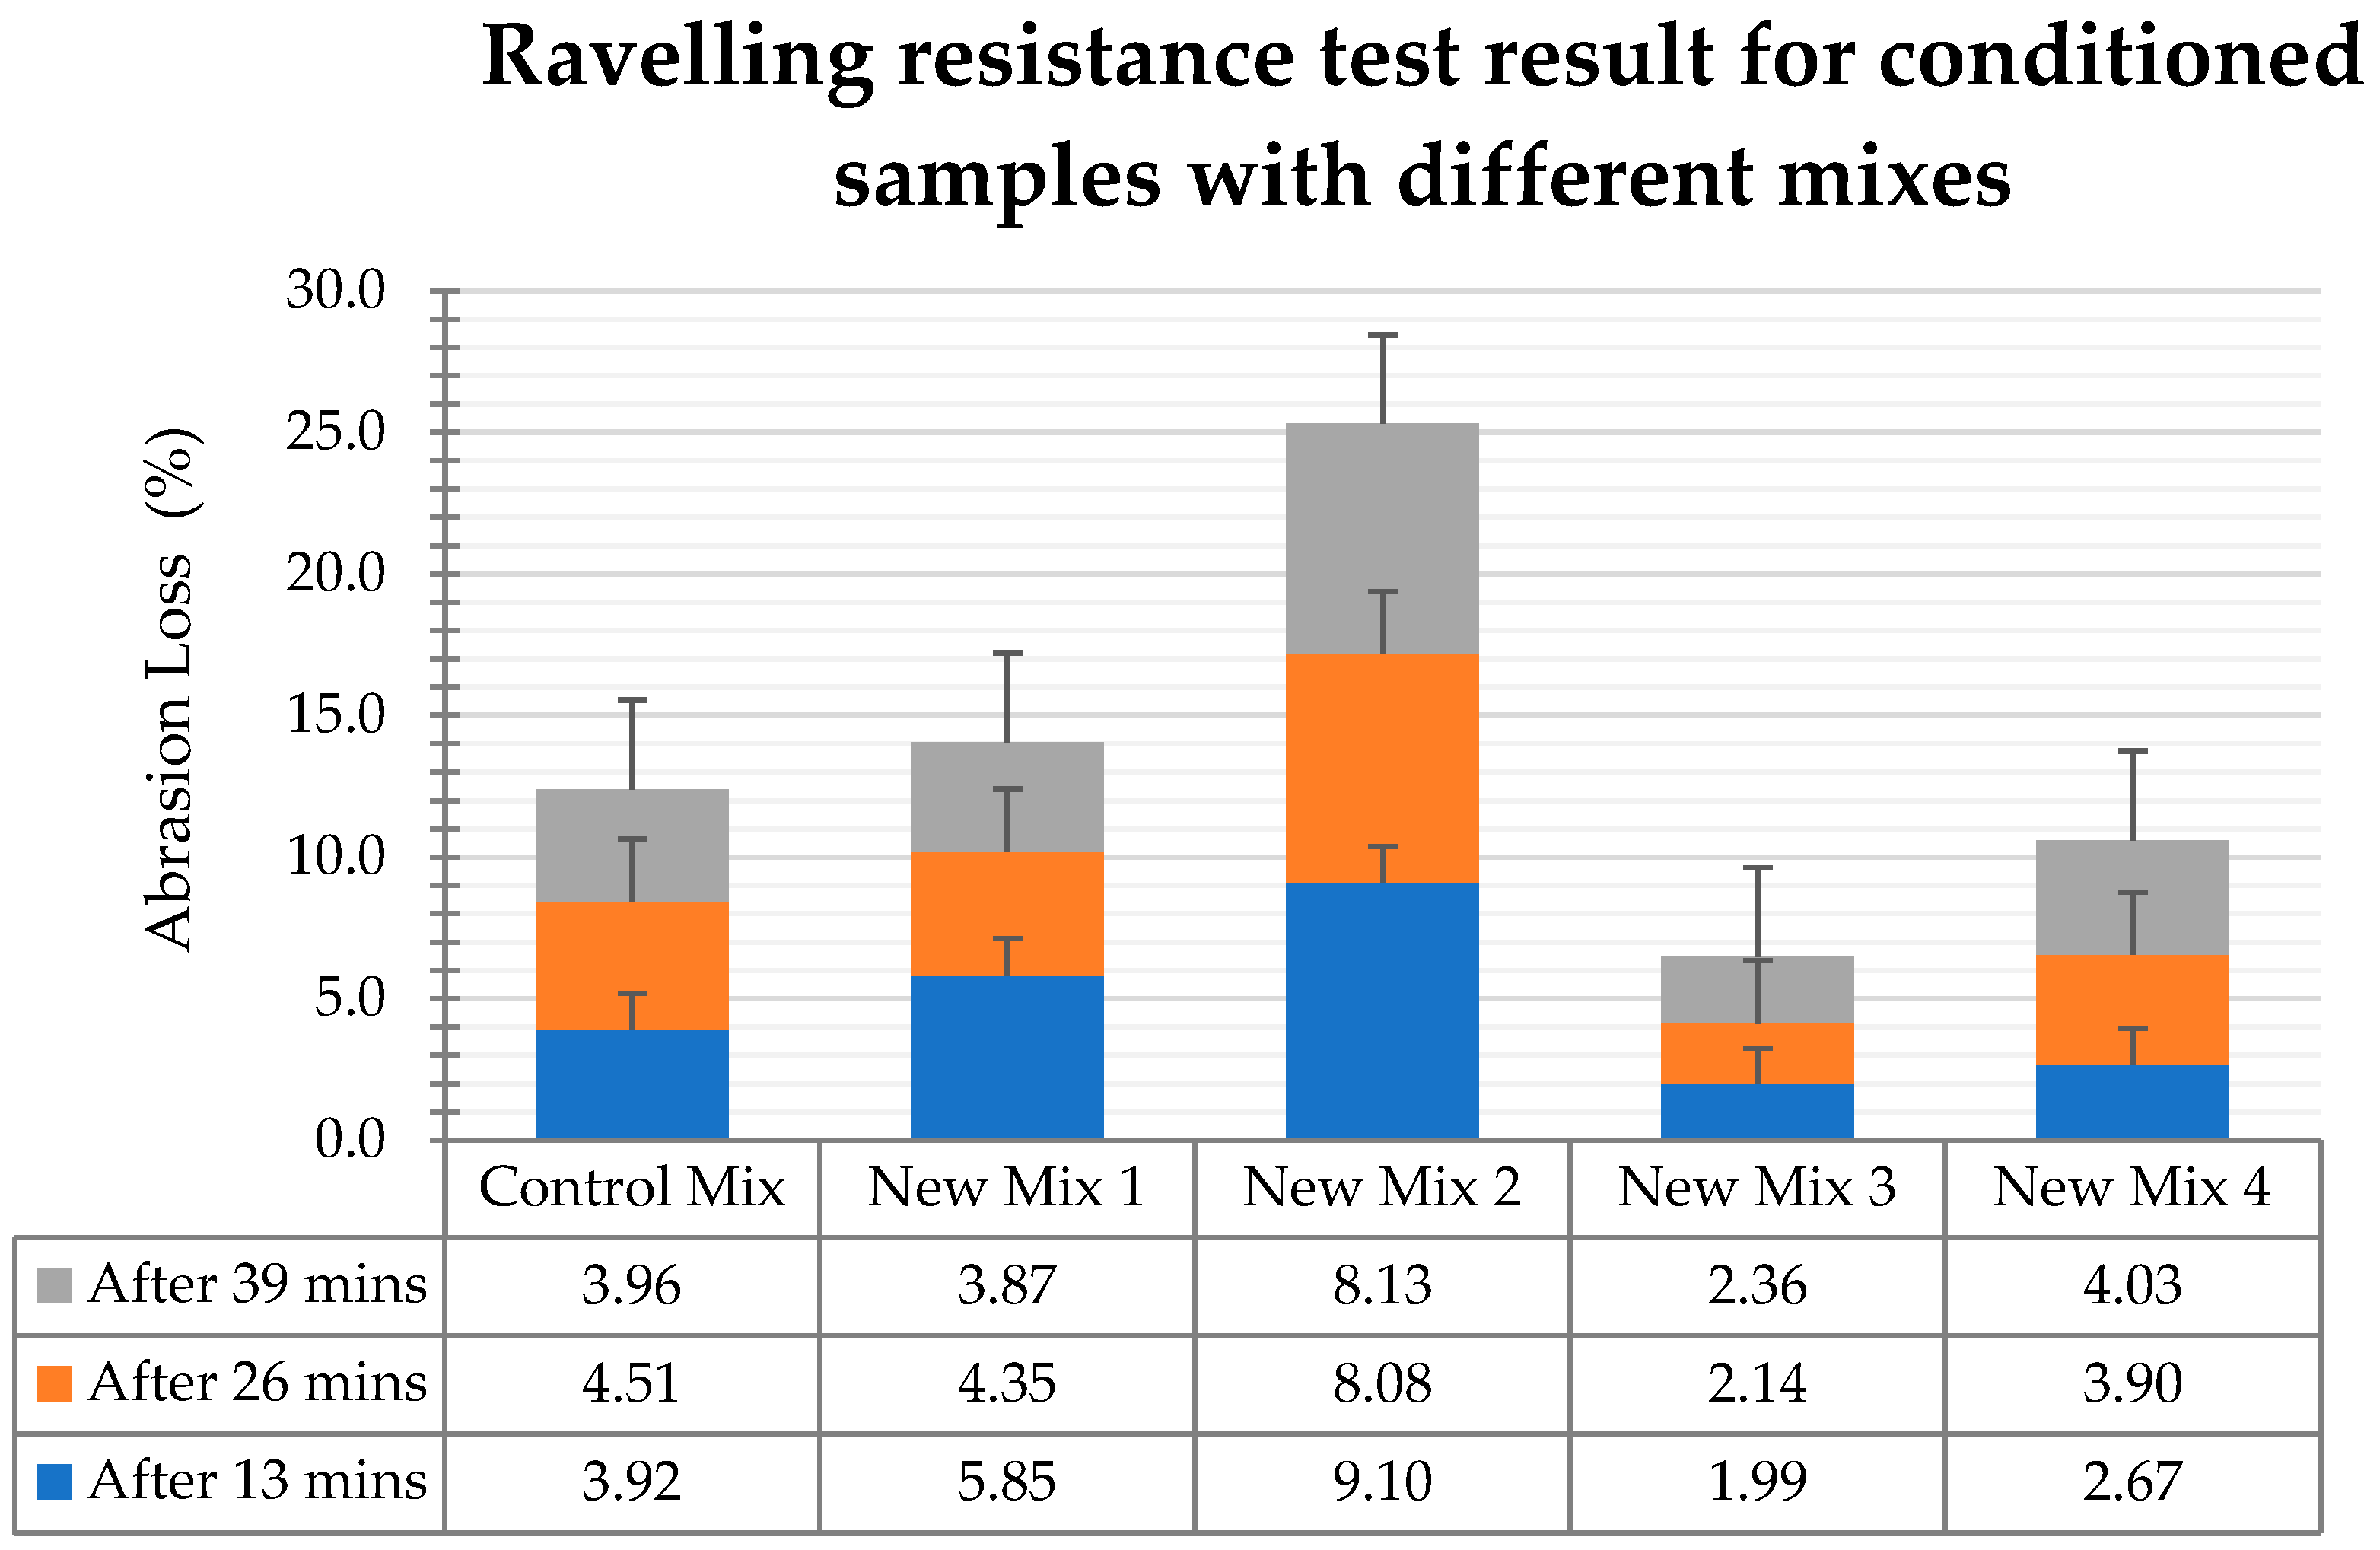
  • The study evaluates the raveling resistance of samples with different mixes in conditioned and unconditioned states. The results showed that New Mix 2 had the highest abrasion loss at 25.31% and 13.23% for the conditioned and unconditioned samples, respectively, while New Mix 3 had the lowest at 6.49% and 4.54%. New Mix 2’s higher stone aggregate and lower binder content led to a weaker integration and increased raveling. In contrast, New Mix 3, with a lower stone aggregate but higher binder and rubber content, improved adhesion and bonding, which is crucial for reducing raveling during testing.
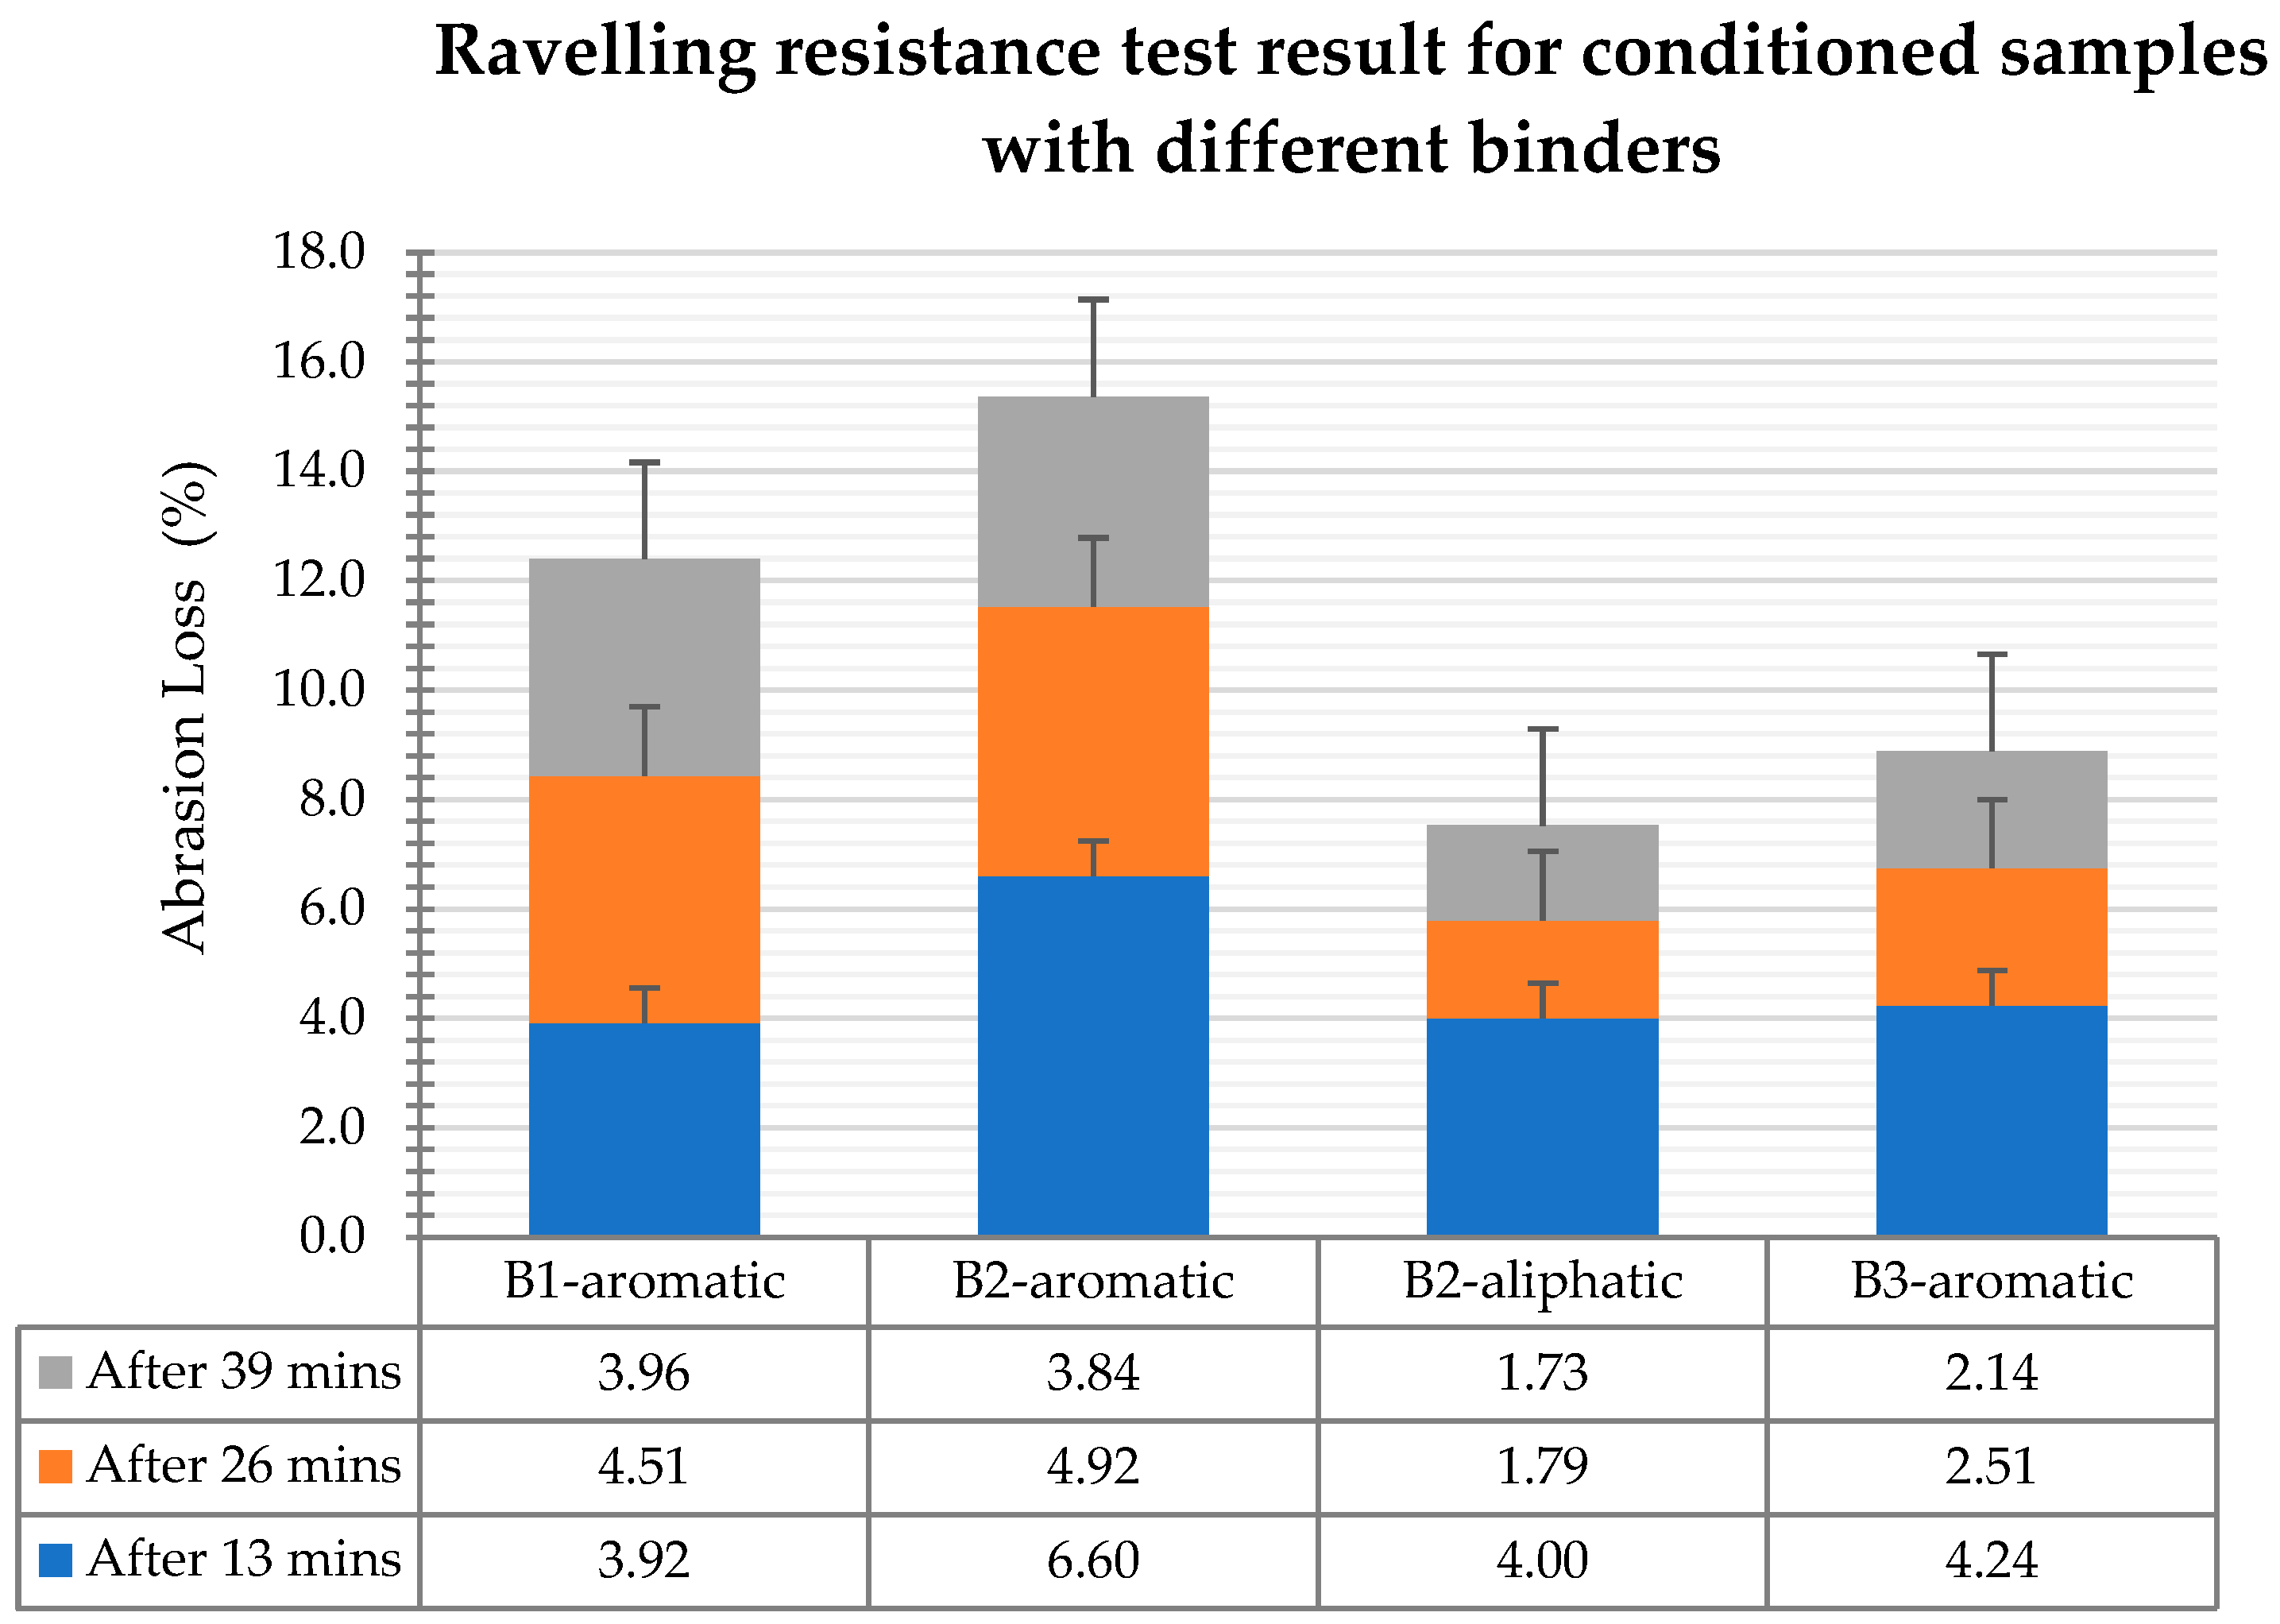
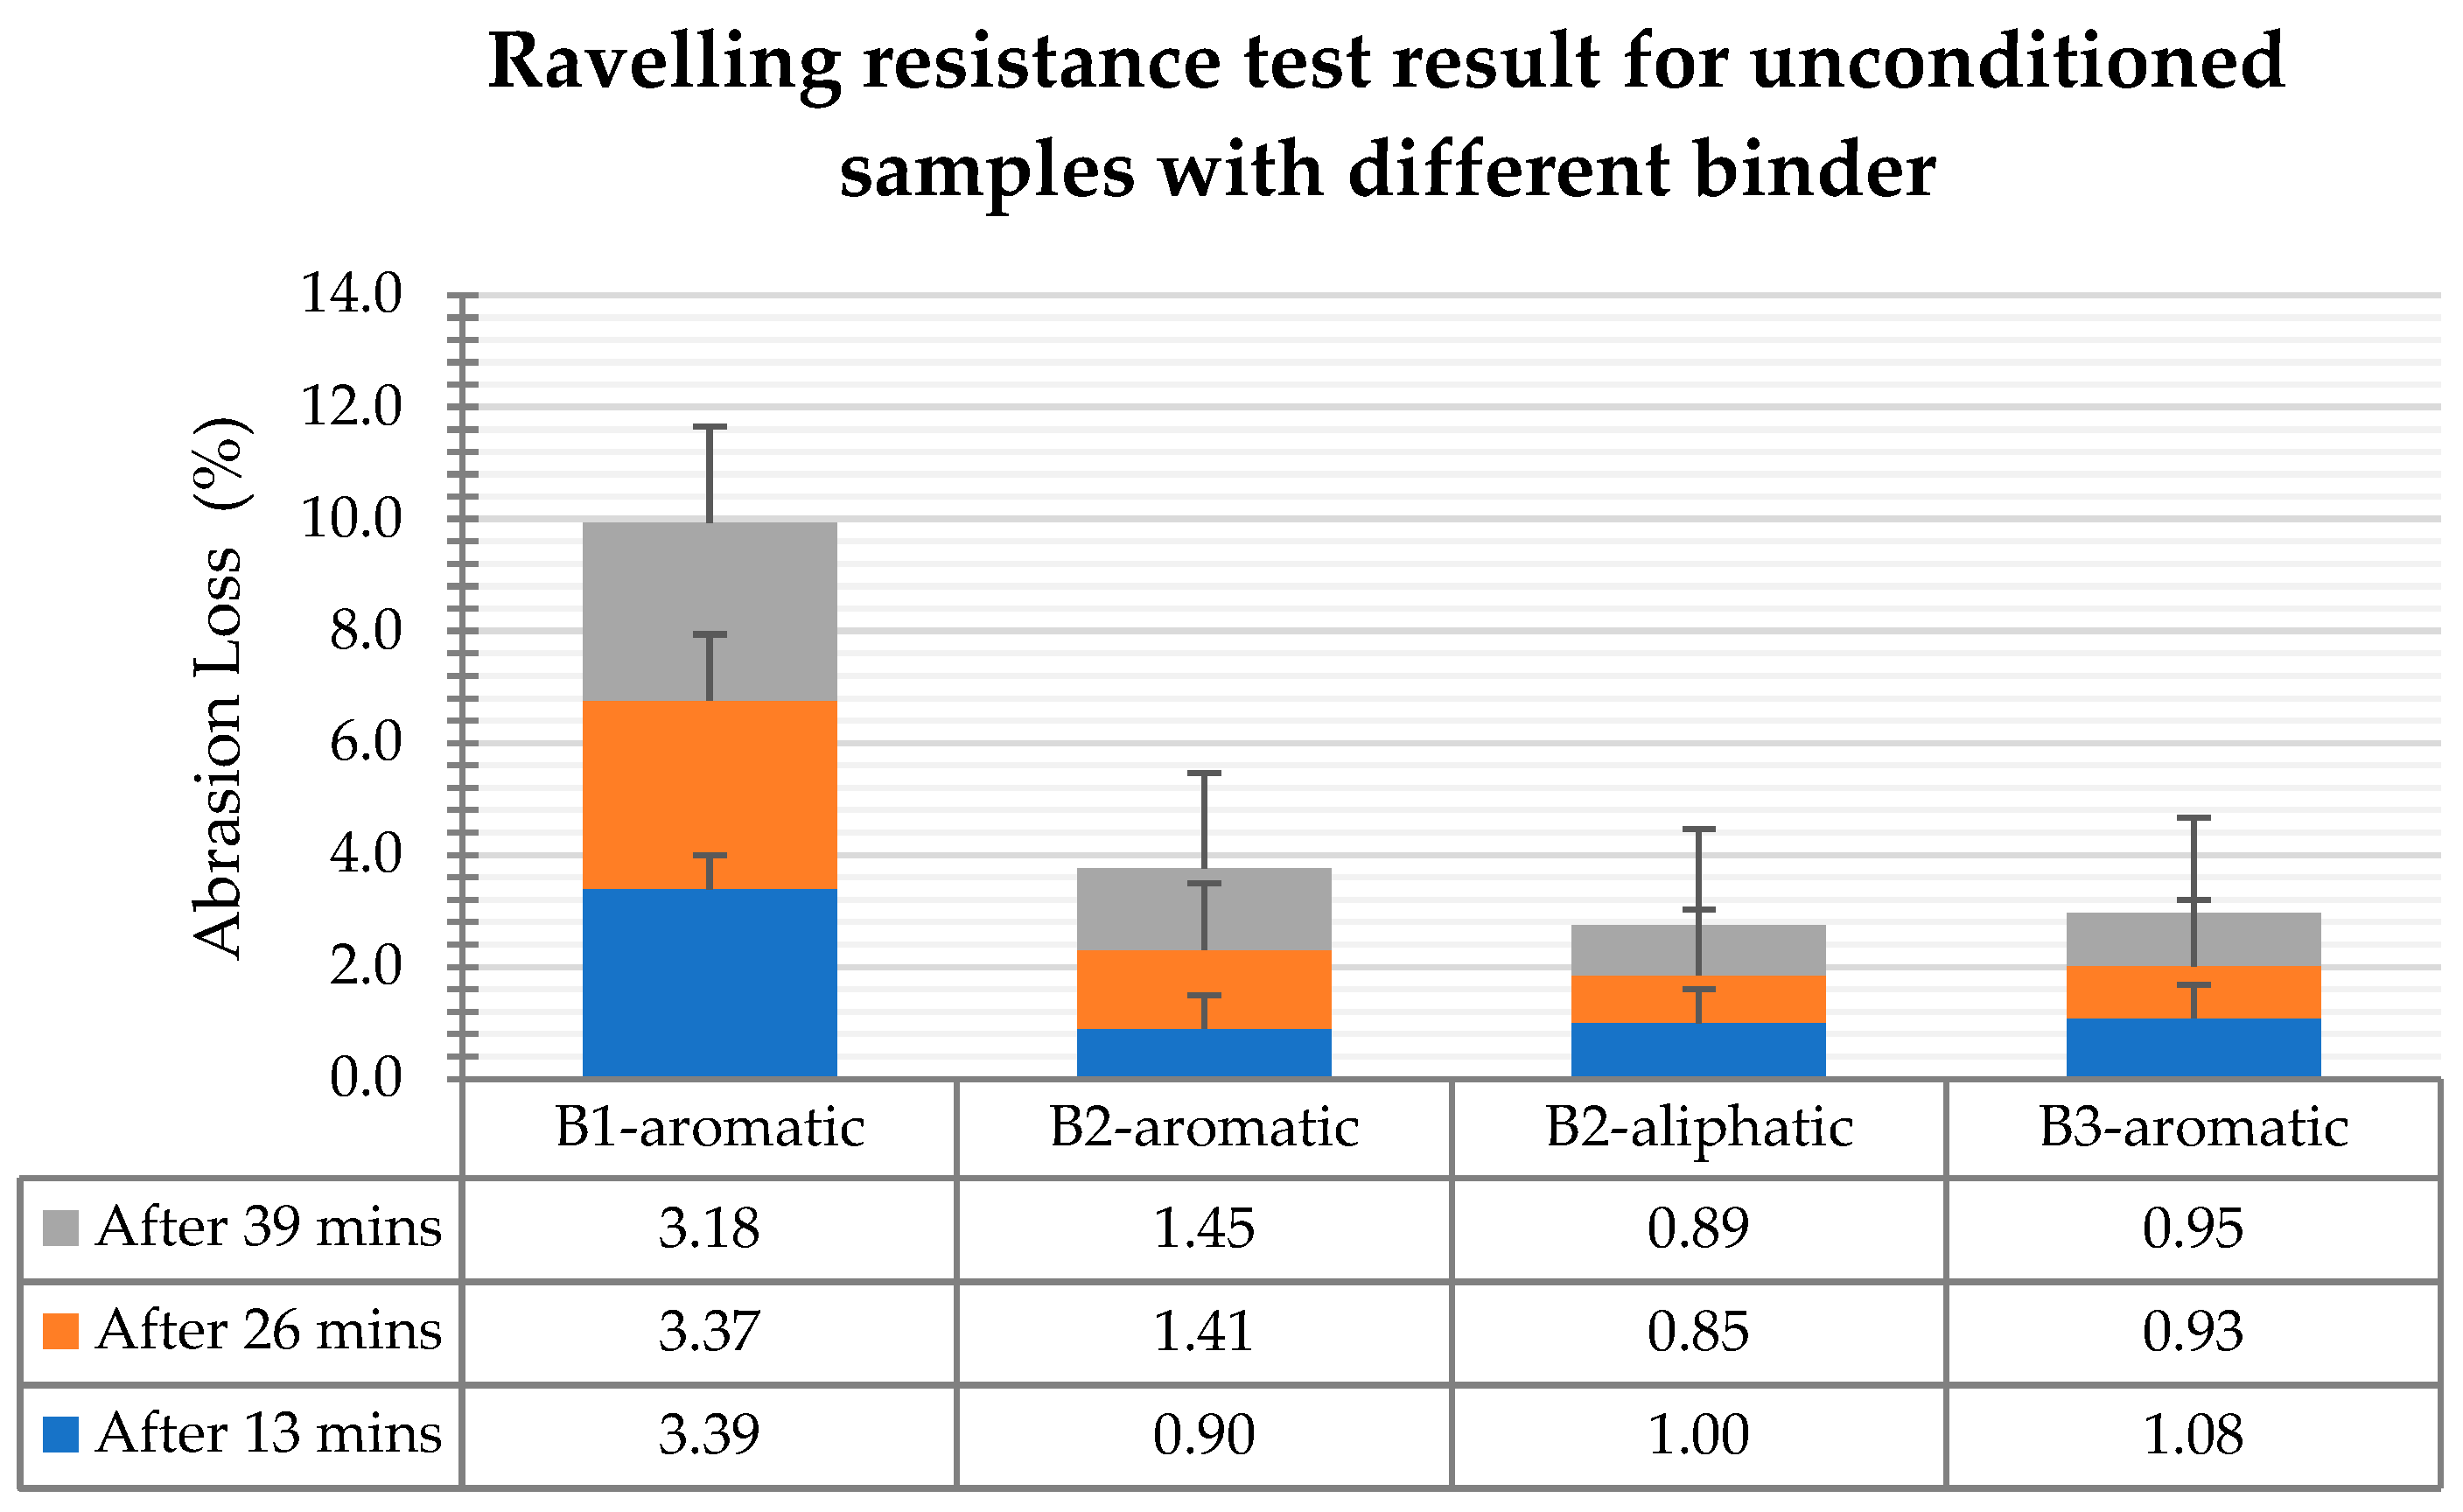
  • The raveling resistance test was conducted on samples with different binder types, including both conditioned and unconditioned samples, revealing variability in binder deterioration after conditioning and resulting in varying rates of abrasion loss. Specifically, the highest abrasion loss in conditioned samples was observed in those with the B2-aromatic binder, reaching 15.37%, while the lowest was in samples with the B2-aliphatic binder at 7.53%. In unconditioned samples, the highest abrasion loss was found in those with the B1-aromatic binder at 9.94%, and the lowest was in samples with the B2-aliphatic binder at 2.75%. Notably, the B2-aliphatic binder consistently performed better in both conditioned and unconditioned samples.
  • Laboratory tests revealed that New Mix 2 exhibited the highest permeability at 168,080 mm/h due to its larger stone aggregates and lower binder content, creating rigid and interconnected voids. In contrast, New Mix 3 had the lowest permeability at 98,628 mm/h because of the smaller rubber aggregate gradation and higher binder content, which resulted in some foaming of the binder. Samples with different binders showed consistent permeability (ranging from 130,082 mm/h to 122,234 mm/h), indicating minimal impact from binder properties. Despite variations in the mix compositions and binder types, PRP’s internal structure ensures efficient water drainage, maintaining ample permeability across diverse field conditions.
After analyzing the comprehensive test results, New Mix 3 stands out as the better-performing mix overall for PRP applications. This conclusion is based on several critical factors across various tests. New Mix 3 displayed the lowest abrasion loss in conditioned and unconditioned states, superior resistance to raveling, and improved resistance to rutting and permanent deformation. Stripping-related abrasion was also the lowest in New Mix 3. Additionally, samples with the B2-aliphatic binder showed consistently lower abrasion loss rates for conditioned and unconditioned samples and the lowest rutting and stripping-related abrasion. While not exhibiting the highest permeability, New Mix 3 demonstrated very high overall permeability. For these reasons, New Mix 3 with the B2-aliphatic binder is recommended as optimal for PRP applications due to its enhanced durability and performance across multiple evaluations, ensuring long-term functionality, even in harsh freeze–thaw conditions with temperature fluctuations.

Author Contributions

Conceptualization, T.K. and S.T.; methodology, T.K.; formal analysis, T.K.; investigation, T.K.; resources, T.K. and S.T.; writing—original draft preparation, T.K.; writing—review and editing, S.T.; visualization, T.K.; supervision, S.T.; project administration, S.T.; funding acquisition, S.T. All authors have read and agreed to the published version of the manuscript.

Funding

This research was funded by Mitacs Accelerate Proposal, Canada, and Stormflow Surfacing, Stratford, ON, Canada.

Data Availability Statement

The raw data supporting the conclusions of this article will be made available by the authors on request.

Conflicts of Interest

The authors declare no conflict of interest.

References

  1. Scholz, M.; Grabowiecki, P. Review of permeable pavement systems. Build. Environ. 2007, 42, 3830–3836. [Google Scholar] [CrossRef]
  2. Lu, G.; Wang, Z.; Liu, P.; Wang, D.; Oeser, M. Investigation of the Hydraulic Properties of Pervious Pavement Mixtures: Characterization of Darcy and Non-Darcy Flow Based on Pore Microstructures. J. Transp. Eng. Part B Pavements. 2020, 146, 04020012. [Google Scholar] [CrossRef]
  3. Madrazo-Uribeetxebarria, E.; Garmendia Antín, M.; Alberro Eguilegor, G.; Andrés-Doménech, I. Analysis of the hydraulic performance of permeable pavements on a layer-by-layer basis. Constr. Build. Mater. 2023, 387, 131587. [Google Scholar] [CrossRef]
  4. Cao, S.; Jia, J.; Wang, J.; Diao, Y.; Liu, Y.; Guo, Y. Development of an analytical permeable pavement model for vehicular access areas. Sci. Total Environ. 2023, 883, 163686. [Google Scholar] [CrossRef] [PubMed]
  5. Eckart, K.; McPhee, Z.; Bolisetti, T. Performance and implementation of low impact development—A review. Sci. Total Environ. 2017, 607–608, 413–432. [Google Scholar] [CrossRef] [PubMed]
  6. Kayhanian, M.; Li, H.; Harvey, J.T.; Liang, X. Application of permeable pavements in highways for stormwater runoff management and pollution prevention: California research experiences. Int. J. Transp. Sci. Technol. 2019, 8, 358–372. [Google Scholar] [CrossRef]
  7. Törzs, T.; Lu, G.; Monteiro, A.O.; Wang, D.; Grabe, J.; Oeser, M. Hydraulic properties of polyurethane-bound permeable pavement materials considering unsaturated flow. Constr. Build. Mater. 2019, 212, 422–430. [Google Scholar] [CrossRef]
  8. Sun, W.; Lu, G.; Ye, C.; Chen, S.; Hou, Y.; Wang, D.; Wang, L.; Oeser, M. The State of the Art: Application of Green Technology in Sustainable Pavement. Adv. Mater. Sci. Eng. 2018, 2018, 9760464. [Google Scholar] [CrossRef]
  9. Cheng, Z.; Zheng, S.; Liang, N.; Li, X.; Li, L. Influence of Complex Service Factors on Ravelling Resistance Performance for Porous Asphalt Pavements. Buildings 2023, 13, 323. [Google Scholar] [CrossRef]
  10. Wang, D.; Schacht, A.; Leng, Z.; Leng, C.; Kollmann, J.; Oeser, M. Effects of material composition on mechanical and acoustic performance of poroelastic road surface (PERS). Constr. Build. Mater. 2017, 135, 352–360. [Google Scholar] [CrossRef]
  11. Project PERSUADE: Optimization of poroelastic road surfaces in the laboratory. In Proceedings of the 40th International Congress and Exposition on Noise Control Engineering 2011 (INTER-NOISE 2011), Tokyo, Japan, 4–7 September 2011; pp. 699–708.
  12. Persuade. PoroElastic Road SUrface: An innovation to Avoid Damages to the Environmen. 2015. Available online: http://persuade.fehrl.org/ (accessed on 8 May 2023).
  13. Wang, D.; Liu, P.; Leng, Z.; Leng, C.; Lu, G.; Buch, M.; Oeser, M. Suitability of PoroElastic Road Surface (PERS) for urban roads in cold regions: Mechanical and functional performance assessment. J. Clean. Prod. 2017, 165, 1340–1350. [Google Scholar] [CrossRef]
  14. Mohammadinia, A.; Disfani, M.M.; Narsilio, G.A.; Aye, L. Mechanical behaviour and load bearing mechanism of high porosity permeable pavements utilizing recycled tire aggregates. Constr. Build. Mater. 2018, 168, 794–804. [Google Scholar] [CrossRef]
  15. Czarna-Juszkiewicz, D.; Kunecki, P.; Cader, J.; Wdowin, M. Review in Waste Tire Management—Potential Applications in Mitigating Environmental Pollution. Materials 2023, 16, 5771. [Google Scholar] [CrossRef] [PubMed]
  16. Kaikade, D.S.; Sabnis, A.S. Polyurethane foams from vegetable oil-based polyols: A review. Polym. Bull. 2022, 80, 2239–2261. [Google Scholar] [CrossRef]
  17. Lu, G.; Renken, L.; Li, T.; Wang, D.; Li, H.; Oeser, M. Experimental study on the polyurethane-bound pervious mixtures in the application of permeable pavements. Constr. Build. Mater. 2019, 202, 838–850. [Google Scholar] [CrossRef]
  18. Kabir, T.; Oyeyi, A.G.; Al-Bayati, H.; Tighe, S. Performance evaluation of Porous Rubber Pavement (PRP) in the Canadian climate. Presented at TAC Conference & Exhibition, Vancouver, BC, Canada, 1 November 2020. [Google Scholar]
  19. Mo, L.; Huurman, M.; Wu, S.; Molenaar, A. Ravelling investigation of porous asphalt concrete based on fatigue characteristics of bitumen–stone adhesion and mortar. Mater. Des. 2009, 30, 170–179. [Google Scholar] [CrossRef]
  20. Kabir, T. Development of Porous Rubber Pavement for the Canadian Climate. Ph.D. Thesis, University of Waterloo, Waterloo, ON, Canada, 2023. [Google Scholar]
  21. Goubert, L.; Sandberg, U. Construction and Performance of Poroelastic Road Surfaces Offering 10 dB of Noise Reduction—PERSUADE Final Technical Report; Belgian Road Research Centre (BRRC): Woluwe-Saint-Lambert, Belgium; Swedish National Road and Transport Research Institute (VTI): Linkoping, Sweden, 2016. [Google Scholar]
  22. Kalman, B.; Leprince, L.; Lenart, S.; Bańkowski, W.; Mirski, K. Revised Mix Report for PoroElastic Road SUrface: An Innovation to Avoid Damages to the Environment; Belgian Road Research Centre (BRRC): Woluwe-Saint-Lambert, Belgium; Swedish National Road and Transport Research Institute (VTI): Linkoping, Sweden, 2015. [Google Scholar]
  23. ASTM D7064/D7064M; Standard Practice for Open-Graded Friction Course (OGFC) Mix Design. ASTM: West Conshohocken, PA, USA, 2013.
  24. Kandhal, P.S. Design, Construction, and Maintenance of Open-Graded Asphalt Friction Courses. 2002. Series 115. Available online: https://docplayer.net/13668587-Design-construction-and-maintenance-of-open-graded-asphalt-friction-courses.html (accessed on 25 March 2024).
  25. ASTM D6928-17; Resistance of Coarse Aggregate to Degradation by Abrasion in the Micro-Deval Apparatus. ASTM: West Conshohocken, PA, USA, 2017.
  26. AASHTO T 324-17; Standard Method of Test for Hamburg Wheel-Track Testing of Compacted Asphalt Mixtures. AASHTO: Washington, DC, USA, 2017.
  27. ASTM C1747/C1747M-13; Standard Test Method for Determining Potential Resistance to Degradation of Pervious Concrete by Impact and Abrasion. ASTM: West Conshohocken, PA, USA, 2013.
  28. Gilson. NCAT Asphalt Field Permeameter Kit AP-1B; Gilson Company, Inc.: Lewis Center, OH, USA, 2019. [Google Scholar]
  29. ASTM C1701/C1701M-17a; Standard Test Method for Infiltration Rate of In Place Pervious Concrete. ASTM: West Conshohocken, PA, USA, 2017.
  30. Gilson. NCAT Field Asphalt Permeameter Kit; Gilson Company, Inc.: Lewis Center, OH, USA, 2024; Available online: https://www.globalgilson.com/ncat-asphalt-field-permeameter-kit (accessed on 25 March 2024).
  31. Huang, B.; Wu, H.; Shu, X.; Burdette, E.G. Laboratory evaluation of permeability and strength of polymer-modified pervious concrete. Constr. Build. Mater. 2010, 24, 818–823. [Google Scholar] [CrossRef]
  32. Xu, H.; Guo, W.; Tan, Y. Internal structure evolution of asphalt mixtures during freeze–thaw cycles. Mater. Des. 2015, 86, 436–446. [Google Scholar] [CrossRef]
  33. Xu, H.; Guo, W.; Tan, Y. Permeability of asphalt mixtures exposed to freeze–thaw cycles. Cold Reg. Sci. Technol. 2016, 123, 99–106. [Google Scholar] [CrossRef]
  34. Environment Canada. Engineering Climate Dataset, IDF. Version 1.00; 2019. Available online: https://collaboration.cmc.ec.gc.ca/cmc/climate/Engineer_Climate/IDF/ (accessed on 8 May 2023).
  35. Henderson, V. Evaluation of the Performance of Pervious Concrete Pavement in the Canadian Climate. Ph.D. Thesis, University of Waterloo, Waterloo, ON, Canada, 2012. [Google Scholar]
Figure 1. Gradation of Stone Aggregate.
Constrmater 04 00021 g001
Figure 2. Gradation of Rubber Aggregate.
Constrmater 04 00021 g002
Figure 3. Equipment and molds used for sample in preparation.
Constrmater 04 00021 g003
Figure 4. Conditioning of PRP samples. (a) Freezing of samples. (b) Thawing of samples.
Constrmater 04 00021 g004
Figure 5. Hamburg Wheel Test Curve. Source: [26].
Constrmater 04 00021 g005
Figure 6. Samples under the wheel load of the Hamburg wheel tester and after removing the load.
Constrmater 04 00021 g006
Figure 7. Abrasion Loss machine and test procedure. (a) Abrasion Loss Machine, (b) Loose material, (c) Abraded sample.
Constrmater 04 00021 g007
Figure 8. NCAT Asphalt Permeameter used for permeability test. Source: [30].
Constrmater 04 00021 g008
Figure 9. Micro-Deval abrasion loss test at the lab. (a) Aggregate sample in Micro-Deval container (b) Containers in Micro-Deval apparatus (c) Separating aggregates from steel balls (d) Cleaned aggregates.
Constrmater 04 00021 g009
Figure 10. Permanent deformation due to rutting on samples with different mixes.
Constrmater 04 00021 g010
Figure 11. Rutting curve from Hamburg Wheel Tracking Test.
Constrmater 04 00021 g011
Figure 12. Stripping-related abrasion for different mixes.
Constrmater 04 00021 g012
Figure 13. Rutting results for samples with different binders.
Constrmater 04 00021 g013
Figure 14. Hamburg Wheel Tracking Test Rutting curve for samples with different binders.
Constrmater 04 00021 g014
Figure 15. Stripping-related abrasion in samples with different binders.
Constrmater 04 00021 g015
Figure 16. Raveling resistance test result for conditioned samples with different mixes.
Constrmater 04 00021 g016
Figure 17. Raveling resistance test result for unconditioned sample with different mixes.
Constrmater 04 00021 g017
Figure 18. Raveling resistance test result for conditioned samples with different binders.
Constrmater 04 00021 g018
Figure 19. Raveling resistance test result for unconditioned samples with different binders.
Constrmater 04 00021 g019
Figure 20. Permeability test at the laboratory.
Constrmater 04 00021 g020
Table 1. Mixes with different compositions.
Mixes with Different Proportions (by Weight) of Components Stone Aggregate (%)Rubber Aggregate (%)B1-Aromatic Polyurethane Binder (%)Objective Air VoidsAchieved Air Voids
Control Mix45.2545.259.535–45%38–45%
Stone Aggregates (Factor A)Lower limit—55%, Upper limit—75%
Polyurethane Binder (Factor B)Lower limit—7.5%, Upper limit—12%
New Mix 1 5537.57.5Within 20–30%18–38%
New Mix 27517.57.5
New Mix 3553312
New Mix 4751312
Table 2. Mixes with different binders.
Mixes with Different Polyurethane BinderPercentages of ComponentsObjective Air VoidsAchieved Air Voids
Control mix—B1-aromatic regularStone Aggregate—45.25%, Rubber Aggregate—45.25%, Polyurethane Binder—9.5%35–45%38–45%
B2-aromatic
B2-aliphatic
B3-aromatic
Table 3. Rutting results for samples with different mixes.
Hamburg Wheel Tracking Test Result
MixesDepth 01 (mm)Depth 02 (mm)Average (mm)Standard Deviation
Control Mix1.61.21.40.26
New Mix 11.60.71.20.62
New Mix 20.20.40.30.16
New Mix 30.80.90.80.13
New Mix 43.02.72.80.25
Table 4. Weight loss after rutting and stripping in samples with different mixes.
MixesWeight Loss after Rutting Test
Control Mix0.3%
New Mix 10.2%
New Mix 20.1%
New Mix 30.1%
New Mix 42.6%
Table 5. Rutting results for samples with different binders.
Hamburg Wheel Tracking Test
Different BinderDepth 01 (mm)Depth 02 (mm)Average (mm)Standard Deviation
B1-aromatic1.581.211.40.26
B2-aromatic2.412.782.60.26
B2-aliphatic0.851.281.10.30
B3-aromatic11.515.7413.63.00
Table 6. Stripping-related abrasion loss in samples with different binders.
Mixes with Different BindersWeight Loss after Rutting Test
B1-aromatic−0.3%
B2-aromatic−0.6%
B2-aliphatic−0.3%
B3-aromatic−30.3%
Table 7. Permeability of different new mixes.
Mix TypeInfiltration Rate, I (mm/h)Standard Dev.
Control Mix127,6951657
New Mix 1139,0677653
New Mix 2168,08062,793
New Mix 398,62847,971
New Mix 4128,92310,868
Table 8. Permeability of mixes with different binders.
Mix TypeInfiltration Rate, I (mm/h)Stdv.
B1-aromatic (Control)127,6951657
B2-aromatic125,3931598
B2-aliphatic122,2346065
B3-aromatic130,0821719
Disclaimer/Publisher’s Note: The statements, opinions and data contained in all publications are solely those of the individual author(s) and contributor(s) and not of MDPI and/or the editor(s). MDPI and/or the editor(s) disclaim responsibility for any injury to people or property resulting from any ideas, methods, instructions or products referred to in the content.

