Article

Establishing Particle Size Recommendations for Cationic Asphalt Emulsions

1
Department of Civil Engineering, University of Arkansas, 700 W Research Center Blvd., Fayetteville, AR 72701, USA
2
Servicios Generales en Electricidad y Construcciones SGEC S.R.L., La Paz 0201, Bolivia
*
Author to whom correspondence should be addressed.
Constr. Mater. 2025, 5(2), 26; https://doi.org/10.3390/constrmater5020026
Submission received: 20 March 2025 / Revised: 9 April 2025 / Accepted: 16 April 2025 / Published: 21 April 2025
(This article belongs to the Special Issue Advances in Sustainable Construction Materials for Asphalt Pavements)

Abstract

:
Asphalt emulsions are used in flexible pavement maintenance and rehabilitation treatments. Emulsion specifications for material characterization are based on testing methodology dating to the 1930s. Newer test methods, including particle size analysis (PSA) of binder droplets in emulsion, have been explored but not implemented into specifications. The objective of this study is to observe the particle size and performance of cationic slow-setting (CSS) emulsions and establish baseline particle size recommendations for cationic emulsions. Four physical property tests (residue, oversize particles, viscosity, and particle size) and two cold mix asphalt performance tests (indirect tensile strength (IDT) and direct shear test (DST)) were conducted on two emulsions (CSS-1 and CSS-1H) over a six-month period. The physical properties of both emulsions were acceptable, and median particle size of the CSS-1H was approximately 3 microns larger than the CSS-1. The IDT strength and DST shear strength of the CSS-1H were higher than of the CSS-1. Recommendations for particle size were proposed by defining maximum limits on median, d10, d90, and span. It is recommended that the maximum median (d50) size of CSS emulsions is 6.0 microns. Future research is needed to standardize PSA procedures, assess recommendations for a wider range of emulsions, and evaluate applicability of minimum particle size limits.

1. Background

Asphalt emulsions, or emulsified asphalt, are used in various pavement maintenance and rehabilitation treatments. These treatments can be loosely sorted into two categories: surface treatments and structural treatments. Surface treatments, which enhance surface characteristics of structurally sound existing pavements, include chip seals, slurry seals, and microsurfacing [1]. Structural treatments, which enhance structural capacity of existing pavements, include Hot In-place Recycling (HIR), Cold In-place Recycling (CIR), and Full Depth Reclamation (FDR) [2].
There are three existing standards in the United States for these asphalt emulsions, based on the charge, reactivity, and material components of the asphalt emulsions. These standards are:
  • AASHTO M 140: Emulsified asphalt [3]
  • AASHTO M 208: Cationic emulsified asphalt [4]
  • AASHTO M 316: Polymer-modified emulsified asphalt [5]
These three standards have material requirements for both the emulsified asphalt and the emulsified asphalt residue. Emulsions are given designations [6] based on setting speed, or the rate at which they “break”, the process whereby water leaves the system and leaves behind residue. The designations “RS”, “MS”, and “SS” indicate Rapid-Setting, Medium-Setting, and Slow-Setting, respectively. A prefix of “C” is used for cationic emulsions, and a suffix of “-1” indicates low viscosity, whilst “-2” indicates high viscosity. Further suffixes exist for latex, “L”, and polymer, “P”, modified emulsions.
In terms of the asphalt emulsion itself, requirements are in place for viscosity, storage stability, reactivity, particle charge, and sieve (oversized particles). Testing methodologies for 23 tests, including those aforementioned, is defined in AASHTO T 59 [7]. It is interesting to note that many of the material requirements have their roots in tests that were in place in the 1930s [8], and there has been relatively little movement toward newer test methods.
One of the few newer test methods is particle size, proposed by James (2006) [9]. James indicated that particle size can “strongly influence the physical properties of the emulsion, such as viscosity and storage stability”. He goes on to discuss that “larger” average particle size lowers viscosity, along with “broad” or bimodal particle size distribution. Finally, he states that “smaller” particle size leads to improved performance. While a range of particle sizes is provided (0.1–20 microns), the terms large, broad, and smaller are left unquantified. Ronald and Luis (2016) [10] discussed how different formulation and manufacturing decisions could impact particle size, stating that the quantity of emulsifier and the shearing force during the milling process affect the particle size. Similar claims that a smaller droplet size is closely related to the quality of the emulsion are supported by other sources [11], though terms such as “smaller” droplets and “narrower” distributions are frequently used but not quantified. Prior research also shows links between emulsion particle size and storage stability characteristics [12], promoting the importance of understanding particle size of asphalt emulsions.
More recent research, however, has begun to try and properly quantify particle size of asphalt emulsion. Buss et al. (2018) identified that among cationic rapid-set (CRS) emulsions, 11 microns was the average particle size of a CRS-2 emulsion and that a bi-modal distribution was observed for a CRS-2P emulsion, with peaks at 3 and 10 microns [13]. However, it was still the case that no recommendations were made for establishing particle size requirements. Kiihnl and Braham (2021) [14] developed preliminary recommendations for cationic slow-set and cationic medium-set emulsions. These recommendations were developed by correlating particle sizes with viscosity [14]. Multiple metrics were explored in relation to particle size, including d10, d50, d90, mean, and span. Based on existing viscosity specifications in AASHTO M 208 [4], a set of recommendations was developed. For cationic slow-set (CSS) emulsions, a d10 of 2.4 microns and d50 of 4.4 microns were proposed, with no recommendations for mean, d90, or span. For cationic medium-set (CMS) emulsions, a d10 of 3.2 microns and d50 of 6.9 microns were proposed, with no recommendations for mean, d90, or span. Diaz-Romero and Braham (2022) [15] explored three types of CRS emulsion: CRS-2, CRS-2L, and CRS-2P. In this work, recommendations were based on correlating particle size with the sweep test, viscosity, and storage time. The sweep test is a performance, field-based test, which allows for a more robust determination of particle size limits for rapid-setting emulsions. The same metrics used in Kiihnl and Braham (2021) were leveraged, and mean particle size recommendations were 1.9 microns for CRS-2, 3.0 microns for CRS-2L, and 10.7 microns for CRS-2P [14].
However, there have been no performance tests linked to CSS or CMS emulsions. These performance tests would be run on cold mix asphalt (CMA), or cold recycled asphalt (CR). This paper will refer to this process as CMA. CMA is a combination of Reclaimed Asphalt Pavement (RAP) and a stabilizing agent (AASHTO MP 31 [16], AASHTO PP 86 [17]). In this work, the CMA could represent either Cold Central Plant Recycling (CCPR) or Cold In-place Recycling (CIR), and the stabilizing agent is asphalt emulsion. CR mixtures also typically include water (AASHTO PP 86 [17]). CSS and CMS emulsions are commonly used for a variety of pavement maintenance and rehabilitation treatments; therefore, there is a need to further explore potential specifications for these slow-set and medium-set emulsions.

2. Research Objectives

The research objectives of this study are to build upon prior particle size recommendations by (1) observing the physical properties and CMA performance of cationic slow-set emulsions over a period of six months and (2) providing a recommended particle size for cationic asphalt emulsion specifications based on laboratory performance tests.

3. Methods

To link potential particle size specifications to performance tests linked to slow-set and medium-set asphalt emulsion, two cationic slow-setting emulsions manufactured by Asphalt Emulsion Manufacturers Association (AEMA) member companies in the United States were observed in this study: one low viscosity (CSS-1) and one low viscosity with hard penetration binder (CSS-1H). The CSS-1H emulsion designation indicates the emulsion was produced with a stiffer binder than that of the CSS-1. The CSS-1 was sourced from an Arkansas emulsion plant, and the CSS-1H from a Texas plant. The two emulsions studied also represent two different asphalt binder sources, since a stiffer binder was used in the CSS-1H emulsion. The two emulsions were tested using four material property tests and two performance tests. Testing was conducted up to six months after receiving the emulsion samples.
In the six-month testing duration, the emulsion was stored in a forced convection lab oven at 140 °F (60 °C) by the recommendation of the manufacturer. Emulsions were received and stored in five-gallon (approximately 20 L) containers. Prior to testing, the emulsion in the large five-gallon containers was thoroughly stirred and transferred into small, round HDPE plastic containers approximately two liters in volume to improve ease of handling and prevent unnecessarily cooling large portions of material when removed from the oven for testing. All storage containers were covered with firmly seated lids during storage to prevent the evaporation of water over the duration of the study. Periodically, approximately one to three times per week, the emulsions in the oven were stirred using a glass rod to ensure homogeneity and counteract settlement. Tests were run on both asphalt emulsion and on CMA specimens produced using asphalt emulsion as a stabilizing agent.

3.1. Asphalt Emulsion Physical Property Tests

Four tests were performed to assess physical properties of the emulsion: residue test, sieve test, viscosity, and particle size. The residue test is performed by heating an uncovered container of emulsion in an oven to evaporate the water and obtain a residue. If necessary, the residue obtained by this method may be used for further testing. The sieve test involves passing an emulsion sample through a #20 (850 μm) sieve to determine the percentage by weight of oversized particles. Two widely used tests are used to determine the viscosity of a material at a defined temperature: Saybolt Furol and rotational paddle. The Saybolt method involves timing the flow of a sample through an orifice, and the rotational paddle method involves electronic sensors which can determine the viscosity of a material as a paddle is rotated at a fixed speed. Finally, a particle size analysis can be performed by several means; commonly, the Coulter method or laser diffraction is used. In the Coulter method, the particle size is captured by a change in electrical resistance of displaced electrolyte solution as particles flow through an orifice. In the laser diffraction method, the particle size is captured by photoreceptors observing the pattern of light refracted from a particle.
The residue test was performed only once, whereas the other three property tests were performed periodically over six months. After receiving the emulsions, tests were performed on days 1, 2, 4, 5, 11, 15, and 18. Following day 18, tests were conducted weekly for four weeks and then six more times (approximately two to four weeks apart) until the final tests were performed on day 184.

3.1.1. Residue and Sieve Tests

On day 3 of testing, a residue test was performed with three replicates, according to ASTM D6934-08 [18]. Procedure A was followed since no testing was to be performed on the emulsion residue. Beginning on day 1 and until day 168, nine sieve tests were periodically performed with three replicates according to ASTM D6933-18 [19].

3.1.2. Rotational Viscosity Test

Beginning on day 1 and until day 184, rotational paddle viscosity was periodically measured using three replicates to ensure the emulsion maintained stability throughout the study. ASTM D7726 was followed [20], with the exception that material was not passed through a sieve when dispensed into the test cup. Since slow-setting emulsions were used, the viscosity was tested at 25 °C [14]. Prior to testing, the emulsions were removed from storage and placed in a water bath so that a stable equilibrium temperature could be reached for testing. The digital paddle viscometer used was not equipped to take automatic readings for a 25 °C test, so the internal heater was disabled, the ambient room temperature was set to 25 °C, and the emulsion was conditioned to 25 °C by placing the two-liter storage containers in a water bath. The water level in the bath was kept as high as possible without submerging the lids of the plastic containers to prevent the risk of water entering the emulsion containers during handling. The viscosity of the emulsion could then be read from the display to measure viscosity.

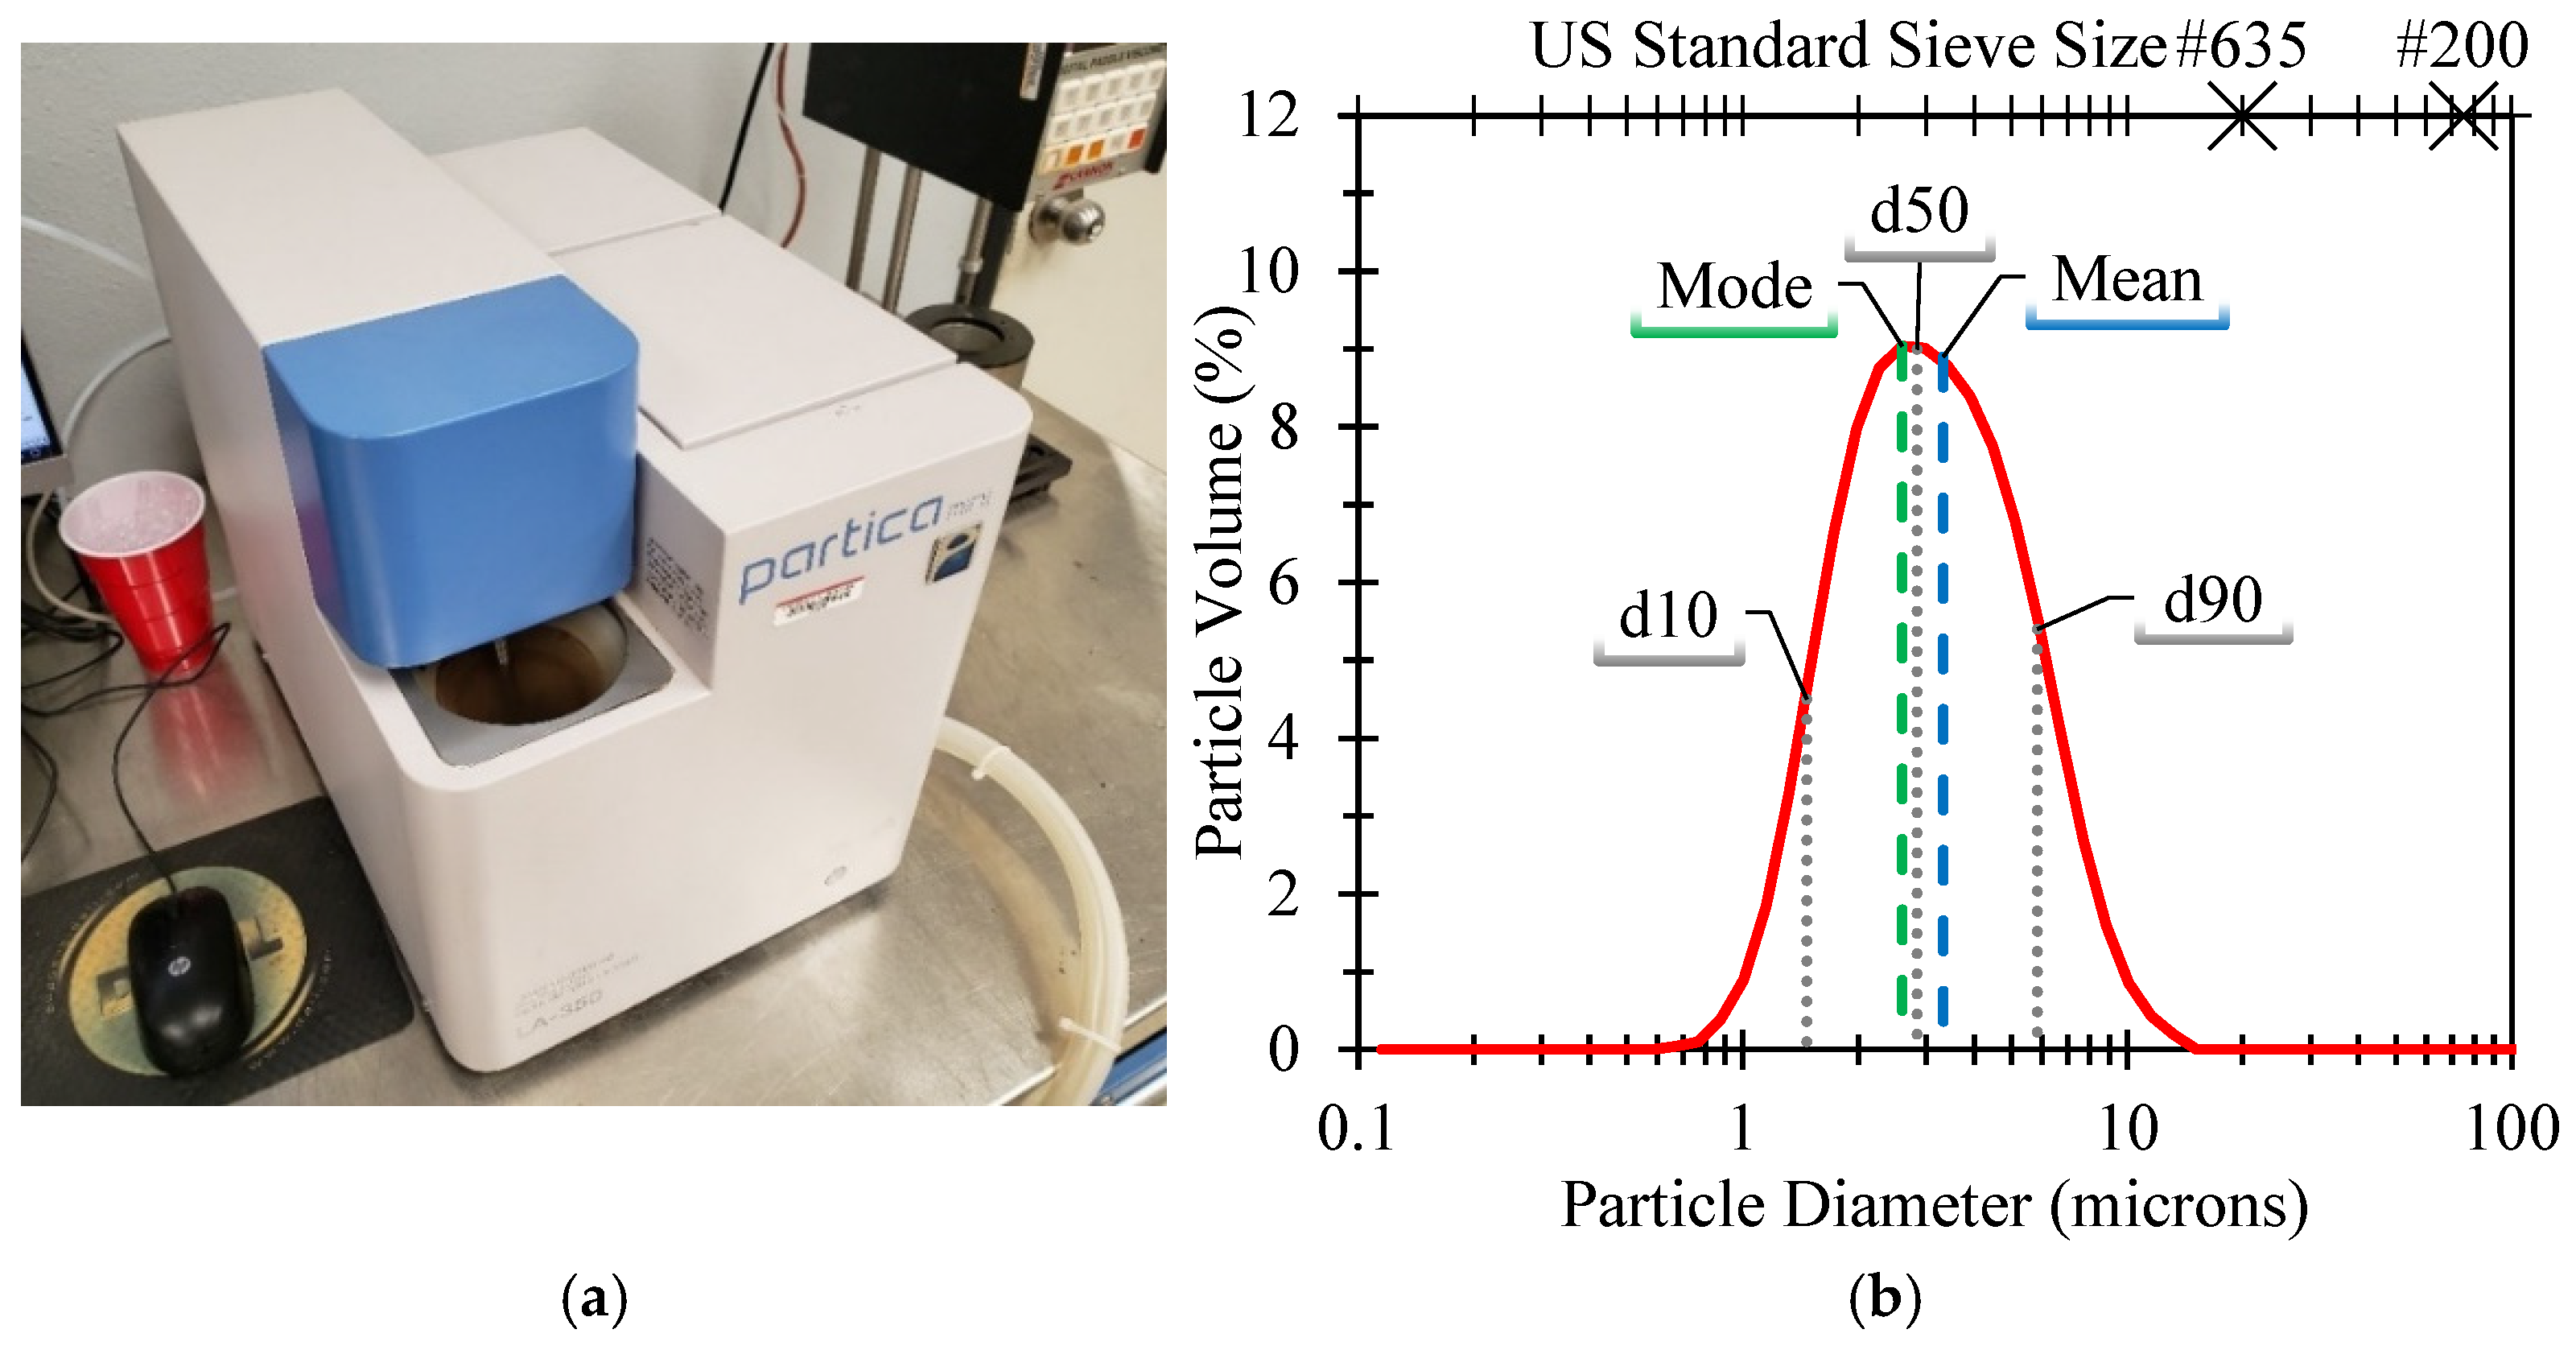
3.1.3. Particle Size Analysis (PSA)

Beginning on day 1 and until day 184, the particle size of the emulsions was periodically checked using a Partica Mini LA-350 laser scattering analyzer manufactured by Horiba Ltd., headquartered in Kyoto, Japan (Figure 1a). The particle analyzer sizes particles in a wet condition, and distilled water was used as the dispersion medium. The date, emulsion type, source, and refractive indices were first entered into the particle analyzer software. A refractive index of 1.630 for the emulsion and 1.333 for the distilled water were used for all tests. Prior to measurement, one drop of emulsion was placed into the dispersion medium and then diluted with distilled water until transmittance was between 75% and 95% using an auto dilute feature available on the particle analyzer to obtain one analytical sample. For each analytical sampling of emulsion, the particle size of at least 10,000 particles was measured to obtain a particle size distribution; then, the process was repeated two more times, and the results of the three distributions were averaged. The particle size analysis was then repeated for two more analytical samples and averaged with the first analytical sample for each emulsion type on each testing day. Therefore, each particle size curve or metric is the average value of nine distribution measurements and three analytical samples to ensure a representative and repeatable measurement is used.
The results of the particle size analysis include a curve of particle frequency or volume by size (Figure 1b). The analysis in this study was performed solely on a volume basis. From the curve, several statistics were derived, including the following:
  • d10, the particle size at which 10% of the volume of material is smaller in size;
  • d50, or median, the particle size at which 50% of the volume of material is smaller in size;
  • d90, the particle size at which 90% of the volume of material is smaller in size;
  • Mean, the arithmetic average particle size;
  • Mode, the most commonly observed particle size;
  • Standard deviation, a measure of closeness to the mean;
  • Span, a measure of closeness to the median: span = d 90 d 10 d 50 .
These metrics are used to define the particle size curve. In its simplest form, a particle size curve can be represented by two values: a measure of central tendency and a measure of spread. The measure of central tendency (mean, median, or mode) describes the typical size of a particle. In a perfectly symmetrical distribution, each of these measures of central tendency will be equal, but asymmetrical or skewed distributions may have different values for each measure of central tendency. The measure of spread (standard deviation, span) describes how great the range of particle sizes is from the center. The higher the measure of spread, the greater the distance there is between the smaller and larger particles present in an emulsion.

3.2. CMA Mixture Performance Tests

Two performance tests were conducted for CMA mixtures made with each emulsion: the indirect tensile (IDT) strength test and the direct shear test (DST). The IDT test was chosen to serve as a point of reference since it is a well-established and familiar test in most asphalt mixture laboratories. On the other hand, the DST was specifically developed to quantify the behavior of asphalt emulsion-based mixtures; therefore, it is a strong complement to IDT strength. Specimens for the performance tests were prepared on the days the emulsion property tests were performed. Each performance test was conducted three days after the specimens were prepared. Test days for the performance tests will herein refer to the date of specimen fabrication. The IDT was performed seventeen times following select physical property test days, and one additional time on day 217. The DST was performed for the first seven test days. The inclusion of these performance tests will enable any change in emulsion properties over the course of the study to be compared to IDT and DST performance. Changes in the physical properties, such as particle size, could be reflected in the performance testing results, bolstering the need for guidance or recommendations of particle size.
The CMA specimens were prepared according to AASHTO MP 31 [16] and AASHTO PP 86 [17] by obtaining approximately 2600 g of RAP using the splitting method [21] and placing precisely 2600 g of split RAP into a 6” cylinder mold with a scoop. The samples were then hydrated with 52 g of water and sealed with a plastic bag over the cylinder opening to prevent moisture loss before mixing and compacting. It was determined based on the project from which the RAP sample was obtained that the optimum emulsion content for both emulsions was 3%, which was the amount of emulsion used for all specimens. Then, the hydrated RAP was placed into a plastic 5-gallon bucket in a bucket mixer, the emulsion was added into the bucket with care to coat the aggregates directly, and the sample was mixed for 60 s [17] while scraping the edges of the bucket to mix the sample and uniformly coat the RAP with emulsion. After mixing, the samples were then placed into a 150 mm diameter gyratory mold and compacted to 30 gyrations in a gyratory compactor with a consolidating pressure of 600 kPa. Following compaction, specimens were cured in an oven at 60 °C for 48 h, and then 24 h was allowed for cooling the specimen prior to any testing.

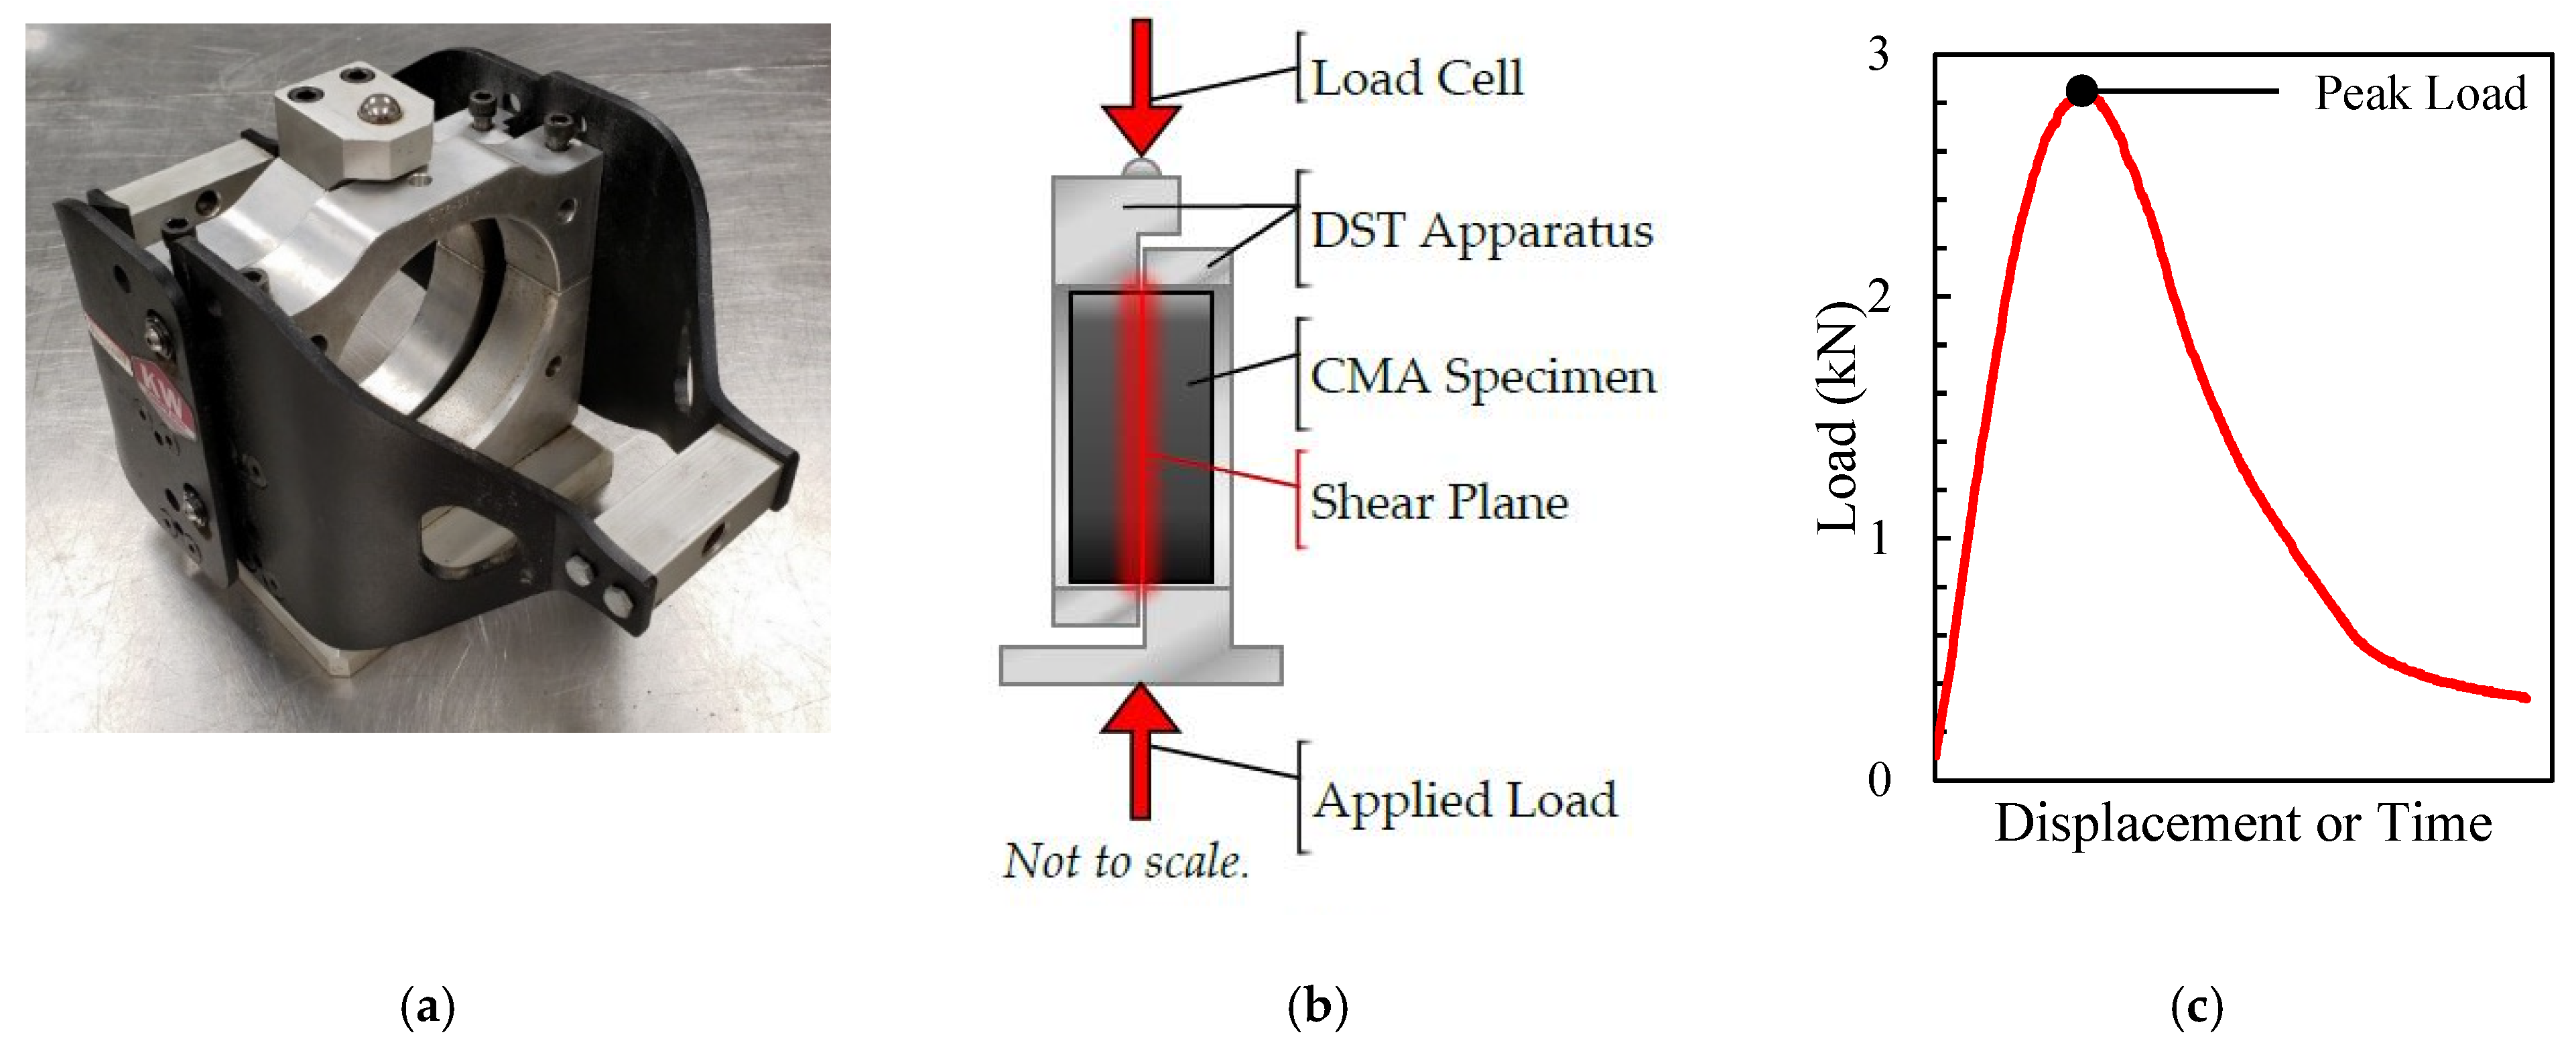
3.2.1. Indirect Tensile (IDT) Strength Test

The IDT test was performed adhering to ASTM D6931-17 on a Pine Instrument Company load frame at a rate of approximately 50 mm/min [22]. All tests were performed using 150 mm diameter CMA specimens, using the respective emulsion as a stabilizing agent. Three specimens were compacted on each physical property test day using emulsion and RAP, and then broken three days later to obtain three replicates per test day per emulsion type.
The IDT strength test is a well-established test for assessing the cracking resistance of an asphalt mix or understanding the effects of moisture damage when paired with a moisture conditioning procedure. While the IDT test is typically performed on bound pavement samples such as with hot mix asphalt (HMA), the choice was made to test the CMA mixtures using the IDT test as a point of reference which many asphalt laboratories will be familiar with. CMA mixtures are not fully bound materials like HMA, but the IDT test was chosen due to its prominence.

3.2.2. Direct Shear Test (DST)

As with PSA, the DST lacks a formal published specification. The DST was performed using an asphalt tack coat/interlayer shear strength apparatus for 150 mm diameter specimens manufactured by Gilson Company, Inc. of Lewis Center, OH, USA (Figure 2a).
The test was based on bond strength tests for tack coats on HMA, but it can also be used to gauge the cohesion gain of CMA mixtures. By using an apparatus with two rings to surround a compacted specimen and a Marshall load frame to exert a force downward on one of the rings, a shear force will be introduced over a cross-section of a CMA specimen [23] (Figure 2b).
By performing the DST over a series of days, rather than observing the time taken for cohesion gain, the impact of storage time on cohesion effectiveness of emulsion can be observed. For each test, the peak load observed from the load–displacement curve (Figure 2c) is used alongside the specimen diameter to calculate the maximum shear strength of the specimen, reported as the DST shear strength. Three DST replicates were performed for each test.

4. Results and Discussion

4.1. Asphalt Emulsion Physical Properties

4.1.1. Residue and Sieve

The residue test was performed on day 3 and resulted in a residue of 60.4% for the CSS-1 emulsion and a residue of 65.9% for the CSS-1H emulsion, which are both sufficient to satisfy the minimum requirement of 57% residue specified for cationic slow-setting emulsions in AASHTO M 208-18 [14]. If the residue requirements were not met, it may indicate that an unrepresentative sample of emulsion was taken from the plant or that poor material which is not representative of typical slow-setting emulsions was delivered. Verification that each emulsion possessed the appropriate amount of residue did not suggest that there were significant deficiencies with the material at the time of arrival to the lab.
Sieve tests conducted on days 1, 11, 25, 46, 74, 121, 141, 168, and 184 each showed that both emulsions had 0.01% or fewer oversized particles. This result is well below the 0.10% maximum oversize particle allowance [4] and does not indicate any material deficiency.

4.1.2. Rotation Viscosity

The viscosity was tested over the entire six-month duration of the study. It was found that there was little change in the viscosity of the CSS-1 emulsion, as the viscosity was in the 40 to 50 cP range until days 168 and 184, when the viscosity had increased to 57 and 59, respectively (Figure 3). The CSS-1H saw a significant drop on day 46 and a significant increase on day 184 compared to the typical 90–100 cP observed on most days. Despite these changes, the viscosity remained within 40–200 cP specification through the entire testing period [4]. While extreme values could be caused by operator error, such as improperly setting the height of the viscometer cup and causing the paddle to be partially submerged or rub against the bottom of the cup, the low to moderate standard deviations seen on these days suggest this was not the cause, due to the unlikelihood of repeating the same mistake on all replicates. In addition, the lack of deviation on the CSS-1 data indicates that the operator properly ran the equipment. Instead, there are two potential causes of the deviation observed in Figure 3. First, the CSS-1H could naturally be more susceptible to variability during storage, thus causing viscosity fluctuations over time. Second, this variation could create challenges with representative sampling of the asphalt emulsion, as segregation due to lower stability could cause unrepresentative samples to be tested. CSS is generally a very stable emulsion, but it is possible that the harder penetration grade of the base asphalt binder decreases the stability. Finally, the sharp increase observed on the final day of testing may also indicate that the CSS-1H had partially broken by the end of the study duration; however, this is difficult to ascertain since no tests were conducted following this day. No further testing of the emulsion was performed beyond this point, as it was the end of the six-month test period, and the emulsion viscosity still remained within specification.
Kiihnl and Braham (2021) observed the viscosity of slow-setting emulsions to increase greatly in the first week after manufacture [14]. However, this was laboratory produced asphalt emulsion that was purposely designed at the fringes of design parameters. The emulsifier loading was intentionally designed slightly outside of the manufacturer’s recommendation to test the impact of changing the level of emulsifier on asphalt emulsion performance. Therefore, it is not surprising that this plant-produced emulsion, produced within manufacturer’s recommendations, behaved differently. Diaz-Romero and Braham (2022) observed the viscosity of rapid-setting emulsions and found the viscosity increased over a six-month period well beyond the 800 cP limit for CRS [15]. This shows that the viscosity behavior of slow-setting and medium-setting asphalt emulsions is different than rapid setting asphalt emulsions, which is not surprising. Rapid-setting asphalt emulsions are inherently less stable, as there is generally a lower amount of emulsifier, and the emulsifier formulation is designed for a more rapid break in the field. This behavior in the field leads to lower storage stability.

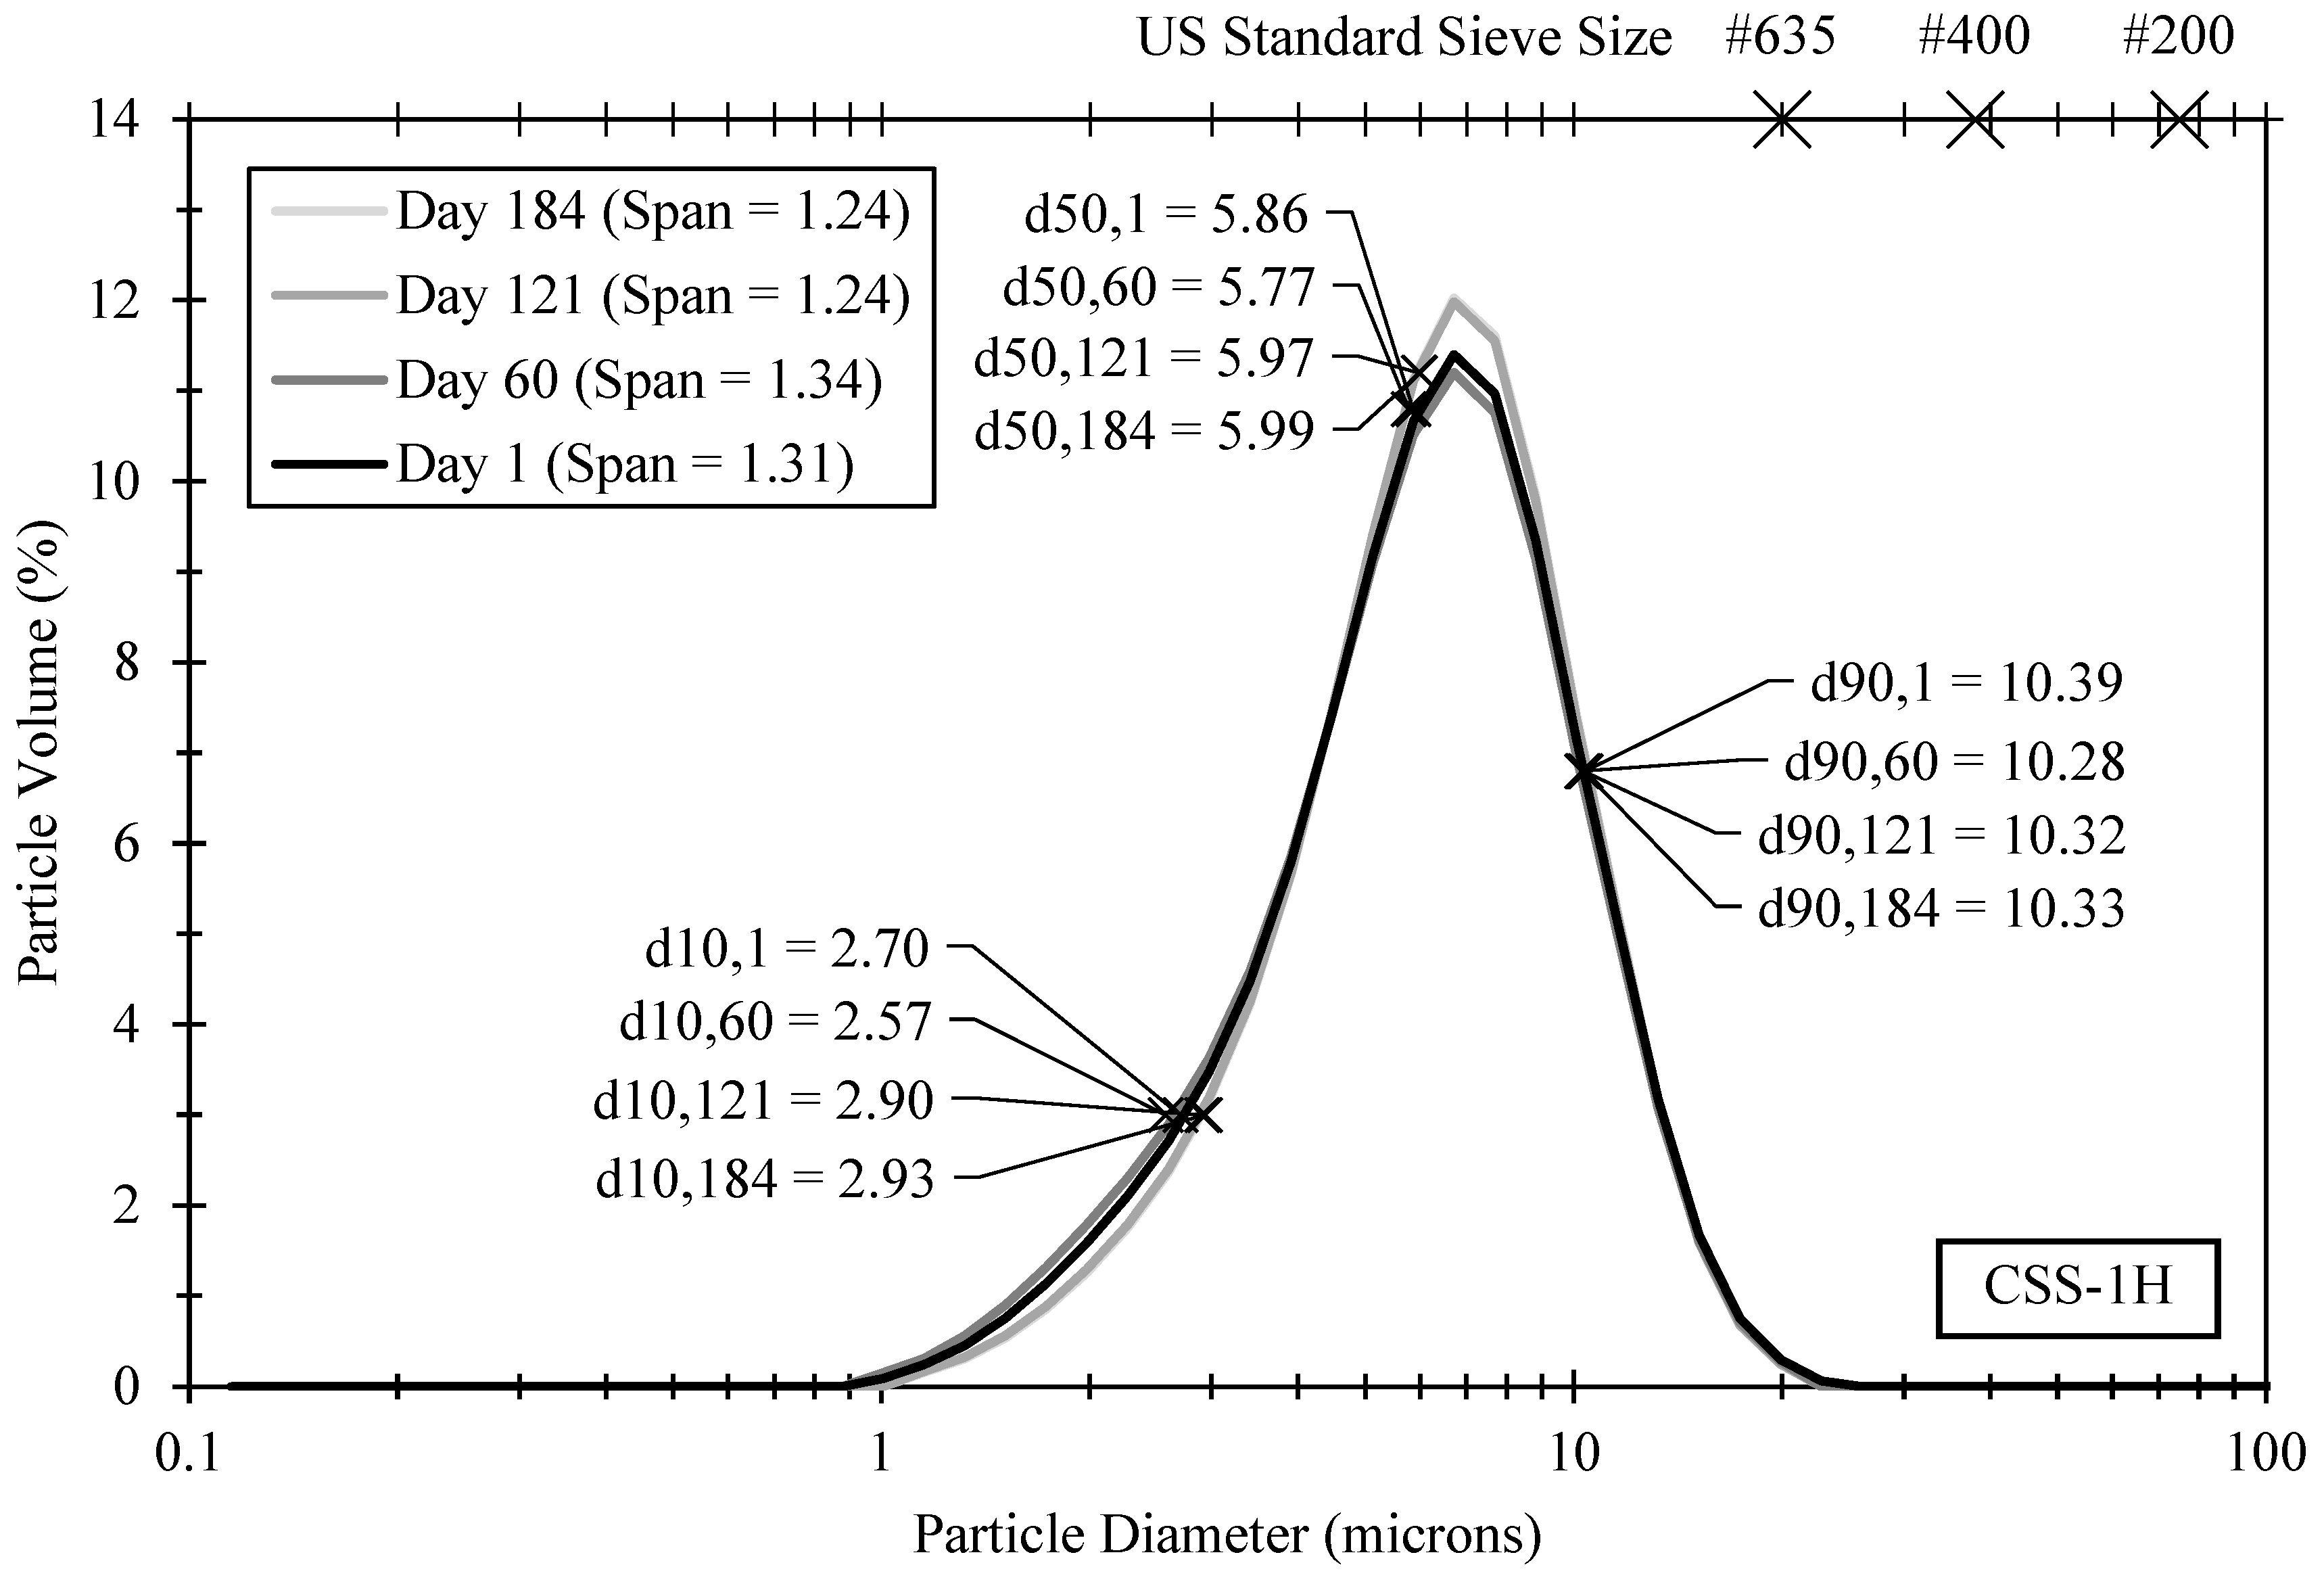
4.1.3. Particle Size Analysis (PSA)

The particle size analysis performed showed small changes in the particle size of each emulsion. For the CSS-1 emulsion, it can be visually observed that the curve has shifted to the right and up from the day 1 conditions (Figure 4). The d10, d50, d90, mean, and mode were all higher after six months (Table 1). These increases could indicate minor coalescence of the binder droplets over the study duration. The span, unlike the other metrics, however, decreased.
The metrics reported for each day are an average of nine replicates. Three runs, or measurements, were performed on an approximately one-droplet sample of emulsion. The average of these three runs was then reported by the equipment. This procedure was performed on two additional analytical samples of emulsion for each day and the results were averaged, such that each value in Table 1 is the average of all nine replicates.
The standard deviation metric is a measure of spread from the mean of each particle size curve. The standard deviation does not represent the replicability of the runs or the variance of the other metrics in the table. Instead, the standard deviation is the average standard deviation from the mean for each run, not the standard deviation from the mean for the average run. This distinction has been noted since while other metrics (mean, d10, d50, d90, span) can be averaged in any sequence without changing the result, the collection of standard deviation for each curve and subsequent averaging is not equivalent to the standard deviation of the average curve for all runs. Future exploration should be performed to understand how particle size software and analysis of standard deviation metrics impact the reported value.
The CSS-1H exhibited even fewer notable changes in particle size over the six-month duration (Figure 5). The d10 grew by 0.33 microns, the span shrank by 0.06 microns, and the mode remained virtually unchanged between the first and last days of testing (Table 1). This gives confidence that hardly any permanent coalescence of the CSS-1H occurred during the test period. Day 141 saw a large, nearly 1.0 micron increase in mean and mode from the previous test day. By the following test day, these metrics returned to the conditions previously observed. This phenomenon was likely the result of testing on an unrepresentative sample of the emulsion caused by a failure to stir the emulsion to a homogeneous state.
Since the laser diffraction method of PSA relies on the assumption that the particles are spherical [24], the full extent of the particle size behavior may not be completely understood. While it is assumed that the binder droplets of the emulsions in this study were indeed spherical, this assumption was not verified, nor is it known if the binder droplets retain their spherical shape as coalescence occurs. Additionally, the amount of emulsion necessary to perform the test was less than one drop. This fact makes it difficult to ascertain if the particle size tests were performed on representative portions of the material. More research could be done to explore these shortcomings.
The physical property tests performed verified that the residue and oversized particles were within specification for both emulsions. Additionally, while the viscosity of both emulsions increased during the six-month storage period, the viscosity of both emulsions remained within specification. The viscosity of the CSS-1H emulsion was higher than that of the CSS-1. There is no current specification containing criteria for particle size, but it was found that the mean particle size of the CSS-1H was approximately two and a half to three microns larger than that of the CSS-1.

4.2. CMA Mixture Performance Tests

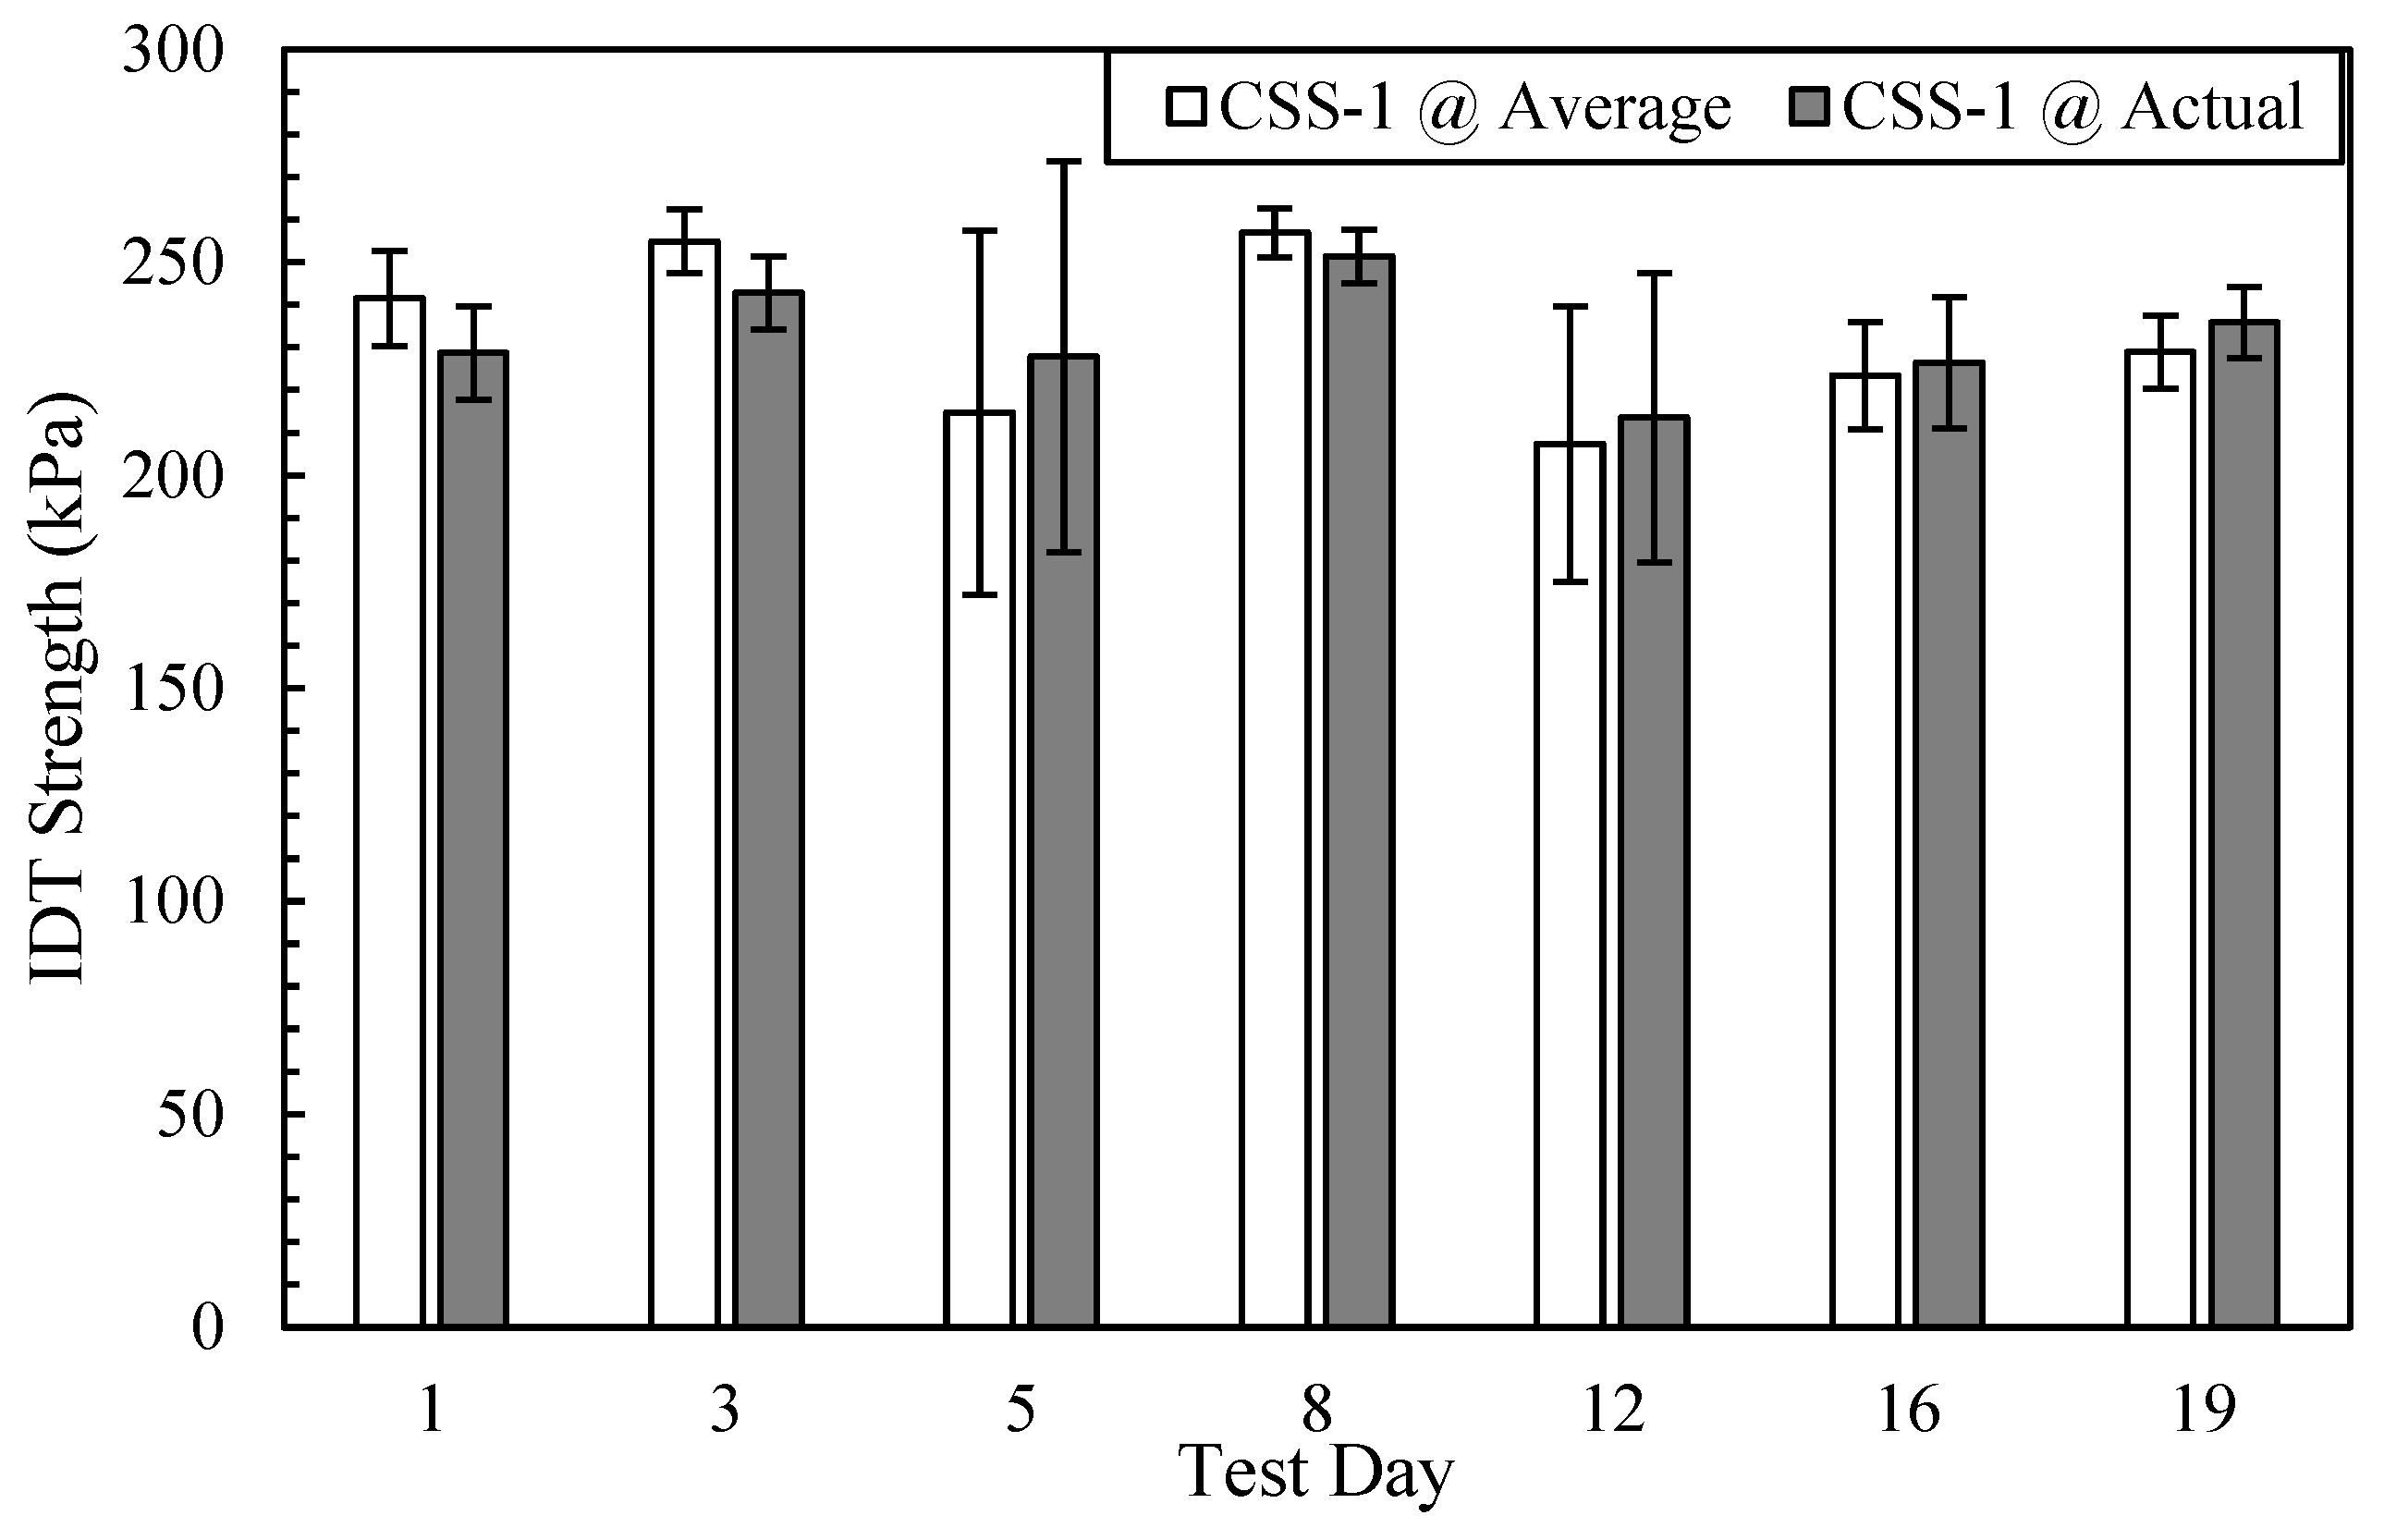
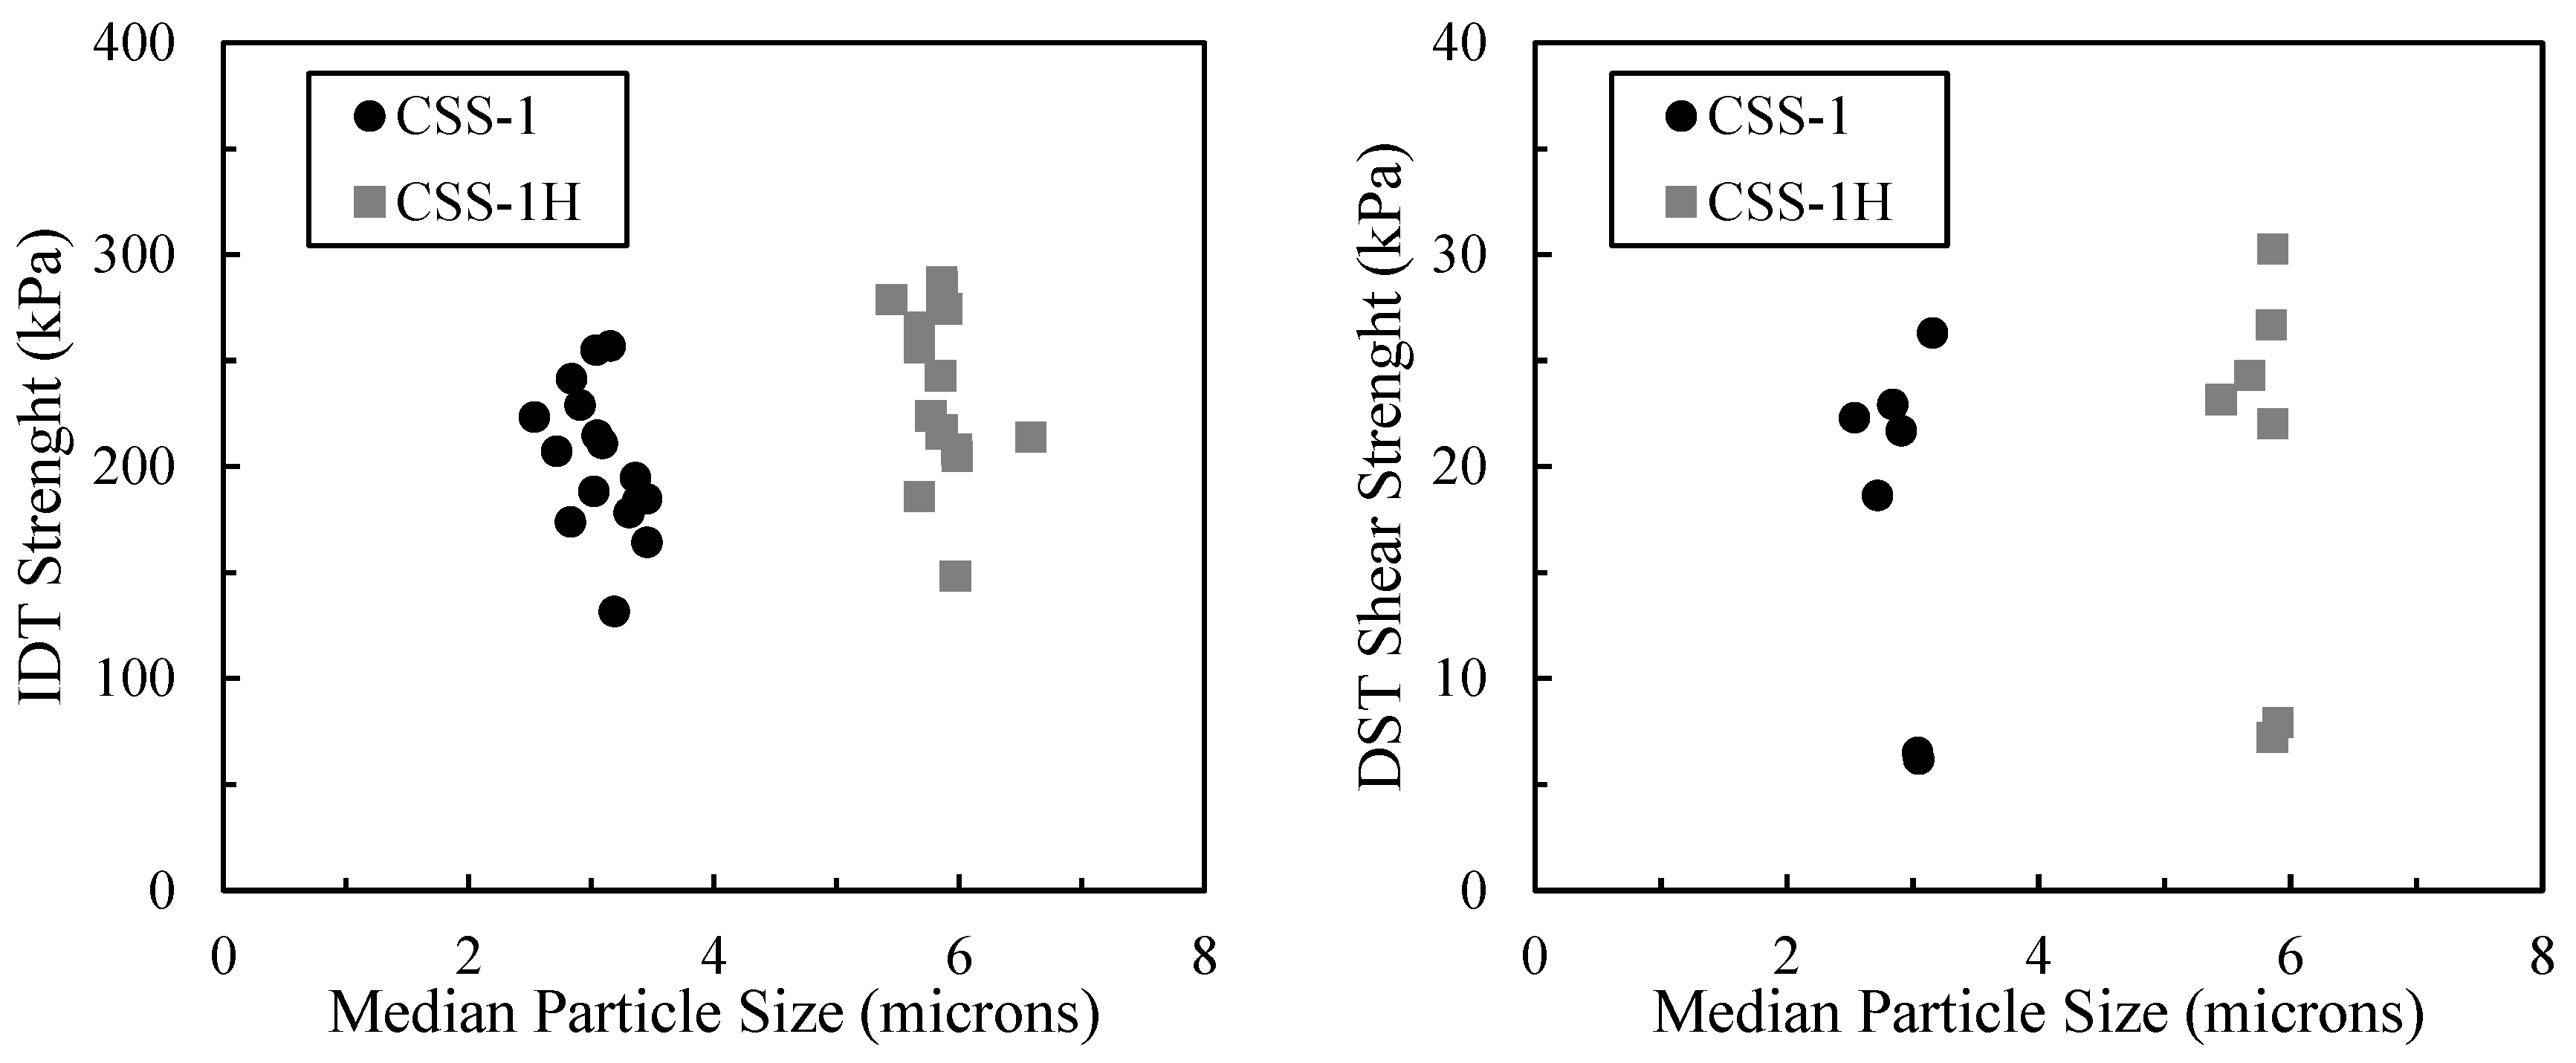
4.2.1. Indirect Tensile (IDT) Strength Test

Eighteen sets of the IDT were performed, but the specimen height was only recorded for the first seven days. Using the data collected for these days, the average specimen height for samples compacted by the operator in the lab was found to be 77.7 mm, with a standard deviation of 3.2 mm. For the first seven tests, this information was used to gauge the sensitivity of IDT results to specimen thickness. The IDT strengths of the CSS-1 samples were calculated using the actual measured thickness and average thickness. The influence of thickness was then observed (Figure 6).
By visual observation of the error bars from the three replicates, it can be seen that the thickness has a measurable effect. However, each of the error bars overlaps the actual and assumed average, so the effect of specimen thickness is not statistically significant compared to the repeatability of the IDT when the thicknesses are known. Therefore, it was decided that the average specimen height would be taken as the average established previously. Additionally, one standard deviation increase and decrease in specimen height were both considered for each test to reflect the greater uncertainty in precision due to the assumed heights.
The IDT of specimens using each emulsion was determined for all test days, assuming an average specimen height for each test for the CMA mixtures with CSS-1 and CSS-1H (Figure 7). The uncertainty in specimen height makes drawing definitive conclusions difficult, but it does appear that there is a decrease in the IDT strength as time passes. The lower IDT strength coupled with the slight increase in viscosity may be an effect of poor coating of the RAP after increased storage time of the emulsion.
For both emulsions, the CMA mixtures fell short of the minimum 310 kPa IDT strength requirement [16] on each test day. The inclusion of this test was to observe changes in the emulsion over time rather than to verify that the CMA samples passed the minimum strength requirement; therefore, this finding is not concerning. The two mixtures both utilized asphalt emulsion alone as a stabilizing agent to determine the performance of the emulsion more directly. It is common for Portland cement to also be used in conjunction with asphalt emulsion to meet the 310 kPa strength requirement, but no supplementary stabilizing agent was used in this study to avoid introducing an additional confounding factor, since the strength of the samples was not the primary motivation for performing the test. It is believed that the observation of the relative change in emulsion performance during the storage period was not affected by exclusion of supplementary stabilizers, although future studies could consider a wider selection of tests and sample mixtures to verify this, as well as to more accurately determine the time at which the IDT strength becomes unacceptable, if applicable.

4.2.2. Direct Shear Test (DST)

The DST highlighted that the hard penetration emulsion withstood greater peak shear force than the traditional low-viscosity counterpart (Figure 8). This was observed to be statistically significant on most days. This result makes sense as a hard penetration emulsion with a stiffer residue should be less flexible and handle a greater shear force after breaking and adhering to an asphalt mixture.
An anomaly in the maximum shear strength achieved is seen on the third and fifth day, where the peak loads were much lower before failure. The shear strength for these days exhibits sharp drops which may indicate a mix difference in these samples. The lower shear strength could be a reflection of the material selection or sample preparation. Unrepresentative samples of RAP could have been batched, or the operator’s technique in adding the emulsion and mixing the samples prior to compaction could have been a contributing factor for the results obtained.
It seems unlikely that the day 1 shear strength was in error, as if the reasons behind the decrease in IDT strength over time are correct, then a decrease of the DST strength would also be expected. Excluding days 3 and 5, any trends present are still unclear. It would be expected that, like the IDT, longer storage times should lead to more difficulty with coating and result in less DST strength. The IDT test did not exhibit strong trends within the first month of testing for either emulsion, so it is possible that the DST would follow the same trend if testing were continued beyond day 19. Future research could assess the performance of the emulsion after longer storage durations.
Observing the effect of particle size on the performance test results, there is no apparent effect (Figure 9). As the particle size of both emulsions did not greatly change, it is possible that emulsions which experience a larger shift in particle size could have such a change reflected in these performance tests. However, as discussed before, the true size of the asphalt binder droplets may also not be represented, as they may lose spherical qualities over time, thus providing misleading information. The IDT and DST are both also tests performed on CMA mixes which contain RAP with large aggregates many orders of magnitude larger than the emulsion binder droplets, and it is possible that the aggregates present in the CMA mixture have a much larger impact on the performance of IDT and DST than the emulsion particle size.

4.3. Establishing Particle Size Recommendations

Considering past work and the stability of the slow-setting emulsions in this study, preliminary recommendations can be provided to expand the scope of emulsion standards. To ensure the quality and performance of emulsions, it is recommended that the particle size be considered as part of an asphalt emulsion material specification or quality assurance protocol.
An idealized representation of a particle size curve can be defined by two parameters: a measure of central tendency and a measure of spread. In a perfectly symmetrical curve, the measures of central tendency will be equivalent. The median (d50) and mean were considered to serve as the basis for the recommended particle size requirements. Span and standard deviation are the measures of spread which complement the median and mean, respectively, since span is centered about the median value of a particle size curve and standard deviation is centered about the mean.
It is proposed that the median be used as the measure of central tendency and span be used as the measure of spread for emulsion particle size requirements. While reporting the mean and standard deviation from the mean is another option to represent a particle size curve, these metrics are more susceptible to extreme outliers, such as those captured by the sieve test. The measure of spread is responsible for ensuring that an emulsion has a relatively tight distribution free of a large number of particles with extreme sizes. Since both measures of spread lack directionality, a measure of spread must be chosen which produces an acceptable balance of two cases: emulsions with a skew toward smaller particles and emulsions with a skew toward larger particles. Standard deviation’s higher susceptibility to extreme values could increase the reported standard deviation if a few particles far from the mean are present. For example, an emulsion containing some particles much smaller than d10 would increase the standard deviation to a greater extent than span. Since it has not been established if a particle size that is very small is detrimental to emulsion performance or if a minimum particle size should be recommended for cationic emulsions, span is preferred to avoid penalizing emulsions that contain very small particles which may perform satisfactorily. Conversely, requirements have already been implemented for the case where an emulsion contains particles much larger than the mean in the form of the sieve test, which poses limits on oversized particles. While there may still be value in ensuring the tightness of the particle distribution for particles which are larger than the mean but not considered oversized, span is still preferred as an initial step in developing particle size recommendations for this reason. Further exploration of a wider range of emulsion types should be undertaken to determine if median and span are the most appropriate choice in all instances. Furthermore, only monomodal emulsions were assessed, so consideration of bimodal emulsions should be investigated to determine which particle size metrics are most applicable in that case.
Based on the cationic emulsions observed in this study and the literature, it is recommended that the median (d50) be used to capture the center of the particle size curve and span be used to express the spread. The modal size should be permissible as a substitute for median since it will remain unaffected by the equipment’s measurement range as long as the peak of the curve is apparent. Since measures of spread lack directionality, the magnitude of the metric cannot be used to inform whether the particle size was disproportionately skewed toward smaller particles or larger particles from the center of the distribution. Therefore, maximum values of d10 and d90 will be specified to prevent the recommendation of emulsions which have a high proportion of “large” but not oversize particles.
The equipment’s measurement range may impact other metrics, such as d10, d90, and span; therefore, procedures for performing a particle size analysis should be explored to determine the effect of equipment technologies and models on the reported size for these metrics before incorporating recommendations into formal specifications or quality control procedures.
Recommendations for cationic rapid-setting emulsions (CRS) were included in Diaz-Romero and Braham (2022) [15]. The recommendations provided particle sizes for each of the particle size metrics but did not address potential acceptable ranges. The size recommendations were based on the storage duration time at which the emulsion failed to maintain appropriate viscosity. Therefore, these values have been recommended as the maximum since the particle size generally increases with time. The span at the recommended storage age will also be considered the maximum.
The d10 and median particle sizes recommended for CMS-2 and CSS-1 by Kiihnl and Braham (2021) [14] have also been considered. These recommended sizes were based on viscosity alone without consideration of any performance tests, so the performance of these emulsions should be verified. There was no recommendation of span, d90, mean, or modal size, so the particle size metrics of CSS-1 from this study were used to supplement the recommendations, where appropriate. When particle size metrics were both obtained in this study and available in the literature, the larger of the values was taken as the maximum to encompass a wider range of emulsions. The particle size results obtained by Kiihnl and Braham use the electrical sensing zone method [14], but the laser diffraction method was used by Diaz-Romero and Braham [15] and in this study. Any effect of these different sizing technologies on the measurement of asphalt emulsion particle size is not well documented and should be explored further prior to adopting particle size recommendations. The results obtained through these two sizing methods may not be analogous, so care should be taken to determine the effect of equipment type on emulsion PSA measurements and define procedures for conducting PSA. These effects have not been considered for the recommended requirements and should be examined further.
Finally, the particle size of CSS-1H is recommended based on the test samples measured within this study upon verification of passing emulsion property testing, but further exploration of CSS-1H to identify whether changes in particle size have adverse effects on performance also should be undertaken. Based on the findings of this study and of the described past studies, a preliminary set of recommendations for cationic asphalt emulsion particle size is presented in Table 2 and Table 3. These recommendations provide quantification of particle sizes anticipated to yield emulsions with properties within specification and with effective performance, but should be further explored to assess applicability across a wider set of emulsion sources.
Comparing the particle size of the emulsions as recommended with the CSS samples in this study, it can be seen that the recommended particle size of the CSS is generally lower than that of CMS [14]. For rapid-setting emulsions, the recommended maximum particle size is smaller than both CSS and CMS for the unmodified and latex-modified; however, the polymer-modified was recommended to have the highest acceptable particle size of all the asphalt emulsion classifications listed in Table 2 [15]. Therefore, there is not a general rule of thumb to determine the relative recommended particle size based on setting speed. However, it is crucial to note that the methodology in each study differed, and a more comprehensive study incorporating a greater range of emulsion types with the same methodology may be beneficial to more confidently relate particle size to emulsion types. Furthermore, examinations of manufacturing methods, including the use of different emulsifiers, different binder grades, and different colloid mills to observe any effects of these and other factors on recommended particle size in lieu of or in addition to emulsion classification may also be valuable.
Future research is encouraged to determine if these recommendations remain applicable under a wide range of conditions, including emulsions manufactured from different petroleum sources, emulsions manufactured using different equipment, emulsions manufactured with different emulsifying agents, emulsions manufactured with latex or other modifiers, and emulsions designed for different treatment applications. The performance of CSS samples examined in this study was observed for CMA mixtures, though different applications such as fog seals or slurry seals may favor different particle size distributions. Furthermore, while two binder sources were represented in the emulsions studied, further examination of the effect of binder source and stiffness on CMA mixture properties should be undertaken to understand the influence of emulsion residue on CMA mixtures. Future research, therefore, could also aim to recommend sizes considering these alternate applications. The production of a set of emulsions with different particle median sizes and distribution widths may also be beneficial to better understand the limits of particle size for various applications and the influence of manufactured particle size on performance behavior. In addition, it would be beneficial to compare emulsions manufactured in the lab (on both recirculating mills and in-line mills) to emulsions manufactured in the plant. Such exploration would inform the degree to which lab-prepared emulsions are representative of plant-produced emulsions for linking laboratory research to the field. The above recommendations come from either lab-produced (CSS and CMS) or field-produced emulsions (CSS, CMS, and CRS). These considerations for future research should be reviewed to understand if there is a practical minimum particle size and to verify or modify the maximum particle size recommendations presented here.

5. Conclusions

Two emulsions, one CSS-1 and one CSS-1H, were tested in four emulsion property tests (residue, sieve test, viscosity, and particle size analysis) and two performance tests (IDT, DST). Findings were as follows:
  • The viscosity, particle size, IDT strength, and DST strength of the CSS-1H emulsion were greater than that of the CSS-1 emulsion;
  • The viscosity and particle size of both slow-setting emulsions (CSS-1, CSS-1H) changed much more slowly than reported in previous research on slow-setting and rapid-setting emulsions;
  • The residue, oversized particles, and viscosity remained within specification over six months of storage;
  • Based on the findings of this study and the other literature, a preliminary set of maximum particle sizes has been recommended for rapid-setting, medium-setting, and slow-setting cationic emulsions based on viscosity and CMA performance testing (Table 2 and Table 3).
The results and conclusions of this study have practical implications on the continued development and quality control of asphalt emulsions both in the lab and field setting by adding an additional tool to verify the quality of an emulsion. While currently implementation of PSA equipment can be costly, the material requirement is low, and testing duration is quick, allowing manufacturers to quickly assess the emulsion by particle size, which may aid in its adoption, particularly if future equipment offerings are more competitively priced.
Future research should address methodologies for performing particle size analysis and consider the wider sampling of emulsions, different types of emulsions, and other applicable performance tests for emulsions and CMA mixtures before particle size is used as a criterion for material acceptance.

Author Contributions

Study conception and design: A.B.; data collection: P.D.-R.; manuscript preparation: T.T. and A.B.; analysis of results: T.T. and A.B.; review and approval of final manuscript: T.T., P.D.-R. and A.B. All authors have read and agreed to the published version of the manuscript.

Funding

The authors would like to acknowledge funding from industry partners and the United States Army Corps of Engineers.

Data Availability Statement

The original contributions presented in the study are included in the article, further inquiries can be directed to the corresponding author.

Acknowledgments

This work was supported by Ergon Asphalt & Emulsions, Delek US, Ingevity, and Nouryon.

Conflicts of Interest

Pedro Diaz-Romero was employed by the company Servicios Generales en Electricidad y Construcciones SGEC S.R.L. The remaining authors declare that the research was conducted in the absence of any commercial or financial relationships that could be construed as a potential conflict of interest.

References

  1. ISSA. Design & Inspection Manual for Slurry Surfacing Systems; International Slurry Surfacing Association: Glen Ellyn, IL, USA, 2021. [Google Scholar]
  2. ARRA. Basic Asphalt Recycling Manual, 2nd ed.; Asphalt Recycling & Reclaiming Association: Glen Ellyn, IL, USA, 2015. [Google Scholar]
  3. AASHTO M 140-20; Standard Specification for Emulsified Asphalt. American Association of State Highway and Transportation Officials: Washington, DC, USA, 2020.
  4. AASHTO M 208-18; Standard Specification for Cationic Emulsified Asphalt. American Association of State Highway and Transportation Officials: Washington, DC, USA, 2018.
  5. AASHTO M 316-23; Standard Specification for Polymer-Modified Emulsified Asphalt. American Association of State Highway and Transportation Officials: Washington, DC, USA, 2023.
  6. AASHTO R 5-17(2021); Standard Practice for Selection and Use of Emulsified Asphalts. American Association of State Highway and Transportation Officials: Washington, DC, USA, 2021.
  7. AASHTO T 59-22; Standard Method of Test for Emulsified Asphalts. American Association of State Highway and Transportation Officials: Washington, DC, USA, 2022.
  8. Wace, E. The Testing of Bitumen Emulsions. J. Assoc. Asph. Paving Technol. 1937, 9, 257–308. [Google Scholar]
  9. James, A. Overview of Asphalt Emulsions, Asphalt Emulsion Technology. In Transportation Research Circular E-C102; Transportation Research Board of the National Academies: Washington, DC, USA, 2006. [Google Scholar]
  10. Ronald, M.; Luis, F. Asphalt Emulsions Formulation: State-of-the-Art and Dependency of Formulation on Emulsions Properties. Constr. Build. Mater. 2016, 123, 162–173. [Google Scholar] [CrossRef]
  11. Chen, X.; Meng, Y.; Hu, G.; Zhou, J.; Ouyang, J. Factors Influencing the Droplet Size of Asphalt Emulsion during Fabrication. Coatings 2022, 12, 575. [Google Scholar] [CrossRef]
  12. Wang, F.; Liu, Y.; Zhang, Y.; Hu, S. Experimental study on the stability of asphalt emulsion for CA mortar by laser diffraction technique. Constr. Build. Mater. 2012, 28, 117–121. [Google Scholar] [CrossRef]
  13. Buss, A.; Pinto, I.; Guirguis, M.; Cochran, E.; Panthani, M. Enhancing the Fundamental Knowledge and Use of Asphalt Emulsions Using Systematic Scientific and Engineering Approaches; IHRB Project TR-708C; Institute for Transportation, Iowa State University: Ames, IA, USA, 2018. [Google Scholar]
  14. Kiihnl, L.; Braham, A. Developing a particle size specification for asphalt emulsion. Constr. Build. Mater. 2021, 293, 123414. [Google Scholar] [CrossRef]
  15. Diaz-Romero, P.; Braham, A. Refining particle size specification for asphalt emulsion. Constr. Build. Mater. 2022, 350, 128812. [Google Scholar] [CrossRef]
  16. AASHTO MP 31-17; Standard Specification for Materials for Cold Recycled Mixtures with Emulsified Asphalt. American Association of State Highway and Transportation Officials: Washington, DC, USA, 2017.
  17. AASHTO PP 86-20; Standard Practice for Emulsified Asphalt Content of Cold Recycled Mixture Designs. American Association of State Highway and Transportation Officials: Washington, DC, USA, 2020.
  18. ASTM D6934-08(16); Standard Test Method for Residue by Evaporation of Emulsified Asphalt. ASTM International: West Conshohocken, PA, USA, 2016.
  19. ASTM D6933-18; Standard Test Method for Oversize Particles in Emulsified Asphalts (Sieve Test). ASTM International: West Conshohocken, PA, USA, 2018.
  20. ASTM D7226-13(17); Standard Test Method for Determining the Viscosity of Emulsified Asphalts Using a Rotational Paddle Viscometer. ASTM International: West Conshohocken, PA, USA, 2017.
  21. ASTM C702/C702M-18; Standard Practice for Reducing Samples of Aggregate to Testing Size. ASTM International: West Conshohocken, PA, USA, 2018.
  22. ASTM D6931-17; Standard Test Method for Indirect Tensile (IDT) Strength of Asphalt Mixtures. ASTM International: West Conshohocken, PA, USA, 2017.
  23. Casillas, S.; Braham, A. Quantifying effects of laboratory curing conditions on workability, compactability, and cohesion gain of cold in-place recycling. Road Mater. Pavement Des. 2021, 22, 2329–2351. [Google Scholar] [CrossRef]
  24. Horiba Ltd. Laser Scattering Particle Size Distribution Analyzer LA-350 Instruction Manual; Horiba Ltd.: Kyoto, Japan, 2016; pp. 143–144. [Google Scholar]
Figure 1. Horiba LA-350 laser diffraction particle size analyzer with asphalt emulsion sample dispersed in distilled water (a), and a typical PSA curve with size labels (b).
Constrmater 05 00026 g001
Figure 2. DST apparatus (a); loading diagram in vertical cross-section perpendicular to CMA specimen faces (b); and a typical load–displacement curve (c).
Constrmater 05 00026 g002
Figure 3. Rotational paddle viscosity over study duration. Error bars indicate one standard deviation above and below average test result.
Constrmater 05 00026 g003
Figure 4. Particle size distribution of CSS-1, each label representing the metric, day of testing, and particle diameter.
Constrmater 05 00026 g004
Figure 5. Particle size distribution of CSS-1H, each label representing the metric, day of testing, and particle diameter.
Constrmater 05 00026 g005
Figure 6. IDT strength for different assumed specimen heights.
Constrmater 05 00026 g006
Figure 7. IDT strength (average of three replicates) and standard deviation error of CSS-1 (a) and CSS-1H (b) emulsion. (Both emulsions are shown in each pane for comparison).
Constrmater 05 00026 g007
Figure 8. DST of CSS-1 and CSS-1H.
Constrmater 05 00026 g008
Figure 9. Performance test results vs median particle size.
Constrmater 05 00026 g009
Table 1. Particle size distribution metrics (μm).
Test DayMetricStandard Deviation a
MeanS.D. bModed10d50d90Span cMeanS.D. bd50Span c
CSS-1 Emulsion
13.321.842.561.472.845.841.550.190.020.250.14
23.511.922.931.553.046.121.500.140.060.140.03
43.491.863.051.573.056.031.460.070.030.070.00
75.0010.53.181.623.166.281.472.6015.110.150.07
113.221.842.471.402.725.761.610.210.010.270.14
152.891.432.351.432.544.841.350.360.140.360.06
183.361.812.681.512.915.841.490.130.030.150.04
253.531.863.181.593.096.071.450.020.010.010.00
323.291.802.431.472.835.761.510.020.030.020.03
393.831.843.651.853.456.331.300.090.250.040.16
463.841.853.651.853.466.341.300.090.270.040.17
603.701.893.671.653.316.281.400.120.080.150.03
743.401.613.191.633.075.621.300.040.030.040.01
1213.481.583.491.723.195.651.220.410.350.310.14
1413.741.813.651.783.386.201.310.020.150.080.11
1683.341.563.181.653.025.501.280.020.010.030.01
1843.741.843.641.763.366.261.340.020.010.020.00
CSS-1H Emulsion
16.283.056.292.705.8610.41.310.080.040.080.02
26.283.066.292.695.8610.41.320.080.040.070.02
46.333.106.302.685.9010.51.320.020.020.030.01
76.262.976.292.755.8610.31.280.060.100.080.06
115.933.246.282.145.4510.31.490.080.010.060.01
156.263.016.292.705.8510.31.300.030.030.030.02
186.103.086.282.465.6810.21.370.100.020.100.03
256.103.086.282.465.6810.21.370.100.020.100.03
326.103.076.282.465.6810.21.370.100.020.100.04
396.263.006.292.715.8510.31.300.030.010.030.01
466.372.806.293.105.9810.11.180.140.050.130.01
606.183.046.292.575.7710.31.340.050.020.050.01
746.293.006.292.725.8910.31.290.020.010.020.01
1216.362.946.292.905.9710.31.240.060.070.040.03
1417.153.607.182.996.5912.01.360.520.300.470.03
1686.242.856.282.875.8710.01.220.050.010.050.01
1846.382.936.302.935.9910.31.240.050.030.040.01
a Standard deviation between the result of the three analytical samplings. b S.D.—standard deviation from the mean. c Span is unitless.
Table 2. Recommended requirements for cationic emulsified asphalt.
TypeRapid-Setting a
CRS-2CRS-2LCRS-2P
GradeMinMaxMinMaxMinMax
Tests on emulsified asphalt:
  Median particle size (d50), μm 1.9 3.0 10.7
Or
  Modal particle size, μm 1.6 2.9 9.4
  d10, μm 1.1 1.6 2.1
  d90, μm 2.8 4.9 24.9
  Span 1.0 1.2 2.9
a Recommended, with findings from Diaz-Romero and Braham (2022) [15].
Table 3. Recommended requirements for cationic emulsified asphalt.
TypeMedium-
Setting
Slow-Setting
CMS-2 bCSS-1CSS-1H
GradeMinMaxMinMaxMinMax
Tests on emulsified asphalt:
  Median particle size (d50), μm 6.9 4.4 b 6.0
Or
  Modal particle size, μm 3.6 6.3
  d10, μm 3.2 2.4 b 3.0
  d90, μm 6.0 10.4
  Span 1.6 1.4
b Recommended, with findings from Kiihnl and Braham (2021) [14].
Disclaimer/Publisher’s Note: The statements, opinions and data contained in all publications are solely those of the individual author(s) and contributor(s) and not of MDPI and/or the editor(s). MDPI and/or the editor(s) disclaim responsibility for any injury to people or property resulting from any ideas, methods, instructions or products referred to in the content.

