Article

Monitoring of Corrosion in Reinforced E-Waste Concrete Subjected to Chloride-Laden Environment Using Embedded Piezo Sensor

Department of Civil Engineering, Sharda University, Greater Noida 201310, India
*
Author to whom correspondence should be addressed.
Constr. Mater. 2025, 5(3), 46; https://doi.org/10.3390/constrmater5030046
Submission received: 13 May 2025 / Revised: 24 June 2025 / Accepted: 12 July 2025 / Published: 16 July 2025

Abstract

This study explores the use of embedded piezo sensor (EPS) employing the Electro-Mechanical Impedance (EMI) technique for real-time corrosion monitoring in reinforced E-waste concrete exposed to chloride-laden environments. With the growing environmental concerns over electronic waste (E-waste) and the demand for sustainable construction practices, printed circuit board (PCB) materials were incorporated as partial replacements for coarse aggregates in concrete. The experiment utilized M30-grade concrete mixes, substituting 15% of natural coarse aggregates with E-waste, aiming to assess both sustainability and structural performance without compromising durability. EPS configured with Lead Zirconate Titanate (PZT) patches were embedded into both conventional and E-waste concrete specimens. The EPS monitored the changes in the form of conductance and susceptance signatures across a 100–400 kHz frequency range during accelerated corrosion exposure over a 60-day period in a 3.5% NaCl solution. The corrosion progression was evaluated qualitatively through electrical impedance signatures, visually via rust formation and cracking, and quantitatively using the Root Mean Square Deviation (RMSD) of EMI signatures. The results showed that the EMI technique effectively captured the initiation and propagation stages of corrosion. E-waste concrete exhibited earlier and more severe signs of corrosion compared to conventional concrete, indicated by faster increases and subsequent declines in conductance and susceptance and higher RMSD values during the initiation phase. The EMI-based system demonstrated its capability to detect microstructural changes at early stages, making it a promising method for Structural Health Monitoring (SHM) of sustainable concretes. The study concludes that while the use of E-waste in concrete contributes positively to sustainability, it may compromise long-term durability in aggressive environments. However, the integration of EPS and EMI offers a reliable, non-destructive, and sensitive technique for real-time corrosion monitoring, supporting preventive maintenance and improved infrastructure longevity.

1. Introduction

Steel is the crucial component of reinforced cement concrete (RCC), which provides the necessary tensile strength, durability, and structural integrity to every RCC structure. However, it is susceptible to corrosion from threatening agents such as chloride ions, carbon dioxide, and moisture, which can cause cracking, spalling, and eventual structural failure [1]. During corrosion, threatening agents penetrate the concrete cover and break down the protective oxide layer around the steel reinforcement, which had formed naturally due to the high alkalinity (pH ~12.5–13.5) of the concrete to block corrosion [2]. Steel reinforcement inside the concrete becomes vulnerable to corrosion once this protective layer is compromised and rusting starts to take place, occupying a larger volume than the original steel. This volumetric expansion causes cracks in the concrete cover due to internal tensile stresses inside the concrete. The crack formation not only spoils the aesthetics but also reduces the load-bearing capacity and service life of the whole concrete structure [3]. In conventional RCC, numerous factors can contribute to faster corrosion, such as poor-quality materials, insufficient cover thickness, inadequate density, and exposure to harsh environmental conditions, which include marine atmospheres and industrial environments [4]. Since early-stage corrosion does not show visible signs on the surface of the concrete, it often remains undetected until significant damage to the whole structure. This results in considerable repair costs and reduced service life and presents a substantial challenge for infrastructure longevity, particularly in regions with high exposure to corrosive environments. Furthermore, rapid urbanization and infrastructure development have greatly accelerated the global demand for concrete, which has led to a significant depletion of natural raw materials for making conventional concrete. Consequently, the increasing scarcity of natural raw materials has posed economic and environmental challenges, prompting researchers and industry professionals to seek sustainable alternatives. Various researchers have focused on a sustainable approach to providing an alternative to traditional RCC by investigating the feasibility of utilizing waste materials in concrete and producing sustainable concrete with a comparable strength to normal RCC. One of the waste materials rapidly gaining attention for utilization in concrete is E-waste, due to its drastic increase in the last few years. The E-waste data from 2017 to 2021 revealed a huge gap in the growth of E-waste generation and E-waste processing in India. As per the data, 708,445 tons of E-waste were generated in 2017–18 and 1,346,496 tons in 2020–21, but only 69,413.61 tons of E-waste were processed in 2017–18, and the same pattern was followed: only 354,540.7 tons of E-waste were processed in 2020–21 [5]. E-waste contains discarded, broken, or obsolete electrical or electronic devices, such as old laptops, cell phones, TVs, printers, refrigerators, and other electronic equipment that are no longer in use or have become outdated [6]. Researchers have utilized components from E-waste, including printed circuit boards (PCBs), plastics, and glass, which pose a significant environmental challenge due to their complex composition, hazardous nature, and low recyclability [7,8,9,10]. The influence of E-waste as a partial replacement of natural coarse aggregate on both fresh and hardened concrete properties are investigated by Ullah et al. [11] They found that the compressive and tensile strength of E-waste concrete reduced in the range of 6.3 to 17.1% and 23.5 to 32.4%, respectively, for replacement ratios of 10–20%; however, the workability and durability properties are improved. The effect of E-waste on concrete during combined loading using piezo sensors was investigated by Kumar et al. [12] and found that E-waste concrete shows higher initial deterioration than conventional concrete. The corrosion behavior of reinforced E-waste concrete was investigated by Naidu and Sofi [13]; however, the method utilized by this study does not provide real-time monitoring of E-waste concrete. Methods such as Half-Cell Potential (HCP), electrochemical impedance spectroscopy (EIS), galvanostatic pulse technique (GPT), and linear polarization resistance (LPR) can provide valuable insights into the possibility and extent of corrosion within concrete structures [14]. Half-Cell Potential is limited by its inability to detect internal or early-stage corrosion and is mainly effective on exposed surfaces. It provides only intermittent data and may cause surface damage. GPT and LPR require direct contact with concrete and are less effective at early-stage corrosion detection. LPR, in particular, may not detect all corrosion types and has limited resolution, offering only numeric values. Both techniques can potentially damage the structure during testing and focus solely on corrosion rates, lacking comprehensive structural health monitoring capabilities. Also, a significant challenge associated with these methods lies in their capability to assess the corrosion rate in real-time without causing any damage to the structure. EIS requires an electrolyte environment and has slower, more complex measurements, making it less suitable for real-time or in situ monitoring. In contrast to the above techniques, modern researchers have employed more advanced vibration-based SHM techniques such as Electro-Mechanical Impedance (EMI) for real-time corrosion monitoring [15,16]. EMI offers a more efficient and reliable alternative due to its exceptional sensitivity to structural changes and ability to provide real-time data and non-destructive evaluation without any labor-intensive work [17]. The EMI technique utilizes piezoelectric sensors (like the smart probe-based sensor) to detect changes in the electrical admittance signatures of the structure. These signatures reflect variations in equivalent stiffness, mass, and damping, which are affected by corrosion progression. EMI can also identify the different stages of corrosion, i.e., initiation stage, propagation stage, and cracking stage, by analyzing shifts in the conductance and susceptance of the structural signatures over time [18]. So, by continuously monitoring changes in the admittance signatures, the EMI method can provide insights into the underlying damage mechanisms, helping to understand how corrosion affects E-waste concrete. This study utilizes the EMI technique for real-time corrosion monitoring of the reinforced E-waste concrete made with 15% PCBs. The quantification of the EMI signatures was carried out by determining the root mean square deviation (RMSD). Furthermore, gravimetric mass loss analysis has been performed to determine the mass loss after corrosion exposure.

2. Methodology

The methodology to assess the corrosion behavior of E-waste is carried out in three phases. In the first phase, the Lead Zirconate Titanate (PZT) patch configuration is performed to make an embedded Piezo sensor (EPS). Secondly, E-waste and CC samples are prepared with EPS. Lastly, monitoring and data accumulation are carried out to check the corrosion resistance of E-waste in a chloride-laden environment.

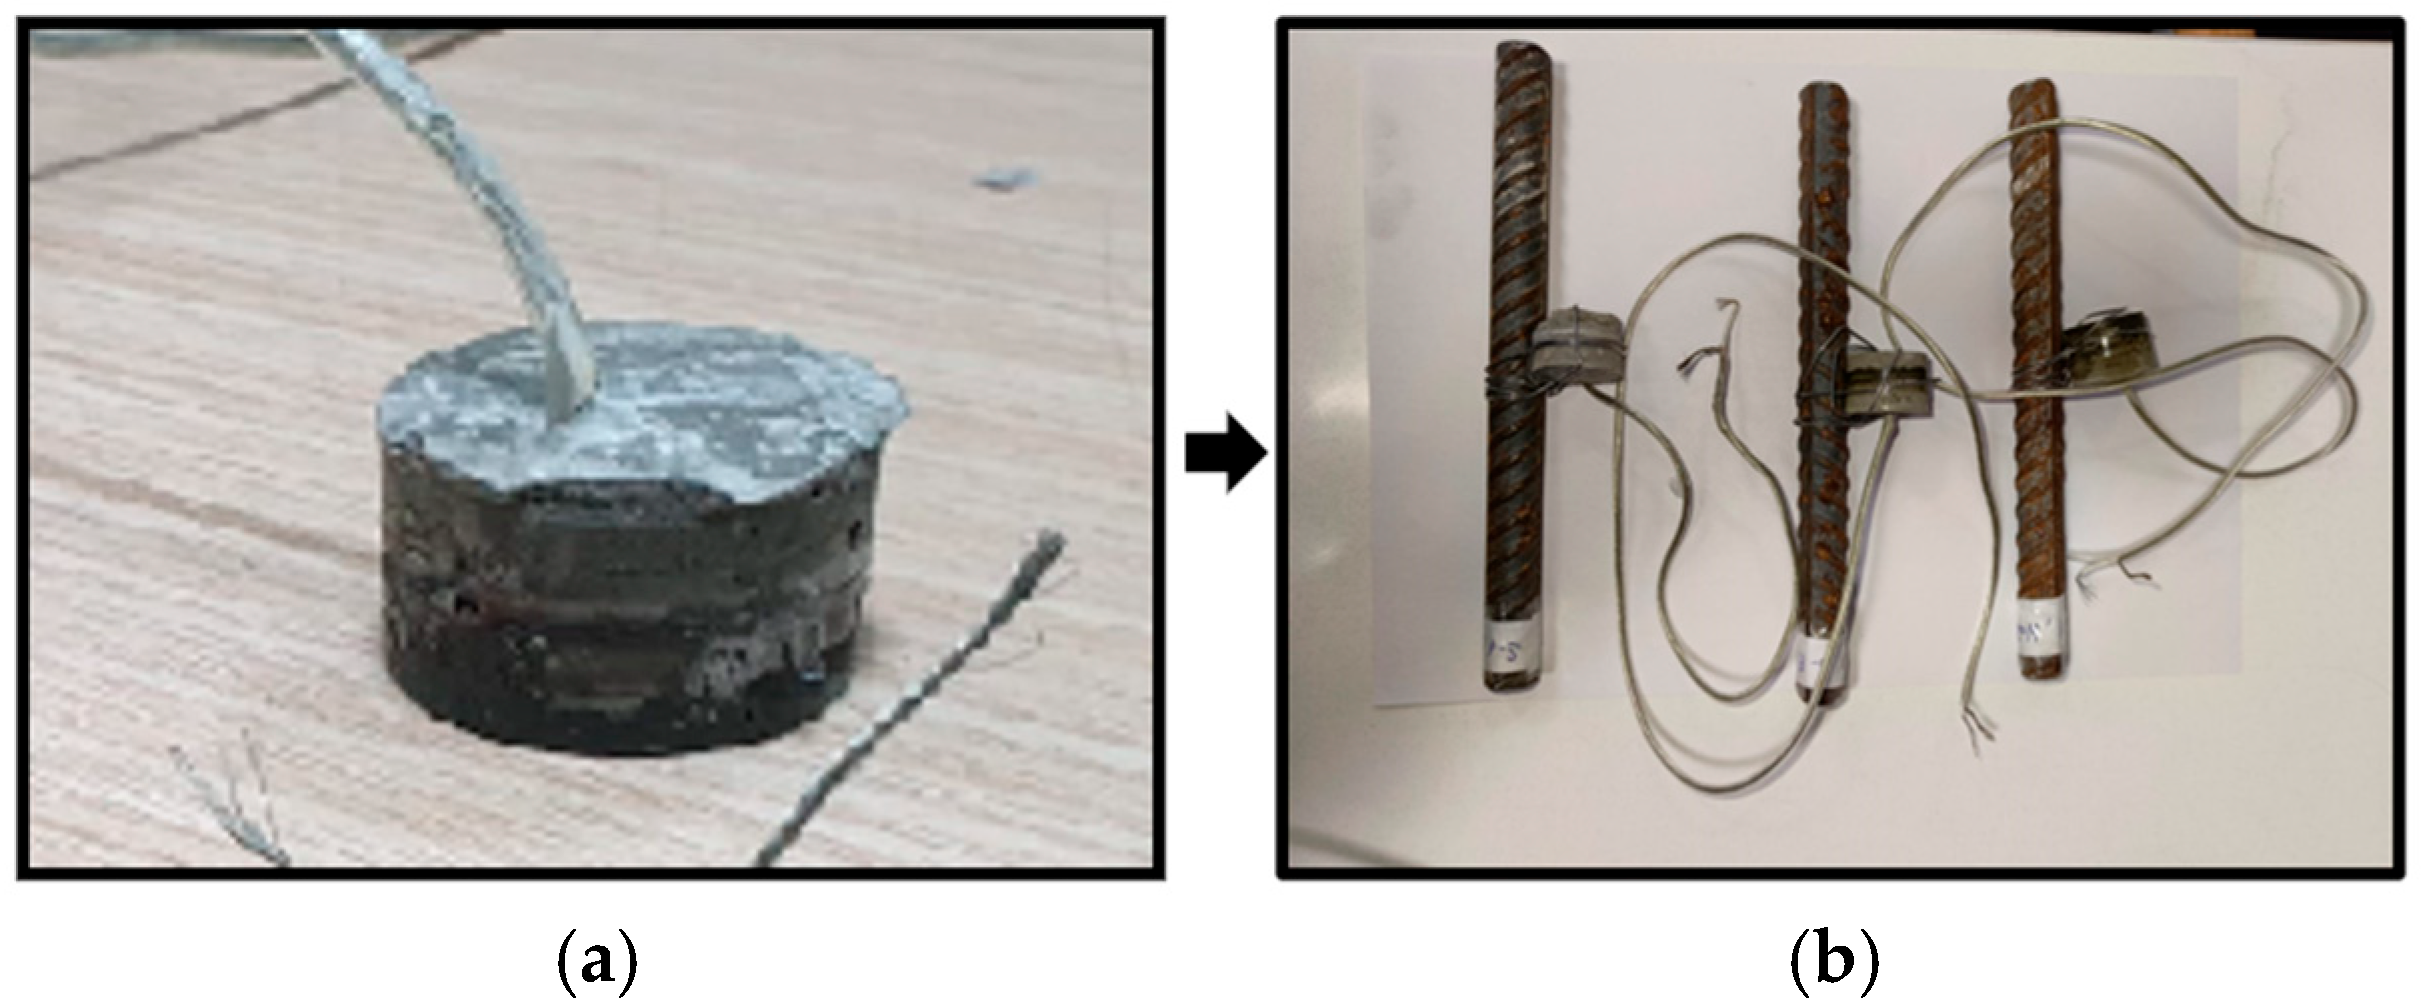
2.1. Preparation of Embedded Piezo Sensor (EPS)

In this study, a PZT patch that measured 10 mm × 10 mm × 0.2 mm of grade PZT 5H was used to construct EPS. Firstly, a coaxial wire was attached to the PZT. Then, to make EPS more durable and waterproof, it was positioned between a layers of mortar and a layers of epoxy. This coating of EPS acts as a protective barrier to the PZT patch, which safeguards the PZT patch from moisture and other external factors that could affect its reliability and accuracy. This configuration safeguards the patch from curing and external environmental conditions. This cost-effective vibration measurement sensor was especially developed in the Smart Structures and Dynamics and Laboratory (SSDL), IIT Delhi [19], by Bhalla and Gupta [20]. Then, this EPS was attached to a steel bar of 16 mm diameter and 150 mm length, as shown in Figure 1b [21,22,23].

2.2. Electro-Mechanical Impedance (EMI) Technique

EMI is a non-destructive structural health monitoring (SHM) technique that can also be used to monitor corrosion in reinforced concrete structures [24,25] and also in the various applications of SHM, including monitoring of the bond zone mechanism between reinforced steel and concrete [26], combined effect of impact and temperature loading [27], impact loading [28], fatigue loading [29], bonding and debonding [30], and strength monitoring of cementitious and concrete [31,32,33,34,35]. It uses the principle of the electro-mechanical coupling to detect damage in concrete and monitor structural health. The PZT sensor in EMI acts as a transducer that detects the changes within the structure by converting them into electrical signals. This PZT patch can either be attached to the surface of the structure or embedded into the structure; it will identify the changes in the structure for SHM [36].
For this study, the PZT patch in the form of EPS attached with a steel bar of 16 mm × 150 mm diameter was embedded in the E-waste concrete sample. For corrosion monitoring, an LCR Inductance (L), Capacitance (C), and Resistance (R) meter was used to apply an input voltage ranging from 30 to 500 kHz for the PZT transducer. By applying this voltage, mechanical vibrations are induced in the concrete sample by the converse piezoelectric effect. Subsequently, the resulting mechanical vibrations are transmitted back to the PZT transducer generated by the direct piezoelectric effect. Then, this signal is measured using an LCR meter or impedance analyzer, which records the electrical impedance, including inductance, capacitance, and resistance. By measuring and analyzing the variation in the electrical impedance and the mechanical admittance of samples, EMI sensing is carried out. The changes that occur in the electrical impedance over time indicate the change in the structural properties. This change is due to stiffness, cracks, or any type of deterioration and damage. One of the key strengths of the EMI technique is its ability to detect both localized (pitting) and uniform corrosion, which makes it particularly suitable for complex concrete compositions like E-waste concrete [37]. Thus, the variation in this electro-mechanical admittance over time is indicative of a change in the mechanical properties of the structure. Since the mechanical impedance of the structure affects the electrical impedance of the patch, any change in the mechanical impedance can be detected by the patch, as will be described in the equation below [38].
Y ¯ = G + B j = 4 ω j l 2 h ε 33 T ¯ 2 d 31 2 Y E ¯ ( 1 ν ) + 2 d 31 2 Y E ¯ ( 1 + ν ) Z a , e f f Z s , e f f + Z a , e f f T ¯
G is conductance, B is susceptance, and j is the imaginary number. w, l, and h are the width, length, and height of the PZT patch, while ω is the angular frequency. Z s , e f f and Z a , e f f are the effective impedance of the structure and the PZT sensor, respectively, Y E is the complex Young’s modulus of the PZT patch while ε 33 T is the electrical permittivity of the PZT material. d 31 stands for the piezoelectric strain coefficient and the complex tangent ratio is symbolized by T - . Lastly, Poisson’s ratio is symbolized by ν . To quantify the signatures, various statistical parameters can be used to measure changes in the raw conductance signatures. In this study, statistical parameters such as RMSD were employed to identify changes in the signatures during the curing period across different sub-frequency ranges. The RMSD of the conductance signatures are calculated here for strength quantification, as outlined below.
R M S D ( % ) = i = 1 N ( G i G b l ) 2 i = 1 N ( G b l ) 2 × 100
where Gi represents the data points of conductance signature during corrosion exposure, Gbl denotes the baseline data, and N is the number of data points in the conductance signature.

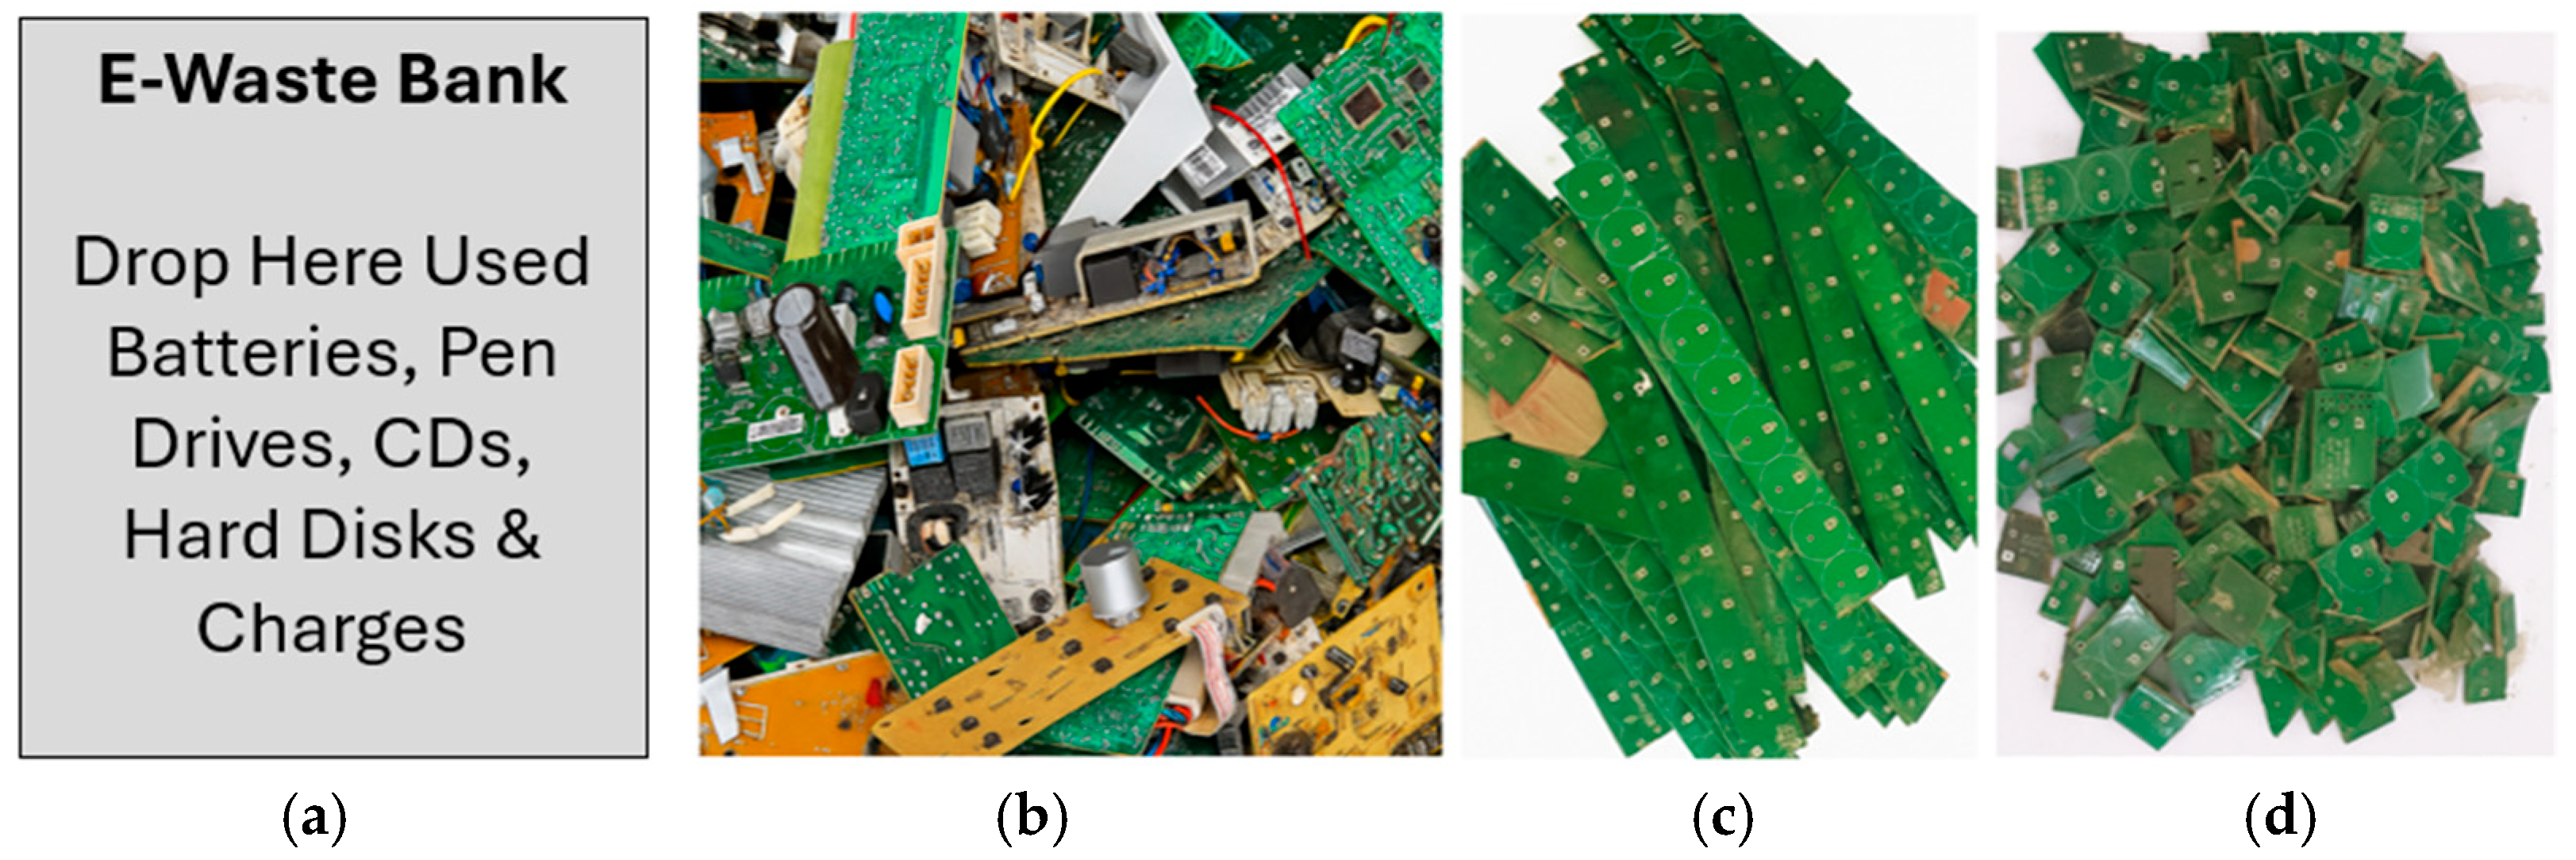
2.3. Preparation of E-Waste Material and Mix Design Details

The material used for this study is conventional concrete (CC) of M30 grade and E-waste concrete of M30 grade. The E-waste utilized in this study consisted of non-metallic fractions of printed circuit boards (PCBs), which is recovered from end-of-life electronic devices such as computers and mobile phones. The source of the E-waste was the E-waste Collection Bank established on the college campus, an institutional initiative aimed at promoting sustainable electronic waste management and raising environmental awareness. From the variety of components collected, only PCBs were selected for use in the experimental study owing to their structural compatibility with coarse aggregates and absence of metallic hazards after processing. The remaining E-waste, including metallic parts and components unsuitable for concrete applications, was donated to an E-waste recycling agency.
Initially, the electronics components including resistors, capacitors, integrated circuits (ICs), and soldered metallic pathways were manually removed using mechanical tools such as pliers, scrapers, and de-soldering irons from the PCBs. After removal, the bare PCBs were subjected to a multi-stage cleaning procedure designed to remove surface contaminants, adhesives, and chemical residues. The cleaned PCBs were air-dried and then oven-dried at 105 ± 5 °C for 24 h to remove any residual moisture. The fully dried PCBs were then mechanically shredded into angular fragments resembling coarse aggregate as shown in Figure 2. The shredded size of E-waste is 20 mm. This size was selected to match the gradation and physical behavior of conventional coarse aggregates, ensuring good packing density, interlock, and uniform distribution within the concrete mix.
In both CC and E-waste concrete, the same kind of fine aggregates with a specific gravity of 2.64, water absorption of 1–2%, and a bulk density of 1730 kg/m3 were utilized. In the case of coarse aggregates, natural coarse aggregates were of the maximum size of 20 mm with a specific gravity of 2.64 in both CC and E-waste. However, by replacing the coarse aggregates with 15% of PCB in CC, E-waste concrete was prepared, with a lower specific gravity of 2.53. As replacing 15% of aggregates serves the purpose of sustainability, the highest amount of waste is included in the concrete matrix without compromising the strength of the concrete [39]. The water-to-cement ratio was kept consistent between both mixes, ranging from 0.45 to 0.55. It was noted that the slump for the E-waste concrete is slightly higher at 90 mm compared to 85 mm for the CC, indicating improved workability. Additionally, the initial and final setting times were longer for the E-waste concrete, at 60 and 720 min, respectively, versus 50 and 693 min for CC. These differences in the properties of the material used could influence the corrosion behavior of the CC and E-waste concrete, with variations in water absorption and setting times potentially making an impact. The mix proportion for both the concrete is shown in Table 1 [12,23].

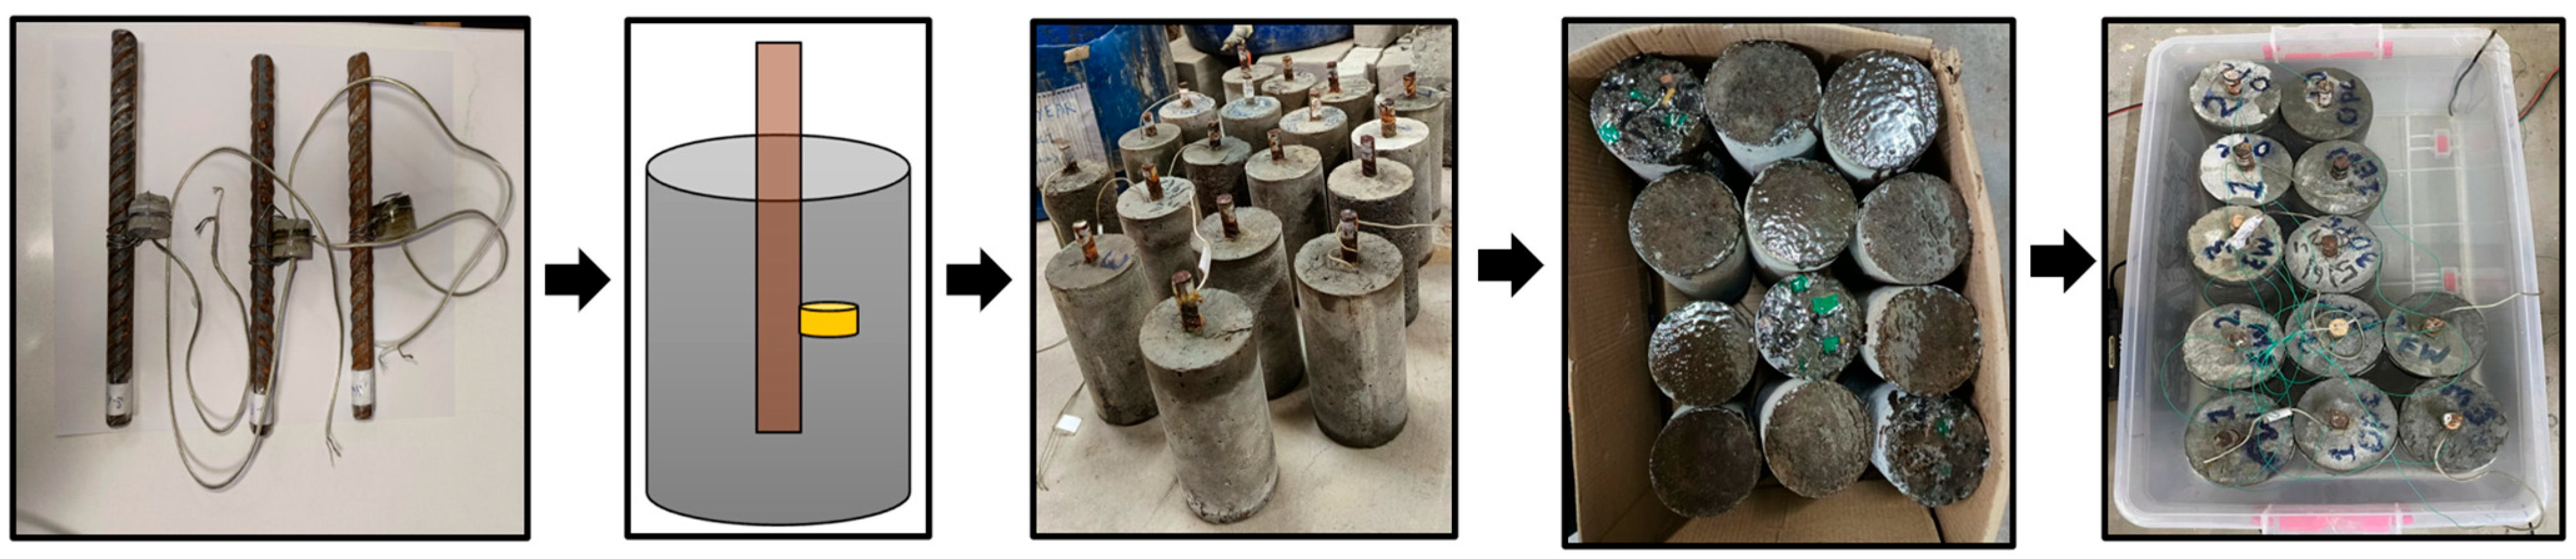
2.4. Sample Preparation

The next step involves integrating the steel bar embedded with the PZT patch into both CC and E-waste concrete samples. Firstly, the concrete mix is prepared using Table 1 to ensure uniformity and consistency. Cylindrical molds with a diameter of 100 mm and a depth of 200 mm are used for casting both CC and E-waste concrete samples. A release agent is applied to the mold surfaces to facilitate easy removal after curing. The EPS was securely attached to the steel bar of 150 mm in length and 16 mm in diameter. After attachment, the EPS steel bar is carefully positioned vertically in the center of each mold, embedded to a depth of 100 mm, as shown in Figure 3. It was also ensured that the wires of the PZT patch were properly secured and extended outside the mold for data acquisition. To avoid disturbing the embedded steel bar and EPS, both CC and E-waste concrete are poured into layers and compacted using a vibrating table to eliminate air. After 28 days of curing under standard conditions of room temperature, the samples are demolded and inspected visually for surface cracks, voids, and any kind of other defects. The connectivity and functionality of the PZT patch of each sample are tested to confirm that the Patch remained undamaged during the embedding and curing processes and a baseline reading of each sample is taken. Using the above process, a total of 12 samples were prepared, comprising 6 samples of CC and 6 samples of E-waste concrete. Before placement in the chloride-induced environment, the base of each sample was sealed with a layer of epoxy to ensure that chloride attack during testing occurs only from the sides of the specimens [15,16]. The base of the samples is cleaned to remove any dust, moisture, or loose particles before the epoxy is applied evenly using a brush. To obtain a strong and durable seal, the epoxy coating is allowed to cure for 24 to 48 h at room temperature. Once sealed, the specimens are then immersed in a 3.5% NaCl brine solution to provide a chloride-laden environment. This solution is prepared by a ratio of dissolving 35 g of sodium chloride in 1 liter of distilled water. Then, all 12 samples of CC and E-waste that are only exposed from the sides are placed in the immersion tank filled with enough solution to be submerged in the chloride environment. All the specimens are carefully placed in the tank, and it is ensured that there is sufficient spacing between them to ensure uniform exposure to the brine solution. The monitoring of the setup is conducted on a daily basis to check if any cracks, damage, or deterioration have occurred. By using LCR meter, data from the EPS is collected and analyzed.

2.5. Experimental Setup and Corrosion Monitoring

The next step involves finalizing the electrochemical cell setup and commencing the testing phase to simulate and monitor the corrosion processes. To prepare the electrochemical cell setup, a copper rod is used as the cathode, while the steel bar embedded in the concrete acts as the anode. In the setup, the copper rod is carefully positioned to maintain sufficient spacing from the samples, prevent electrical interference, and ensure uniform exposure to the corrosive solution. To accelerate the corrosion process, a constant current is then applied across the anode (steel bar) and cathode (copper rod) using an impressed current through the anodic method [40,41], as shown in Figure 4a. During the corrosion progression, the EMI signatures of the samples are recorded and analyzed for 60 days with a data acquisition setup as shown in Figure 4c. This continuous monitoring of the samples not only enables a detailed understanding of the corrosion behavior of CC and E-waste samples but also validates the effectiveness of the PZT patch and EMI-based techniques for detecting and analyzing electrochemical activities.

3. Results and Discussion

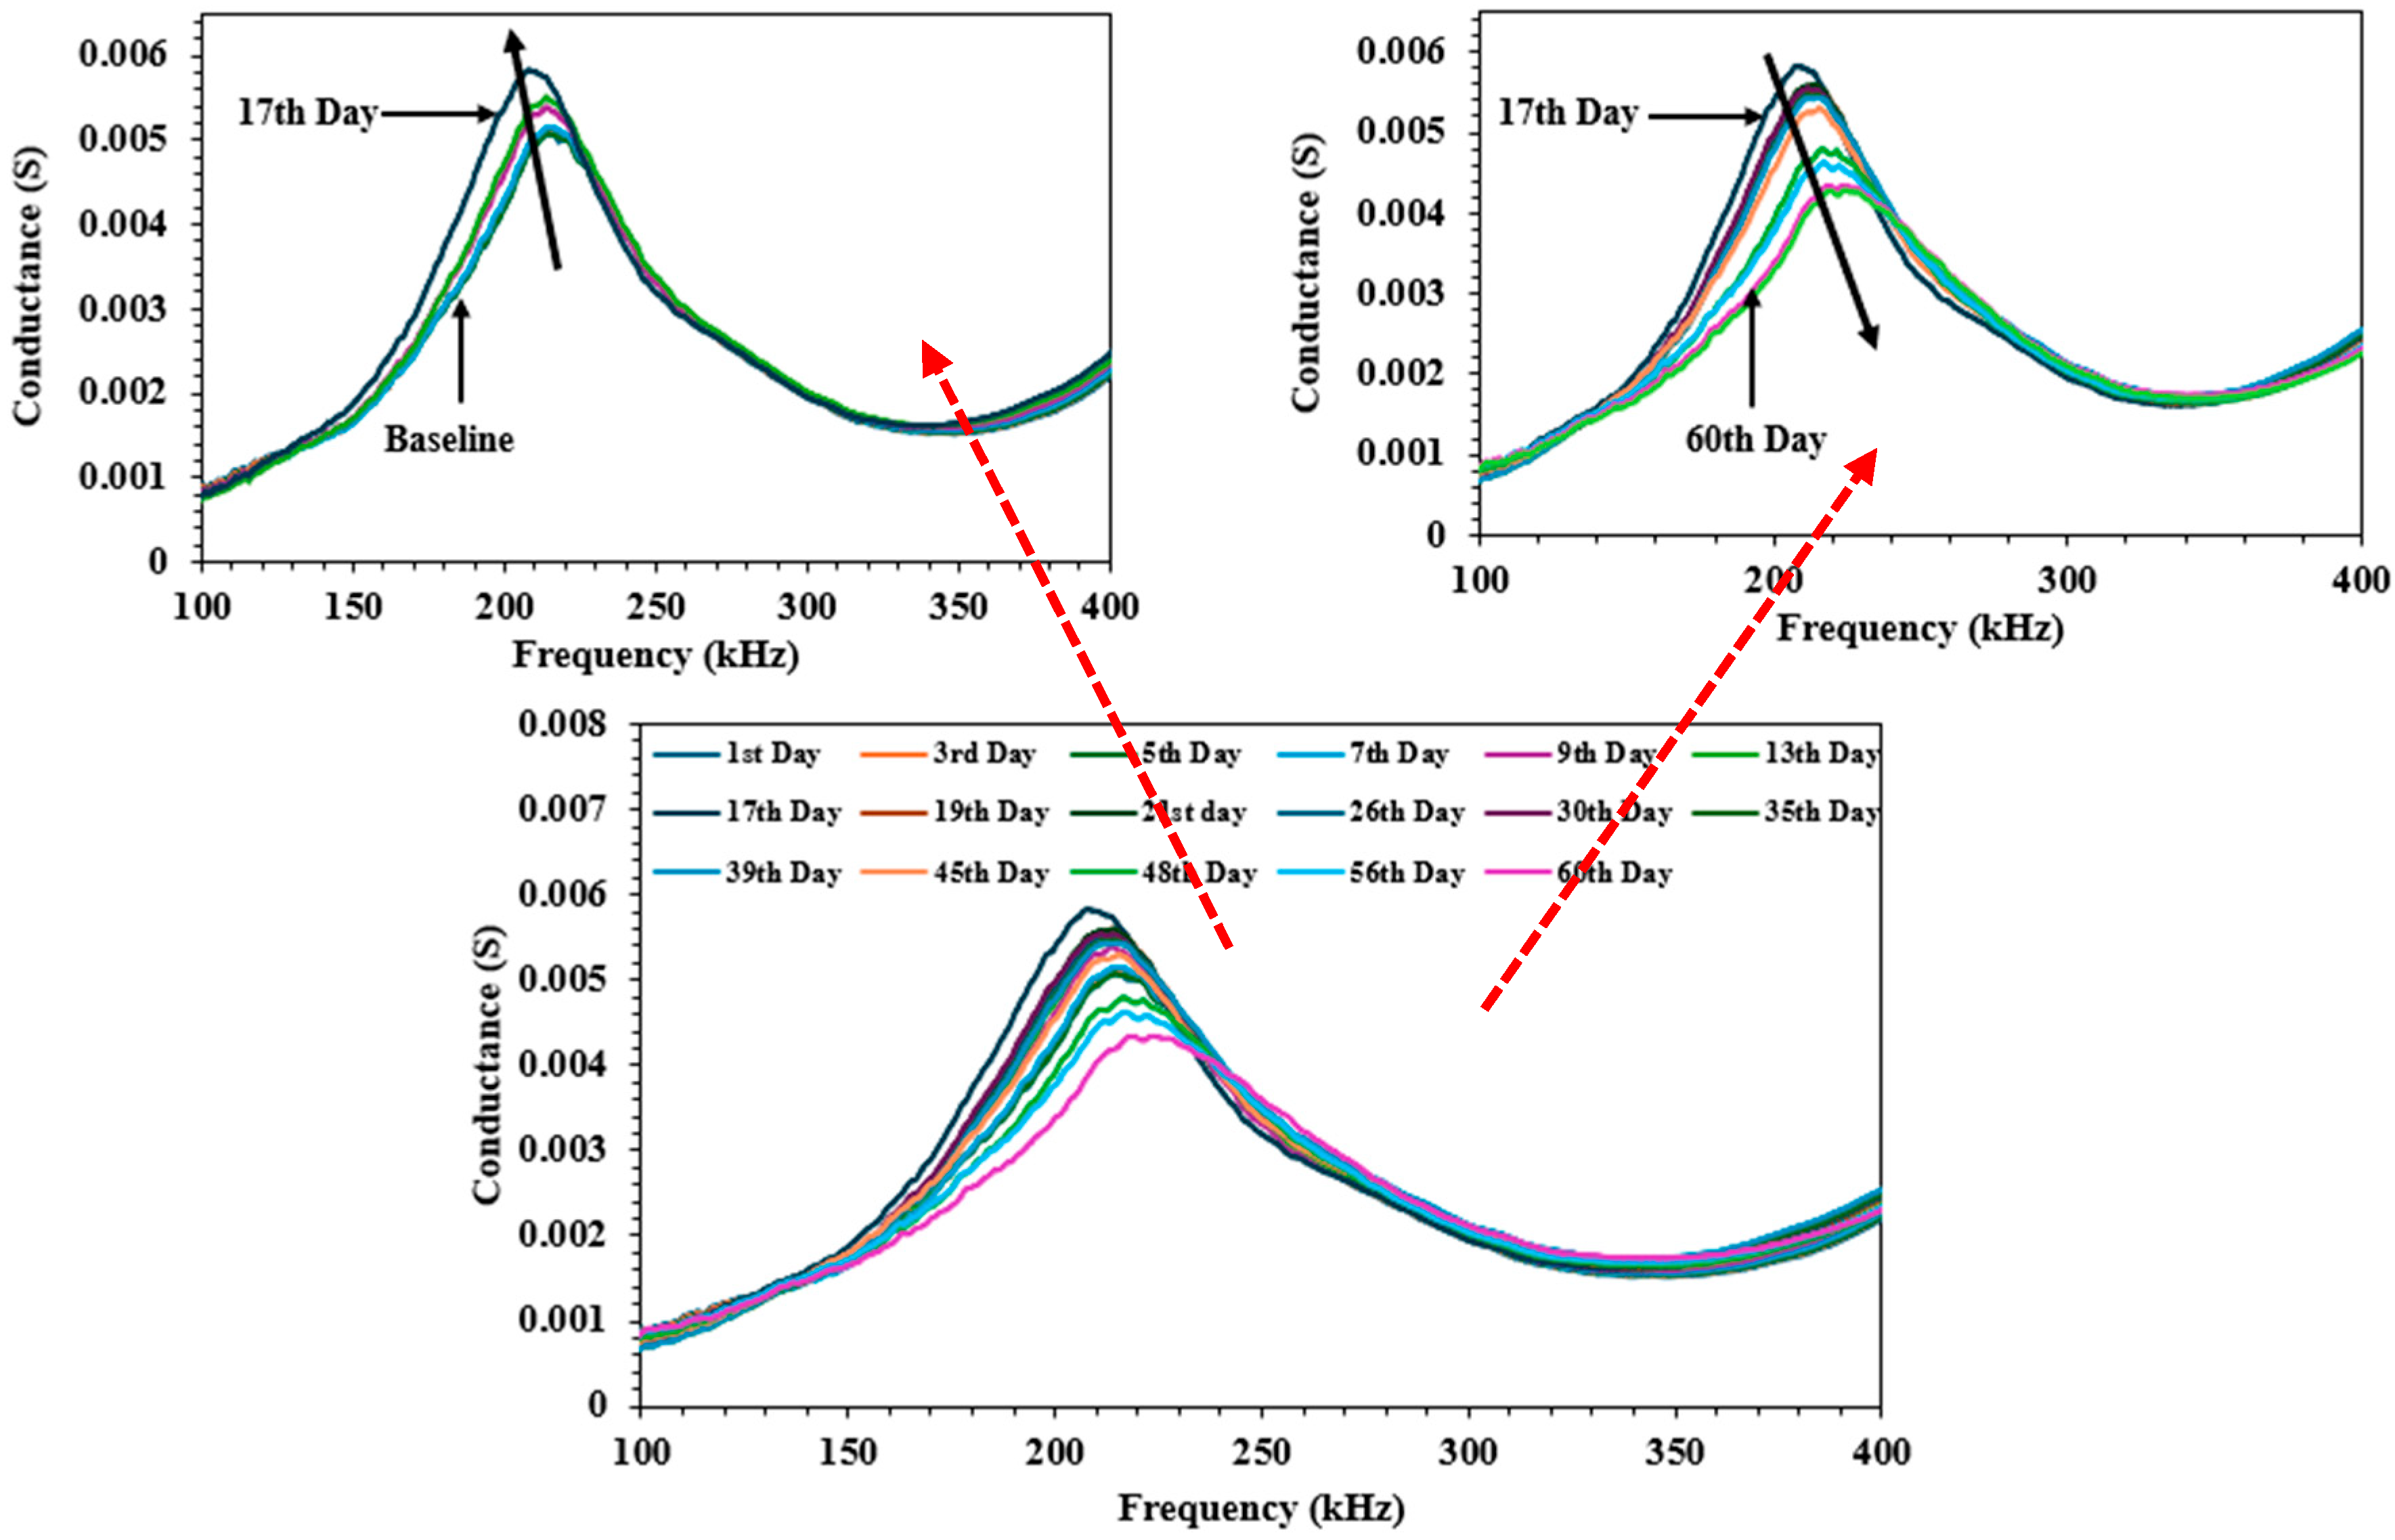
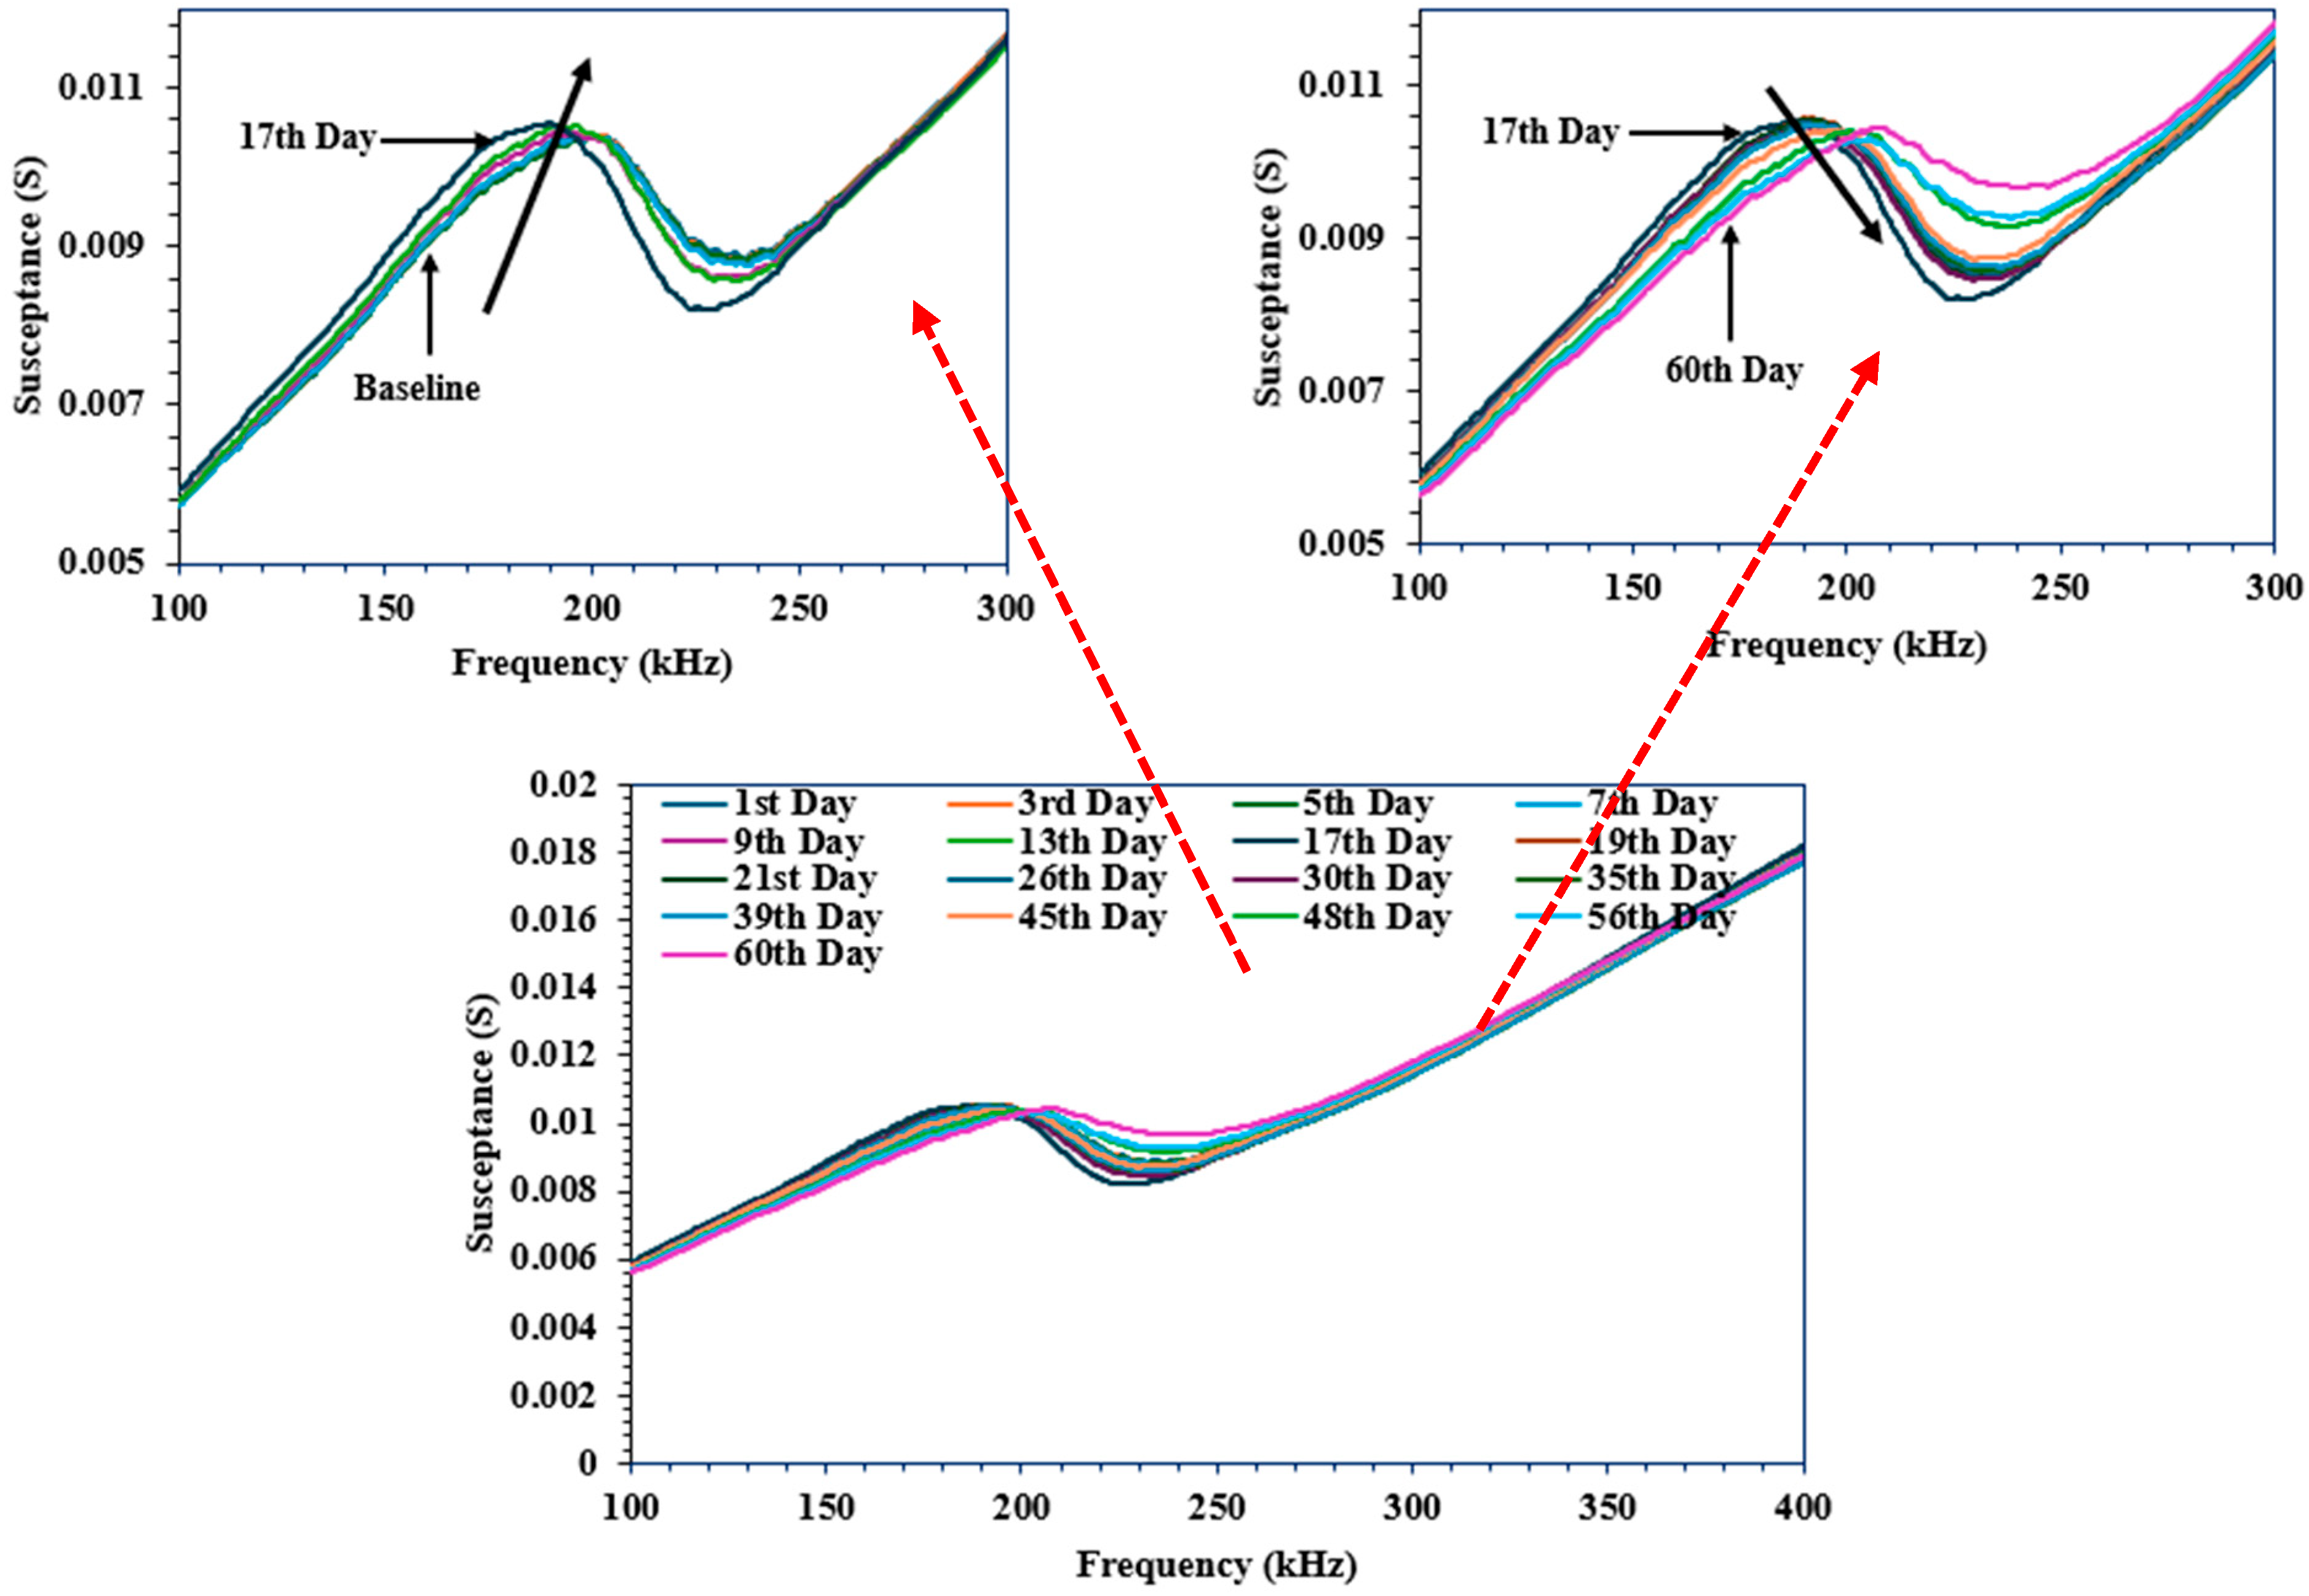
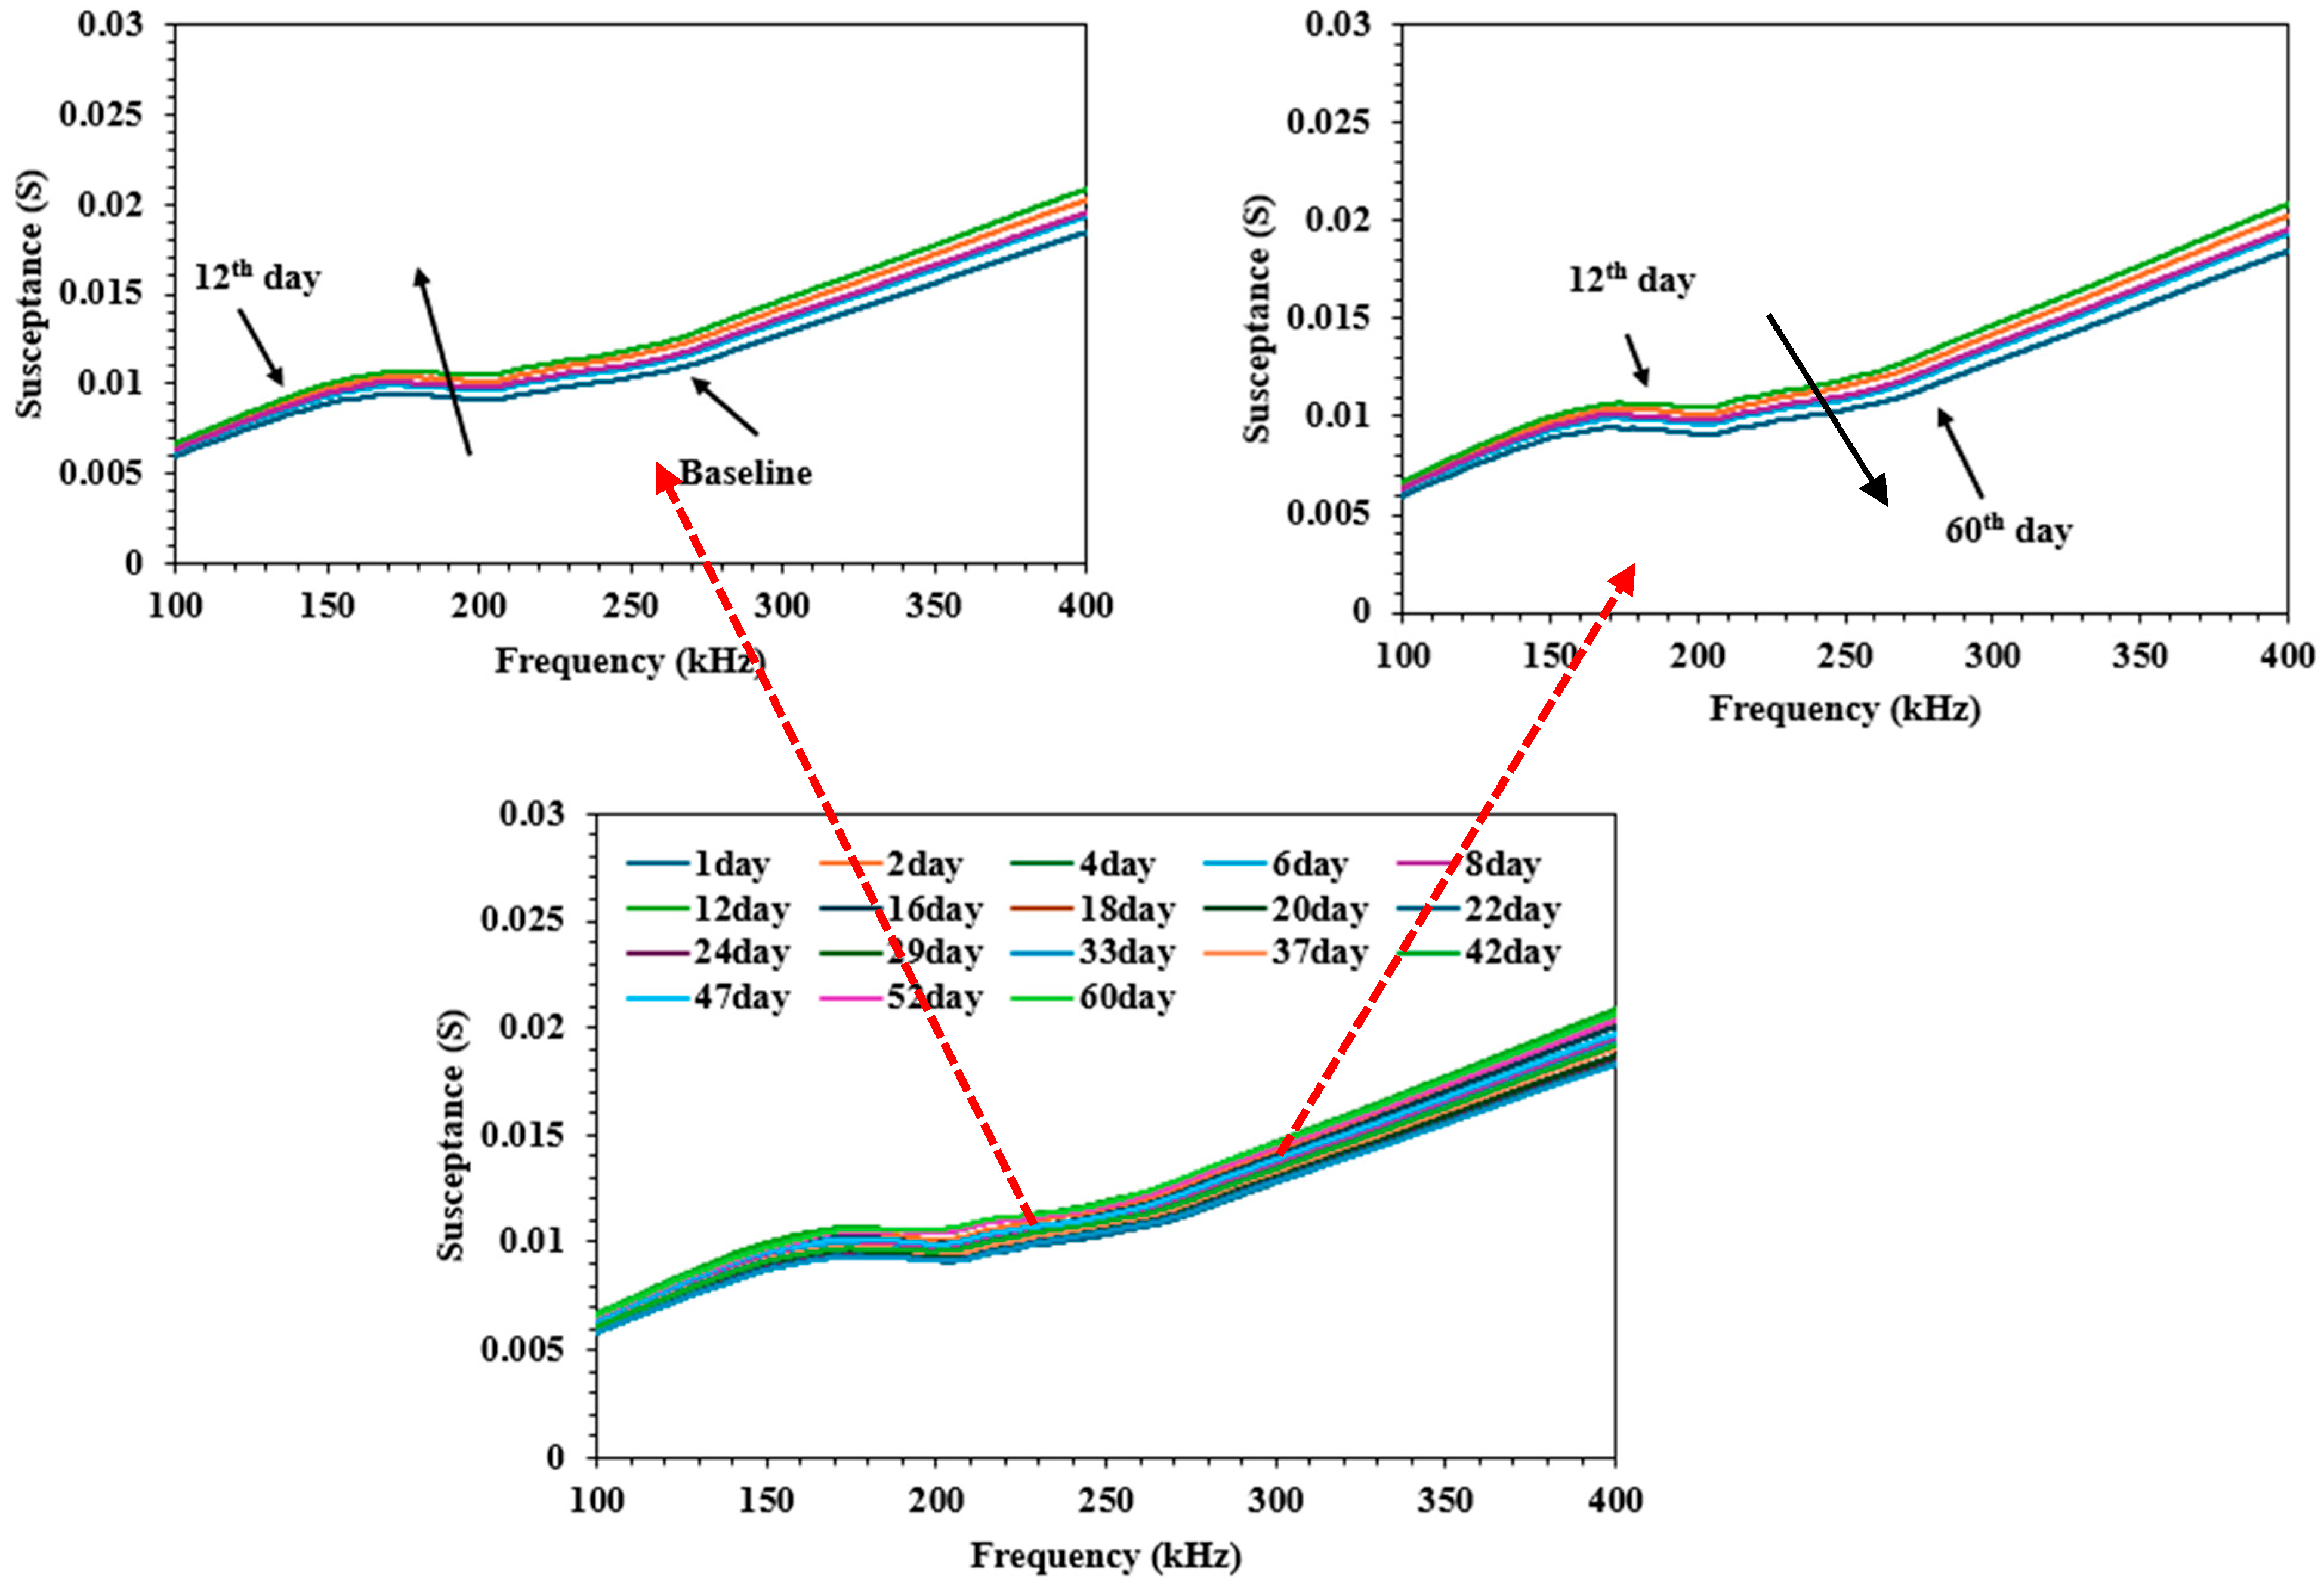
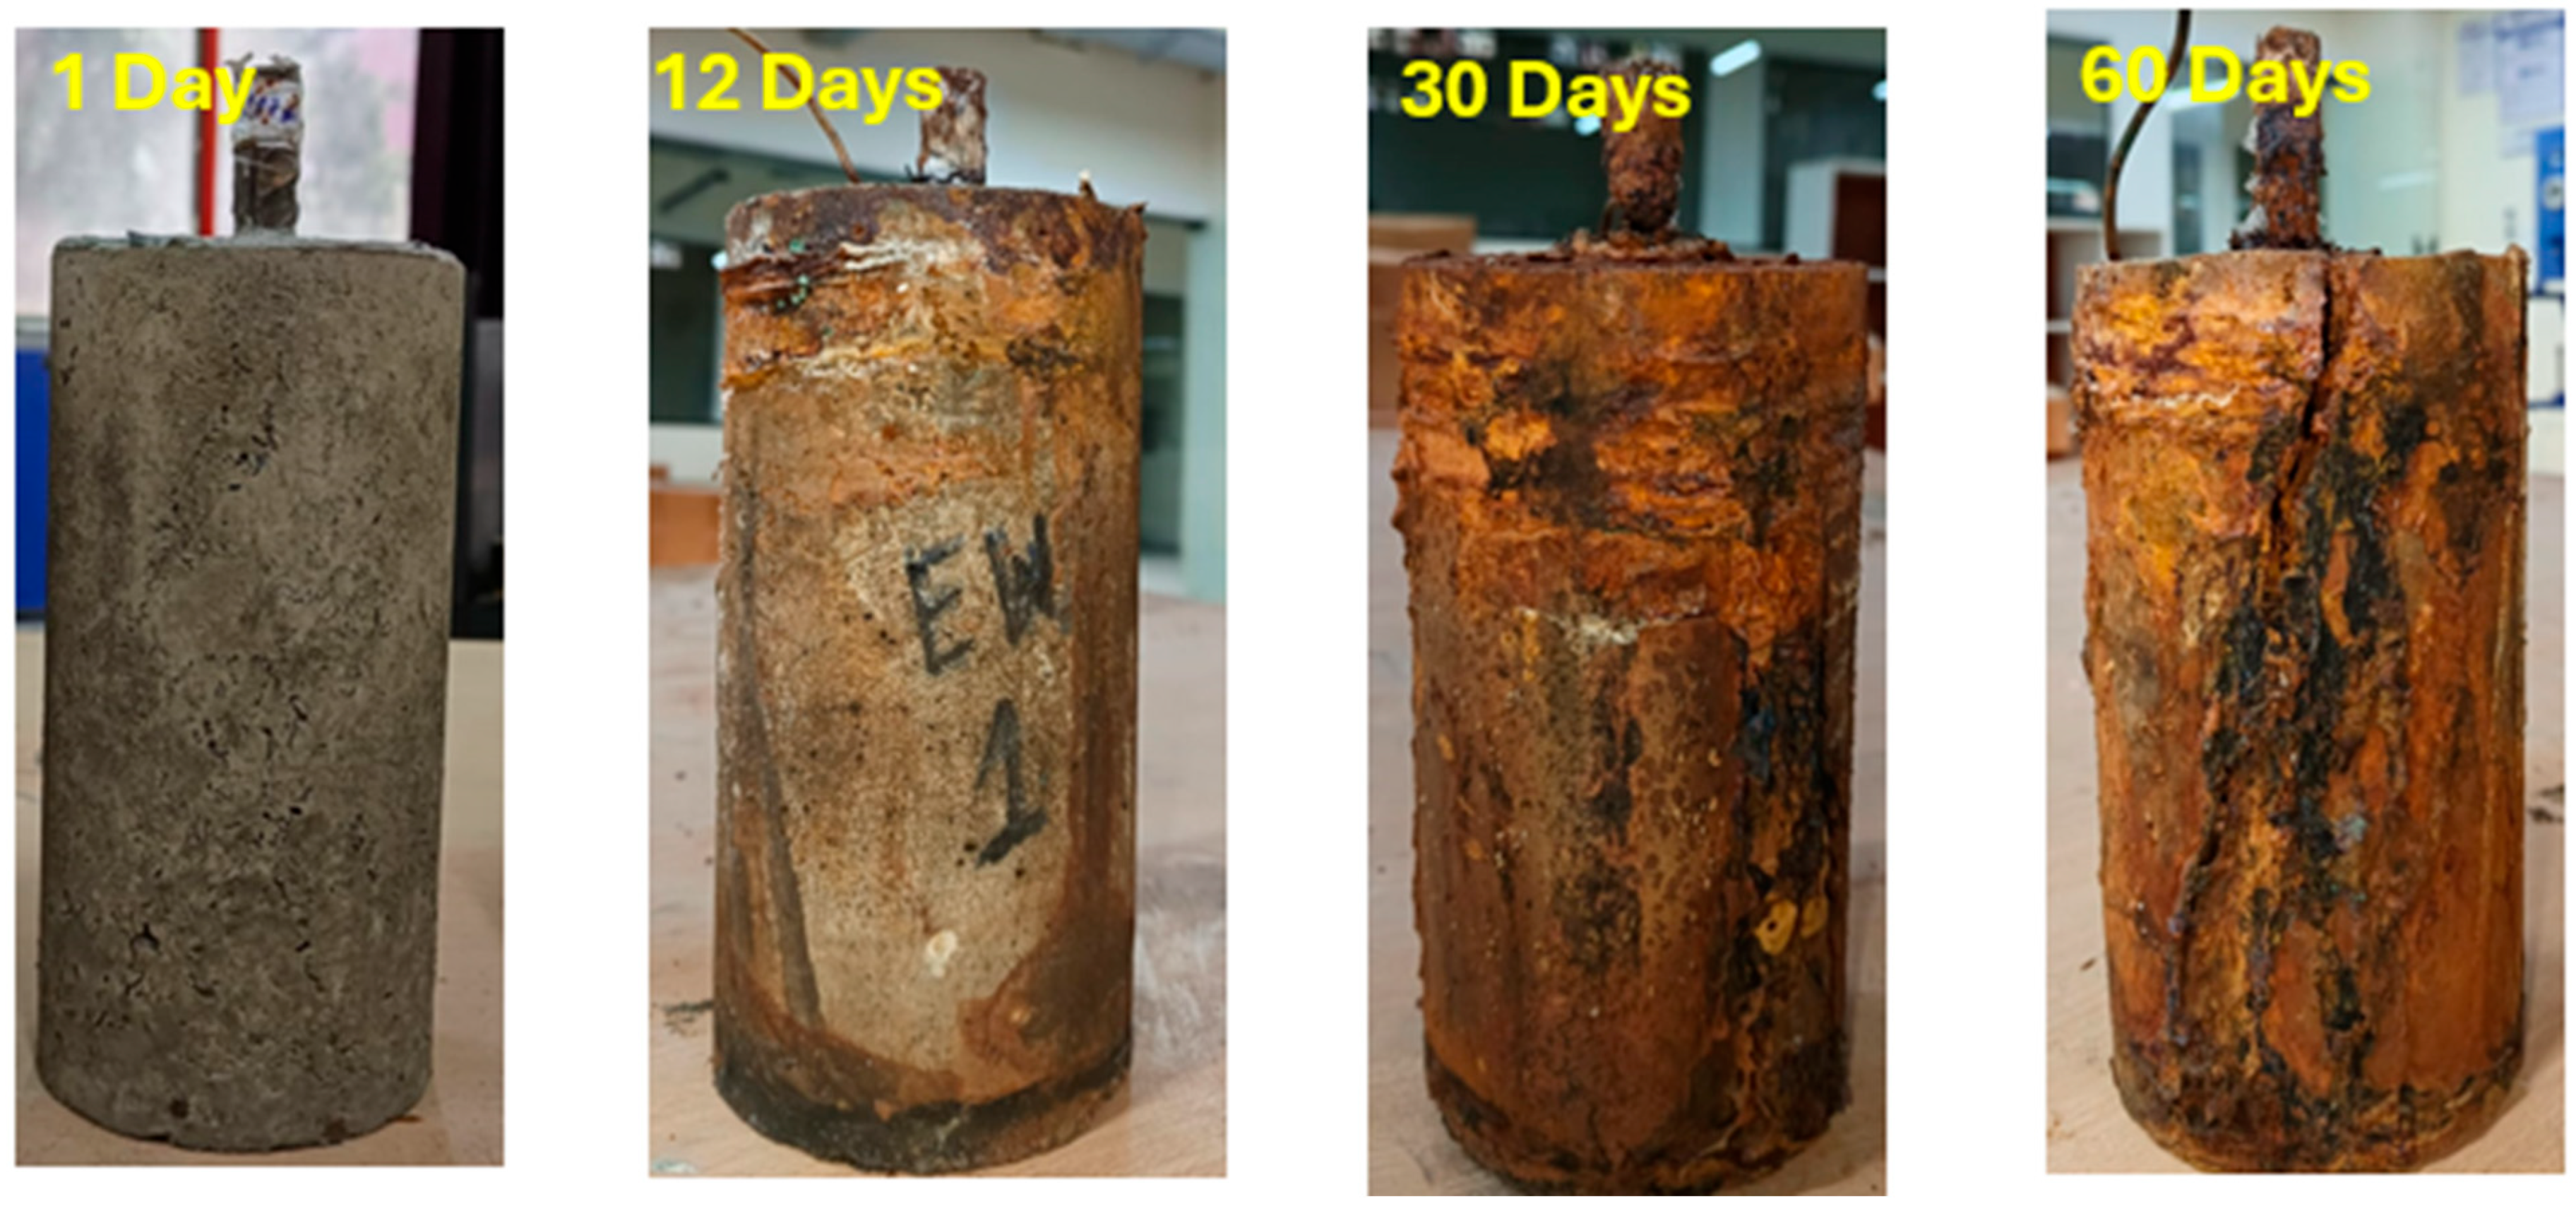
3.1. Qualitative Analysis

The variation in conductance (S) over a frequency range (100–400 kHz) as a function of the corrosion exposure time of CC is shown in Figure 5. The arrows in the top two subplots highlight changes between specific days, indicating trends in corrosion progression. In the top-left plot (initiation phase), the conductance values increase steadily from the baseline to the 17th day. The peak conductance shifts upward due to corrosion-induced microstructural changes. In the top-right plot (propagation phase), conductance initially remains high around the 17th day but starts to decline by the 60th day. The conductance peak gradually reduces and shifts downward, indicating a loss of material integrity due to corrosion-induced degradation. This decrease suggests localized damage, cracks, and rust formation, reducing the material’s conductive pathways. The variation in susceptance (S) over a frequency range (100–400 kHz) as a function of the corrosion exposure time of CC is shown in Figure 6. It can be seen that, initially, susceptance increases steadily from the baseline to the 17th day. Afterward, a gradual decline in susceptance is observed up to the 60th day, similar to the trend seen in conductance plots; however, the change in the susceptance signature is less compared to the conductance plot.
The variation in conductance (S) over a frequency range (100–400 kHz) as a function of the corrosion exposure time of reinforced E-waste concrete is shown in Figure 7. The arrows in the top two subplots highlight changes between specific days, indicating trends in corrosion progression. In the top-left plot (initiation phase), the 12th day signature is significantly shifted upward compared to the baseline, indicating an increase in conductance due to corrosion. The conductance increases gradually, suggesting the material is undergoing structural changes, likely due to corrosion product formation, as shown in the original image of the 12th day. In the top-right plot (propagation phase), unlike the initiation phase where conductance increased, here, the 60th day signature shows a decrease in conductance compared to the 12th day. This suggests that corrosion may have reached a stage where damage mechanisms such as crack formation or material degradation are affecting the conductance behavior, as shown in the original image of the 60th day. The variation in susceptance (S) over a frequency range (100–400 kHz) as a function of the corrosion exposure time of E-waste is shown in Figure 8. It can be seen that, initially, susceptance increases steadily up to around 12 days. Afterward, a gradual decline in susceptance is observed, similar to the trend seen in conductance plots; however, the change in the susceptance signature is less compared to the conductance plot.
On visual inspection of CC specimens, as shown in Figure 9, it can be seen that the surface of the concrete is smooth with no rust stains on 1 day, with slight rust formation around the reinforcement region; initial corrosion stains appear near the surface on the 17th day and heavy rust deposits with major cracking and delamination of the concrete surface occur at 60 days. However, in reinforced E-waste concrete specimens, slight rust formation around the reinforcement region and initial corrosion stains appear near the surface on the 12th day, and moderate rust deposits with minor cracking occur at 30 days and major cracks and delamination of the concrete surface occur at 60 days, as shown in Figure 10. From these observations, it is concluded that the durability under a chloride-laden environment of reinforced E-waste concrete is less comparable to conventional concrete.

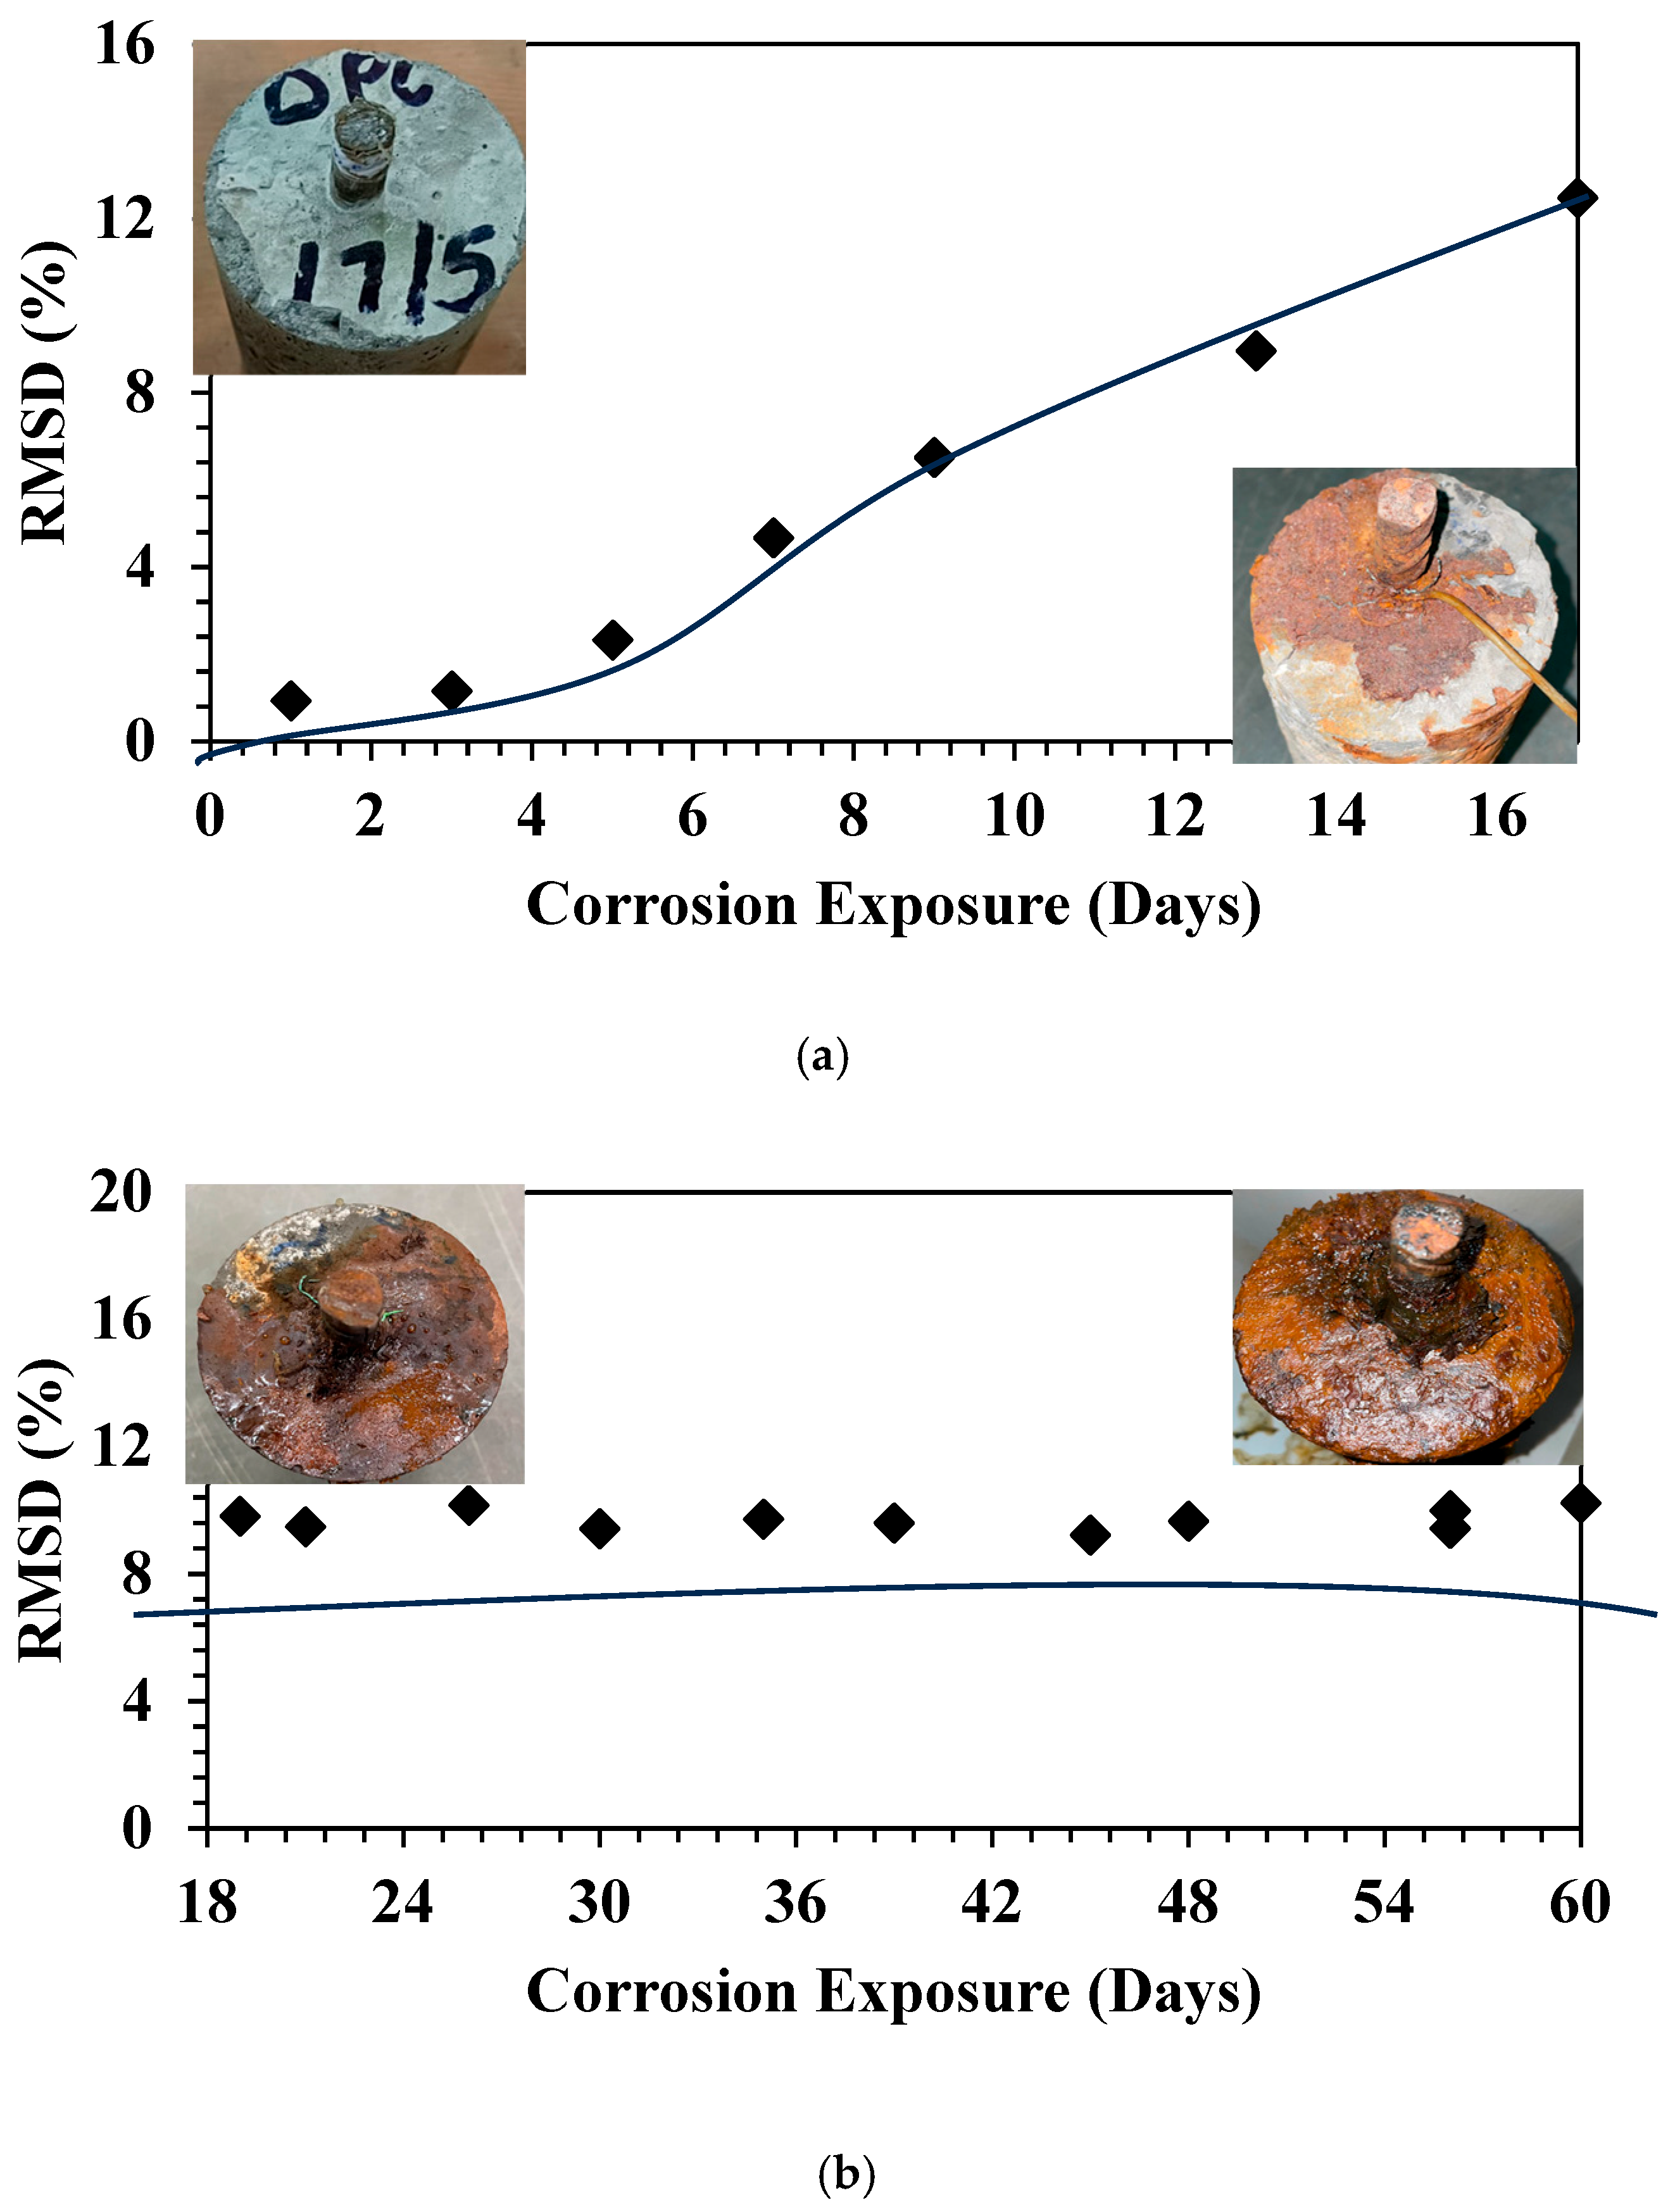
3.2. Quantitative Analysis

Figure 11 illustrates the variation in RMSD values over corrosion exposure days of CC, divided into two distinct phases: the initiation phase (0–17 days) and the propagation phase (18–60 days). In Figure 11a, RMSD values exhibit a steady increase, indicating the progressive onset of corrosion. Initially, at 0–5 days, corrosion effects are minimal, leading to low RMSD values (~4%). As corrosion progresses beyond 5 days, a noticeable rise in RMSD is observed, reaching approximately 12–14% by the 17th day. This suggests that corrosion-induced changes in material properties become more significant over time. The insets visually confirm this trend, showing a gradual increase in rust formation and corrosion stains spreading across the surface. The steep rise in RMSD highlights this phase as the most sensitive period for early corrosion detection, making it crucial for preventive maintenance strategies. In Figure 11b, RMSD values stabilize around 12–14%, fluctuating slightly but without any significant upward trend. This suggests that the corrosion process has reached a saturation stage, where further structural degradation occurs but does not drastically affect RMSD values. The inset images depict severe corrosion effects, with extensive rust accumulation and material degradation, confirming the findings from RMSD trends. Figure 12 illustrates the variation in RMSD (%) for E-waste incorporated concrete during accelerated corrosion exposure, again divided into (a) initiation phase (0–12 days) and (b) propagation phase (13–60 days). The initiation phase (0–12 Days), as shown in Figure 12a, suggests that, during the early phase of corrosion, RMSD values show a sharp increase, particularly within the first 3 days, reaching approximately 15%. After this rapid rise, the RMSD continues to increase gradually, peaking at around 26% by the 12th day. This suggests that corrosion effects in E-waste concrete initiate more aggressively, possibly due to the increased electrical conductivity of the matrix induced by metallic components from E-waste. Visual evidence in the inset images shows early and prominent rust formation, indicating high corrosion reactivity in the early days. The steep curve denotes that E-waste concrete responds more sensitively to initial corrosion processes, with RMSD being a highly effective parameter for capturing these changes. The propagation phase (13–60 Days) from Figure 12b suggests that, in this stage, RMSD values experience a significant drop after the 12th day, settling into a lower, fluctuating range between 2 and 10% for the remainder of the exposure period. This declining trend suggests that although the corrosion continues, the electro-mechanical response becomes dampened, possibly due to crack formation, loss of continuity in the sensor path, or corrosion products insulating the electrode area. The inset images support this conclusion, revealing severe rust accumulation and cracking in the specimens. The structural damage may hinder accurate RMSD readings, thereby explaining the decreasing trend despite ongoing corrosion.
The comparative analysis between CC (Figure 11) and E-waste Concrete (Figure 12) highlights significant differences in corrosion behavior and sensor response, particularly in terms of RMSD trends during both initiation and propagation phases of accelerated corrosion exposure. In the initiation phase, CC shows a gradual and steady increase in RMSD values, starting from around 0% and reaching up to approximately 12–14% by day 17. This progressive trend reflects a slow and continuous onset of corrosion, allowing sufficient time for early-stage detection and maintenance planning. In contrast, E-waste concrete exhibits a sharp and rapid rise in RMSD values, escalating to around 26% by day 12, indicating a highly sensitive response to early corrosion activity. However, a clear divergence is observed in the propagation phase. For CC, RMSD values plateau around 9–12%, suggesting that while corrosion continues, the material reaches a saturation stage where the electro-mechanical response remains stable. This consistent trend indicates that CC can support long-term monitoring of corrosion progression without significant signal degradation. In contrast, E-waste concrete displays a sharp drop in RMSD values immediately after day 12, followed by a fluctuating but generally declining trend between 2 and 10%. Visual inspection of the specimens further supports these observations. The CC specimens show a gradual buildup of rust and surface discoloration, indicating progressive but less aggressive deterioration. E-waste concrete specimens, however, display severe surface rusting, crack formation, and structural degradation even in the early propagation phase. These visual rust formations confirm the aggressive nature of corrosion in E-waste concrete, potentially due to the electrochemical reactivity of the embedded E-waste components.

3.3. Gravimetric Mass Loss Analysis

In this section, the corrosion rate has been determined based on the mass calculated before and after accelerated corrosion exposure of CC and E-waste concrete as per ASTM G1-03. The formula for corrosion rate is shown in Equation (3), as follows:
C o r r o s i o n   R a t e = K W A T D
where K is the constant = 8.76 × 104 mm/year, T is the time of exposure in hours, A is the area in cm2, W is mass loss in grams, and D is density in g/cm3. Table 2 presents a corrosion rate analysis of CC and E-waste concrete samples based on mass loss over a specific exposure period. Six samples (three CC and three E-waste concrete) were tested, with their initial and final masses recorded to determine the mass loss due to corrosion. The exposure period CC samples and E-waste concrete samples were exposed for 1440 h (~60 days). The mass loss for CC samples ranged from 63 to 70 g, resulting in lower corrosion rates between 9 and 10 mm/year. In contrast, E-waste concrete samples showed higher mass loss (82–86 g) and significant corrosion rates (11.71–12.57 mm/year). This indicates that CC has better corrosion resistance than E-waste concrete.

4. Conclusions

This research demonstrates the potential and limitations of using E-waste, particularly printed circuit board (PCB) materials, as a sustainable partial replacement for coarse aggregates in reinforced concrete. Through an experimental setup utilizing EPS and the EMI technique, the study successfully monitored corrosion progression in both conventional and E-waste concrete samples subjected to chloride-rich environments. A 60-day accelerated corrosion test using a 3.5% NaCl solution allowed for comparative analysis based on conductance, susceptance, and root mean square deviation (RMSD) metrics. The findings reveal that E-waste concrete, while providing enhanced workability and sustainability benefits, demonstrated reduced corrosion resistance compared to conventional concrete. Corrosion in E-waste concrete was initiated earlier, with increased conductance and susceptance variations during the initial exposure phase. Visual inspections supports sensor data, showing earlier crack formation and rust accumulation in E-waste samples. Quantitative analysis using RMSD indicated that E-waste concrete experienced a steeper rise in structural degradation during the initial corrosion stages. Thus, the EMI technique, facilitated by EPS integration, proved highly effective in capturing early-stage corrosion through non-destructive and real-time structural health monitoring. It can be implemented during the construction phase, providing continuous data throughout the service life of the structure. This proactive monitoring capability is particularly valuable for high-risk environments such as marine structures or chemically aggressive industrial zones. However, there are several limitations such as the corrosion exposure environment, which was artificially accelerated using chloride-laden immersion, which may not entirely replicate field conditions. Further validation through long-term outdoor exposure or in-service performance monitoring would enhance the applicability of the findings. The experimental scope was also limited to 12 samples and a single E-waste type. Although the results show clear trends, broader sample sets and consideration of other E-waste sources such as cable sheaths or electronic plastics would provide more comprehensive insight. Additionally, the study did not include chemical or morphological characterizations such as scanning electron microscopy (SEM), energy dispersive spectroscopy (EDS), or X-ray diffraction (XRD), which could further illuminate the microstructural effects and composition of corrosion products. Future studies may also incorporate numerical modeling or machine learning techniques to interpret EMI signals and predict structural performance with greater accuracy.

Author Contributions

Conceptualization, G.K. and T.B.; methodology, G.K.; software, G.K.; validation, G.K.; formal analysis, G.K.; investigation, G.K.; resources, G.K.; data curation, G.K.; writing—original draft preparation, G.K.; writing—review and editing, T.B.; visualization, T.B. and D.S.; supervision, T.B. and D.S. All authors have read and agreed to the published version of the manuscript.

Funding

This research received no external funding.

Data Availability Statement

The data used in this manuscript are available on request.

Conflicts of Interest

The authors declare no conflicts of interest.

References

  1. Tuutti, K. Corrosion of Steel in Concrete; De Gruyter: Berlin, Germany, 1977; ISBN 9781032120980. [Google Scholar]
  2. Kumar, V.; Ash, F. Protection of steel reinforcement for concrete—A review. Corros. Rev. 1998, 16, 317–358. [Google Scholar] [CrossRef]
  3. Sharma, S.; Mukherjee, A. Longitudinal Guided Waves for Monitoring Chloride Corrosion in Reinforcing Bars in Concrete. Struct. Health Monit. 2010, 9, 555–567. [Google Scholar] [CrossRef]
  4. Glass, G.K.; Page, C.L. Factors affecting the corrosion rate of steel in carbonated mortars. Corros. Sci. 1991, 32, 1283–1294. [Google Scholar] [CrossRef]
  5. Bagwan, W.A. Electronic Waste (E-Waste) Generation and Management Scenario of India, and ARIMA Forecasting of E-Waste Processing Capacity of Maharashtra State till 2030. Waste Manag. Bull. 2024, 1, 41–51. [Google Scholar] [CrossRef]
  6. Khetriwal, D.S. E-Waste Management in India. In Waste Electrical and Electronic Equipment (WEEE) Handbook; Elsevier, Woodhead Publishing: Cambridge, UK, 2019; pp. 541–571. [Google Scholar] [CrossRef]
  7. Sua-iam, G.; Chatveera, B. A Study on Workability and Mechanical Properties of Eco-Sustainable Self-Compacting Concrete Incorporating PCB Waste and Fly Ash. J. Clean. Prod. 2021, 329, 129523. [Google Scholar] [CrossRef]
  8. Thakkar, J.; Dave, N.; Thaker, T. Influence of Additive on Mechanical, Durability, and Microstructural Properties of Concrete Containing Printed Circuit Board (PCB) E-Waste as Coarse Aggregates: A Review. In Smart Cities and Sustainable Manufacturing: Innovations for a Greener Future; Elsevier: Amsterdam, The Netherlands, 2025; pp. 175–206. [Google Scholar] [CrossRef]
  9. Ramteke, J.; Rathore, K.; Supe, J.D. Green Concrete Incorporating Industrial Waste and E-Waste: A Review of Compressive Strength, CO2 Emissions, and Replacement Levels. Asian J. Civ. Eng. 2025, 26, 1881–1906. [Google Scholar] [CrossRef]
  10. Almohana, A.I.; Abdulwahid, M.Y.; Galobardes, I.; Mushtaq, J.; Almojil, S.F. Producing Sustainable Concrete with Plastic Waste: A Review. Environ. Chall. 2022, 9, 100626. [Google Scholar] [CrossRef]
  11. Ullah, Z.; Qureshi, M.I.; Ahmad, A.; Khan, S.U.; Javaid, M.F. An Experimental Study on the Mechanical and Durability Properties Assessment of E-Waste Concrete. J. Build. Eng. 2021, 38, 102177. [Google Scholar] [CrossRef]
  12. Kumar, G.; Bansal, T.; Sharma, D. Effect of E-Waste on Concrete during Combined Chlorination and Compression Loading Using Electro-Mechanical Impedance Technique. Measurement 2025, 253, 117832. [Google Scholar] [CrossRef]
  13. Naidu Gopu, G.; Sofi, A. Corrosion-Induced Bond Behaviour of Steel, E-Glass, And E-Waste Copper Wire Fiber Reinforced Concrete. Rom. J. Mater. 2022, 52, 404. [Google Scholar]
  14. Pagadala, M.; Mundra, S.; Bansal, S. Corrosion Monitoring Techniques for Concrete in Corrosive Environments. Corros. Rev. 2022, 40, 409–425. [Google Scholar] [CrossRef]
  15. Talakokula, V.; Bhalla, S.; Gupta, A. Corrosion Assessment of Reinforced Concrete Structures Based on Equivalent Structural Parameters Using Electro-Mechanical Impedance Technique. J. Intell. Mater. Syst. Struct. 2014, 25, 484–500. [Google Scholar] [CrossRef]
  16. Talakokula, V.; Bhalla, S. Reinforcement Corrosion Assessment Capability of Surface Bonded and Embedded Piezo Sensors for Reinforced Concrete Structures. J. Intell. Mater. Syst. Struct. 2015, 26, 2304–2313. [Google Scholar] [CrossRef]
  17. Park, S.; Park, G.; Yun, C.B.; Farrar, C.R. Sensor Self-Diagnosis Using a Modified Impedance Model for Active Sensing-Based Structural Health Monitoring. Struct. Health Monit. 2009, 8, 71–82. [Google Scholar] [CrossRef]
  18. Bansal, T.; Talakokula, V.; Saravanan, T.J. EMI-Based Monitoring of Prestressed Concrete Beam under Chloride-Induced Corrosion Using an Embedded Piezo Sensor. Meas. Sens. 2024, 33, 101158. [Google Scholar] [CrossRef]
  19. SSDL|Home. Available online: https://ssdl.iitd.ac.in/ (accessed on 2 June 2025).
  20. Bhalla, S.; Gupta, A. An Embeddable Piezo Composite Concrete Vibration Sensor for Structural Health Monitoring of Reinforced Concrete Structures and Process of Preparation Thereof. Indian Patent No. 412929, 29 November 2022. [Google Scholar]
  21. Bansal, T.; Talakokula, V.; Rama Jyosyula, S.K.; Vicente, R.; Ascensão, G. Embedded Piezo-Sensor-Based Automatic Performance Monitoring of Chloride-Induced Corrosion in Alkali-Activated Concrete. Sustainability 2022, 14, 12917. [Google Scholar] [CrossRef]
  22. Bansal, T.; Talakokula, V.; Sathujoda, P. A Machine Learning Approach for Predicting the Electro-Mechanical Impedance Data of Blended RC Structures Subjected to Chloride Laden Environment. Smart Mater. Struct. 2021, 31, 015036. [Google Scholar] [CrossRef]
  23. Kumar, G.; Bansal, T.; Sharma, D. Monitoring Hydration and Strength Development of E-Waste Concrete: A Passive Sensing Approach Using Piezo Sensors. Clean. Mater. 2025, 17, 100326. [Google Scholar] [CrossRef]
  24. Hire, J.H.; Hosseini, S.; Moradi, F. Optimum Pzt Patch Size for Corrosion Detection in Reinforced Concrete Using the Electromechanical Impedance Technique. Sensors 2021, 21, 3903. [Google Scholar] [CrossRef] [PubMed]
  25. Parida, L.; Moharana, S. Mechanical and Corrosion Investigations of Bond Behavior in Reinforced Concrete with Varying Parameters. J. Fail. Anal. Prev. 2024, 24, 402–413. [Google Scholar] [CrossRef]
  26. Parida, L.; Moharana, S. Monitoring the Bond Zone Mechanism between Reinforced Steel & Concrete for Electromechanical Impedance Technique through a Multi-Attached Piezo Sensor-Based Diagnostic Approach. Mech. Syst. Signal Process 2025, 223, 111897. [Google Scholar] [CrossRef]
  27. Singh, I.; Dev, N.; Pal, S. Impedance Based Damage Assessment of Concrete under the Combined Effect of Impact and Temperature Using Different Piezo Configurations. Sens. Actuators A Phys. 2022, 345, 113763. [Google Scholar] [CrossRef]
  28. Negi, P.; Chhabra, R.; Kaur, N.; Bhalla, S. Health Monitoring of Reinforced Concrete Structures under Impact Using Multiple Piezo-Based Configurations. Constr. Build. Mater. 2019, 222, 371–389. [Google Scholar] [CrossRef]
  29. Haq, M.; Bhalla, S.; Naqvi, T. Fatigue Damage and Residual Fatigue Life Assessment in Reinforced Concrete Frames Using PZT-Impedance Transducers. Cem. Concr. Compos. 2020, 114, 103771. [Google Scholar] [CrossRef]
  30. Patel, A.; Parida, L.; Moharana, S. Influence of Adhesive Bonding and Debonding Detection on Aluminum Beam Using Electro-Mechanical Impedance (EMI) Technique. In International Workshop on Civil Structural Health Monitoring; Springer Nature: Cham, Switzerland, 2024; pp. 225–235. [Google Scholar] [CrossRef]
  31. Su, Y.F.; Han, G.; Amran, A.; Nantung, T.; Lu, N. Instantaneous Monitoring the Early Age Properties of Cementitious Materials Using PZT-Based Electromechanical Impedance (EMI) Technique. Constr. Build. Mater. 2019, 225, 340–347. [Google Scholar] [CrossRef]
  32. Zhang, C.; Panda, G.P.; Yan, Q.; Zhang, W.; Vipulanandan, C.; Song, G. Monitoring Early-Age Hydration and Setting of Portland Cement Paste by Piezoelectric Transducers via Electromechanical Impedance Method. Constr. Build. Mater. 2020, 258, 120348. [Google Scholar] [CrossRef]
  33. Al Agha, W.; Pal, S.; Dev, N. Challenges for Structural Health Monitoring of Concrete Curing Using Piezoelectric Sensor and Electromechanical Impedance (EMI) Technique: A Critical Review. Mater. Today Proc. 2023. [Google Scholar] [CrossRef]
  34. Al Agha, W.; Pal, S.; Dev, N. Electro-Mechanical Impedance-Based Equivalent Structural Health Monitoring of Steel Fibre Cementitious Materials under Long Curing Age Effect. Constr. Build. Mater. 2025, 489, 142296. [Google Scholar] [CrossRef]
  35. Negi, P.; Chakraborty, T.; Kaur, N.; Bhalla, S. Investigations on Effectiveness of Embedded PZT Patches at Varying Orientations for Monitoring Concrete Hydration Using EMI Technique. Constr. Build. Mater. 2018, 169, 489–498. [Google Scholar] [CrossRef]
  36. Soh, C.K.; Bhalla, S. Calibration of Piezo-Impedance Transducers for Strength Prediction and Damage Assessment of Concrete. Smart Mater. Struct. 2005, 14, 671–684. [Google Scholar] [CrossRef]
  37. Li, W.; Liu, T.; Zou, D.; Wang, J.; Yi, T.H. PZT Based Smart Corrosion Coupon Using Electromechanical Impedance. Mech. Syst. Signal Process 2019, 129, 455–469. [Google Scholar] [CrossRef]
  38. Bhalla, S. A Mechanical Impedance Approach for Structural Identification, Health Monitoring and Non-Destructive Evaluation Using Piezo-Impedance Transducers. Ph.D. Thesis, Nanyang Technological University, Singapore, 2004. [Google Scholar]
  39. Kumar, G.; Bansal, T.; Haq, M.; Sharma, U.; Kumar, A.; Jha, P.; Sharma, D.; Kamyab, H.; Valencia, E.A.V. Utilizing E-Waste as a Sustainable Aggregate in Concrete Production: A Review. Buildings 2024, 14, 2495. [Google Scholar] [CrossRef]
  40. Caré, S.; Raharinaivo, A. Influence of Impressed Current on the Initiation of Damage in Reinforced Mortar Due to Corrosion of Embedded Steel. Cem. Concr. Res. 2007, 37, 1598–1612. [Google Scholar] [CrossRef]
  41. Ahmad, S. Techniques for Inducing Accelerated Corrosion of Steel in Concrete. Arab. J. Sci. Eng. 2009, 34, 95. [Google Scholar]
Figure 1. Preparation of the sensor and its location in rebar (a) EPS (Reprinted from [23]), (b) Attachment of EPS to a steel bar.
Constrmater 05 00046 g001
Figure 2. Preparation of PCB-based E-waste material: (a) Collection of end-of-life electronic components in the E-waste Bank; (b) Extracted PCB assemblies from dismantled E-waste (Adapted from [23]); (c) Component removal and cleaning of PCBs; and (d) Shredded PCB particles.
Constrmater 05 00046 g002
Figure 3. Integration of EPS attached to a steel bar in CC and E-waste concrete specimens.
Constrmater 05 00046 g003
Figure 4. Experimental setup. (a) Accelerated corrosion, (b) specimen, (c) data acquisition.
Constrmater 05 00046 g004
Figure 5. Variation in conductance signature during accelerated corrosion exposure to CC.
Constrmater 05 00046 g005
Figure 6. Variation in susceptance signature during accelerated corrosion exposure to CC.
Constrmater 05 00046 g006
Figure 7. Variation in conductance signature during accelerated corrosion exposure to E-waste.
Constrmater 05 00046 g007
Figure 8. Variation in susceptance signature during accelerated corrosion exposure to E-waste.
Constrmater 05 00046 g008
Figure 9. Corrosion progression in CC samples from 1 to 60 days.
Constrmater 05 00046 g009
Figure 10. Corrosion progression in E-waste samples from 1 to 60 days.
Constrmater 05 00046 g010
Figure 11. Variation in RMSD during accelerated corrosion exposure CC. (a) Initiation phase and (b) propagation phase.
Constrmater 05 00046 g011
Figure 12. Variation in RMSD during accelerated corrosion exposure to E-waste concrete. (a) Initiation phase and (b) propagation phase.
Constrmater 05 00046 g012aConstrmater 05 00046 g012b
Table 1. Mix proportions of CC concrete and E-waste concrete used (adapted from [12,23]).
Mix ProportionCement Content (kg/m3)Coarse Aggregate Replacement (%)Fine Aggregate (kg/m3)Coarse Aggregate (kg/m3)Water (kg/m3)E-Waste
CC Concrete386.360672.8411961700
E-waste Concrete386.3615672.841016.6170179.4
Table 2. Corrosion rate analysis of CC and E-waste concrete.
S.NoSample IDInitial Mass (gm)Final Mass (gm)Mass Loss (gm)Exposure Days (hours)Corrosion Rate (mm/year)
1CC-131024070144010.00
2CC-23092456414409.14
3CC-33102476314409.00
4E-waste-129421282144011.71
5E-waste-229821286144012.28
6E-waste-330221488144012.57
Disclaimer/Publisher’s Note: The statements, opinions and data contained in all publications are solely those of the individual author(s) and contributor(s) and not of MDPI and/or the editor(s). MDPI and/or the editor(s) disclaim responsibility for any injury to people or property resulting from any ideas, methods, instructions or products referred to in the content.

