
Mapping Single Nucleotide Polymorphism Markers Associated with the Pre-Flowering Morphological Performance of Fenugreek under Different Levels of Salt Stress

 , and
, and
Abstract
1. Introduction
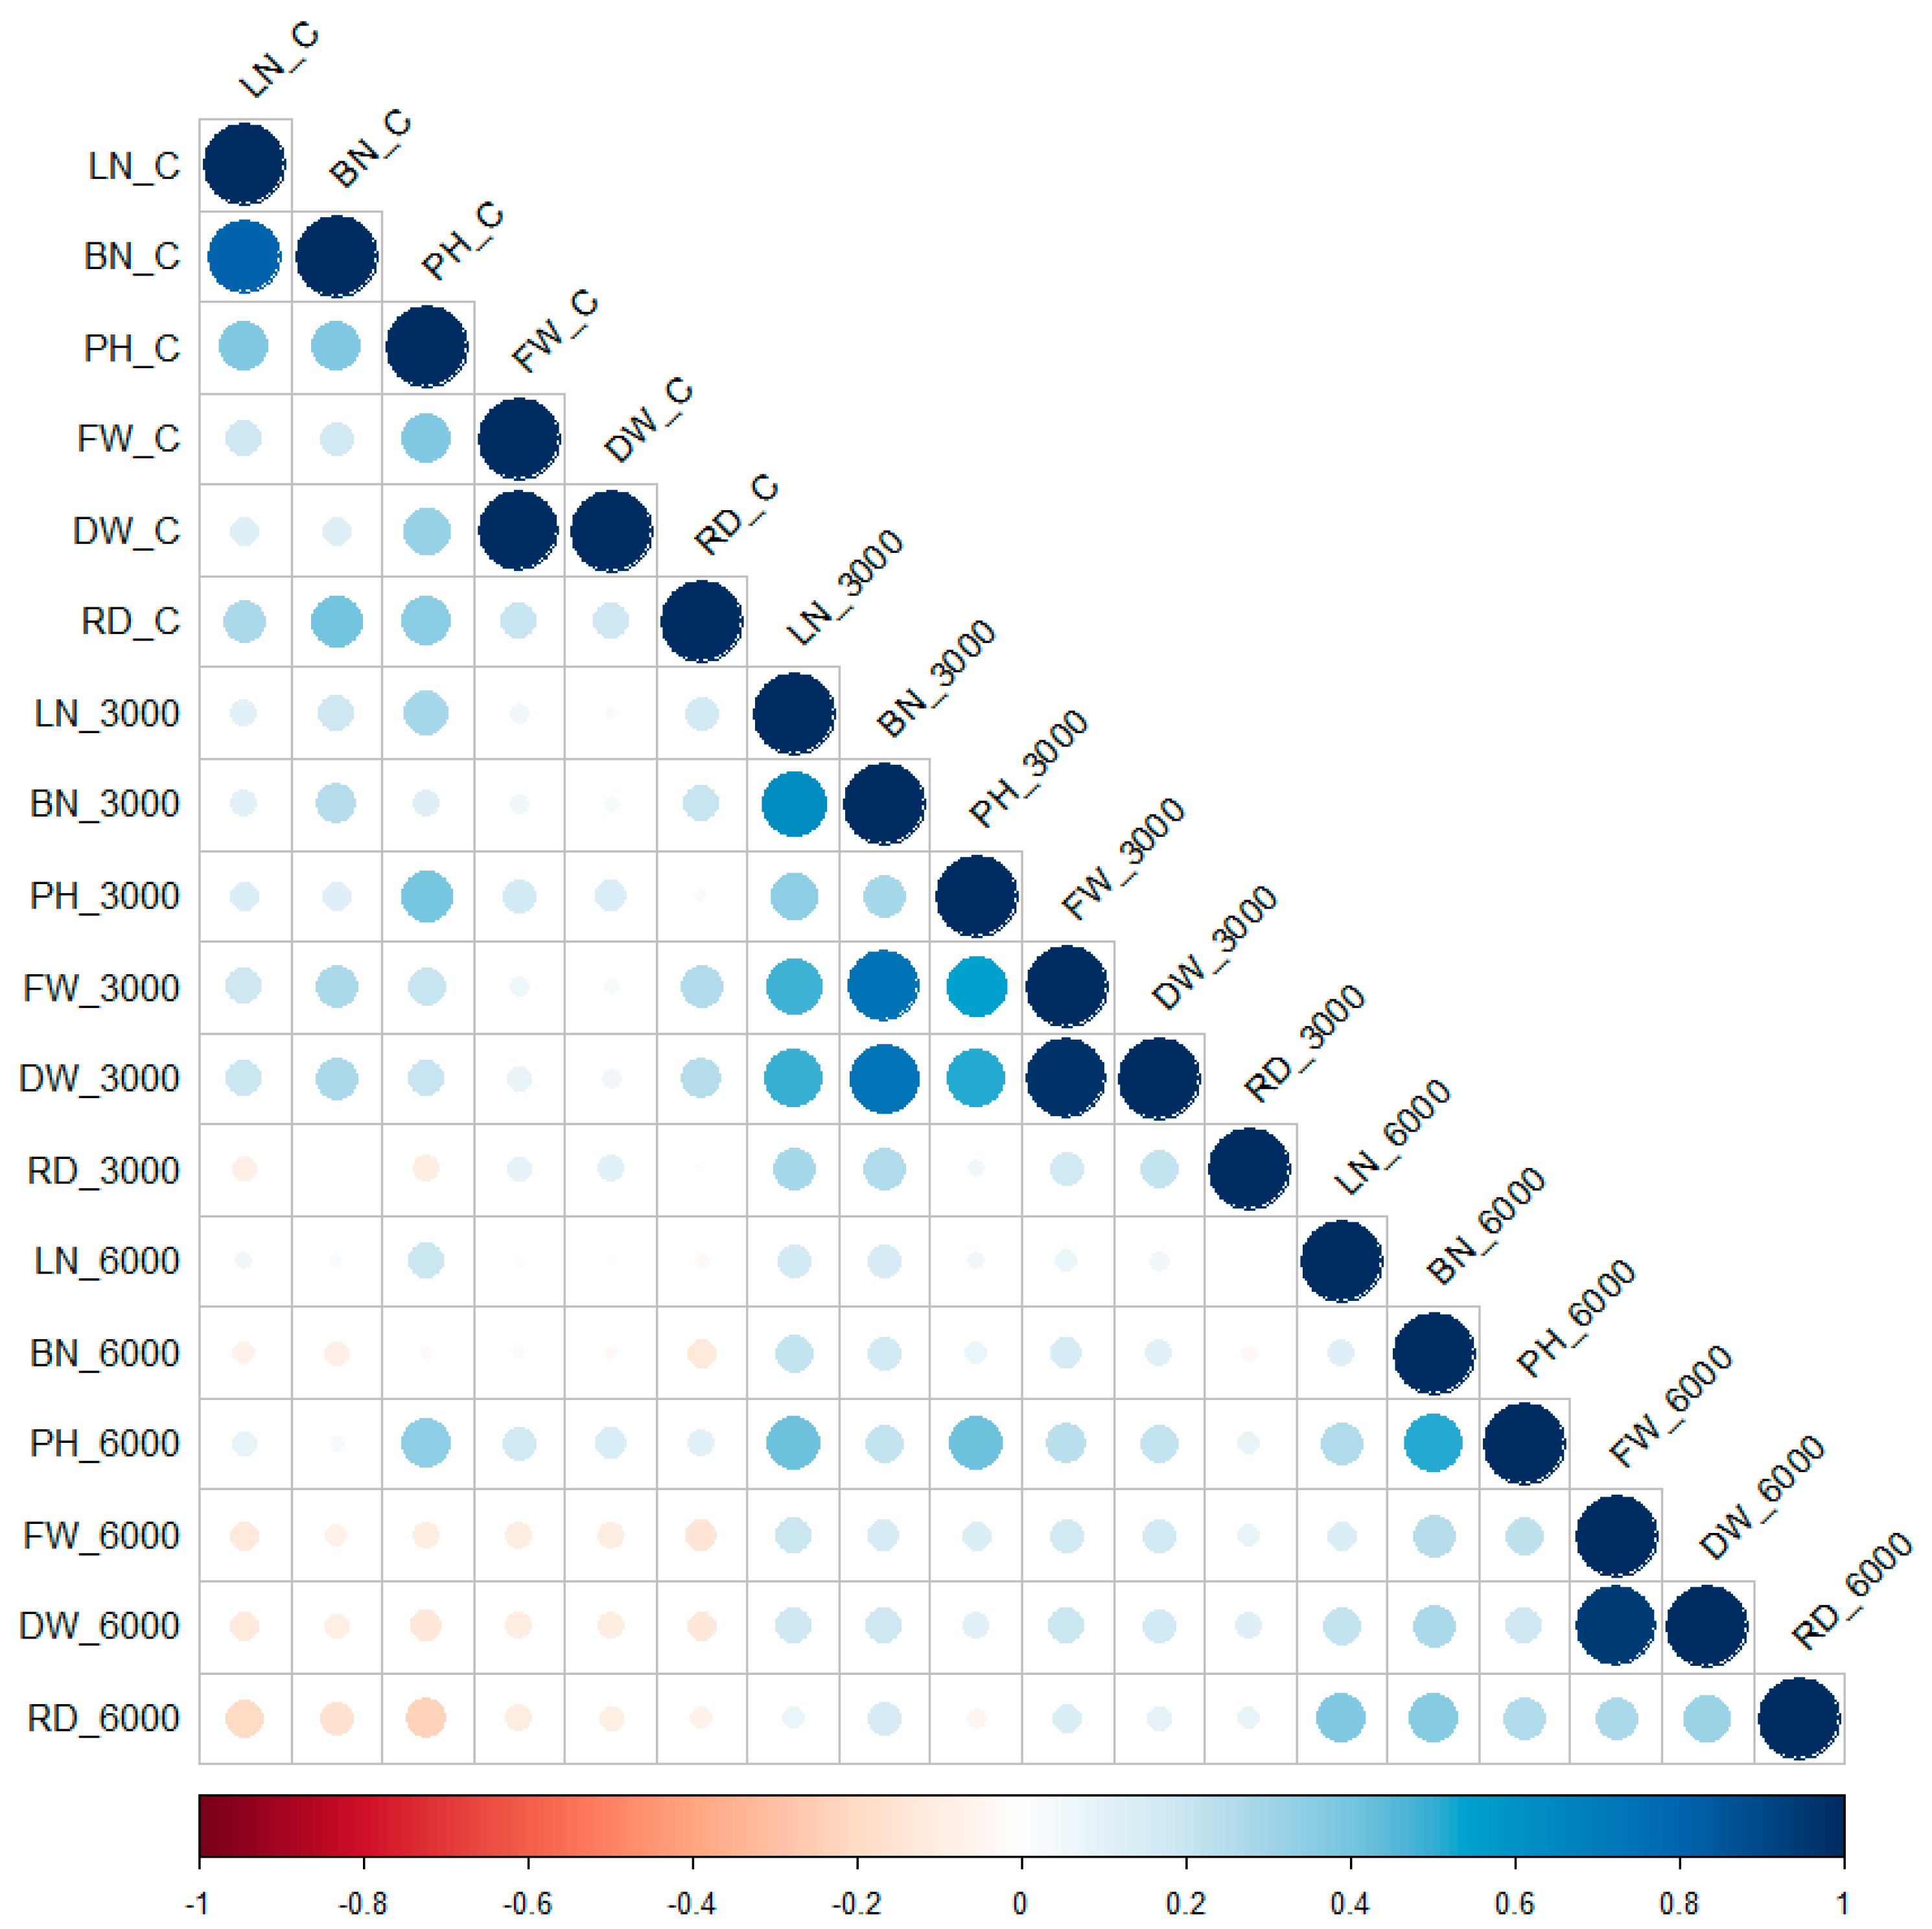
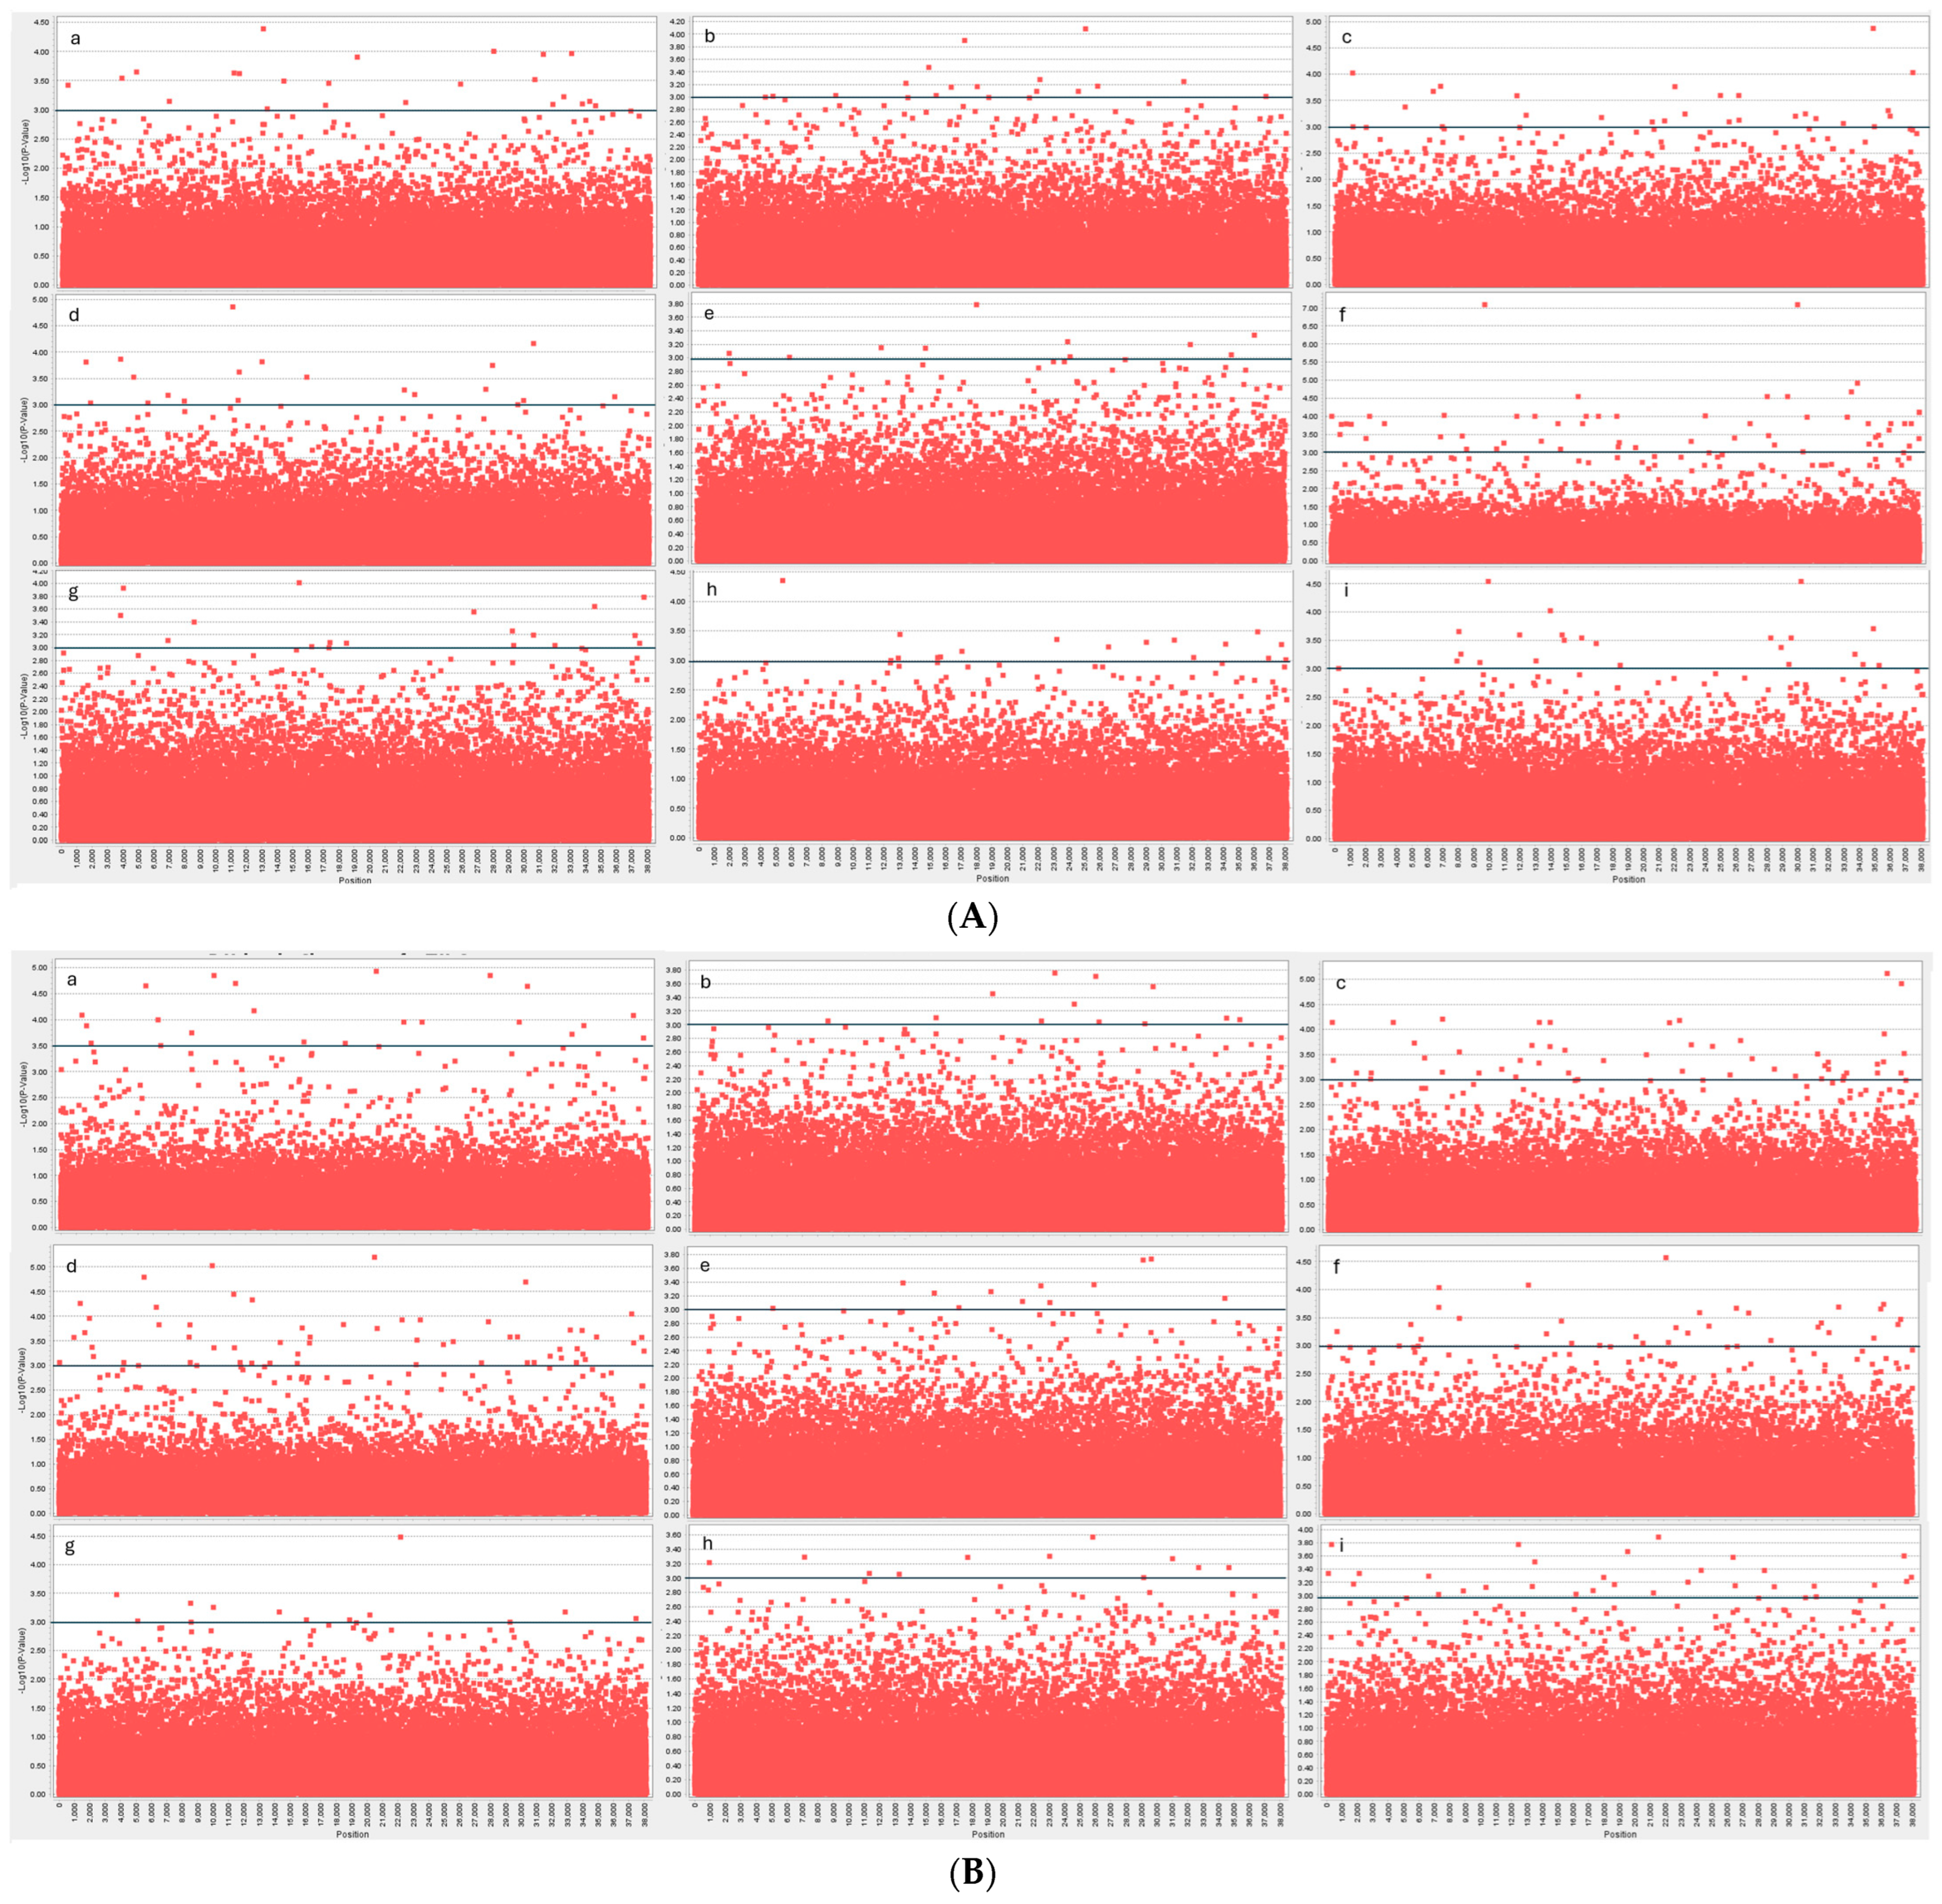
2. Results
Association Mapping
3. Discussion
4. Conclusions
5. Materials and Methods
5.1. Plant Material and Experimental Design
5.2. Phenotypic Measurements
5.3. Statistical Analysis
5.4. SNP Data and Mapping
Supplementary Materials
Author Contributions
Funding
Data Availability Statement
Conflicts of Interest
References
- Kumar, M.; Prasad, M.; Arya, R. Grain yield and quality improvement in fenugreek. A review. Forage Res. 2013, 39, 1–9. [Google Scholar]
- Sarwar, S.; Hanif, M.A.; Ayub, M.A.; Boakye, Y.D.; Agyare, C. Fenugreek, in Medicinal Plants of South Asia; Elsevier: Amsterdam, The Netherlands, 2020; pp. 257–271. [Google Scholar]
- Amiri, H.; Banakar, M.H.; Ranjbar, G.H.; Ardakani, M.R.S.; Omidvari, M. Exogenous application of spermidine and methyl jasmonate can mitigate salt stress in fenugreek (Trigonella foenum-graecum L.). Ind. Crop. Prod. 2023, 199, 116826. [Google Scholar] [CrossRef]
- Petropoulos, G.A. Fenugreek: The Genus Trigonella; CRC Press: Boca Raton, FL, USA, 2002. [Google Scholar]
- Chaudhary, S.; Chaudhary, P.S.; Chikara, S.K.; Sharma, M.C.; Iriti, M. Review on fenugreek (Trigonella foenum-graecum L.) and its important secondary metabolite diosgenin. Not. Bot. Horti Agrobot. Cluj-Napoca 2018, 46, 22–31. [Google Scholar] [CrossRef]
- Maloo, S.; Sharma, R.; Soan, H. SSR Based Genetic Diversity Analysis in Fenugreek (Trigonella foenum-graecum L.) Genotypes. Legume Res.-Int. J. 2023, 46, 307–311. [Google Scholar] [CrossRef]
- Branch, S. Fenugreek (Trigonella foenum-graecum L.) as a valuable medicinal plant. Int. J. Adv. Biol. Biomed. Res. 2013, 1, 922–931. [Google Scholar]
- Dar, T.A.; Uddin, M. Fenugreek: A Miraculous Medicinal Herb. J. Complement. Med. Alt. Healthc. 2018, 7, 1–3. [Google Scholar] [CrossRef]
- Gleick, P.H. A look at twenty-first century water resources development. Water Int. 2000, 25, 127–138. [Google Scholar] [CrossRef]
- Mohanavelu, A.; Naganna, S.R.; Al-Ansari, N. Irrigation induced salinity and sodicity hazards on soil and groundwater: An overview of its causes, impacts and mitigation strategies. Agriculture 2021, 11, 983. [Google Scholar] [CrossRef]
- Ghorbanpour, A.; Mami, Y.; Ashournezhad, M.; Abri, F.; Amani, M. Effect of salinity and drought stress on germination of fenugreek. Afr. J. Agric. 2011, 6, 5529–5532. [Google Scholar] [CrossRef]
- Tuncturk, R. Salinity exposure modifies nutrient concentrations in fenugreek (Trigonella foenum graecum L.). Afr. J. Agric. Res. 2011, 6, 3685–3690. [Google Scholar]
- Belmecheri-Cherifi, H.; Albacete, A.; Martínez-Andújar, C.; Pérez-Alfocea, F.; Abrous-Belbachir, O. The growth impairment of salinized fenugreek (Trigonella foenum-graecum L.) plants is associated to changes in the hormonal balance. J. Plant Physiol. 2019, 232, 311–319. [Google Scholar] [CrossRef] [PubMed]
- Zia-ur-Rehman, M.; Anayatullah, S.; Irfan, E.; Hussain, S.M.; Rizwan, M.; Sohail, M.I.; Jafir, M.; Ahmad, T.; Usman, M.; Alharby, H.F. Nanoparticles assisted regulation of oxidative stress and antioxidant enzyme system in plants under salt stress: A review. Chemosphere 2022, 314, 137649. [Google Scholar] [CrossRef] [PubMed]
- Castillo, E.G.; Tuong, T.P.; Ismail, A.M.; Inubushi, K. Response to salinity in rice: Comparative effects of osmotic and ionic stresses. Plant Prod. Sci. 2007, 10, 159–170. [Google Scholar] [CrossRef]
- Rengasamy, P. Soil processes affecting crop production in salt-affected soils. Funct. Plant Biol. 2010, 37, 613–620. [Google Scholar] [CrossRef]
- Rasool, S.; Hameed, A.; Azooz, M.M.; Siddiqi, T.O.; Ahmad, P. Salt stress: Causes, types and responses of plants. In Ecophysiology and Responses of Plants under Salt Stress; Springer: New York, NY, USA, 2013; pp. 1–24. [Google Scholar]
- Chourasia, K.N.; Lal, M.K.; Tiwari, R.K.; Dev, D.; Kardile, H.B.; Patil, V.U.; Kumar, A.; Vanishree, G.; Kumar, D.; Bhardwaj, V.; et al. Salinity stress in potato: Understanding physiological, biochemical and molecular responses. Life 2021, 11, 545. [Google Scholar] [CrossRef] [PubMed]
- Asaadi, A.M. Investigation of salinity stress on seed germination of Trigonella foenum-graecum. Res. J. Biol. Sci. 2009, 4, 1152–1155. [Google Scholar]
- Chaves, M.M.; Flexas, J.; Pinheiro, C. Photosynthesis under drought and salt stress: Regulation mechanisms from whole plant to cell. Ann. Bot. 2009, 103, 551–560. [Google Scholar] [CrossRef] [PubMed]
- de Oliveira, A.B.; Alencar, N.L.M.; Gomes-Filho, E. Comparison between the water and salt stress effects on plant growth and development. Responses Org. Water Stress 2013, 4, 67–94. [Google Scholar]
- Negrão, S.; Schmöckel, S.; Tester, M. Evaluating physiological responses of plants to salinity stress. Ann. Bot. 2017, 119, 1–11. [Google Scholar] [CrossRef]
- Munns, R.; Tester, M. Mechanisms of salinity tolerance. Annu. Rev. Plant Biol. 2008, 59, 651–681. [Google Scholar] [CrossRef]
- Roy, S.J.; Negrão, S.; Tester, M. Salt resistant crop plants. Curr. Opin. Biotechnol. 2014, 26, 115–124. [Google Scholar] [CrossRef] [PubMed]
- El-Soda, M.; Sarhan, M.S. From gene mapping to gene editing, a guide from the Arabidopsis research. Annu. Plant Rev. Online 2021, 4, 1–32. [Google Scholar]
- El-Soda, M.; Malosetti, M.; Zwaan, B.J.; Koornneef, M.; Aarts, M.G. Genotype× environment interaction QTL mapping in plants: Lessons from Arabidopsis. Trends Plant Sci. 2014, 19, 390–398. [Google Scholar] [CrossRef] [PubMed]
- Abd El-Wahab, M.M.; Abdel-Lattif, H.; Emara, K.S.; Mosalam, M.; Aljabri, M.; El-Soda, M. Identifying SNP markers associated with distinctness, uniformity, and stability testing in Egyptian fenugreek genotypes. PLoS ONE 2023, 18, e0291527. [Google Scholar] [CrossRef] [PubMed]
- Tuberosa, R. Phenotyping for drought tolerance of crops in the genomics era. Front. Physiol. 2012, 3, 347. [Google Scholar] [CrossRef]
- Abd El-Wahab, M.M.H.; Aljabri, M.; Sarhan, M.S.; Osman, G.; Wang, S.; Mabrouk, M.; El-Shabrawi, H.M.; Gabr, A.M.M.; Abd El-Haliem, A.M.; O’Sullivan, D.M.; et al. High-density SNP-based association mapping of seed traits in fenugreek reveals homology with clover. Genes 2020, 11, 893. [Google Scholar] [CrossRef]
- Ahmadi, N. Genetic Bases of Complex Traits Complex Traits: From Quantitative Trait Loci to Prediction, in Genomic Prediction of Complex Traits: Methods and Protocols; Springer: Berlin/Heidelberg, Germany, 2022; pp. 1–44. [Google Scholar]
- Kulwal, P.L.; Singh, R. Association mapping in plants. In Crop Breeding: Genetic Improvement Methods; Humana: New York, NY, USA, 2021; pp. 105–117. [Google Scholar]
- Holm, S. A simple sequentially rejective multiple test procedure. Scand. J. Stat. 1979, 6, 65–70. [Google Scholar]
- Benjamini, Y.; Hochberg, Y. Controlling the false discovery rate: A practical and powerful approach to multiple testing. J. R. Stat. Soc. Ser. B 1995, 57, 289–300. [Google Scholar] [CrossRef]
- Akhatar, J.; Goyal, A.; Kaur, N.; Atri, C.; Mittal, M.; Singh, M.P.; Kaur, R.; Rialch, I.; Banga, S.S. Genome wide association analyses to understand genetic basis of flowering and plant height under three levels of nitrogen application in Brassica juncea (L.) Czern Coss. Sci. Rep. 2021, 11, 4278. [Google Scholar] [CrossRef]
- El-Soda, M.; Aljabri, M. Genome-wide association mapping of grain metal accumulation in wheat. Genes 2022, 13, 1052. [Google Scholar] [CrossRef]
- Upadhyay, P.; Gupta, M.; Sra, S.K.; Sharda, R.; Sharma, S.; Sardana, V.K.; Akhatar, J.; Kaur, G. Genome wide association studies for acid phosphatase activity at varying phosphorous levels in Brassica juncea L. Front. Plant Sci. 2022, 13, 1056028. [Google Scholar] [CrossRef] [PubMed]
- Coolen, S.; Van Dijen, M.; Van Pelt, J.A.; Van Loon, J.J.; Pieterse, C.M.; Van Wees, S.C. Genome-wide association study reveals WRKY42 as a novel plant transcription factor that influences oviposition preference of Pieris butterflies. J. Exp. Bot. 2023, 74, 1690–1704. [Google Scholar] [CrossRef] [PubMed]
- Ahari, D.S.; Kashi, A.K.; Hassandokht, M.R.; Amri, A.; Alizadeh, K. Assessment of drought tolerance in Iranian fenugreek landraces. J. Food Agric. Environ. 2009, 7, 414–419. [Google Scholar]
- Mickky, B.M.; Abbas, M.A.; Sameh, N.M. Morpho-physiological status of fenugreek seedlings under NaCl stress. J. King Saud Univ.-Sci. 2019, 31, 1276–1282. [Google Scholar] [CrossRef]
- Elleuch, A.; Chaâbene, Z.; Grubb, D.C.; Drira, N.; Mejdoub, H.; Khemakhem, B. Morphological and biochemical behavior of fenugreek (Trigonella foenum-graecum) under copper stress. Ecotoxicol. Environ. Saf. 2013, 98, 46–53. [Google Scholar] [CrossRef]
- Acosta-Motos, J.R.; Ortuño, M.F.; Bernal-Vicente, A.; Diaz-Vivancos, P.; Sanchez-Blanco, M.J.; Hernandez, J.A. Plant responses to salt stress: Adaptive mechanisms. Agronomy 2017, 7, 18. [Google Scholar] [CrossRef]
- Lekklar, C.; Pongpanich, M.; Suriya-Arunroj, D.; Chinpongpanich, A.; Tsai, H.; Comai, L.; Chadchawan, S.; Buaboocha, T. Genome-wide association study for salinity tolerance at the flowering stage in a panel of rice accessions from Thailand. BMC Genom. 2019, 20, 1–18. [Google Scholar] [CrossRef] [PubMed]
- Liu, X.P.; Hawkins, C.; Peel, M.D.; Yu, L.X. Genetic loci associated with salt tolerance in advanced breeding populations of tetraploid alfalfa using genome-wide association studies. Plant Genome 2019, 12, 180026. [Google Scholar] [CrossRef]
- Yamazaki, K.; Ishimori, M.; Kajiya-Kanegae, H.; Takanashi, H.; Fujimoto, M.; Yoneda, J.-I.; Yano, K.; Koshiba, T.; Tanaka, R.; Iwata, H.; et al. Effect of salt tolerance on biomass production in a large population of sorghum accessions. Breed. Sci. 2020, 70, 167–175. [Google Scholar] [CrossRef]
- Arif, Y.; Singh, P.; Siddiqui, H.; Bajguz, A.; Hayat, S. Salinity induced physiological and biochemical changes in plants: An omic approach towards salt stress tolerance. Plant Physiol. Biochem. 2020, 156, 64–77. [Google Scholar] [CrossRef]
- Bernstein, N. Plants and Salt: Plant Response and Adaptations to Salinity, in Model Ecosystems in Extreme Environments; Elsevier: Amsterdam, The Netherlands, 2019; pp. 101–112. [Google Scholar]
- Silveira, J.A.G.; Araújo, S.A.M.; Lima, J.P.M.S.; Viégas, R.A. Roots and leaves display contrasting osmotic adjustment mechanisms in response to NaCl-salinity in Atriplex nummularia. Environ. Exp. Bot. 2009, 66, 1–8. [Google Scholar] [CrossRef]
- Xiong, L.; Zhu, J.K. Molecular and genetic aspects of plant responses to osmotic stress. Plant Cell Environ. 2002, 25, 131–139. [Google Scholar] [CrossRef] [PubMed]
- Hawtin, G.; Iwanaga, M.; Hodgkin, T. Genetic resources in breeding for adaptation. In Proceedings of the Adaptation in Plant Breeding: Selected Papers from the XIV EUCARPIA Congress on Adaptation in Plant Breeding, Jyväskylä, Sweden, 31 July–4 August 1995; Springer: Berlin/Heidelberg, Germany, 1997. [Google Scholar]
- Arzani, A.; Ashraf, M. Smart engineering of genetic resources for enhanced salinity tolerance in crop plants. Crit. Rev. Plant Sci. 2016, 35, 146–189. [Google Scholar] [CrossRef]
- Morton, M.J.; Awlia, M.; Al Tamimi, N.; Saade, S.; Pailles, Y.; Negrão, S.; Tester, M. Salt stress under the scalpel–dissecting the genetics of salt tolerance. Plant J. 2019, 97, 148–163. [Google Scholar] [CrossRef] [PubMed]
- Vamerali, T.; Saccomani, M.; Bona, S.; Mosca, G.; Guarise, M.; Ganis, A. A comparison of root characteristics in relation to nutrient and water stress in two maize hybrids. In Proceedings of the Roots: The Dynamic Interface between Plants and the Earth: The 6th Symposium of the International Society of Root Research, Nagoya, Japan, 11–15 November 2001; Springer: Berlin/Heidelberg, Germany, 2003. [Google Scholar]
- Franco, J.; Bañón, S.; Vicente, M.J.; Miralles, J.; Martínez-Sánchez, J.J. Root development in horticultural plants grown under abiotic stress conditions—A review. J. Hortic. Sci. Biotechnol. 2011, 86, 543–556. [Google Scholar] [CrossRef]
- Peterson, B.K.; Weber, J.N.; Kay, E.H.; Fisher, H.S.; Hoekstra, H.E. Double digest RADseq: Inexpensive Method De Novo SNP Discovery and genotyping in model and non-model species. PLoS ONE 2012, 7, e37135. [Google Scholar] [CrossRef]
- Bradbury, P.J.; Zhang, Z.; Kroon, D.E.; Casstevens, T.M.; Ramdoss, Y.; Buckler, E.S. TASSEL: Software for association mapping of complex traits in diverse samples. Bioinformatics 2007, 23, 2633–2635. [Google Scholar] [CrossRef]


| Traits (Unit) | Control | 3000 ppm | 6000 ppm | MM | ||||||||||||||
|---|---|---|---|---|---|---|---|---|---|---|---|---|---|---|---|---|---|---|
| Min | Max | Avg | SE | H2 | Min | Max | Avg | SE | H2 | Min | Max | Avg | SE | H2 | T | G | GxT | |
| LN | 19.85 | 22.00 | 20.93 | 0.49 | 0.87 | 26.80 | 29.03 | 27.92 | 0.52 | 0.69 | 27.28 | 29.50 | 28.39 | 0.52 | 0.51 | 0.00 | 0.00 | 0.00 |
| BN | 1.78 | 2.27 | 2.03 | 0.09 | 0.43 | 1.95 | 2.43 | 2.19 | 0.10 | 0.44 | 2.56 | 3.04 | 2.80 | 0.10 | 0.44 | 0.00 | 0.00 | 0.00 |
| PH (cm) | 15.52 | 16.40 | 15.96 | 0.22 | 0.78 | 15.78 | 16.71 | 16.25 | 0.24 | 0.55 | 15.78 | 16.71 | 16.25 | 0.24 | 0.52 | 0.04 | 0.00 | 0.00 |
| FW (g) | 1.05 | 1.49 | 1.27 | 0.11 | 0.56 | 0.86 | 1.33 | 1.08 | 0.12 | 0.67 | 0.87 | 1.32 | 1.09 | 0.12 | 0.52 | 0.50 | 0.00 | 0.00 |
| DW (g) | 0.32 | 0.81 | 0.56 | 0.13 | 0.49 | 0.37 | 0.90 | 0.63 | 0.13 | 0.46 | 0.70 | 1.20 | 0.95 | 0.13 | 0.42 | 0.08 | 0.00 | 0.00 |
| RD (cm) | 12.53 | 14.30 | 13.41 | 0.33 | 0.68 | 11.76 | 13.51 | 12.64 | 0.35 | 0.55 | 12.87 | 14.63 | 13.75 | 0.34 | 0.43 | 0.00 | 0.00 | 0.00 |
| Trait | Marker | −Log10 (p) | R2 | Allele | Effect |
|---|---|---|---|---|---|
| LN_C | dDocent_Contig_30812_276 | 4.0 | 0.16 | A(G) | −10.21 |
| LN_C | dDocent_Contig_45644_257 | 4.0 | 0.16 | A(C) | 9.21 |
| LN_3000 | dDocent_Contig_9350_202 | 4.1 | 0.20 | G(T) | −18.12 |
| LN_6000 | dDocent_Contig_31894_14 | 4.0 | 0.18 | C(T) | 16.03 |
| LN_6000 | dDocent_Contig_47529_298 | 4.9 | 0.22 | A(G) | −34.51 |
| BN_6000 | dDocent_Contig_1933_583 | 4.1 | 0.18 | A(G) | 6.25 |
| BN_6000 | dDocent_Contig_1933_593 | 4.1 | 0.18 | C(T) | −6.25 |
| BN_6000 | dDocent_Contig_29601_61 | 4.0 | 0.18 | C(T) | 6.73 |
| BN_6000 | dDocent_Contig_29746_105 | 4.0 | 0.23 | G(T) | 16.60 |
| BN_6000 | dDocent_Contig_29746_130 | 4.0 | 0.23 | C(G) | 16.60 |
| BN_6000 | dDocent_Contig_29746_136 | 4.0 | 0.23 | C(G) | 16.60 |
| BN_6000 | dDocent_Contig_29746_145 | 4.0 | 0.23 | C(G) | 16.60 |
| BN_6000 | dDocent_Contig_29746_24 | 4.0 | 0.23 | C(T) | 16.60 |
| BN_6000 | dDocent_Contig_29746_254 | 4.0 | 0.23 | C(G) | 16.60 |
| BN_6000 | dDocent_Contig_29746_281 | 4.0 | 0.23 | A(G) | 16.60 |
| BN_6000 | dDocent_Contig_29746_7 | 4.0 | 0.23 | A(G) | 16.60 |
| BN_6000 | dDocent_Contig_29746_96 | 4.0 | 0.23 | C(G) | 16.60 |
| BN_6000 | dDocent_Contig_6519_195 | 4.0 | 0.18 | C(T) | −5.39 |
| BN_6000 | dDocent_Contig_797_289 | 4.9 | 0.23 | A(G) | −8.46 |
| PH_C | dDocent_Contig_373_122 | 4.0 | 0.17 | C(T) | −3.69 |
| PH_3000 | dDocent_Contig_40266_46 | 4.4 | 0.21 | A(G) | 4.46 |
| PH_6000 | dDocent_Contig_6598_111 | 4.0 | 0.18 | G(T) | 4.61 |
| FW_6000 | dDocent_Contig_31699_109 | 4.1 | 0.18 | A(G) | 1.37 |
| FW_6000 | dDocent_Contig_31699_114 | 4.1 | 0.18 | C(G) | 1.37 |
| FW_6000 | dDocent_Contig_31699_37 | 4.1 | 0.18 | C(T) | 1.37 |
| FW_6000 | dDocent_Contig_31699_8 | 4.1 | 0.18 | A(G) | −1.37 |
| WC_C | dDocent_Contig_3179_151 | 4.8 | 0.21 | C(G) | −0.07 |
| RD_C | dDocent_Contig_53508_178 | 4.5 | 0.19 | A(T) | −2.11 |
| Trait | Marker | −Log10 (p) | R2 | Allele | Effect |
|---|---|---|---|---|---|
| FW/DW_C | dDocent_Contig_30841_53 | 4.2 | 0.17 | C(T) | 2.01 |
| 4 | 0.17 | C(T) | 4.22 | ||
| dDocent_Contig_31124_100 | 4.3 | 0.18 | C(T) | −1.88 | |
| 4.2 | 0.18 | C(T) | −3.98 | ||
| dDocent_Contig_31124_249 | 4.7 | 0.2 | A(G) | −1.98 | |
| 4.6 | 0.2 | A(G) | −4.25 | ||
| dDocent_Contig_31124_47 | 4.8 | 0.21 | A(T) | 2.19 | |
| 4.6 | 0.2 | A(T) | 4.64 | ||
| dDocent_Contig_35845_179 | 3.9 | 0.16 | A(G) | −1.93 | |
| 4 | 0.16 | A(G) | −4.19 | ||
| dDocent_Contig_35845_189 | 3.9 | 0.16 | A(G) | −1.93 | |
| 4 | 0.16 | A(G) | −4.19 | ||
| dDocent_Contig_36571_20 | 4 | 0.16 | A(T) | −0.12 | |
| 3.5 | 0.14 | A(T) | −0.37 | ||
| dDocent_Contig_43254_163 | 5.2 | 0.23 | C(T) | −2.56 | |
| 4.9 | 0.22 | C(T) | −5.36 | ||
| dDocent_Contig_43254_80 | 5 | 0.22 | G(T) | −2.51 | |
| 4.8 | 0.21 | G(T) | −5.3 | ||
| dDocent_Contig_49746_342 | 4 | 0.21 | A(G) | −4.6 | |
| 4.1 | 0.22 | A(G) | −10.2 | ||
| dDocent_Contig_5198_91 | 4.4 | 0.19 | A(G) | −2.08 | |
| 4.7 | 0.2 | A(G) | −4.66 | ||
| dDocent_Contig_57115_226 | 3.9 | 0.2 | A(T) | −4.9 | |
| 4.9 | 0.26 | A(T) | −13.6 | ||
| dDocent_Contig_6156_243 | 3.6 | 0.14 | A(G) | −1.32 | |
| 4 | 0.16 | A(G) | −3.04 | ||
| dDocent_Contig_63002_15 | 4.3 | 0.22 | C(T) | −4.90 | |
| 4.1 | 0.22 | C(T) | −10.30 | ||
| FW/DW_3000 | dDocent_Contig_35199_79 | 3 | 0.1323 | G(T) | −0.20 |
| 3 | 0.13144 | G(T) | −0.34 | ||
| dDocent_Contig_64264_238 | 3.7 | 0.17492 | A(G) | −0.23 | |
| 3 | 0.1342 | A(G) | −0.33 | ||
| dDocent_Contig_64858_150 | 3.3 | 0.1699 | C(G) | −0.24 | |
| 3.5 | 0.18123 | C(G) | −0.43 | ||
| dDocent_Contig_85747_243 | 3.7 | 0.1758 | C(T) | −0.24 | |
| 3.6 | 0.1653 | C(T) | −0.38 | ||
| dDocent_Contig_9501_294 | 3.2 | 0.14269 | A(C) | 0.26 | |
| 3.1 | 0.13883 | A(C) | 0.43 | ||
| dDocent_Contig_95794_210 | 3.4 | 0.15403 | A(C) | 0.46 | |
| 3.7 | 0.17421 | A(C) | 0.82 | ||
| FW/DW_6000 | dDocent_Contig_61819_183 | 3.3 | 0.16 | C(T) | −0.35 |
| 4.2 | 0.22 | C(T) | −0.71 | ||
| dDocent_Contig_58866_61 | 4 | 0.18 | C(T) | 0.36 | |
| 4.2 | 0.19 | C(T) | 0.65 | ||
| dDocent_Contig_39980_178 | 4.6 | 0.21 | A(G) | −0.52 | |
| 4.1 | 0.18 | A(G) | −0.87 | ||
| dDocent_Contig_10975_317 | 3.7 | 0.16 | G(T) | 0.71 | |
| 5.1 | 0.24 | G(T) | 1.52 | ||
| dDocent_Contig_12419_342 | 3.4 | 0.14 | A(T) | −0.69 | |
| 4.9 | 0.23 | A(T) | −1.54 | ||
| dDocent_Contig_31895_105 | 4.1 | 0.18 | C(T) | −0.73 | |
| 3.7 | 0.16 | C(T) | −1.2 |
Disclaimer/Publisher’s Note: The statements, opinions and data contained in all publications are solely those of the individual author(s) and contributor(s) and not of MDPI and/or the editor(s). MDPI and/or the editor(s) disclaim responsibility for any injury to people or property resulting from any ideas, methods, instructions or products referred to in the content. |
© 2024 by the authors. Licensee MDPI, Basel, Switzerland. This article is an open access article distributed under the terms and conditions of the Creative Commons Attribution (CC BY) license (https://creativecommons.org/licenses/by/4.0/).
Share and Cite
Dobeie, A.M.; Nemr, R.A.; Abd El-Wahab, M.M.H.; Shahba, M.; El-Soda, M. Mapping Single Nucleotide Polymorphism Markers Associated with the Pre-Flowering Morphological Performance of Fenugreek under Different Levels of Salt Stress. Stresses 2024, 4, 282-292. https://doi.org/10.3390/stresses4020017
Dobeie AM, Nemr RA, Abd El-Wahab MMH, Shahba M, El-Soda M. Mapping Single Nucleotide Polymorphism Markers Associated with the Pre-Flowering Morphological Performance of Fenugreek under Different Levels of Salt Stress. Stresses. 2024; 4(2):282-292. https://doi.org/10.3390/stresses4020017
Chicago/Turabian StyleDobeie, Amani Mahmoud, Rahma A. Nemr, Mustafa M. H. Abd El-Wahab, Mohamed Shahba, and Mohamed El-Soda. 2024. "Mapping Single Nucleotide Polymorphism Markers Associated with the Pre-Flowering Morphological Performance of Fenugreek under Different Levels of Salt Stress" Stresses 4, no. 2: 282-292. https://doi.org/10.3390/stresses4020017
APA StyleDobeie, A. M., Nemr, R. A., Abd El-Wahab, M. M. H., Shahba, M., & El-Soda, M. (2024). Mapping Single Nucleotide Polymorphism Markers Associated with the Pre-Flowering Morphological Performance of Fenugreek under Different Levels of Salt Stress. Stresses, 4(2), 282-292. https://doi.org/10.3390/stresses4020017