Article

Excited-State Dynamics of Carbazole and tert-Butyl-Carbazole in Thin Films

Physical Chemistry 2, Department Chemistry and Biology, Faculty IV: School of Science and Technology, University of Siegen, Adolf-Reichwein-Str. 2, 57076 Siegen, Germany
*
Author to whom correspondence should be addressed.
Photochem 2024, 4(2), 179-197; https://doi.org/10.3390/photochem4020011
Submission received: 31 January 2024 / Revised: 31 March 2024 / Accepted: 2 April 2024 / Published: 9 April 2024
(This article belongs to the Special Issue Feature Papers in Photochemistry II)

Abstract

:
Thin films of carbazole (Cz) derivatives are frequently used in organic electronics, such as organic light-emitting diodes (OLEDs). Because of the proximity of the Cz units, the excited-state relaxation in such films is complicated, as intermolecular pathways, such as singlet–singlet annihilation (SSA), kinetically compete with the emission. Here, we provide an investigation of two benchmark systems employing neat carbazole and 3,6-di-tert-butylcarbazole (t-Bu-Cz) films and also their thin film blends with poly(methyl methacrylate) (PMMA). These are investigated by a combination of atomic force microscopy (AFM), femtosecond and nanosecond transient absorption spectroscopy (fs-TA and ns-TA) and time-resolved fluorescence. Excitonic J-aggregate-type features are observed in the steady-state absorption and emission spectra of the neat films. The S1 state shows a broad excited-state absorption (ESA) spanning the entire UV–Vis–NIR range. At high S1 exciton number densities of about 4 × 1018 cm−3, bimolecular diffusive S1–S1 annihilation is found to be the dominant SSA process in the neat films with a rate constant in the range of 1–2 × 10⁻⁸ cm3 s−1. SSA produces highly vibrationally excited molecules in the electronic ground state (S0*), which cool down slowly by heat transfer to the quartz substrate. The results provide relevant photophysical insight for a better microscopic understanding of carbazole relaxation in thin-film environments.

Graphical Abstract

1. Introduction

Thin films composed of carbazole-based compounds are ubiquitous materials in organic and hybrid organic–inorganic electronics, where they serve as light harvesters for organic solar cells [1], host materials [2], hole transport layers [3] and efficient emitters of visible light [4]. In these applications, thin films of carbazole-containing materials are used, which are either produced by physical vapor deposition (PVD) or wet-chemical methods such as spin-coating [5]. Under typical operating conditions involving high exciton number densities, e.g., in OLEDs, the emission process of carbazole-containing compounds is in kinetic competition with intermolecular channels, such as singlet–singlet annihilation, singlet–triplet annihilation (STA), singlet–heat annihilation (SHA) or triplet–triplet annihilation (TTA) [6,7]. Therefore, it is important to understand the dynamics of these processes and extract relevant kinetic parameters for the annihilation steps, which can be used in the modeling of OLED operation.
In the current contribution, we focus on thin films of the parent compound Cz and its substituted analog t-Bu-Cz. Basic optical properties of monocrystalline Cz thin films have been explored previously [8,9,10,11,12], but time-resolved optical studies of Cz and related film compounds combining ultrafast transient absorption and emission techniques have been performed rarely [13]. Yet, such techniques can provide profound insight into the singlet exciton dynamics in these films. For other systems, time-resolved studies of SSA processes have been performed largely by fluorescence-based techniques [7,14,15,16,17,18,19,20,21,22,23]. Such measurements detect the decay of the S1 exciton emission and are sensitive even at low exciton number densities [24]. However, they might have some drawbacks in terms of interference by fluorescing impurities and limited time resolution (especially for studies at high exciton number densities). Transient absorption studies tracking the decay of the S1 → Sn excited-state absorption bands have been performed more rarely [25,26,27,28,29]. While not being as sensitive as fluorescence detection, such TA methods with femtosecond time resolution can detect SSA processes even at very high exciton number densities and are at the same time much less prone to the interference of impurities, in contrast to emission studies, where a trace impurity or an impurity-induced crystal defect with high radiative quantum yield can overwhelm the signal of interest [24,30,31].
Here, we provide a detailed investigation of spin-coated Cz and t-Bu-Cz thin films and their blends with PMMA using a combination of atomic force microscopy, steady-state absorption and emission, transient fluorescence and ultrafast broadband transient absorption spectroscopy to extract key kinetic parameters, such as the S1 lifetime at low exciton number densities, the rate constant for the SSA processes at high exciton number densities and the time scale for the cooling of the highly vibrationally excited ground state species produced by the SSA process.

2. Materials and Methods

2.1. Preparation of Thin Films

Solutions of carbazole (TCI Deutschland, Eschborn, Germany, high purity), 3,6-di-tert-butyl-carbazole (TCI Deutschland, >98.0%) and PMMA (Alfa Aesar, Ward Hill, MA, USA) were prepared in N2-saturated tetrahydrofuran (Merck, Darmstadt, Germany, Uvasol, ≥99.9%) to obtain solutions corresponding to a mass concentration of 5 mg mL−1. These solutions were passed through a PTFE filter (pore size 0.45 μm) to remove any residual particles and subsequently employed to produce solutions of PMMA:Cz and PMMA:t-Bu-Cz with nominal weight percent (wt%) ratios of 0:100, 70:30, 90:10 and 98:2. Quartz substrates (Tempotec Optics Co., Ltd., Fuzhou, China, JGS1) were pre-cleaned with acetonitrile (Merck, Uvasol, ≥99.9%) and irradiated by UV light (Dinies, Villingendorf, Germany, 2 UVC lamps with 253.7 nm emission, 11 W each) for 60 min to remove organic contaminants. Spin-coating was performed under a nitrogen atmosphere (Messer, Bad Soden im Taunus, Germany, 5.0) in a glovebox by depositing ca. 200 μL of a solution on the quartz substrate, followed by a loading time of 30 s and a spinning period of 1 min at 500 rpm.

2.2. Atomic Force Microscopy and X-ray Diffraction Experiments

Topography images of the Cz and t-Bu-Cz thin films were obtained using an atomic force microscope (PSIA XE-100, Park Systems Corp., Suwon, Republic of Korea) with a silicon tip cantilever in non-contact mode. Images were taken with a resolution of 128 times 128 pixels for an area of 30 × 30 μm2 and a scan rate of 0.1 Hz to provide an overview of the surfaces. Furthermore, to estimate the thickness of the corresponding thin film, the surface was intentionally scratched. Alongside this scratch, AFM images were recorded with a resolution of 4096 times 64 pixels for an area of 60 × 2 μm2 and a scan rate of 0.1 Hz. All images were evaluated using XEI software (version 4.3.4, Park Systems Corp.), and visualization was performed by using OriginPro 2023b (OriginLab Corp., Northampton, MA, USA). The forward and backward scans were averaged, and a background correction was carried out for all AFM images.
Thin-film X-ray diffraction experiments were carried out using a PANalytical X’Pert MPD PRO diffractometer employing Cu radiation (Kα1 = 1.54060 Å, Kα2 = 1.54443 Å). The diffractograms were simulated using Rietveld refinement, as implemented in the program MAUD, including the fitting of the baseline and also considering texture effects [32].

2.3. Steady-State Absorption and Photoluminescence

Steady-state absorption measurements of the thin films were carried out in transmission at normal incidence using a double-beam spectrophotometer (Varian Inc., Palo Alto, CA, USA, Cary 5000, spectral bandwidth: 0.5 nm). Steady-state emission and photoluminescence excitation spectra were recorded on a fluorescence spectrophotometer (Agilent, Santa Clara, CA, USA, Cary Eclipse, spectral bandwidth for excitation and emission: 5 nm). The photoluminescence spectra were corrected by a calibration function that included the wavelength-dependent sensitivity of the emission spectrograph and the detector.

2.4. Time-Correlated Single-Photon Counting (TCSPC)

Pulses of a UV-LED (Becker & Hickl, Berlin, Germany, UVL-FB-270, wavelength: 273 nm, pulse width: 500 ps) at a repetition frequency of 1 MHz were sent through a wire-grid linear polarizer (Thorlabs, Newton, NJ, USA, WP25M-UB) set at vertical polarization (0°) to excite the respective thin-film sample at an angle of 45° relative to the surface normal, with the thin-film layer facing the beam. The photoluminescence emitted at an angle of 90° was collimated by a quartz lens and then passed through another wire-grid linear polarizer, with its plane of polarization oriented at 54.7° (magic angle). A well-defined spectral window of the PL emission was selected by appropriate bandpass filters (Thorlabs) and imaged onto a hybrid-alkali photodetector (Becker & Hickl, HPM-100-07). Its signal was fed into a TCSPC module operated in reverse start–stop configuration (Becker & Hickl, SPC-130IN). The kinetic traces were analyzed by the FAST program (Edinburgh Instruments, Livingston, UK, version 3.5.2) using a sum of exponential functions and an iterative reconvolution procedure that involved an instrument response function (IRF), which was obtained either from the LED scattering signal of a diluted suspension of colloidal SiO2 nanoparticles (Merck, Ludox AS-40) in water or a quartz diffuser (Thorlabs DGUV10-120 or DGUV10-1500).

2.5. Broadband Transient Absorption Spectroscopy

Ultrafast broadband transient absorption experiments were carried out using the pump–supercontinuum probe (PSCP) method [33] on two setups dedicated to measurements in the UV–Vis [34] and NIR regions [35]. They are both based on a regeneratively amplified titanium:sapphire laser system (Coherent, Santa Clara, CA, USA, Libra USP-HE) operating at a repetition frequency of 920 Hz. The thin films were excited at a repetition frequency of 460 Hz by an OPA system running at a wavelength of 260 nm (Coherent, OPerA Solo). The overall time resolution was about 80 fs, and time delays up to 1500 ps were accessible. In order to perform measurements covering longer delay times up to 10 μs, the fourth harmonic (266 nm) of a Q-switched Nd:YAG microlaser (Standa, Vilnius, Lithuania, Standa-Q1TH, pulse length 420 ps) was employed [36]. The laser was electronically triggered at 460 Hz and synchronized with the probe beam of the ultrafast broadband transient absorption system by means of a delay generator (Stanford Research Systems, Sunnyvale, CA, USA, DG535). The thin films were mounted inside a home-built N2-flushed aluminum cell and constantly translated by two piezo stages in the xy plane within a sample area of 2 × 2 mm2 during the experiments to minimize photochemical decomposition and local heating of the thin films, which could occur because of the exposure of the same sample area to repeated laser excitation.

3. Results

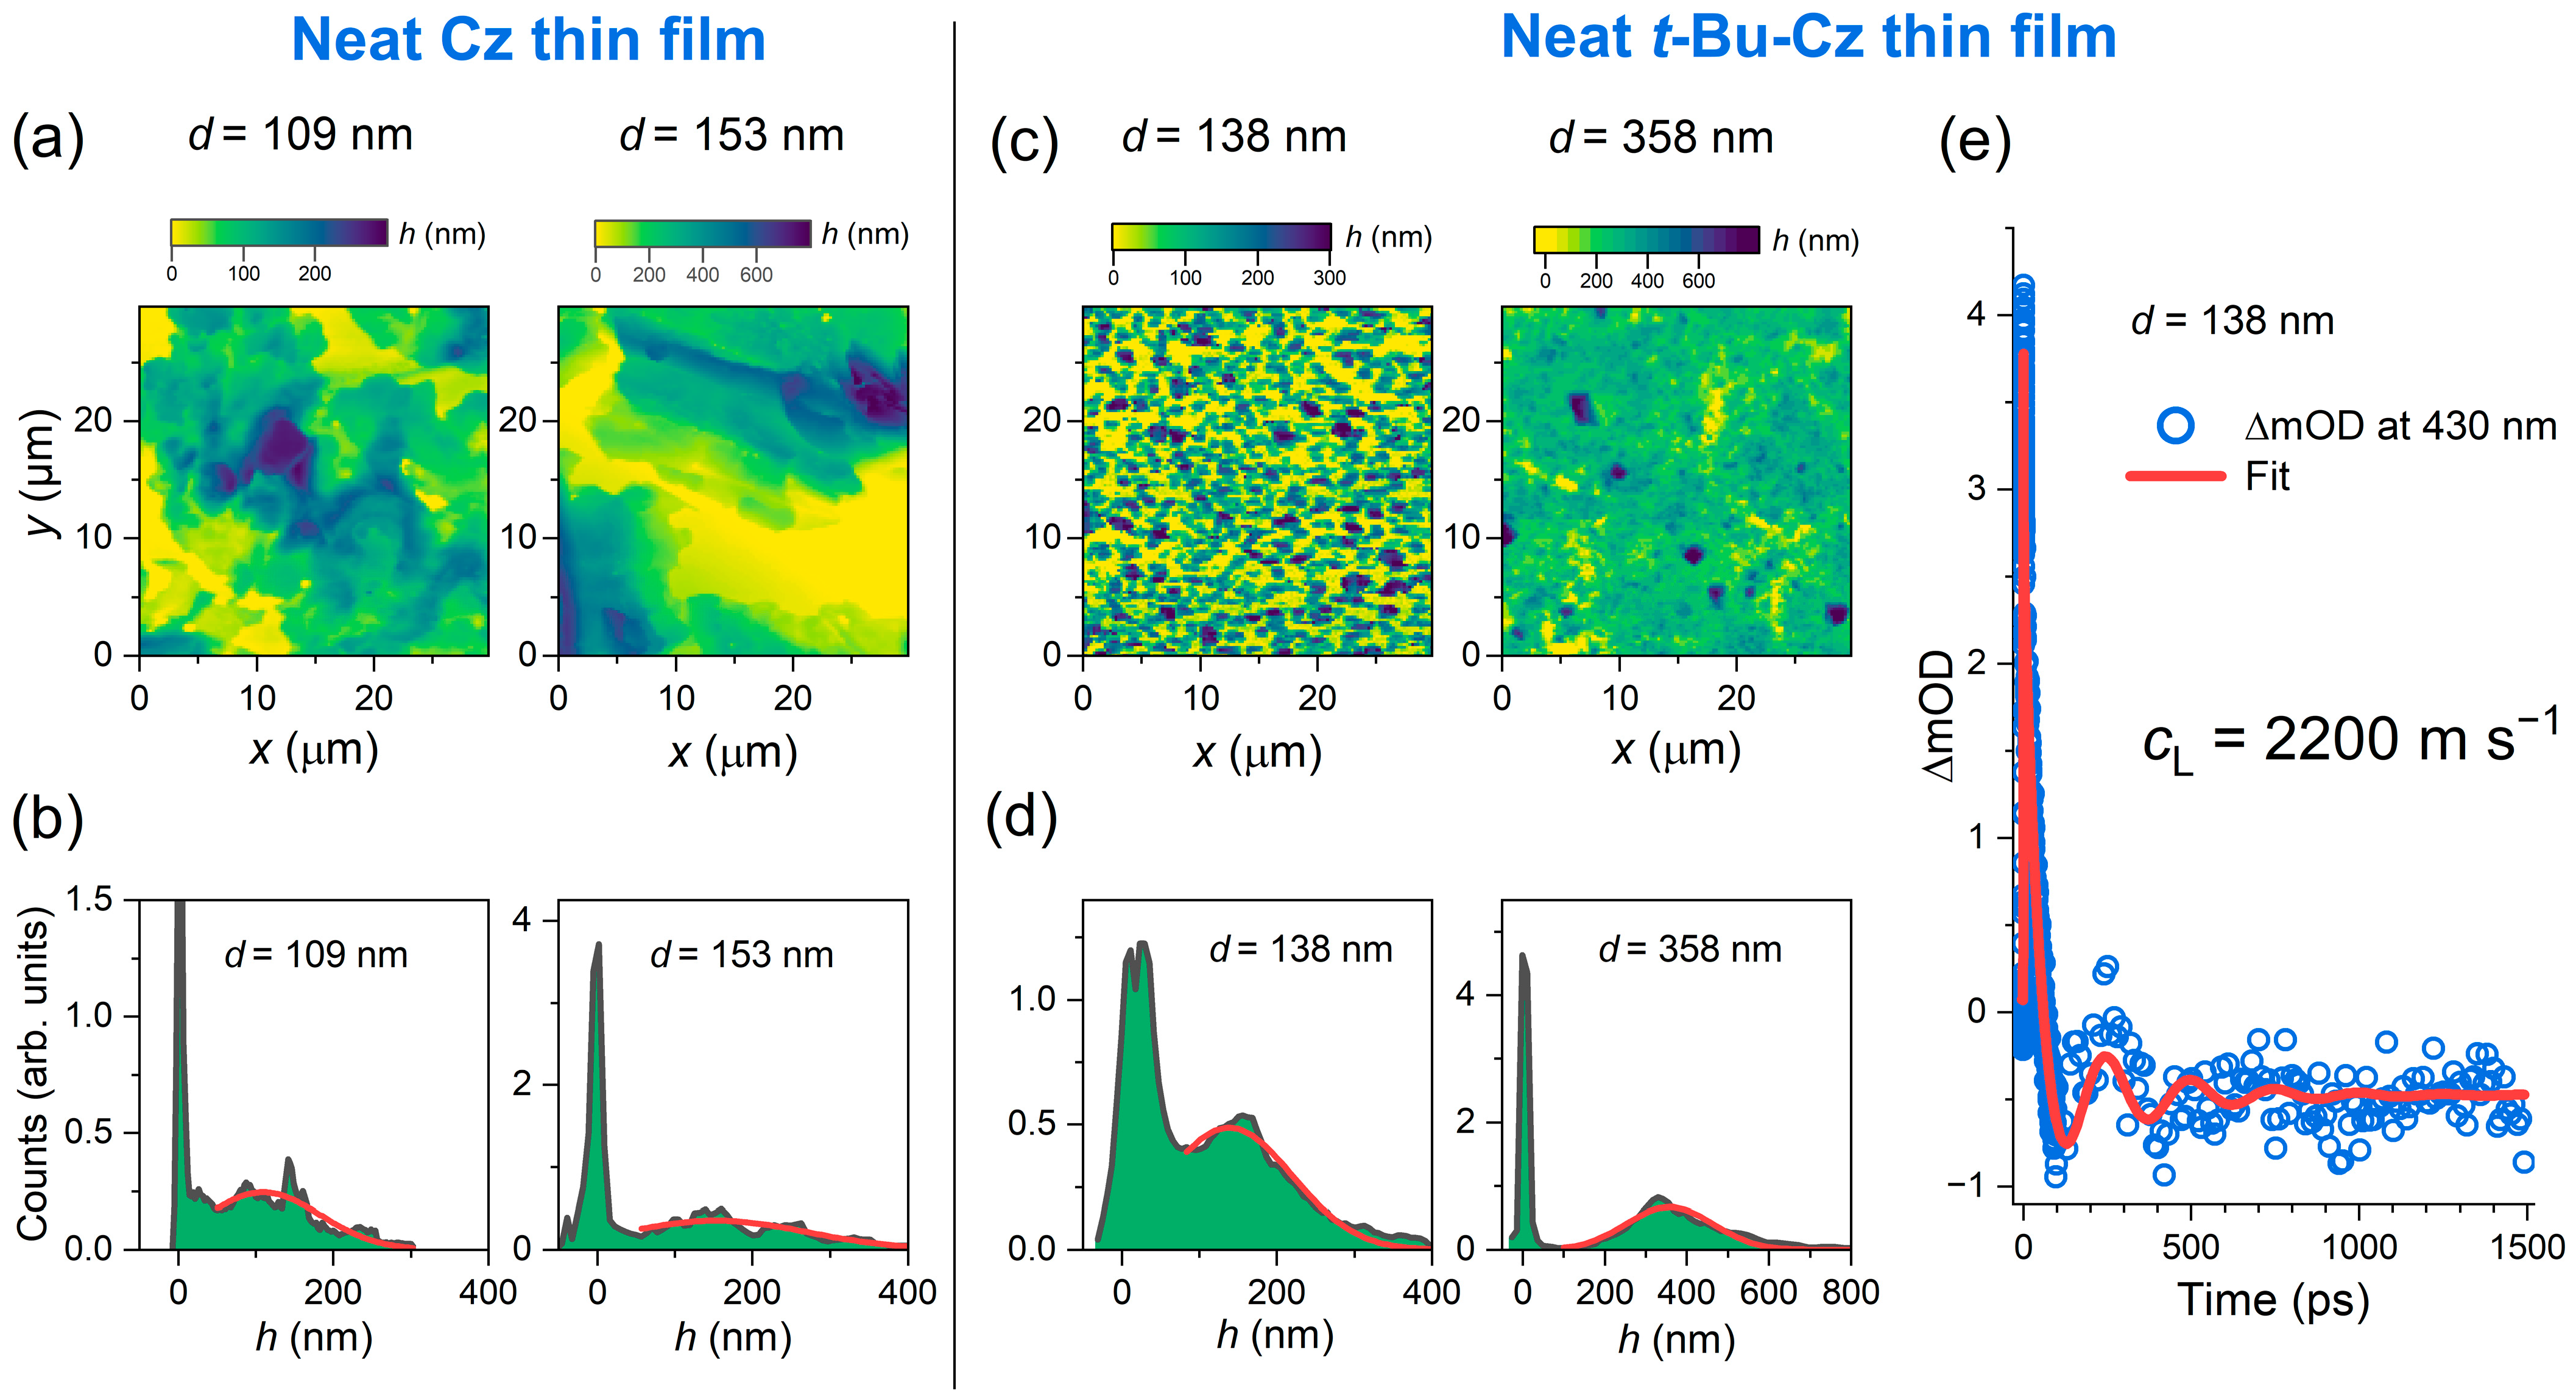
3.1. AFM Images and Picosecond Ultrasonics of Cz and t-Bu-Cz Thin Films on Quartz

Neat Cz and t-Bu-Cz thin films on quartz substrates were investigated by atomic force microscopy to determine their surface morphology. Figure 1a shows AFM images of a 30 × 30 μm2 area of two neat Cz thin films of different average thicknesses. They consist of microcrystallites with dimensions on the order of 10 μm. The film thickness was obtained by generating a histogram (height h vs. its frequency of occurrence in the AFM image), as shown in Figure 1b. The sharp spike near h = 0 arises from uncoated areas on the quartz substrate (yellow ranges in panel a). The broad distribution at larger values of h was fitted by a Gaussian function, leading to an average thickness d of 109 nm and 153 nm for the two films. Additional AFM images were recorded for two t-Bu-Cz thin films of different thicknesses, as shown in Figure 1c. Here, the size of the crystallites was much smaller, around 1 μm and below. Analysis of the histograms in panel d provided the average thickness of these two thin films as 138 nm and 358 nm, respectively.
In addition, we applied laser-based picosecond ultrasonics [37] to the thin films. These are transient absorption experiments in which an ultrafast pump laser pulse (here, 260 nm) generates a coherent acoustic phonon in the film. This longitudinal sound wave propagates back and forth between the two film interfaces (thin film/quartz and thin film/nitrogen gas) and induces a periodic modulation of the transient optical signal [38,39,40,41,42]. Damping of the longitudinal sound wave occurs only at the thin film/quartz interface [42]. A representative kinetics for the neat t-Bu-Cz thin film with a thickness of 138 nm is depicted in Figure 1e and shows a damped oscillatory decay. Such measurements provide “contact-free noninvasive” access to the longitudinal sound velocity of the thin film material via the expression cL = 4d/τa [38], where d is the film thickness and τa is the oscillation period of the coherent acoustic phonon. Fitting the kinetics in Figure 1e to the sum of two exponential decay functions and a damped cosine function provides a value of (251 ± 6) ps for τa, corresponding to a frequency of (3.99 ± 0.09) GHz. Using the known value of 138 nm for the average film thickness d, one obtains a value of (2200 ± 60) m s−1 for the longitudinal sound velocity cL. This value is in very good agreement with results from a previous study on the closely related compound N-isopropyl-carbazole, which provided values of 2150 m s−1 and 2250 m s−1 from a piezoelectric resonance–antiresonance measurement and an ultrasonic pulse-echo experiment [43]. It also compares well with previous studies of other organic layers, such as polyfluorene-based copolymers [42], where values of about 2500 m s−1 were obtained. Knowing this longitudinal sound velocity makes it possible to optically determine the thickness of other t-Bu-Cz thin films via the relation d = 0.25·cL·τa in an all-optical fashion.
The value of cL for Cz thin films should be very similar; however, we note that we were not able to obtain clean oscillatory kinetics exceeding the noise level of the transient absorption experiments for Cz thin films. It could be that the interface of the large crystallites (cf. Figure 1a) is very rough, so the reflection of the sound wave at the thin film/nitrogen gas interface occurs in several directions. This could result in a very weak oscillatory response. In contrast, the situation is much less critical for smooth copolymer films with homogeneous thickness, as demonstrated in previous measurements using picosecond ultrasonics [42].

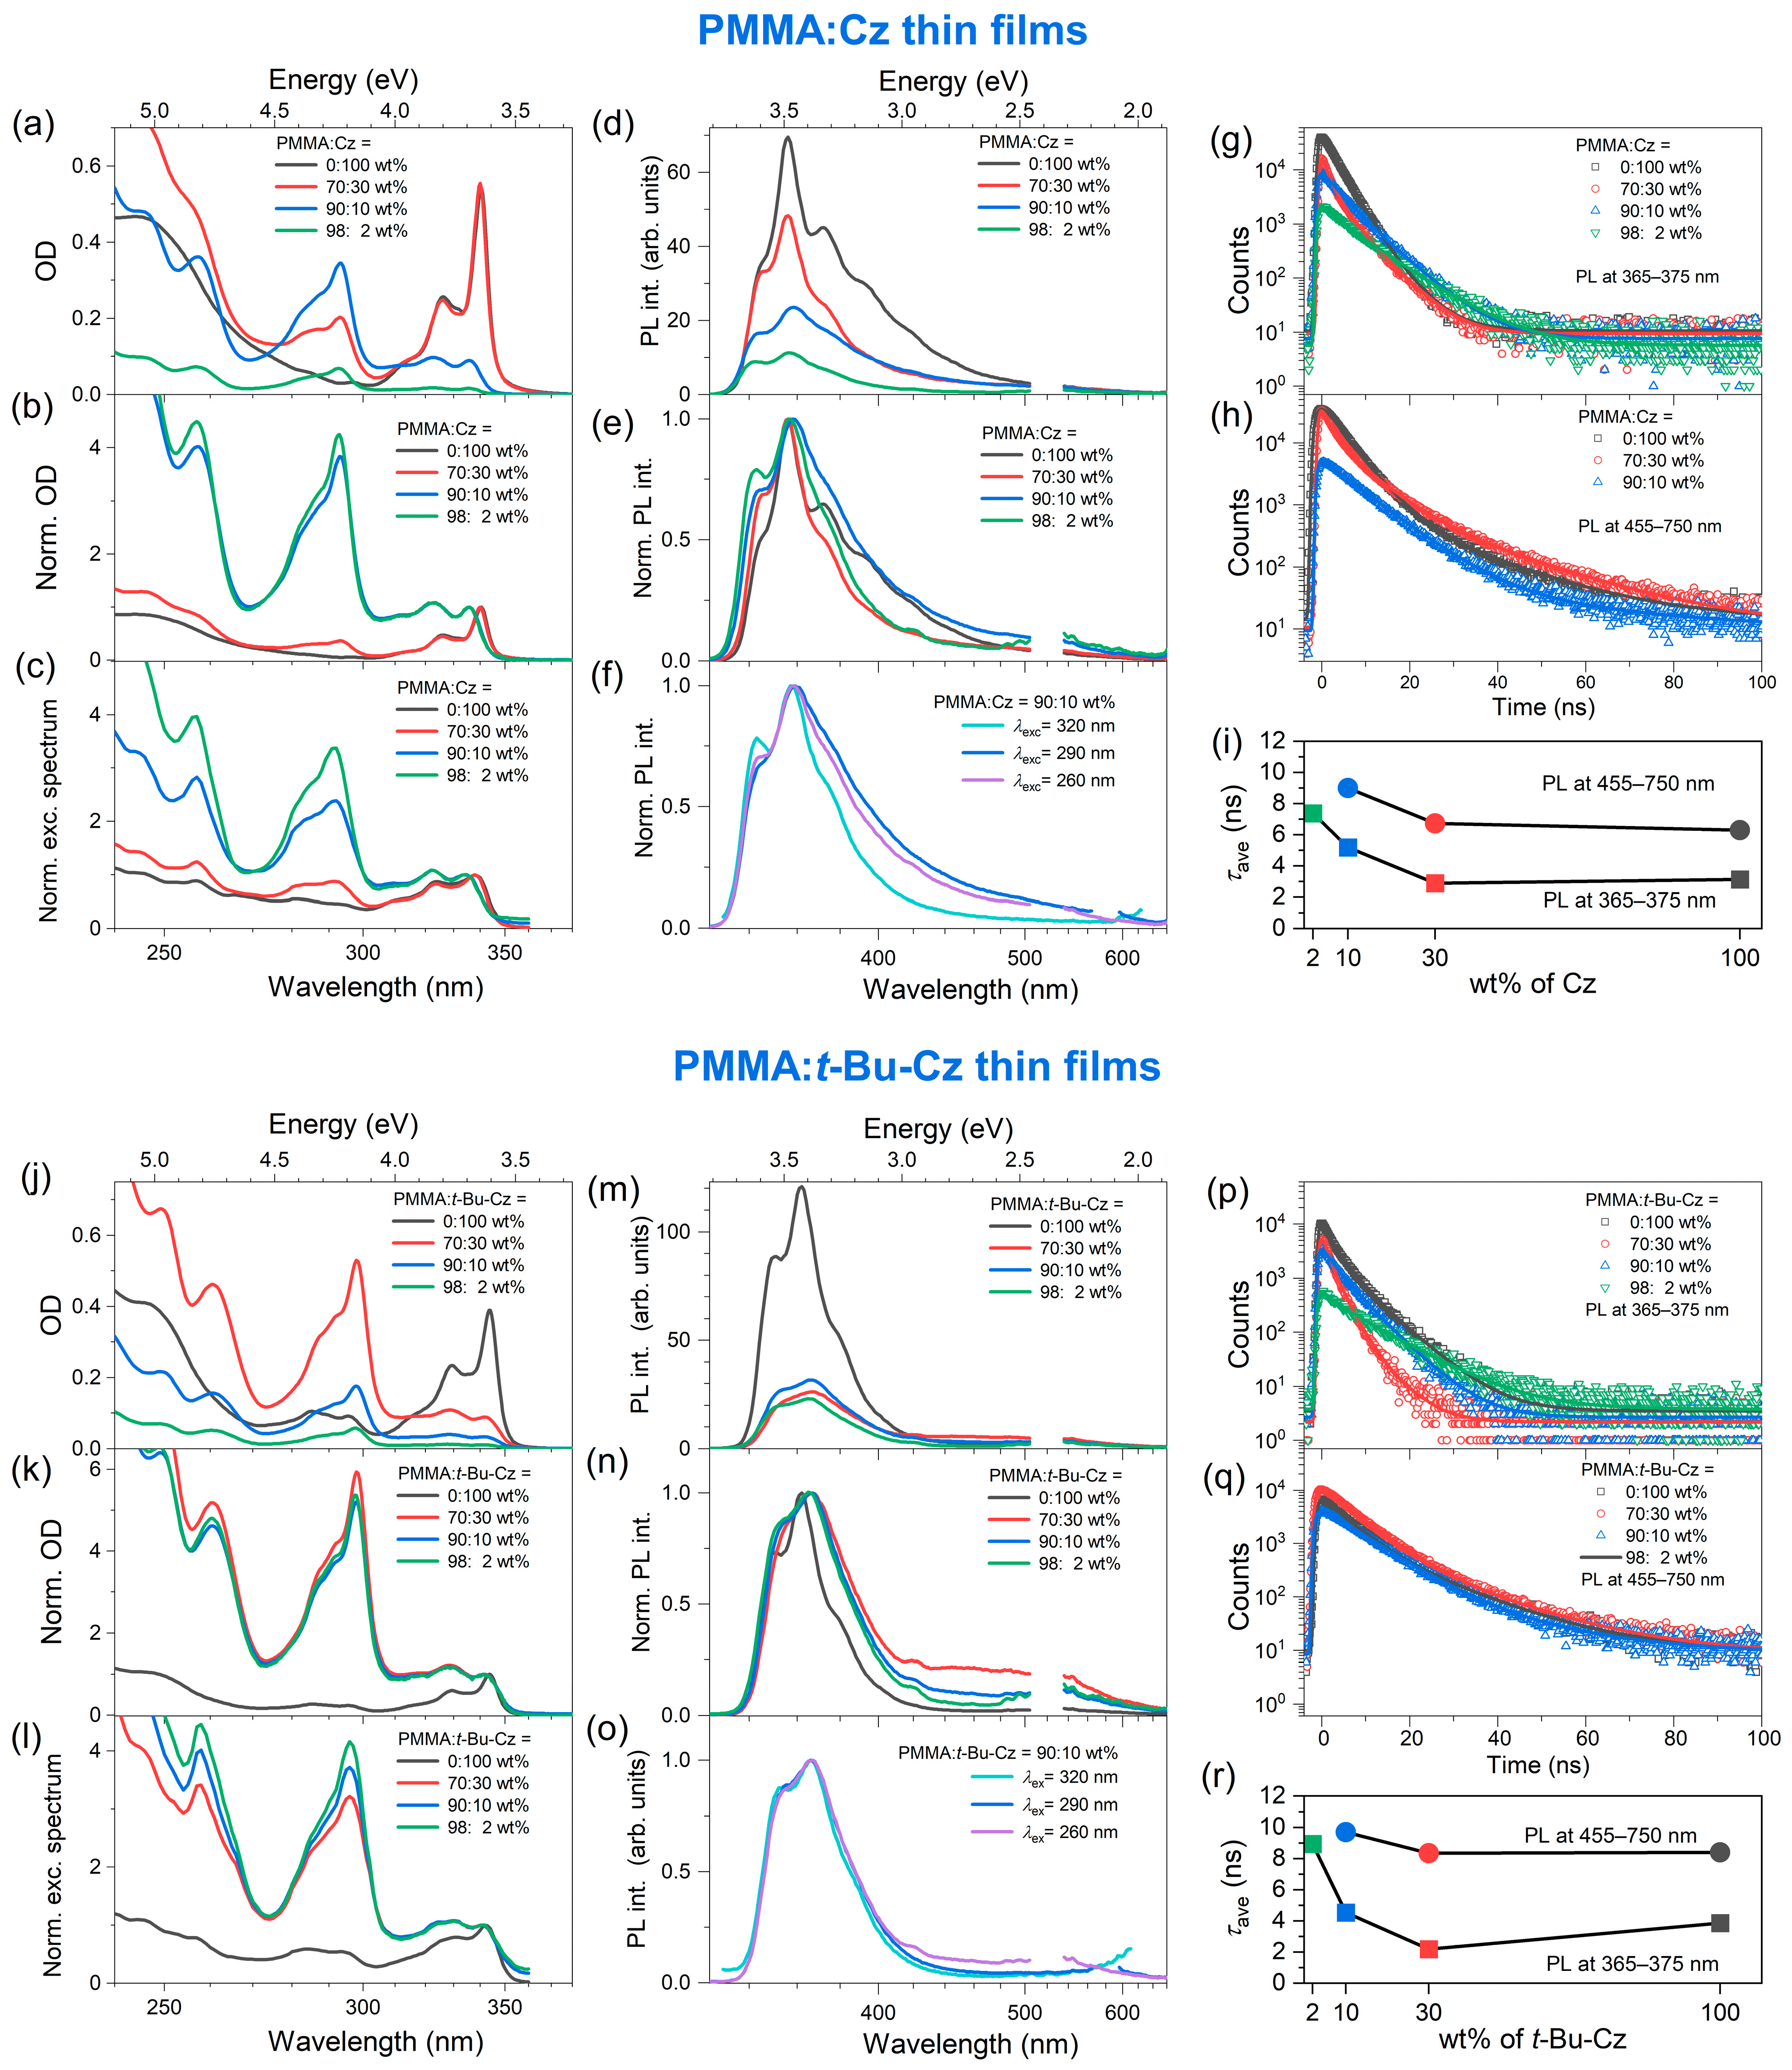
3.2. Steady-State Absorption, Photoluminescence and Transient Emission of the Thin Films

The panels a and b in Figure 2 contain the absolute and normalized steady-state absorption spectra (recorded in transmission at normal incidence) of neat Cz and t-Bu-Cz thin films as well as PMMA:Cz and PMMA:t-Bu-Cz thin film blends with weight percent ratios of 98:2, 90:10 and 70:30. The structured absorption band rising below 350 nm corresponds to the S0(A1) → S1(A1) transition, which is short-axis polarized [10,44,45,46]. In contrast, the S0(A1) → S2(B2) transition located at about 290 nm is long-axis polarized [10,45,47]. The absorption features at wavelengths below 270 nm represent a superposition of several electronic bands of A1 and B2 symmetry [47]. For a low content of Cz/t-Bu-Cz in the film (98:2 (green), 90:10 (blue)), the 0–1 transition of the S0 → S1 band is higher than the 0–0 transition, and also the amplitude of the S0 → S2 band is much higher than that of the S0 → S1 band. Both findings are in line with the typical behavior of Cz in organic solvents [45,48,49].
Drastic changes are observed for the neat Cz film (black) and the 70:30 wt% PMMA:Cz blend (red). For the neat Cz thin film, the S0(A1) → S2(B2) transition is not observable, and the absorbance below 270 nm is considerably reduced. This suggests that absorption contributions from long-axis polarized A1 → B2 transitions are “missing”. Based on the known crystal structure of carbazole [50,51], one can conclude that there must be a preferential growth of the microcrystallites (cf. Figure 1a), with the crystallographic ac plane of the unit cell oriented parallel to the substrate’s surface. We confirmed this in separate X-ray diffraction measurements (see Figures S1 and S2, Supporting Information). Therefore, the transition dipole moment of the A1 → B2 transitions lies parallel to the light propagation direction, and, as a result, these states cannot be photoexcited. Thus, only short-axis polarized A1 → A1 transitions can be observed in the spectrum of the neat thin films. For the 70:30 blend, the A1 → B2 transitions are still visible, but already their spectral amplitude is substantially reduced. Therefore, there already appear to be Cz domains that also exhibit preferential growth.
Another interesting effect in the spectra of the neat Cz film and the 70:30 wt% PMMA:Cz blend is the emergence of a pronounced absorption peak at 340 nm, which is red-shifted by about 50 meV (5 nm) compared with the S0(A1) → S1(A1) transition of the thin films having low Cz content. Based on the comparison with findings for thin films of aromatic molecules, such as tetracene [24], or polymer compounds [52], the spectral signature is compatible with the formation of J aggregates. The crystal structure of Cz [50,51] features a herringbone-type packing [53]. As shown by previous plane-wave DFT calculations [53], nearest-neighbor Cz–Cz dimer-type interactions in this crystal are predominantly of the J-aggregate-type, with a Cz–Cz spacing of 4.8–5.7 Å, whereas H-type dimer-type arrangements in the same structure show a much larger Cz–Cz spacing (9.9–11.5 Å). Therefore, it is understandable that contributions from J-type aggregation should have a more substantial impact on the absorption spectrum of these films. The fairly small aggregation-induced red-shift of the J-aggregate absorption band observed in our absorption spectrum of the Cz film is also compatible with the results of calculations for J-type dimers in the Cz crystal [53]. As a result, the experimental absorption spectrum can be loosely described as a superposition of monomer-like absorption (from the only weakly coupling H-aggregate-type arrangements) plus contributions of more pronounced J-type aggregate absorption. This spectral appearance of the lowest-energy absorption band is still present even in the 70:30 PMMA-Cz blend, which suggests that there still must be Cz domains giving rise to aggregation. We note that a neat PMMA thin film only shows weak absorption starting below 250 nm (see Figure S3, Supporting Information), so contributions of PMMA to the absorption spectra reported in Figure 2 can be neglected.
Figure 2c contains the photoluminescence excitation spectra (recorded at the emission wavelength 370 nm), and panels d and e show the absolute and normalized PL spectra. The photoluminescence spectra of the PMMA:Cz blends with low Cz content (98:2 and 90:10) represent almost a mirror image of the respective absorption spectra and are similar to those reported previously in organic solvents [45,48,49]. For the 90:10 blend, the long-wavelength tail of the emission band is already slightly enhanced (panel e, e.g., above 450 nm), which may be attributed to a contribution of excimer emission, similar to what was previously observed for related carbazole-based systems, such as mCP [13]. In addition, photoexcitation at shorter wavelengths leads to a relative increase in the amplitude of the excimer band compared with the main peak (panel f), similar to the effect previously observed for mCP [13]. This could be due to the fact that at higher energy, the initial excitation might migrate over a larger distance, leading to an enhanced probability of finding an excimer site for emission [13].
More pronounced changes are observed for the thin films of neat Cz and the PMMA:Cz blend with a weight percent ratio of 70:30, where the intensity of the most intense emission peak (the 1′–0 vibrational transition of the S1 → S0 band) is strongly enhanced (panel d). Similar to the observation for the absorption spectra, we trace this observation back to excitonic effects (as a result of the overlapping emission of mainly J-aggregate-type dimer species) and also reabsorption effects (especially for the films with the highest Cz and t-Bu-Cz content) because of the small Stokes shift (Table 1). The enhanced peak in the center of the emission spectrum could then be an indication of superradiance, i.e., an enhanced radiative decay rate of the lowest-lying exciton state [24,54,55]. Characteristic parameters of the steady-state spectra are summarized in Table 1.
Time-resolved fluorescence decays obtained from TCSPC measurements for the neat Cz thin film and the different PMMA:Cz blends are displayed in panel g (“monomer” or “exciton” emission, averaged over the emission wavelength range of 365–375 nm) and panel h (“excimer” emission, averaged over the emission wavelength range of 455–750 nm) of Figure 2. The initial exciton number density in these experiments was about 6 × 1012 cm−3. The decays were fitted to a sum of up to four exponentials. The resulting time constants τi and associated amplitudes Ai are summarized in Table 2, including the average lifetime 〈τ〉 (= τave), calculated as 〈τ〉 = (A1τ12 + A2τ22 + A3τ32)/(A1τ1 + A2τ2 + A3τ3) for the example of a triexponential decay [13]. As shown in panel i, the average lifetime decreases with increasing Cz content in the films. For the “monomer” band of the 98:2 PMMA:Cz blend, the longest lifetime of 7.4 ns is observed, which decreases to about 3 ns for the 70:30 blend and the neat Cz film. For comparison, the S1 lifetime of “isolated” Cz in O2-free organic solvents has been reported to be in the range of 14–15 ns [48,49,56,57].
This shortening of the S1 lifetime may be explained as follows: The S0 → S1 absorption spectrum and the S1 → S0 emission spectrum of Cz show considerable overlap, see, e.g., panels a and d of Figure 2, and this is also underlined by the small Stokes shifts summarized in Table 1. Therefore, already starting for blends with low Cz content (PMMA:Cz 90:10) and much more strongly for even higher Cz content, Cz(S1)–Cz(S0) Förster resonance energy transfer (FRET) based on a dipole–dipole coupling mechanism becomes possible [58,59,60]. Because of this homo-FRET process (Cz(S1) → Cz(S0) accompanied by Cz(S0) → Cz(S1)), the excitation can efficiently hop through the thin film and eventually reach an excimer site, which acts as a trap because the emission of the excimer species does not overlap with the Cz absorption band. Therefore, further migration of the excitation through the film is not possible. The average lifetimes of the excimers (as measured using a bandpass filter covering the wavelength range of 455–750 nm) are in general longer (Figure 2i), varying between 8.1 ns (PMMA:Cz 90:10) and 4.5 ns (neat Cz). The weak emission intensity of the excimer suggests that its radiative rate constant is small.
Coming to the measurements for the different PMMA:t-Bu-Cz thin films (Figure 2j–r, Table 1 and Table 2), we observe trends that are similar to the corresponding Cz-based films. Notable differences are the slightly larger Stokes shift than for the Cz-based systems (Table 1) and the less pronounced exciton peak in the absorption and emission spectra of the neat t-Bu-Cz film (panels j, k, m and n). The bulky tert-butyl substituents give rise to a slightly larger spacing between the t-Bu-Cz chromophores [61] and thus, the J-aggregate interactions compared with those in Cz-based films are weaker. Also, breaking up the t-Bu-Cz–t-Bu-Cz interactions by PMMA appears to be easier than for Cz–Cz. This is underlined by the fact that the absorption and emission of the PMMA:t-Bu-Cz blend with the weight percent ratio of 70:30 already behaves similarly to the films with low t-Bu-Cz content (90:10 and 98:2), whereas the corresponding spectra for the PMMA:Cz blend with the weight percent ratio of 70:30 are much more similar to those of the neat Cz thin film.

3.3. Femtosecond and Nanosecond UV-Vis-NIR Transient Absorption Spectra

Figure 3 summarizes the transient broadband absorption spectra and kinetics obtained from the fs-TA experiments (λpump = 260 nm) and ns-TA experiments (λpump = 266 nm) for a neat Cz thin film and two different PMMA:Cz blends with weight percent ratios of 70:30 and 90:10. Relevant parameters from the kinetic analysis are summarized in Table 3. We start with the results for the neat Cz thin film in panels a–c. The contour plots in panel a provide an overview of the dynamics for the subpicosecond to several hundred nanosecond range. The transient spectra around zero delay time show the formation of a ground state bleach (GSB) band below 350 nm and broad excited-state absorption above. The ESA is assigned to the S1 state, which is populated by ultrafast (sub-100 fs) internal conversion (IC) from the initially photoexcited higher singlet state Sx. The ESA band of the S1 band has almost completely disappeared by 100 ps. This is at first sight quite unusual because the S1 lifetime of carbazole in O2-free organic solvents is about 14–15 ns [48,49,56,57]. However, efficient S1–S1 annihilation takes place in the neat Cz film at the initial exciton number densities of about 4 × 1018 cm−3 in this experiment (cf. Section 3.4). The SSA process produces an excited Sn state (which quickly relaxes back to S1 by IC) and vibrationally hot S0 molecules, denoted as S0*. In fact, the sharp “hot band” absorption at 345 nm (close to the red edge of the inverted steady-state absorption spectrum, magenta) and the sharp negative signals at 340 nm and 325 nm are characteristic spectral features of vibrationally hot S0* molecules formed during this process [13]. The cooling of the S0* molecules is slow and extends into the several hundred nanosecond range. The kinetic analysis in panels b and c provides a time constant of 12 ps (fs-TA), which is related to the singlet–singlet annihilation process. The time constants of 640 ps (fs-TA), 3 ns, 41 ns and 790 ns (ns-TA) describe the slow cooling process, which involves heat transfer to the quartz substrate and encompasses the picosecond to the several hundred nanosecond range.
Next, we analyze the corresponding dynamics in panels d–f for the PMMA:Cz thin-film blend with a weight percent ratio of 70:30. The spectral evolution looks quite similar to that of the neat Cz film, with a broad S1 ESA band and the formation of vibrationally hot S0* molecules. However, the S1 ESA band decays on a considerably slower time scale, because the SSA process is less efficient, as the average spacing between the S1 molecules becomes larger because of the presence of PMMA. SSA will be shown to be a diffusive second-order process in Section 3.4. Thus, it takes longer for two S1 excitons to come into a critical contact distance for annihilation. The kinetic analysis reflects this change in the dynamics: Besides a weak ultrafast component (0.1 ps, likely IC from the Sx state), the fs-TA data reveal time constants of 7 and 107 ps, which effectively describe the slowed-down diffusive SSA. The time constants of 580 ps (fs-TA) and 13 ns, 113 ns and 51 μs (ns-TA) are again assigned to heat transfer from hot S0* Cz molecules to the quartz substrate.
Finally, in panels g–i, we deal with the dynamics for the PMMA:Cz thin-film blend with a weight percent ratio of 90:10. Here, the Cz–Cz spacing is even larger, which leads to a further slowing-down of the S1–S1 annihilation process. Still, this decay is much faster than the aforementioned time constant of 14–15 ns for the S1 lifetime of Cz in organic solvents. Because of the much higher “dilution” of Cz in PMMA, the spectral features of the hot S0* molecules are also much weaker and less pronounced: While in a neat Cz film, the excess energy would be only distributed among the Cz molecules, here, the excess energy is predominantly transferred from “hot” Cz to the “cold” PMMA matrix. As PMMA has no absorption bands in the spectral range investigated here, the heating-up of PMMA by this process is not visible in the TA spectra [13]. Consequently, the spectral features in the GSB range of 280–320 nm in panel g (1–3 ns) and also panel d (1–10 ns) look considerably different, as they are not so strongly influenced by the spectral signature of the S0* molecules in panel a (1–10 ns). The kinetic analysis provides time constants of 1 ps, 20 ps and 209 ps for the SSA process (fs-TA) as well as 3.7 ns, 223 ns and 7.7 μs (ns-TA), which we assign to the cooling of the S0* molecules. The 3.7 ns component will also contain some contributions of the radiative decay of Cz molecules in S1 (cf. 〈τ〉 = 3.1 ns from TCSPC, Table 2) because intramolecular radiative relaxation becomes more competitive for the wider Cz–Cz distances in the 90:10 thin film blend.

3.4. Kinetic Analysis of Singlet–Singlet Annihilation Processes in Cz and t-Bu-Cz Films

The fs-TA kinetics for the neat Cz (and also t-Bu-Cz) thin films show that at the S1 exciton number densities of ca. 4 × 1018 cm−3 employed in these experiments, the lifetime of S1 is drastically reduced compared with the S1 lifetime determined from the time-resolved emission experiments, which were recorded at much lower exciton number densities N1 of ca. 6 × 1012 cm−3 (Figure 2 and Table 2). Whereas the total lifetimes of S1 at the excitation conditions of the TCSPC experiments are 3.14 ns and 3.85 ns for Cz and t-Bu-Cz, respectively, most of the S1 decay of the thin films in the transient absorption experiments already occurred by 100 ps. This is demonstrated in Figure 4a by the measured transient absorption kinetics in the NIR range averaged over the wavelength range of 1100–1300 nm, which monitor the decay of an ESA band exclusively assigned to S1 excitons. To understand this drastic shortening of the S1 lifetime with increasing number density N1, the NIR transients were subjected to a kinetic modeling procedure, which is described below.
The kinetic scheme for modeling the relaxation of the neat Cz and t-Bu-Cz thin films is shown in Figure 4b, and a schematic Perrin–Jablonski diagram based on the data from Table 1 and available information regarding the energy of the triplet state [56] is depicted in Figure 4c. Relevant kinetic parameters are summarized in Table 4. The mechanism can be divided into contributions from intramolecular relaxation, singlet–singlet annihilation and collisional relaxation. We begin with steps 1–4, which summarize the intramolecular relaxation pathways of Cz and t-Bu-Cz molecules (left side of the scheme in Figure 4b):
S x k x S 1
S 1 k IC + Fl , 1 S 0 *
S 1 k ISC , 1 T 1
T 1 k ISC + Ph , 2 S 0 *
The Sx exciton state, which is prepared by photoexcitation at 260 nm, decays via IC to S1 (step 1). Because its lifetime is very short (τx = kx−1 ≈ 200 fs), it does not show clear spectral fingerprints in the transient absorption spectra at early times (Figure 3). S1 can decay either by internal conversion (IC) or fluorescence to a vibrationally excited ground state (S0*) with the rate constant kIC+Fl,1 = τIC+Fl,1−1 (step 2) or by intersystem crossing (ISC) to the T1 triplet state with the rate constant kISC,1 = τISC,1−1 (step 3). The sum of these two rate constants represents the total rate constant for depopulation of the S1 exciton state (ktotal,1 = kIC+Fl,1 + kISC,1 = τtotal,1−1). The total lifetime τtotal,1 of S1 was determined in our TCSPC experiments as 3.14 ns and 3.85 ns for Cz and t-Bu-Cz, respectively (Figure 1). For our modeling here, we assumed a quantum yield of 50% for ISC from S1, which is compatible with findings from previous experiments for the relaxation of Cz in organic solvents [49,56,57]. This provides time constants τIC+Fl,1 = τISC,1 of 6.3 ns and 7.7 ns for Cz and t-Bu-Cz, respectively (Table 4). The spin-forbidden relaxation of T1 by ISC and phosphorescence (step 4) is much slower, and based on the results from our ns-TA experiments (Figure 3c), we use a value of τISC+Ph,2 = kISC+Ph,2−1 of 0.8 μs (Table 4).
The vibrationally hot Cz and t-Bu-Cz molecules in the electronic ground state (S0*) formed by steps 2 and 4 decay by collisional energy transfer (CET), where the excess vibrational energy is transferred first to the surrounding room-temperature carbazole molecules and finally to the underlying quartz substrate (step 5):
S 0 * k CET S 0
For modeling the decay of the fs-TA kinetics, we use the time constant τCET = kCET−1 of 3.0 ns extracted from Figure 3b. Modeling the decay of the S1 exciton population for Cz and t-Bu-Cz in Figure 4a with this set of kinetic parameters results in the black dashed and red dashed fit lines, respectively. Both of them decay too slowly, in agreement with the aforementioned total S1 lifetimes of 3.14 ns (Cz) and 3.85 ns (t-Bu-Cz).
Therefore, additional S1 relaxation steps need to be considered to understand the fast decay of the fs-TA kinetics in Figure 4a. With increasing initial number densities of S1 excitons in the thin film, singlet–singlet annihilation becomes increasingly important. One possible mechanism is the diffusive singlet–singlet annihilation of two S1 states:
S 1 + S 1 k diff S 0 * + S n
This bimolecular encounter results in the formation of an S0* ground state species and a higher excited Sn singlet state (located at an energy of (maximum) two times the energy of the S1 state) with the second-order rate constant kdiff. The rate-determining step of this diffusion process is repeated hopping of the S1 excitation based on Förster resonance energy transfer [58,59,60], which is possible because of the strong overlap between the S0 → S1 absorption and the S1 → S0 emission bands of Cz and t-Bu-Cz arising from the very small Stokes shift (see e.g., Figure 2 and Figure 3a). The net equation for this homo-FRET process between identical carbazole molecules is:
S 1 + S 0 k F ö r s t e r , 0 R S 0 + S 1
The excitation transfer is based on nonradiative dipole–dipole coupling, i.e., the two coupled first-order steps 8a and 8b comprising de-excitation of an S1 species (energy donor) accompanied by excitation of an S0 species (energy acceptor):
S 1 k F ö r s t e r , 0 R S 0
S 0 k F ö r s t e r , 0 R S 1
The first-order rate constant kFörster,0 is given by [58,59]:
k F ö r s t e r , 0 = τ 1 1 ( R 0 / R ) 6
where τ1 is the total S1 lifetime of the donor in the absence of energy transfer, R is the donor–acceptor distance, and the Förster radius R0 corresponds to the distance, where the rate constants for FRET and intramolecular decay of S1 are equal. Significant FRET contributions are expected up to donor–acceptor distances of about 10 nm, with typical Förster radii for singlet exciton systems in the range of 1.4–7 nm [18,60,62,63,64,65]. As there are always several carbazole molecules in S0 available close to an S1 molecule (i.e., R is small), the FRET process leads to efficient migration of the S1 excitation through the thin film. Such a random walk of the excitation eventually brings two S1 molecules close to each other, so that efficient homo-FRET-based singlet–singlet annihilation between the two S1 carbazole molecules takes place with the net equation:
S 1 + S 1 k F ö r s t e r , 1 R S 0 * + S n
where one S1 exciton is destroyed (forming carbazole ground state molecules with some excess energy, S0*), and at the same time, one S1 molecule is promoted to a higher Sn state:
S 1 k F ö r s t e r , 1 R S 0 *
S 1 k F ö r s t e r , 1 R S n
Such an S1–S1 FRET process is feasible because the emission spectrum of the S1 state strongly overlaps with broad S1 excited-state absorption (see Figure 3a). Summarizing the diffusive SSA mechanism, step 6 used in our kinetic modeling procedure is of second-order because the random walk of the two S1 molecules is rate-determining.
Alternatively, we also consider the direct homo-FRET SSA process of steps 11a and 11b to occur without prior diffusion. A technical difficulty to implement these two steps in a kinetic mechanism is that the rate constant kFörster,1 is R-dependent and thus depends on the spatial distribution of S1 molecules, which changes with time. However, others [26] and we [66] demonstrated that in the case of randomly distributed S1 molecules in thin films, the alternative kinetic formulation based on steps 12a and 12b can be used:
3   S 1 k F , 1 S 0 * + 2   S n
3   S 1 k F , 1 2   S 0 * + S n
Note that these two steps also lead to the same net equation as in step 10. Importantly, the S1 population decay due to S1–S1 FRET results in an apparent third-order behavior, with the rate constant kFRET,1 = 6 kF,1 [66].
The SSA processes in steps 6 and 10 both lead to the formation of a high-energy Sn singlet exciton species. Such states typically show ultrafast IC on a time scale of sub-50 femtoseconds, repopulating S1 directly or via an ultrafast cascade of IC steps:
S n k n S 1
Here, we assume a value τn = kn−1 of 20 fs for its lifetime. The Sn exciton state is located at a high excitation energy (roughly twice the S1 energy, which corresponds to about 7.3 eV or 170 nm for the two carbazoles, see Figure 2). At this high energy, Sn states may also form an electron–hole pair, where the electron and hole are located on individual carbazole molecules as an S0•− radical anion and an S0•+ radical cation, respectively [65,66,67]. However, as we do not see any long-lived absorption bands assignable to such species, we conclude that this channel is below the detection limit of the fs-TA and ns-TA experiments. Singlet fission (S0 + S1 → T1 + T1) [68] is not possible either, because the 0–0 energy of the T1 state of Cz (E(T1) ≈ 3.061 eV) is located at more than half of the energy of the S1 state (E(S1) ≈ 3.658 eV) [56]. Finally, triplet–triplet annihilation does not need to be considered either because the population of the T1 state accumulated on the sub-200 ps time scale considered in Figure 4a is negligible.
The kinetic scheme of Figure 4b containing steps 1–6, 12a, 12b and 13 was implemented using the program Tenua [69]. The initial Sx number density was determined by using the known fluence of the pump laser beam at 260 nm, the thickness of the thin films (measured by AFM) and the absorbance of the thin film samples at 260 nm (Table 4). Because the lifetime of the Sx state is ultrashort, the peak value of the kinetics in Figure 4a essentially corresponds to the initial number density of S1 molecules. The NIR transient absorption kinetics therefore describe the time-dependent decay of the S1 population.
To learn about the dominant singlet–singlet annihilation mechanism, we consider the following two limiting cases: Using steps 1–6 and 13 (only diffusive SSA, but no S1–S1 homo-FRET, i.e., leaving out steps 12a and 12b), the best fits for the decays of Cz (black solid line) and t-Bu-Cz (red solid line) are obtained using the rate constants kdiff = 2.00 × 10⁻⁸ cm3 s−1 and 1.25 × 10⁻⁸ cm3 s−1, respectively. Using steps 1–5, 12a, 12b and 13 (only S1–S1 homo-FRET, but no diffusive SSA, i.e., leaving out step 6) one obtains the dotted lines when using the rate constants kF,1 = 2.40 × 10⁻²⁷ cm6 s−1 (black) and 1.80 × 10⁻²⁷ cm6 s−1 (red), respectively.
The diffusive SSA model provides a very good fit to the Cz and t-Bu-Cz data. In contrast, the simulation based on S1–S1 homo-FRET SSA can only describe the earliest decay satisfactorily, but it decays too slowly afterward. This is a direct consequence of its apparent third-order behavior, whereas the diffusive SSA is second-order. In addition, the Förster radii, which can be calculated from kF,1 as described previously [66], would be 18.3 nm and 17.5 nm for Cz and t-Bu-Cz, respectively, which is much larger than the typically observed 1.4–7 nm [18,60,62,63,64,65]. Our modeling results therefore suggest that the SSA mechanism operative in these carbazole thin films is of the diffusive type. A summary of the kinetic fit parameters is provided in Table 4.

4. Discussion

Our combined approach using steady-state absorption, time-resolved photoluminescence and broadband transient absorption experiments has provided a comprehensive overview of the complicated excited-state dynamics in Cz and t-Bu-Cz thin films and their blends with PMMA. In the neat films, excitonic effects in the steady-state absorption and emission spectra are clearly visible in terms of a pronounced excitonic peak, which likely arises from J-type aggregate structures. Yet, these excitonic contributions appear to be less pronounced than in films of “classical” excitonic materials, such as tetracene or different types of polymer thin films [24].
Time-resolved emission experiments using TCSPC at low S1 number densities of about 6 × 1012 cm−3 reveal efficient Cz(S1)–Cz(S0) homo-FRET with the ultimate population of excimer sites. The excimer contributions appear to be less important than in other carbazole-type materials, such as 1,3-bis(N-carbazolyl)benzene (mCP). Also, no additional structured red-shifted aggregate emission is observed, in contrast to thin films of mCP [13]. At a higher S1 exciton number density of about 4 × 1018 cm−3, the S1 lifetime is considerably reduced because of diffusive S1–S1 annihilation with the rate constants kdiff of 2.00 × 10⁻⁸ cm3 s−1 (Cz) and 1.25 × 10⁻⁸ cm3 s−1 (t-Bu-Cz) obtained from ns-TA experiments. These values may be compared with previous results for other carbazole derivatives: For thin films of 4′-bis(9-carbazolyl)-2,2′-biphenyl (CBP), Ruseckas et al. [17] obtained values for the annihilation rate constant γ of 6 × 10⁻⁹ cm3 s−1, respectively, using luminescence-based techniques. This rate constant is slightly smaller but still in reasonable agreement with our values from the fs-TA experiments. Later on, Morgenroth et al. obtained a value of 1.40 × 10⁻⁸ cm3 s−1 for kdiff of mCP [13], in very good agreement with our present results. The current measurements on Cz and t-Bu-Cz thin films provide valuable information regarding this important kinetic parameter, which is of particular relevance for the efficiency roll-off behavior of OLEDs at high current densities. The fs-TA experiments also show that “direct” S1–S1 FRET without prior S1–S0 homo-FRET diffusion does not play any role in the singlet–singlet annihilation process. The SSA process generates highly vibrationally excited molecules in the ground state (S0*), which can be clearly identified in our fs-TA and ns-TA experiments in terms of a sharp hot-band absorption on the red edge of the S0 → S1 absorption band and sharp bleach features in the GSB region. The dissipation of this excess energy to the quartz substrate spans a wide time scale from several hundred picoseconds to microseconds. As valuable side information, picosecond ultrasonics experiments employing the fs-TA setup provide a value of 2200 m s−1 for the longitudinal sound velocity of Cz. This value can be conveniently used in future studies to measure the thickness of Cz and other Cz-based films with a thickness in the range of about 50–500 nm in an all-optical fashion.
There remain several open questions for further research on these films. For instance, we focused on spin-coated films, and their microcrystalline structure is not ideal for applications. It would therefore be of interest to carry out similar studies with Cz and t-Bu-Cz films produced by physical vapor deposition and study the impact of the film preparation method on the steady-state and time-resolved optical properties. From the dynamics side, the current approach using optical excitation initially populates only singlet states. In situations where the initial exciton number density is high, triplet formation cannot compete with the singlet exciton channels, such as bimolecular diffusive SSA. It would be therefore valuable to study such films under pulsed electrical excitation, as this will initially populate the excited states in a statistical T1:S1 ratio of 3:1. This way, the kinetics of channels involving the T1 triplet state, such as triplet–triplet annihilation and singlet–triplet annihilation, can be accessed. These topics will be addressed in future work.

Supplementary Materials

The following supporting information can be downloaded at: https://www.mdpi.com/article/10.3390/photochem4020011/s1, Figures S1 and S2: X-ray diffraction patterns of neat Cz and t-Bu-Cz thin films, respectively, on quartz including simulations based on a Rietveld refinement procedure considering texture effects and an amorphous background signal; Figure S3: Absorption spectrum of a neat PMMA thin film produced by spin-coating on quartz.

Author Contributions

Conceptualization, K.O. and T.L.; methodology, K.O. and T.L.; investigation, K.M.K., D.G., K.O. and T.L.; writing—original draft preparation, K.O., T.L. and K.M.K.; writing—review and editing, K.O., T.L. and K.M.K.; supervision, K.O. and T.L. All authors have read and agreed to the published version of the manuscript.

Funding

This research received no external funding.

Data Availability Statement

The data are contained within this article.

Acknowledgments

We thank T. Staedler and T. Guo (Institute of Materials Engineering, University of Siegen) for kindly providing the setup for the AFM measurements. We also thank M. Killian and T. Kowald (Chemistry and Structure of Novel Materials, University of Siegen) for recording the thin-film X-ray diffraction data.

Conflicts of Interest

The authors declare no conflicts of interest.

References

  1. Li, J.; Grimsdale, A.C. Carbazole-based polymers for organic photovoltaic devices. Chem. Soc. Rev. 2010, 39, 2399–2410. [Google Scholar] [CrossRef] [PubMed]
  2. Oner, S.; Bryce, M.R. A review of fused-ring carbazole derivatives as emitter and/or host materials in organic light emitting diode (OLED) applications. Mater. Chem. Front. 2023, 7, 4304–4338. [Google Scholar] [CrossRef]
  3. Radhakrishna, K.; Manjunath, S.B.; Devadiga, D.; Chetri, R.; Nagaraja, A.T. Review on Carbazole-Based Hole Transporting Materials for Perovskite Solar Cell. ACS Appl. Electron. Mater. 2023, 6, 3635–3664. [Google Scholar] [CrossRef]
  4. Ledwon, P. Recent advances of donor-acceptor type carbazole-based molecules for light emitting applications. Org. Electron. 2019, 75, 105422. [Google Scholar] [CrossRef]
  5. Godumala, M.; Choi, S.; Cho, M.J.; Choi, D.H. Recent breakthroughs in thermally activated delayed fluorescence organic light emitting diodes containing non-doped emitting layers. J. Mater. Chem. C 2019, 7, 2172–2198. [Google Scholar] [CrossRef]
  6. Nakanotani, H.; Sasabe, H.; Adachi, C. Singlet-singlet and singlet-heat annihilations in fluorescence-based organic light-emitting diodes under steady-state high current density. Appl. Phys. Lett. 2005, 86, 213506. [Google Scholar] [CrossRef]
  7. Hasan, M.; Shukla, A.; Ahmad, V.; Sobus, J.; Bencheikh, F.; McGregor, S.K.M.; Mamada, M.; Adachi, C.; Lo, S.-C.; Namdas, E.B. Exciton–Exciton Annihilation in Thermally Activated Delayed Fluorescence Emitter. Adv. Funct. Mater. 2020, 30, 2000580. [Google Scholar] [CrossRef]
  8. Bree, A.; Zwarich, R. Vibrational Assignment of Carbazole from Infrared, Raman, and Fluorescence Spectra. J. Chem. Phys. 1968, 49, 3344–3355. [Google Scholar] [CrossRef]
  9. Chakravorty, S.C.; Ganguly, S.C. Polarized Absorption Spectra of Carbazole Single Crystal. J. Chem. Phys. 1970, 52, 2760–2762. [Google Scholar] [CrossRef]
  10. Tanaka, M. Electronic States of Fluorene, Carbazole and Dibenzofuran. Bull. Chem. Soc. Jpn. 1976, 49, 3382–3388. [Google Scholar] [CrossRef]
  11. Nakhimovsky, L.A.; Fuchs, R.; Martin, D.; Small, G.J. Optical Properties of Carbazole Thin Monocrystalline Films. Mol. Cryst. Liq. Cryst. 1988, 154, 89–105. [Google Scholar] [CrossRef]
  12. Nguyen, D.D.; Trunk, J.; Nakhimovsky, L.; Spanget-Larsen, J. Electronic transitions of fluorene, dibenzofuran, carbazole, and dibenzothiophene: From the onset of absorption to the ionization threshold. J. Mol. Spectrosc. 2010, 264, 19–25. [Google Scholar] [CrossRef]
  13. Morgenroth, M.; Lenzer, T.; Oum, K. Understanding Excited-State Relaxation in 1,3-Bis(N-carbazolyl)benzene, a Host Material for Organic Light-Emitting Diodes. J. Phys. Chem. C 2023, 127, 4582–4593. [Google Scholar] [CrossRef]
  14. Scully, S.R.; McGehee, M.D. Effects of optical interference and energy transfer on exciton diffusion length measurements in organic semiconductors. J. Appl. Phys. 2006, 100, 034907. [Google Scholar] [CrossRef]
  15. Lewis, A.J.; Ruseckas, A.; Gaudin, O.P.M.; Webster, G.R.; Burn, P.L.; Samuel, I.D.W. Singlet exciton diffusion in MEH-PPV films studied by exciton–exciton annihilation. Org. Electron. 2006, 7, 452–456. [Google Scholar] [CrossRef]
  16. Shaw, P.E.; Ruseckas, A.; Samuel, I.D.W. Exciton Diffusion Measurements in Poly(3-hexylthiophene). Adv. Mater. 2008, 20, 3516–3520. [Google Scholar] [CrossRef]
  17. Ruseckas, A.; Ribierre, J.C.; Shaw, P.E.; Staton, S.V.; Burn, P.L.; Samuel, I.D.W. Singlet energy transfer and singlet-singlet annihilation in light-emitting blends of organic semiconductors. Appl. Phys. Lett. 2009, 95, 183305. [Google Scholar] [CrossRef]
  18. Lunt, R.R.; Giebink, N.C.; Belak, A.A.; Benziger, J.B.; Forrest, S.R. Exciton diffusion lengths of organic semiconductor thin films measured by spectrally resolved photoluminescence quenching. J. Appl. Phys. 2009, 105, 053711. [Google Scholar] [CrossRef]
  19. Cook, S.; Furube, A.; Katoh, R.; Han, L. Estimate of singlet diffusion lengths in PCBM films by time-resolved emission studies. Chem. Phys. Lett. 2009, 478, 33–36. [Google Scholar] [CrossRef]
  20. Cook, S.; Liyuan, H.; Furube, A.; Katoh, R. Singlet Annihilation in Films of Regioregular Poly(3-hexylthiophene): Estimates for Singlet Diffusion Lengths and the Correlation between Singlet Annihilation Rates and Spectral Relaxation. J. Phys. Chem. C 2010, 114, 10962–10968. [Google Scholar] [CrossRef]
  21. Shaw, P.E.; Ruseckas, A.; Peet, J.; Bazan, G.C.; Samuel, I.D.W. Exciton-Exciton Annihilation in Mixed-Phase Polyfluorene Films. Adv. Funct. Mater. 2010, 20, 155–161. [Google Scholar] [CrossRef]
  22. Masri, Z.; Ruseckas, A.; Emelianova, E.V.; Wang, L.; Bansal, A.K.; Matheson, A.; Lemke, H.T.; Nielsen, M.N.; Nguyen, H.; Coulembier, O.; et al. Molecular Weight Dependence of Exciton Diffusion in Poly(3-hexylthiophene). Adv. Energy Mater. 2013, 3, 1445–1453. [Google Scholar] [CrossRef]
  23. Lin, J.D.A.; Mikhnenko, O.V.; Chen, J.; Masri, Z.; Ruseckas, A.; Mikhailovsky, A.; Raab, R.P.; Liu, J.; Blom, P.W.M.; Loi, M.A.; et al. Systematic study of exciton diffusion length in organic semiconductors by six experimental methods. Mater. Horiz. 2014, 1, 280–285. [Google Scholar] [CrossRef]
  24. Bardeen, C.J. The Structure and Dynamics of Molecular Excitons. Annu. Rev. Phys. Chem. 2014, 65, 127–148. [Google Scholar] [CrossRef] [PubMed]
  25. Gulbinas, V.; Valkunas, L.; Kuciauskas, D.; Katilius, E.; Liuolia, V.; Zhou, W.; Blankenship, R.E. Singlet-Singlet Annihilation and Local Heating in FMO Complexes. J. Phys. Chem. 1996, 100, 17950–17956. [Google Scholar] [CrossRef]
  26. Stevens, M.A.; Silva, C.; Russell, D.M.; Friend, R.H. Exciton dissociation mechanisms in the polymeric semiconductors poly(9,9-dioctylfluorene) and poly(9,9-dioctylfluorene-co-benzothiadiazole). Phys. Rev. B 2001, 63, 165213. [Google Scholar] [CrossRef]
  27. King, S.M.; Dai, D.; Rothe, C.; Monkman, A.P. Exciton annihilation in a polyfluorene: Low threshold for singlet-singlet annihilation and the absence of singlet-triplet annihilation. Phys. Rev. B 2007, 76, 085204. [Google Scholar] [CrossRef]
  28. Zaushitsyn, Y.; Jespersen, K.G.; Valkunas, L.; Sundström, V.; Yartsev, A. Ultrafast dynamics of singlet-singlet and singlet-triplet exciton annihilation in poly(3-2′-methoxy-5′-octylphenyl)thiophene films. Phys. Rev. B 2007, 75, 195201. [Google Scholar] [CrossRef]
  29. Völker, S.F.; Schmiedel, A.; Holzapfel, M.; Renziehausen, K.; Engel, V.; Lambert, C. Singlet−Singlet Exciton Annihilation in an Exciton-Coupled Squaraine-Squaraine Copolymer: A Model toward Hetero-J-Aggregates. J. Phys. Chem. C 2014, 118, 17467–17482. [Google Scholar] [CrossRef]
  30. Chen, C.; Chi, Z.; Chong, K.C.; Batsanov, A.S.; Yang, Z.; Mao, Z.; Yang, Z.; Liu, B. Carbazole isomers induce ultralong organic phosphorescence. Nat. Mater. 2021, 20, 175–180. [Google Scholar] [CrossRef] [PubMed]
  31. Chen, C.; Chong, K.C.; Pan, Y.; Qi, G.; Xu, S.; Liu, B. Revisiting Carbazole: Origin, Impurity, and Properties. ACS Mater. Lett. 2021, 3, 1081–1087. [Google Scholar] [CrossRef]
  32. Lutterotti, L. Total pattern fitting for the combined size-strain-stress-texture determination in thin film diffraction. Nucl. Instrum. Methods Phys. Res. Sect. B 2010, 268, 334–340. [Google Scholar] [CrossRef]
  33. Dobryakov, A.L.; Kovalenko, S.A.; Weigel, A.; Pérez Lustres, J.L.; Lange, J.; Müller, A.; Ernsting, N.P. Femtosecond pump/supercontinuum-probe spectroscopy: Optimized setup and signal analysis for single-shot spectral referencing. Rev. Sci. Instrum. 2010, 81, 113106. [Google Scholar] [CrossRef] [PubMed]
  34. Oum, K.; Lenzer, T.; Scholz, M.; Jung, D.Y.; Sul, O.; Cho, B.J.; Lange, J.; Müller, A. Observation of Ultrafast Carrier Dynamics and Phonon Relaxation of Graphene from the Deep-Ultraviolet to the Visible Region. J. Phys. Chem. C 2014, 118, 6454–6461. [Google Scholar] [CrossRef]
  35. Flender, O.; Scholz, M.; Klein, J.R.; Oum, K.; Lenzer, T. Excited-state relaxation of the solar cell dye D49 in organic solvents and on mesoporous Al2O3 and TiO2 thin films. Phys. Chem. Chem. Phys. 2016, 18, 26010–26019. [Google Scholar] [CrossRef] [PubMed]
  36. Merker, A.; Scholz, M.; Morgenroth, M.; Lenzer, T.; Oum, K. Photoinduced Dynamics of (CH3NH3)4Cu2Br6 Thin Films Indicating Efficient Triplet Photoluminescence. J. Phys. Chem. Lett. 2021, 12, 2736–2741. [Google Scholar] [CrossRef]
  37. Ruello, P.; Gusev, V.E. Physical mechanisms of coherent acoustic phonons generation by ultrafast laser action. Ultrasonics 2015, 56, 21–35. [Google Scholar] [CrossRef] [PubMed]
  38. Thomsen, C.; Strait, J.; Vardeny, Z.; Maris, H.J.; Tauc, J.; Hauser, J.J. Coherent Phonon Generation and Detection by Picosecond Light Pulses. Phys. Rev. Lett. 1984, 53, 989–992. [Google Scholar] [CrossRef]
  39. Grahn, H.T.; Maris, H.J.; Tauc, J. Picosecond Ultrasonics. IEEE J. Quantum Electron. 1989, 25, 2562–2569. [Google Scholar] [CrossRef]
  40. Kanner, G.S.; Vardeny, Z.V.; Hess, B.C. Picosecond acoustics in polythiophene thin films. Phys. Rev. B 1990, 42, 5403–5406. [Google Scholar] [CrossRef] [PubMed]
  41. Kaake, L.G.; Welch, G.C.; Moses, D.; Bazan, G.C.; Heeger, A.J. Influence of Processing Additives on Charge-Transfer Time Scales and Sound Velocity in Organic Bulk Heterojunction Films. J. Phys. Chem. Lett. 2012, 3, 1253–1257. [Google Scholar] [CrossRef] [PubMed]
  42. Scholz, M.; Morgenroth, M.; Cho, M.J.; Choi, D.H.; Lenzer, T.; Oum, K. Coherent acoustic phonon dynamics in chiral copolymers. Struct. Dyn. 2019, 6, 064502. [Google Scholar] [CrossRef] [PubMed]
  43. Nowak, R.; Bernstein, E.R. On the phase transition in N-isopropylcarbazole. J. Chem. Phys. 1986, 85, 6858–6866. [Google Scholar] [CrossRef]
  44. Auty, A.R.; Jones, A.C.; Phillips, D. Spectroscopy and decay dynamics of jet-cooled carbazole and N-ethylcarbazole and their homocyclic analogues. Chem. Phys. 1976, 103, 163–182. [Google Scholar] [CrossRef]
  45. Bigelow, R.W.; Ceasar, G.P. Hydrogen Bonding and N-Alkylation Effects on the Electronic Structure of Carbazole. J. Phys. Chem. 1979, 83, 1790–1795. [Google Scholar] [CrossRef]
  46. Yi, J.T.; Alvarez-Valtierra, L.; Pratt, D.W. Rotationally resolved S1 ← S0 electronic spectra of fluorene, carbazole, and dibenzofuran: Evidence for Herzberg-Teller coupling with the S2 state. J. Chem. Phys. 2006, 124, 244302. [Google Scholar] [CrossRef] [PubMed]
  47. Ljubić, I.; Sabljić, A. CASSCF/CASPT2 and TD-DFT Study of Valence and Rydberg Electronic Transitions in Fluorene, Carbazole, Dibenzofuran, and Dibenzothiophene. J. Phys. Chem. A 2011, 115, 4840–4850. [Google Scholar] [CrossRef]
  48. Bonesi, S.M.; Erra-Balsells, R. Electronic spectroscopy of carbazole and N- and C-substituted carbazoles in homogeneous media and in solid matrix. J. Lumin. 2001, 93, 51–74. [Google Scholar] [CrossRef]
  49. Knötig, K.M.; Gust, D.; Lenzer, T.; Oum, K. Excited-State Dynamics of Carbazole and tert-Butyl-Carbazole in Organic Solvents. Photochem 2024, 4, 163–178. [Google Scholar] [CrossRef]
  50. Gajda, K.; Zarychta, B.; Kopka, K.; Daszkiewicz, Z.; Ejsmont, K. Substituent effects in nitro derivatives of carbazoles investigated by comparison of low-temperature crystallographic studies with density functional theory (DFT) calculations. Acta Crystallogr. Sect. C Struct. Chem. 2014, 70, 987–991. [Google Scholar] [CrossRef]
  51. Yan, Q.; Gin, E.; Wasinska-Kalwa, M.; Banwell, M.G.; Carr, P.D. A Palladium-Catalyzed Ullmann Cross-Coupling/Reductive Cyclization Route to the Carbazole Natural Products 3-Methyl-9H-carbazole, Glycoborine, Glycozoline, Clauszoline K, Mukonine, and Karapinchamine A. J. Org. Chem. 2017, 82, 4148–4159. [Google Scholar] [CrossRef] [PubMed]
  52. Spano, F.C. The Spectral Signatures of Frenkel Polarons in H- and J-Aggregates. Acc. Chem. Res. 2010, 43, 429–439. [Google Scholar] [CrossRef] [PubMed]
  53. Hernández, F.J.; Crespo-Otero, R. Excited state mechanisms in crystalline carbazole: The role of aggregation and isomeric defects. J. Mater. Chem. C 2021, 9, 11882–11892. [Google Scholar] [CrossRef]
  54. Dicke, R.H. Coherence in Spontaneous Radiation Processes. Phys. Rev. 1954, 93, 99–110. [Google Scholar] [CrossRef]
  55. Blach, D.D.; Lumsargis, V.A.; Clark, D.E.; Chuang, C.; Wang, K.; Dou, L.; Schaller, R.D.; Cao, J.; Li, C.W.; Huang, L. Superradiance and Exciton Delocalization in Perovskite Quantum Dot Superlattices. Nano Lett. 2022, 22, 7811–7818. [Google Scholar] [CrossRef] [PubMed]
  56. Adams, J.E.; Mantulin, W.W.; Huber, J.R. Effect of Molecular Geometry on Spin-Orbit Coupling of Aromatic Amines in Solution. Diphenylamine, Iminobibenzyl, Acridan, and Carbazole. J. Am. Chem. Soc. 1973, 95, 5477–5481. [Google Scholar] [CrossRef]
  57. Martin, M.M.; Ware, W.R. Fluorescence Quenching of Carbazole by Pyridine and Substituted Pyridines. Radiationless Processes in the Carbazole-Amine Hydrogen Bonded Complex. J. Phys. Chem. 1978, 82, 2770–2776. [Google Scholar] [CrossRef]
  58. Förster, T. Zwischenmolekulare Energiewanderung und Fluoreszenz. Ann. Phys. 1948, 437, 55–75. [Google Scholar] [CrossRef]
  59. Förster, T. Transfer Mechanisms of Electronic Excitation. Discuss. Faraday Soc. 1959, 27, 7–17. [Google Scholar] [CrossRef]
  60. Mikhnenko, O.V.; Blom, P.W.M.; Nguyen, T.-Q. Exciton diffusion in organic semiconductors. Energy Environ. Sci. 2015, 8, 1867–1888. [Google Scholar] [CrossRef]
  61. Stalindurai, K.; Krishnan, K.G.; Nagarajan, E.R.; Ramalingan, C. Experimental and theoretical studies on new 7-(3,6-di-tert-butyl-9H-carbazol-9-yl)-10-alkyl-10H-phenothiazine-3-carbaldehydes. J. Mol. Struct. 2017, 1130, 633–643. [Google Scholar] [CrossRef]
  62. Hofkens, J.; Cotlet, M.; Vosch, T.; Tinnefeld, P.; Weston, K.D.; Ego, C.; Grimsdale, A.; Müllen, K.; Beljonne, D.; Brédas, J.L.; et al. Revealing competitive Förster-type resonance energy-transfer pathways in single bichromophoric molecules. Proc. Natl. Acad. Sci. USA 2003, 100, 13146–13151. [Google Scholar] [CrossRef] [PubMed]
  63. Lam, A.; St-Pierre, F.; Gong, Y.; Marshall, J.D.; Cranfill, P.J.; Baird, M.A.; McKeown, M.R.; Wiedenmann, J.; Davidson, M.W.; Schnitzer, M.J.; et al. Improving FRET dynamic range with bright green and red fluorescent proteins. Nat. Methods 2012, 9, 1005–1012. [Google Scholar] [CrossRef] [PubMed]
  64. Müller, S.M.; Galliardt, H.; Schneider, J.; Barisas, B.G.; Seidel, T. Quantification of Förster resonance energy transfer by monitoring sensitized emission in living plant cells. Front. Plant Sci. 2013, 4, 413. [Google Scholar] [CrossRef] [PubMed]
  65. Murawski, C.; Leo, K.; Gather, M.C. Efficiency Roll-Off in Organic Light-Emitting Diodes. Adv. Mater. 2013, 25, 6801–6827. [Google Scholar] [CrossRef] [PubMed]
  66. Morgenroth, M.; Scholz, M.; Cho, M.J.; Choi, D.H.; Oum, K.; Lenzer, T. Mapping the broadband circular dichroism of copolymer films with supramolecular chirality in time and space. Nat. Commun. 2022, 13, 210. [Google Scholar] [CrossRef] [PubMed]
  67. Morgenroth, M.; Scholz, M.; Guy, L.; Oum, K.; Lenzer, T. Spatiotemporal Mapping of Efficient Chiral Induction by Helicene-Type Additives in Copolymer Thin Films. Angew. Chem. Int. Ed. 2022, 61, e202203075. [Google Scholar] [CrossRef] [PubMed]
  68. Smith, M.B.; Michl, J. Singlet Fission. Chem. Rev. 2010, 110, 6891–6936. [Google Scholar] [CrossRef] [PubMed]
  69. Wachsstock, D. Tenua 2.1—The Kinetics Simulator for Java. 2007. Available online: http://bililite.com/tenua/ (accessed on 5 January 2024).
Figure 1. (a) AFM images of two neat Cz thin films with an average thickness d of 109 and 153 nm, respectively. (b) The distribution of the thickness of the two thin films shown in panel a is plotted as counts (i.e., the frequency of occurrence) versus height h. In each case, the red solid line is a fit to a Gaussian function, where the peak of the distribution corresponds to the average thickness. (c,d) Same as in panels a and b, but for two t-Bu-Cz thin films of different thicknesses (138 nm and 358 nm). (e) Transient absorption signal at 430 nm for the 138 nm thick t-Bu-Cz film showing coherent acoustic phonon oscillations (blue circles). A fit using a sum of two exponentials and a damped cosine function (red solid line) provides an oscillation period of 251 ps, from which the longitudinal sound velocity cL of t-Bu-Cz was determined as 2200 m s−1.
Photochem 04 00011 g001
Figure 2. Summary of steady-state absorption and photoluminescence (PL) spectra of PMMA:Cz and PMMA:t-Bu-Cz blends with weight percent ratios of 100:0 (i.e., neat Cz and t-Bu-Cz thin films, black), 70:30 (red), 90:10 (blue) and 98:2 (green). (a) OD of thin films. (b) Normalized OD. (c) PL excitation spectra recorded at 370 nm. (d) PL intensity of the thin films excited at 260 nm. (e) Same PL spectra but normalized to their peak. (f) Normalized PL spectra of thin films of the PMMA:Cz 90:10 blends, excited at 260, 290 or 320 nm. (g,h) Transient PL decays of the thin films using two different bandpass filters of 365–375 nm (“monomer” or “exciton” region) and 455–750 nm (“excimer” region), respectively. (i) Average lifetimes of the thin film blends for the PL ranges of 365–375 nm (squares) and 455–750 nm (circles), respectively. (jr) Same as panels (ai), but for the PMMA:t-Bu-Cz thin films.
Photochem 04 00011 g002
Figure 3. Results from TA experiments for carbazole-based thin films. (ac) For a neat Cz thin film from top to bottom: fs-TA and ns-TA spectra as contour plots, TA spectra at selected delay times (indicated by different colors) including the inverted steady-state absorption spectrum (magenta) and the stimulated emission spectrum (cyan), selected fs-TA and ns-TA kinetics including fits by a sum of exponentials (including time constants). (df) Same as in panels (ac), but for the 70:30 PMMA:Cz blend. (gi) Same as in panels (ac), but for the 90:10 PMMA:Cz blend.
Photochem 04 00011 g003
Figure 4. (a) Kinetic traces of the S1 number densities for a Cz thin film (black circles) and a t-Bu-Cz thin film (red circles) averaged over the wavelength range of 1100−1300 nm. The solid lines are corresponding fits based on the kinetic modeling procedure using diffusive singlet–singlet annihilation only. The dotted lines are modeling results using singlet–singlet annihilation based only on S1–S1 FRET. The dashed lines are the simulation results without considering any SSA processes. (b) Kinetic scheme of the relaxation pathways of Cz and t-Bu-Cz in thin films. (c) Perrin–Jablonski diagram highlighting the energetics of the different states and the photophysical processes involved including the associated rate constants (solid arrows: nonradiative processes of a single electronic state, dotted downward arrows: radiative processes, red curved dash-dotted double arrow: singlet–singlet annihilation). S0* denotes the vibrationally hot ground electronic state, where the vibrational excited levels are schematically indicated by thin green lines. Vibrational levels of the S1, Sx, Sn and T1 states are omitted for the sake of clarity. Blue dashed upward arrow: laser excitation by a femtosecond pump pulse at 260 nm.
Photochem 04 00011 g004
Table 1. Characteristic photophysical parameters of the steady-state absorption and photoluminescence spectra of the thin films of Cz and t-Bu-Cz and their blends with PMMA.
Thin Film
Composition
Mixing Ratio
(wt%:wt%)
λabs0–0
(nm)
λPL0–0
(nm)
λmaxPL
(nm)
λStokes
(nm) 1
ν ~ Stokes
(meV) 1
ν ~ Stokes
(cm−1) 1
PMMA:Cz0:100341 2344356332260
70:30340 2344356442340
90:10336342358664520
98:2336341357555440
PMMA:t-Bu-Cz0:100344 2342349552420
70:30342341351993750
90:10342341348662500
98:2342341349773590
1 The Stokes shift was determined as the difference in 0–0 vibrational bands of the lowest electronic states, which were determined by fitting a sum of Gaussian functions to the absorption and PL bands of the thin films. 2 For the neat Cz and t-Bu-Cz thin films and the PMMA:Cz thin film blend with a weight percent ratio of 70:30, this is the position of the excitonic absorption peak.
Table 2. Summary of TCSPC data of the thin films of Cz and t-Bu-Cz and their blends with PMMA at 296 K (λpump = 273 nm).
Thin Film
Composition
Mixing Ratio
(wt%:wt%)
λprobe
(nm)
τ1
(ns) 1
τ2
(ns) 1
τ3
(ns) 1
τ4
(ns) 1
τ
(ns) 1
PMMA:Cz0:100365–3753.0 (97%) 15.7 (3%)3.1
455–7501.1 (46%)2.9 (23%)4.9 (30%)16.66 (1%)4.5
70:30365–3750.6 (64%)2.2 (26%)5.2 (10%)2.9
455–7502.1 (67%)6.5 (30%)18.8 (3%)6.7
90:10365–3753.7 (62%)6.6 (38%)5.2
455–7501.0 (33%)7.2 (65%)20.5 (2%)8.1
98:2365–3753.9 (37%)8.3 (63%)7.4
455–750 2
PMMA:t-Bu-Cz0:100365–3751.0 (47%)3.1 (40%)6.5 (13%)3.9
455–7500.3 (40%)5.4 (51%)14.2 (9%)8.0
70:30365–3751.1 (58%)2.5 (39%)5.3 (3%)2.2
455–7500.8 (38%)6.3 (59%)17.2 (3%)7.4
90:10365–3751.3 (24%)3.6 (46%)6.0 (30%)4.5
455–7501.2 (26%)7.9 (71%)22.3 (3%)8.9
98:2365–3751.2 (14%)3.8 (22%)9.8 (64%)8.9
455–750 2
1 The value in parentheses is the relative amplitude for the respective time constant. 2 For the 98:2 blends, the TCSPC signals recorded in the wavelength range of 455–750 nm (exciton band) were too weak, so the concentration of excimers in these thin films with low Cz and t-Bu-Cz content was below our detection limit.
Table 3. Summary of time constants and relative amplitudes in the GSB range for thin films of neat Cz and different PMMA:Cz blends obtained from the kinetic analysis by using a sum of exponential functions.
Expt.λpump (nm)PMMA:Cz
(wt%:wt%)
λprobe
(nm)
τ1
(ns)
τ2
(ns)
τ3
(ns)
τ4
(ns)
fs-TA 12600:100global0.012 (40%)640 (59%)3 2 (1%)
70:30global0.0001 (9%)0.007 (18%)0.107 (24%)0.580 (49%)
90:10global0.001 (15%)0.020 (25%)0.209 (35%)3.7 2 (25%)
ns-TA 12600:100global3 (47%)41 (37%)790 (16%)
70:30global0.580 (24%)13 (20%)113 (49%)5100 (7%)
90:10global3.7 (20%)223 (50%)7700 (30%)
1 The kinetic traces at the different probe wavelengths were fitted simultaneously with a sum of three or four exponentials. As an example, the relative amplitudes in the GSB range are provided in parentheses. These are in the case of the compositions 0:100, 70:30 and 90:10, respectively: 339 nm, 337 nm and 290 nm (for fs-TA); 322 nm, 291 nm and 290 nm (for ns-TA). 2 Fixed value based on the fit results obtained from the ns-TA experiments. Note that the maximum pump–probe delay time in the fs-TA experiments was 1.5 ns.
Table 4. Summary of the kinetic rate constants and time constants, thin film and laser parameters used in the kinetic modeling procedure for the neat Cz and t-Bu-Cz thin films at 296 K.
Physical QuantityCzt-Bu-CzPhysical QuantityCzt-Bu-Cz
Nx (cm−3)4.0 × 10183.8 × 1018F (mJ cm−2) 11.030.92
kx (s−1)5.0 × 10125.0 × 1012τx (fs)200200
k1,IC+Fl (s−1)1.6 × 1081.3 × 108τ1,IC+Fl (ns)6.37.7
k1,ISC (s−1)1.6 × 1081.3 × 108τ1,ISC (ns)6.37.7
k2,ISC+Ph (s−1)1.25 × 1061.25 × 106τ2,ISC+Ph (μs)0.80.8
kCET (s−1)1.57 × 1081.57 × 108τCET (ns)0.640.64
kdiff (cm3 s−1)2.00 × 10−81.25 × 10−8kF,1 (cm6 s−1) 22.40 × 10−271.80 × 10⁻²⁷
kn (s−1)5.0 × 10135.0 × 1013τn (fs)2020
d (nm) 3153138A 40.3970.371
1 Fluence F of the pump laser beam at 260 nm. 2 These are the best values to fit the initial S1 population decays of Cz and t-Bu-Cz by using S1–S1 FRET as the only SSA process. However, they do not describe the kinetics at long times correctly (see Figure 4a) because of the apparent third-order behavior (see text). 3 Average thickness d of the thin films determined by AFM. 4 Absorbance A of the thin films at 260 nm.
Disclaimer/Publisher’s Note: The statements, opinions and data contained in all publications are solely those of the individual author(s) and contributor(s) and not of MDPI and/or the editor(s). MDPI and/or the editor(s) disclaim responsibility for any injury to people or property resulting from any ideas, methods, instructions or products referred to in the content.

