Article

Excitation–Emission Fluorescence Mapping Analysis of Microplastics That Are Typically Pollutants

Aston Institute of Photonic Technologies, Aston University, Birmingham B4 7ET, UK
*
Author to whom correspondence should be addressed.
Photochem 2024, 4(4), 488-500; https://doi.org/10.3390/photochem4040030
Submission received: 25 October 2024 / Revised: 20 November 2024 / Accepted: 25 November 2024 / Published: 28 November 2024

Abstract

:
Micro- and nanoplastics (MNPs) pose a significant threat to marine and human life due to their immense toxicity. To protect these ecosystems, the development of reliable technologies for MNP detection, characterisation, and removal is vital. While FTIR and Raman spectroscopy are established methods for MNP analysis, fluorescence (FL) spectroscopy has recently emerged as a promising alternative. However, most prior research relies on FL emission probing with a single excitation wavelength for MNP detection. In this study, we introduce a two-dimensional (2D) fluorescence excitation–emission (FLE) mapping method for the detection of commonly found microplastics, namely polystyrene (PS), polyethylene terephthalate (PET), and polypropylene (PP). The FLE mapping technique enables the collective recording of emission spectra across a range of excitation wavelengths, revealing the dominant excitation–emission features of different microplastics. This research advances the field by offering a non-destructive and label-free identification of MNP contamination through the use of FL spectral fingerprints.

Graphical Abstract

1. Introduction

Plastic pollution is one of the greatest environmental challenges of our time, resulting from over 8 million tonnes entering the oceans each year due to poor management of the more than 300 MMT of plastic produced since 1950 [1], with cumulative production predicted to reach 34 billion tonnes by 2050 [2]. In the marine environment, plastics are subjected to severe weathering conditions, UV sunlight, and mechanical abrasion that disintegrate bigger plastics into tiny plastic particles, which are typically referred to as microplastics (MPs), with a size range of 1–5000 μm, and nanoplastics (NPs), with a size range of 1–1000 nm [3,4]. These micro- and nanoplastics (MNPs) have been found in several environmental matrices, i.e., marine biota [5], soil [6], air [7], food [8], and recently in human blood [9]. Within the oceans, MNPs can be found in various layers due to their different molecular weights, causing them to float on the water’s surface, within the water column, and in sedimentary layers [10], and are thus capable of interacting with different aquatic species. Studies have also reported the ingestion of microplastics by marine biota and humans [11,12]. The increase in plastic usage, especially in the textile industry [13], has raised significant concerns about the toxic effects of MNP on human health.
For the characterisation of MNPs, the most commonly used methods are Raman and FTIR spectroscopy [14]. Raman spectroscopy has the advantages of providing high spatial resolution and low water interference and is capable of measuring MPs down to the sub-micron size range [15]. Furthermore, Raman spectroscopy combined with optical microscopy can provide chemical and physical information on MPs, including the level of degradation, crystallinity, and degree of cross-linking [16]. Moreover, some studies show that the sensitivity of Raman spectroscopy can be increased to detect nanoplastics (NPs) by integrating signal enhancement methods such as surface-enhanced Raman spectroscopy (SERS) [17] and coherent anti-Stokes Raman spectroscopy (CARS) [18]. However, each method has its own drawbacks. For instance, Raman spectroscopy encounters issues with fluorescence background [19], and SERS specifically experiences hetero-aggregation of nanoplastics, a plasmonic heating-induced photothermal effect, and time-intensive and cumbersome measurements [20]. Similarly, the application of CARS is restricted by the limitation of single-colour CARS to differentiate between chemically distinct microplastics. Furthermore, multiplex CARS suffers from a low imaging rate, making the process time-consuming [21].
On the other hand, FTIR is also a promising technique for microplastics, operating by measuring the absorption/transmission or reflection of infrared radiation in a sample, enabling the detection of microplastics down to 10 μm [22]. A time-consuming imaging process involved in Raman spectroscopy is not encountered in FTIR, particularly when employing reflection and transmission mode with focal-plane-array (FPA)-based imaging. Moreover, micro-FTIR equipment used for microplastic analysis is less expensive than a micro-Raman spectrometer. However, samples need to be dried before FTIR analysis. Also, in transmission mode, thicker samples (>100 μm) cannot be measured due to the high absorbance of light. Light scattering due to irregular shapes of secondary microplastics is another major issue in reflectance mode [23]. Also, this technique has limitations in detecting MPs up to 10 μm. It is unable to provide identification of nanoscale plastic particles because these are typically smaller than the wavelength of mid-infrared light, which makes it challenging to detect and characterise directly. Finally, samples with thicknesses less than 5 μm provide insufficient absorbance for interpretable spectra in FTIR transmission mode [24].
Compared to Raman spectroscopy and FTIR techniques, fluorescence (FL) spectroscopy is also non-destructive but has comparatively higher sensitivity with a detection limit of up to parts per billion [25] (see Text S1 of Supplementary Materials) and like Raman spectroscopy has low water interference [26]. The FL spectroscopic method was recently used to detect common MPs such as polystyrene (PS) [27,28,29], polyethylene terephthalate (PET) [30], polyethylene (PE) [31,32,33,34], and polypropylene (PP) [35]. However, most studies to date have used a single excitation wavelength to examine their intrinsic fluorescence emission [36,37,38], which may result in observable fluorescence emissions in certain plastics, while others may exhibit weak or no signals at all.
It is, therefore, of great interest to determine the optimal excitation wavelength for each plastic variant, which maximises the quantum yield of fluorescence based on intrinsic emission without using any dyes. In this study, we utilised a two-dimensional (2D) fluorescence excitation–emission (FLE) mapping technique, supplemented by Raman spectroscopy to confirm the chemical composition of three distinct microplastics—polystyrene (PS), polyethylene terephthalate (PET), and polypropylene (PP)—in deionised (DI) water. The FLE maps provided valuable insights into the most suitable excitation wavelengths required to achieve the highest fluorescence intensity for different types of microplastics. Additionally, X-ray photoelectron spectroscopy (XPS) was employed to detect any impurities in the samples that could affect the fluorescence spectra, while scanning electron microscopy (SEM) was used to examine the size and shape distribution of the microplastics.

2. Materials and Methods

2.1. Sample Preparation

PS, PET, and PP microplastic samples were measured in aqueous media. The samples, which had been mixed with deionised water at 4.5% w/v, had previously been prepared by cutting macroscopic source materials into pieces < 1 mm with the use of stainless-steel laboratory scissors. Specifically, for the sources, PS millimetre-size beads were purchased from Acros Organics (average 250,000 M.W.), PET plastic was collected from Aqua-Vale plastic water bottles (London, UK), and PP film was obtained from packaging material (Thermo Fisher Scientific, Horsham, UK).

2.2. Scanning Electron Microscopy

SEM imaging of the filtered sample was undertaken using a Benchtop SEM JEOL, JCM-6000-plus electron microscope (Hertfordshire, UK). Scans were recorded in high-vacuum, high-definition secondary electron diffraction mode (SED) with an accelerating voltage of 15 kV and a magnification of 50×. Prior to imaging, the samples underwent vacuum filtration using an oil-free piston pump (Fisher brand FB70155, Loughborough, UK) through a 0.7 µm filter paper before being transported onto a glass slide and imaged without any metallic coating. Figure S1 (See Supplementary Materials) shows SEM images of PS, PET, and PP microplastic samples showing their different shapes and size distributions estimated to be 250 μm–600 μm, 300 μm–950 μm, and 200 μm–750 μm, respectively. The thicknesses of the PET and PP particles cut from a plastic bottle and food packaging material, respectively, were measured at 250 μm, whilst the PS sample taken from cylinder beads was comparatively thicker (≥350 μm). The surfaces of PET and PP pieces were observed smooth, whereas PS beads contained rough and uneven surfaces with inhomogenously distributed holes.

2.3. X-Ray Photoelectron Spectroscopy (XPS)

An XPS analysis of the polymer samples was performed to determine their chemical constituents and elemental composition of polymer samples (PS, PET, and PP) and to investigate the presence of impurities and various organic functional groups/elements in the samples with their relative atomic concentration. XPS measurements were obtained using a Thermofisher ESCALAB 250Xi photoelectron spectrometer (Loughborough, UK) equipped with a hemispherical sector energy analyser with a standard monochromatic Al Kα X-ray source (1486.6 eV) to enhance the resolution. The samples were analysed using a source excitation energy of 15 KeV and emission current of 6 mA, and the analyser passed an energy of 50 eV with a step size of 0.1 eV and a dwell time of 50 ms. As XPS measurements require dry samples, dry pieces of microplastics were used, i.e., PS cylindrical microbeads (1 ± 0.2 mm <diameter>; 0.4 ± 0.1 mm and 3 ± 0.1 mm <length> 2.5 ± 0.2 mm) and PET and PP square sheets (length × width ≈ 2 × 2 mm).

2.4. Raman Spectroscopy

A Raman spectroscopy analysis of the fragmented microplastics was performed to confirm the various functional groups of the different plastic materials. These were carried out using a proprietary free-space micro-Raman spectroscopic system based on a Horiba MicroHR spectrometer (Northampton, UK) equipped with a Sygnature CCD detector (Northampton, UK). The spectrometer has a spectral resolution of 0.25 nm and a scanning range of 0–1500 nm, whilst a 40× Melles Griot’s microscopic objective (London, UK) having a numerical aperture of 0.65 was used. The excitation source used within the setup was a continuous wave 532 nm Nd: YAG laser (G4 plus 150 Elforlight, Daventry, UK ) with a linewidth of less than 2 MHz. The excitation wavelength was chosen to maximise the Raman signal whilst reducing the fluorescence contributions from samples. All Raman signals were collected in reflection mode with an integration time of 1 s per pixel, whilst Raman spectra had manual baseline corrections applied to remove contributions from fluorescence and the detector’s saturation.

2.5. Fluorescence Spectroscopy

The fragmented MPs in an aqueous medium were analysed using a HORIBA Nano-log spectrofluorometer (Northampton, UK) that contains a 450 W xenon short-arc lamp housing with an off-axis ellipsoidal collector. The fluorescence excitation–emission (FLE) maps of different microplastics were recorded for a range of excitation wavelengths from 300 to 500 nm with an emission range of 315–600 nm. The experiment involved exciting the samples with a monochromatic beam, using a 2 nm slit width for the excitation monochromator and an excitation wavelength increment of Δλ = 5 nm. The emissions produced were then detected within an emission monochromator using the same slit width and wavelength increments integrated with an FL-1073 UV-visible room-temperature photomultiplier tube. Figure 1 presents the schematic for the FL measurements of different microplastics; with the incident monochromatic beam interacting with the microplastic particles immersed in DI water, the sample is contained in a cuvette. Some of the light passes through the sample, while the rest is either scattered or absorbed. The absorbed light excites the microplastic (MP) electrons, transitioning them from ground to excited states. As these electrons return to their ground state, they release energy in the form of a photon at a specific wavelength. To investigate the impact of DI water on the fluorescence signal, the FL measurements of DI water were recorded separately. The auto-fluorescence signal of different microplastics was recorded at θ = 90° for a range of excitation (λex) and emission (λem) wavelengths. The instrument was calibrated for water Raman peak before the FL measurements of microplastic samples. The recorded EEM data were analysed using the Windows-based FluorEssence software (v3.9.0.1), which has integrated Origin software.

3. Results and Discussion

The relative concentrations of chemical impurities in the samples were confirmed through XPS measurements to be 1.8%, 3.1%, and 5% for PS, PET, and PP, respectively (Table 1). In addition to these impurities, our results showed a considerable percentage of C-O bonds in polystyrene (7%) and polypropylene (11.2%) samples. The detected C-O bonds suggest surface-level oxidation, a well-established phenomenon in polymer surface chemistry. Previous studies indicate that PS and PP, though primarily hydrocarbon-based, can undergo oxidation when exposed to ambient air, resulting in oxygenated groups such as C-O and C=O on the polymer surface [39,40]. This process is often initiated by prolonged atmospheric oxygen exposure, UV radiation, or handling during sample preparation. Moreover, the PS sample contained a negligible fraction of ZnO that has no characteristic intrinsic fluorescence emissions in the analysed mapping range and also has no tendency to overlap in spectroscopic properties with common fluorophores [41,42,43]. On the other hand, PET and PP samples contain some additional chemical species to ZnO, such as siloxane, C-N, calcium carbonate (CaCO3), and sulfates in minor fractions. Meanwhile, siloxane (Si-O-Si) is intrinsically considered to be a non-fluorescent due to its flexibility caused by its bond length (0.164 ± 0.003 nm) and large bond angle (135–1800) [44]. The remaining sample impurities in PET and PP also show no intrinsic fluorescence emissions, including CaCO3 [45], carbon–nitrogen bonds [46], and sulphates [47]. Hence, the intrinsic fluorescence emissions reported hereafter in this study for the MPs are purely from their corresponding polymers.
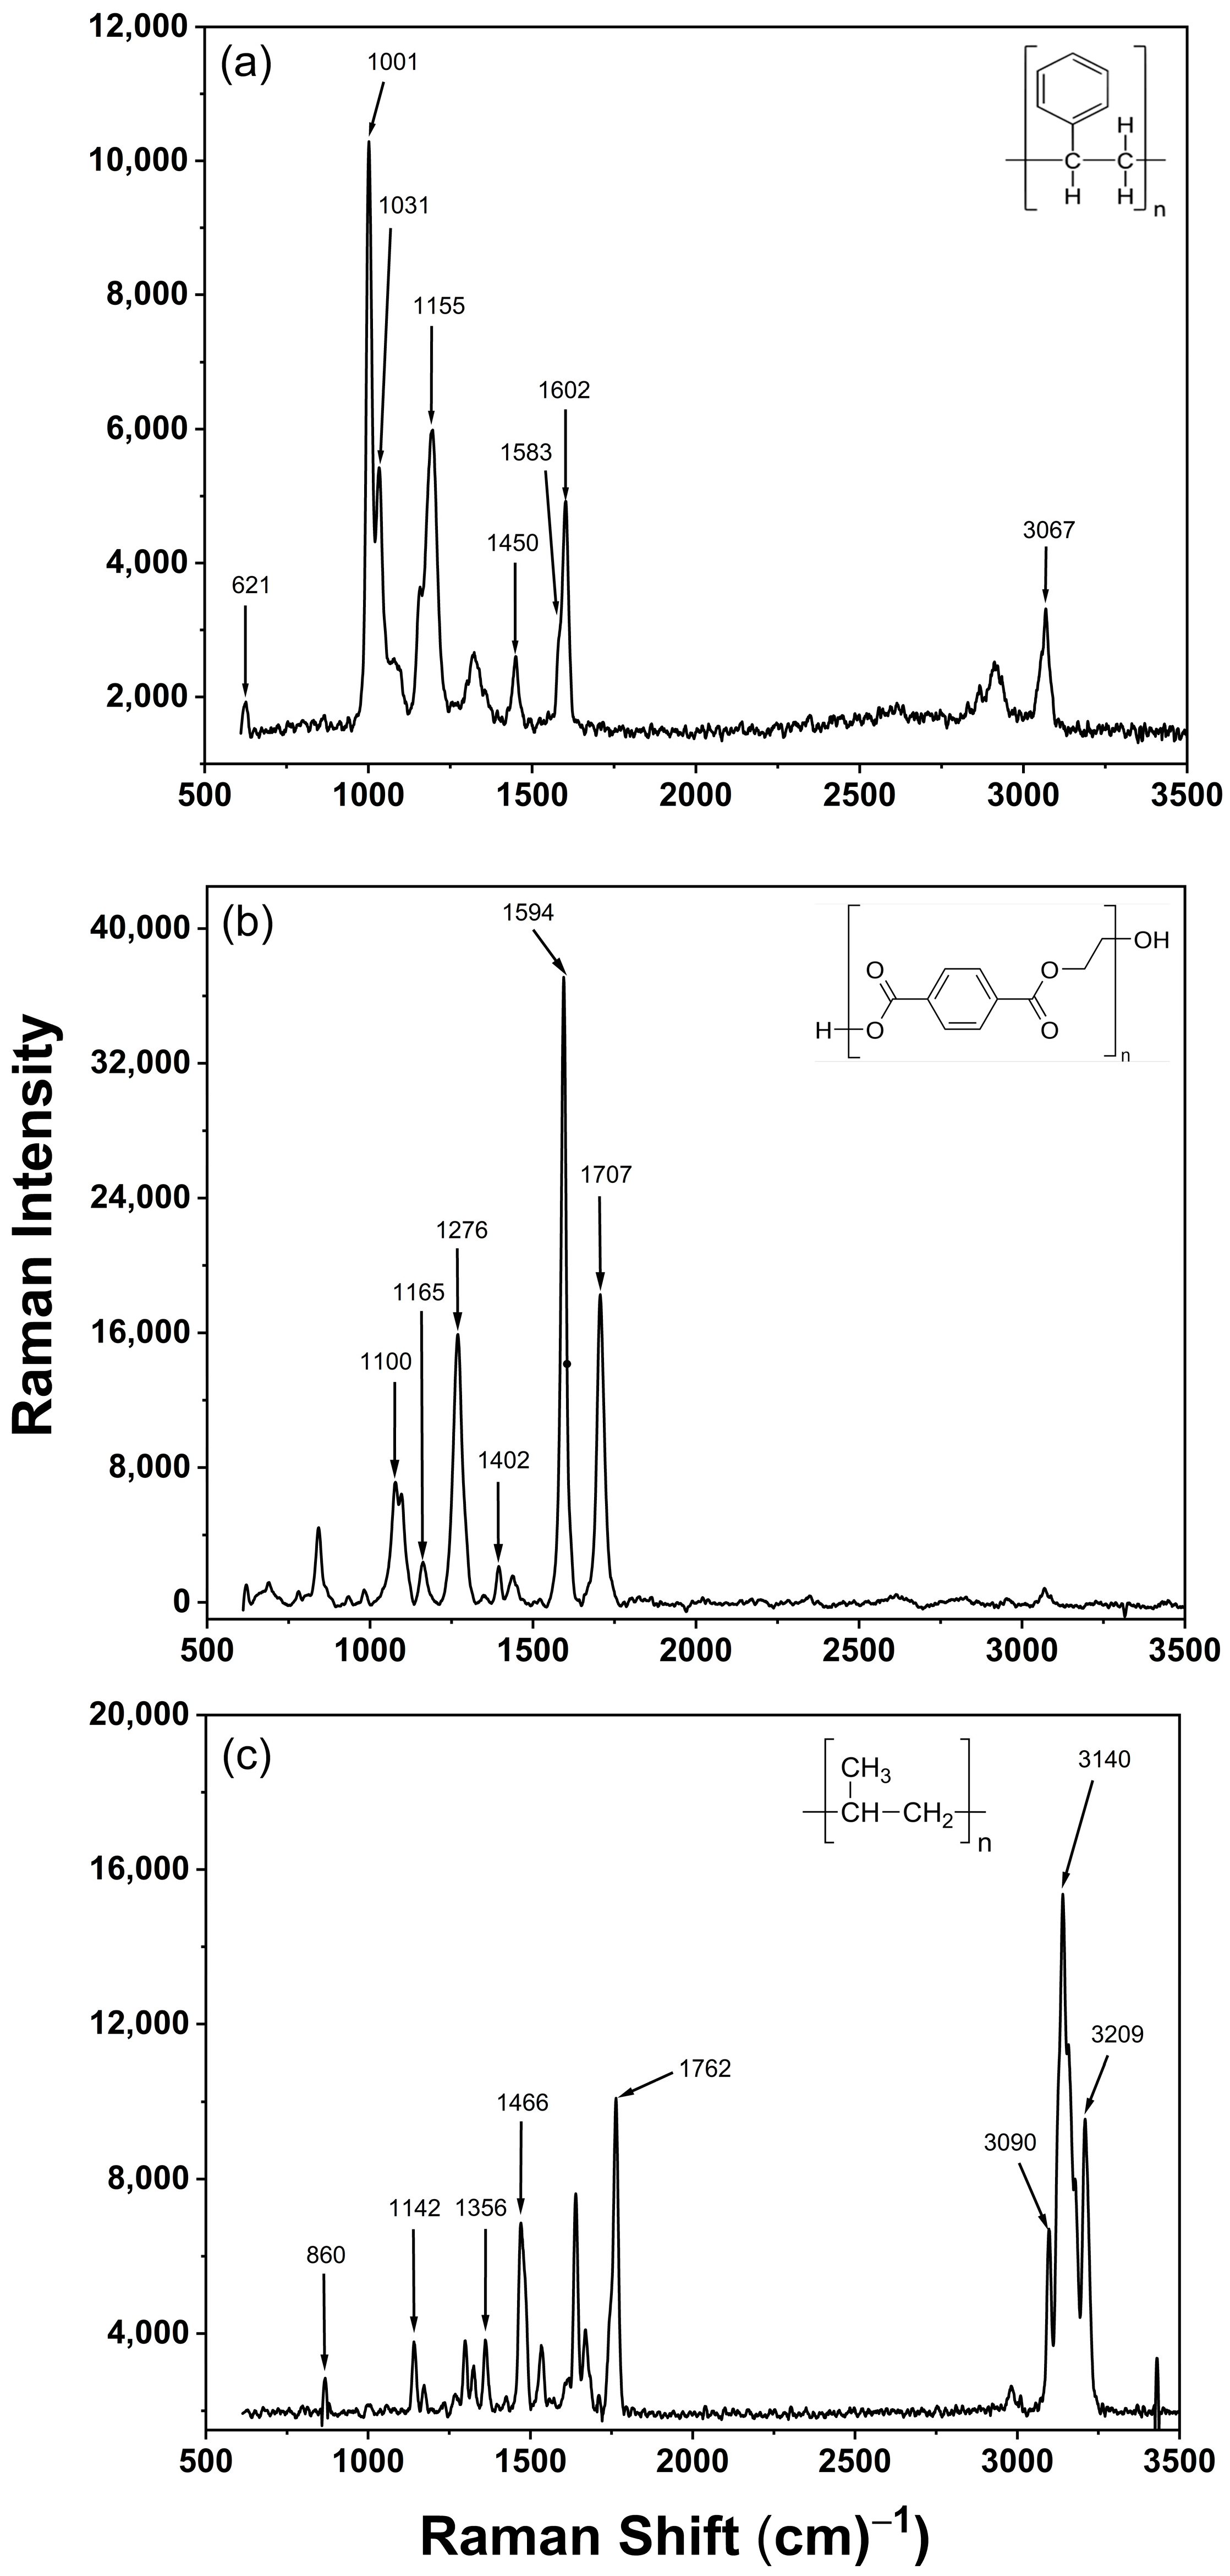
Figure 2 shows the acquired Raman spectra for the PS, PET, and PP MPs. The Raman bands for the different microplastics, assigned based on reported standards [48,49,50], are presented in Table 2. From Figure 2a, the formation of the predominant Raman band at the frequency of 1001 cm−1 is attributed to the ring breathing mode of the polystyrene, and the sharp shoulder associated with 1031 cm−1 is well correlated with the C-H in-plane deformation mode. The formation values for other bending and stretching modes of PS are 621 cm−1 (ring deformation mode), 1155 cm−1 (C-C stretch), 1450 cm−1 (CH2 scissoring), 1583 cm-1 (C=C stretch), and 1620 cm−1 (ring skeletal stretch) [48].
Figure 2b shows the Raman spectrum of PET in which the intense band at 1594 cm−1 is due to the presence of the C-C bond in the aromatic ring. The formations of additional bands at 1100 cm−1, 1165 cm−1, 1276 cm−1, 1402 cm−1, and 1707 cm−1 correspond to the -C(O)-O (ester) and C-C bonds, C-H and C-C stretch (ring in-plane vibration), C(O)-O stretching, CCH bending, and OCH bending and stretching C=O vibrations, respectively. The observed results correlated well with those reported elsewhere [49]. Figure 2c shows the spectrum of PP with a broad peak (2800–3000 cm−1) composed of one major band at 2892 cm−1 and two corresponding shoulders at 2847 cm−1 and 2963 cm−1, which represents the stretching vibrations of the C-H bond [50]. The appearance of other vibrational modes at 811 cm−1 and 977 cm−1, 1155 cm−1,1331 cm−1, and 1460 cm−1 can be related to C-C stretching and CH3 bond rocking, C-C stretching and CH bending, CH stretching, CH2 wagging, and CH3 bending, and CH2 bending and CH3 asymmetric bending, respectively [51].
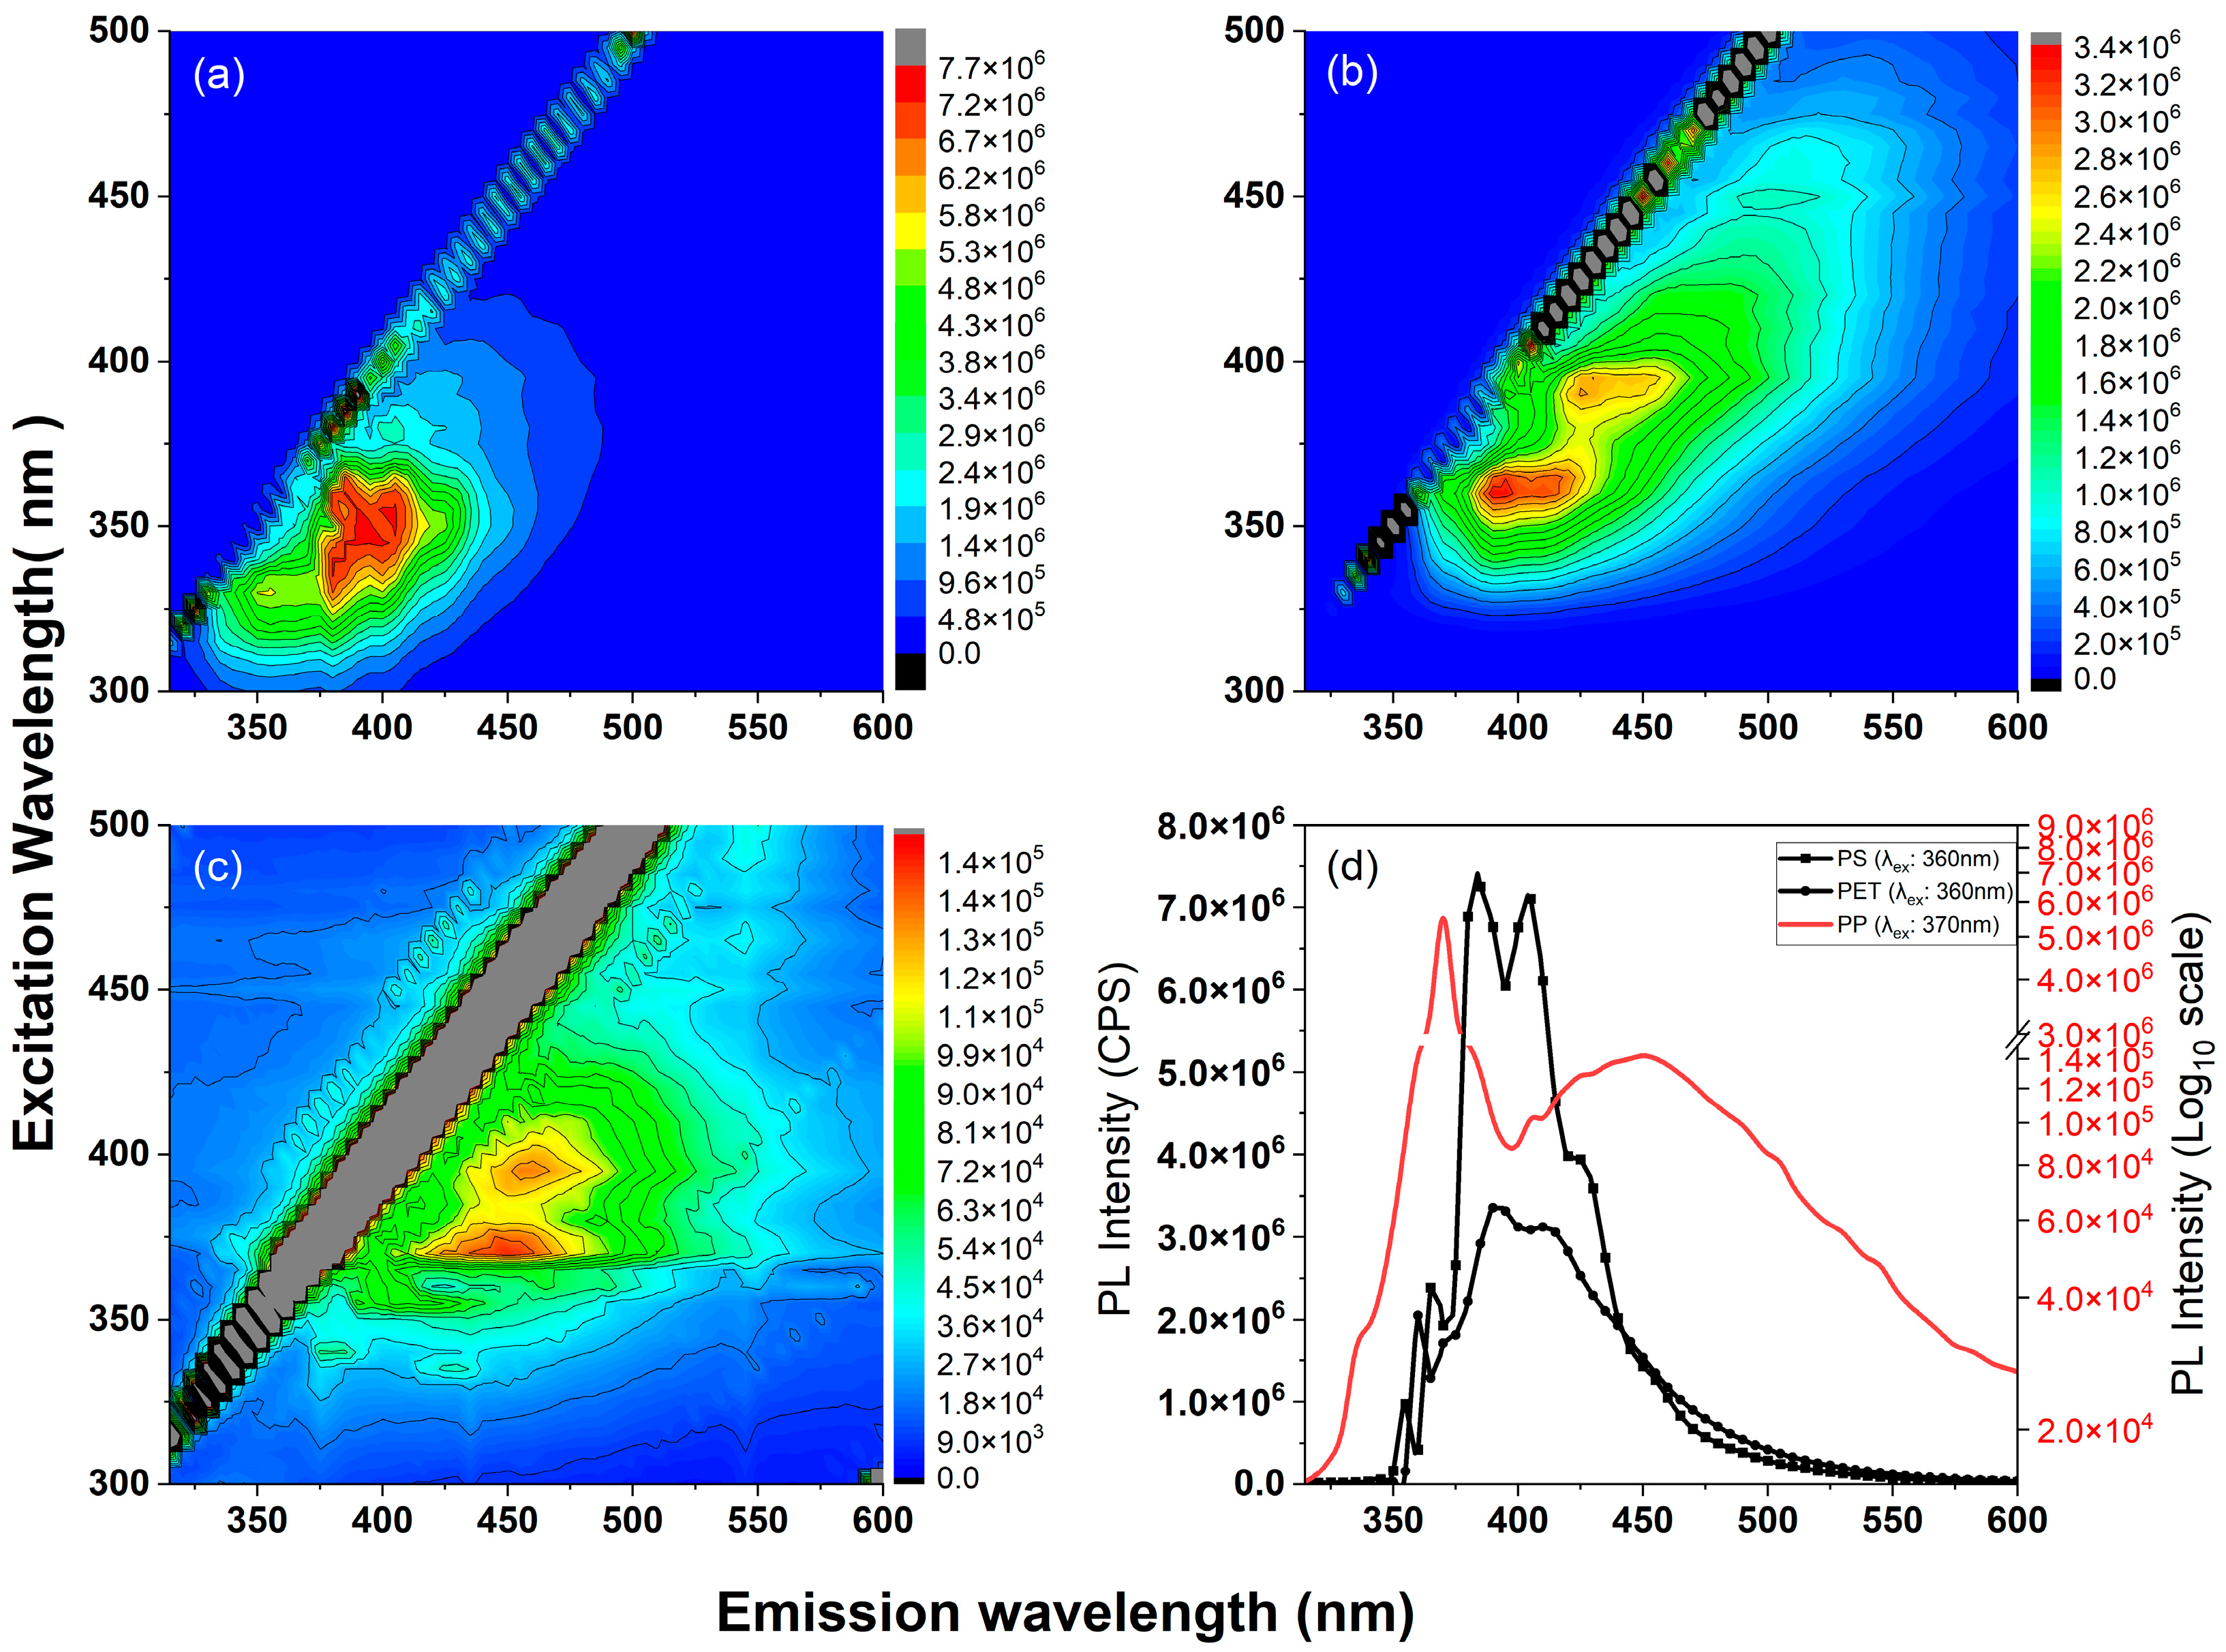
The FLE maps of all three microplastic samples, PS, PET, and PP, are shown in Figure 3. For PS microplastic (Figure 3a), the FLE map illustrates a 2D contour map with an intensity scale bar displaying bright emissions in the λem wavelength range of 350–450 nm when excited within the λex range of 300–400 nm.
The PET microplastic can be seen to exhibit a distinctive FLE map (Figure 3b) with two separate FL emission regions. The first region demonstrates FL emissions between 370 and 510 nm when excited between 330 and380 nm, whilst the second region showcases emissions from 400 to 530 nm when excited between 380 and 485 nm. Notably, emissions in the first region (λem = 330–380 nm) are substantially more intense than those in the second region (λem = 380–485 nm).
Polypropylene (PP) displays an FLE map with two prominent FL emission regions similar to that of PET (Figure 3c). In the first region, high-intensity FL emissions are observed between 400 and 550 nm when excited between 360 and 380 nm, while the second region shows relatively lower-intensity emissions between 425 and 550 nm when excited between 385 and 430 nm.
The FLE maps (Figure 3a–c) offer valuable insights into the optimal excitation wavelengths for each microplastic type, resulting in the FL emissions spectra of high intensity, as depicted in Figure 3d. Our findings indicate the following: the most effective excitation wavelength for PS is observed at 360 nm, yielding two major peaks at 380 nm and 400 nm; PET performs optimally with an excitation wavelength of 360 nm, resulting in three emission peaks, with the primary peak at 390 nm; PP exhibits the most intense FL with an excitation wavelength of 370 nm and the maximum FL intensity recorded at 450 nm. The measurements reveal Stokes shifts of 40 nm, 30 nm, and 70 nm for PS, PET, and PP, respectively. The FLE mapping of deionised (DI) water in a cuvette without microplastic particles shows no intrinsic FL emission (Supplementary Materials, Figure S2). This confirms that the recorded emissions from the microplastic samples exclusively originate from the fragmented microplastics themselves.
Our results, therefore, confirm that the spectral characteristics of the examined microplastics (PS, PET, and PP) differ from each other, and therefore, through exciting FL at their respective optimal wavelengths, one can potentially distinguish and identify them from each other based on their distinctive FL spectral fingerprints.
In general, the fluorescence emission mechanism from microplastics, including polystyrene (PS), polyethylene terephthalate (PET), and polypropylene (PP), arises from intrinsic photophysical processes associated with the chemical structure of these polymers. Each polymer contains chromophoric groups that, upon excitation, emit characteristic fluorescence signals due to π-conjugated bonds or other reactive functional groups introduced through polymerisation and environmental ageing. For example, PS contains aromatic rings that facilitate π-π* transitions, resulting in distinctive fluorescence under UV excitation, whereas PET’s carbonyl and ester linkages contribute to strong n-π* and π-π* transitions that result in detectable fluorescence emissions when excited within certain wavelength ranges [52,53]. In PP, fluorescence is typically weak due to its non-aromatic structure. However, environmental factors such as surface oxidation and UV exposure can induce oxygenated groups (C-O, C=O) on the PP surface, enhancing the fluorescence signal and enabling detection [54].
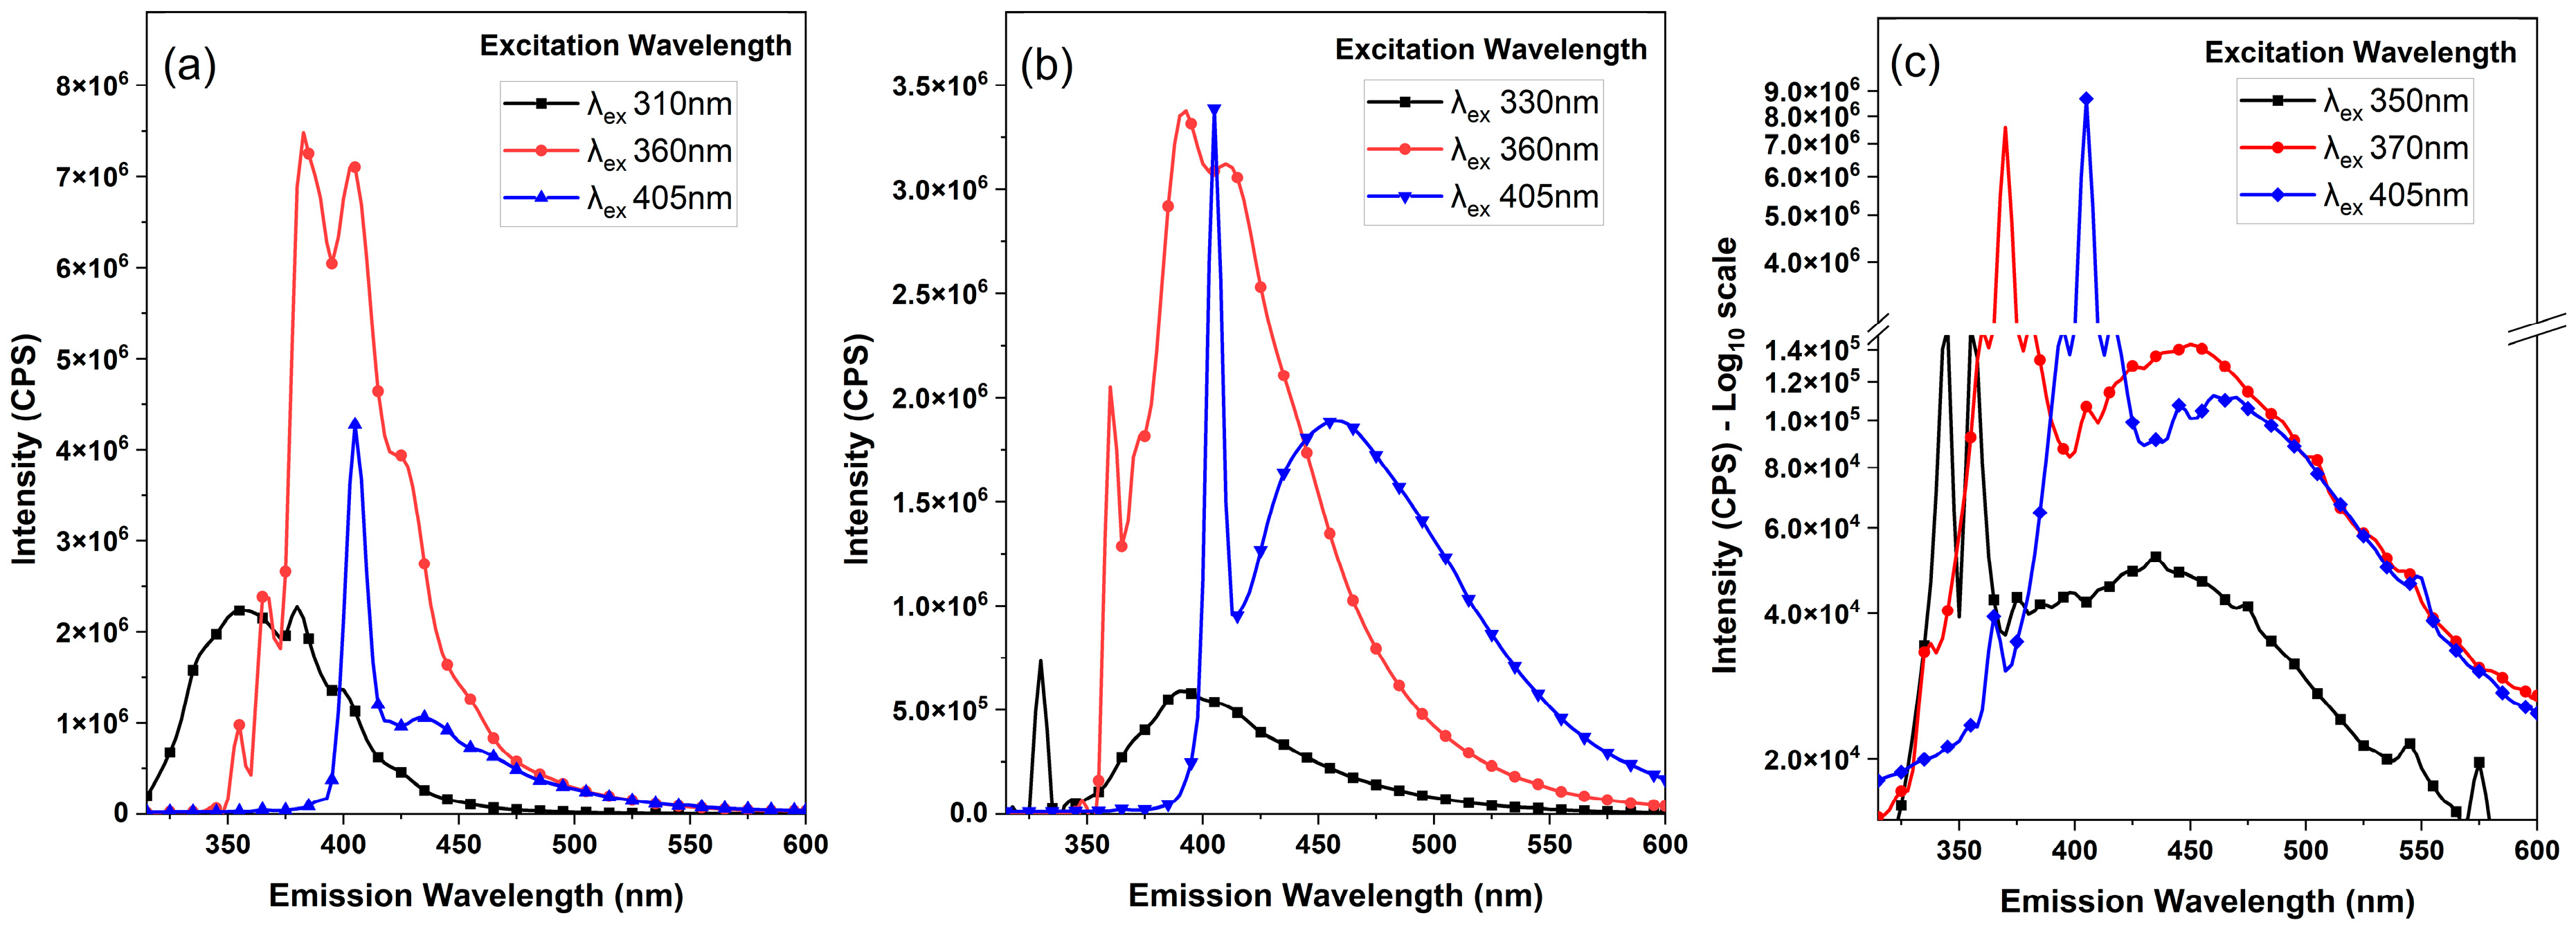
To gain further insight into identifying different microplastics based on their optimised single-probe excitation wavelength, the spectral fingerprints of all microplastics were extracted from their respective FLE maps. The extracted spectral fingerprints from 2D excitation–emission maps of all microplastics (PS, PET, and PP) are presented in Figure 4a–c. Figure 4a displays three distinct spectra for polystyrene, recorded at excitation wavelengths (λex) of 310 nm, 360 nm, and 405 nm. The figure shows that when excited at λex = 310 nm, the FL spectrum of PS exhibits a peak centred at 355 nm, accompanied by weak shoulder peaks at 380 nm, 400 nm, and 425 nm. Increasing the excitation wavelength to 360 nm significantly (~3.3 times) enhanced the FL intensity compared to that from the excitation at 310 nm. Within this region, the FL emission peak splits into two maxima at 380 nm and 405 nm, indicating characteristic FL originating from conjugated styrene units [55]. Moreover, a broad shoulder is recorded at λem 425 nm and λem 455 nm, indicating that the FL emissions originate from π-conjugated bonds [56]. Thereafter, at the excitation wavelength of 405 nm, another broad emission spectrum centred at 435 nm, with a shoulder at 460 nm, is observed, aligning well with previously published results for a single-wavelength excitation at 405 nm for PS microplastics [37]. The sharp peak in the FL spectrum for λex 405 nm (Figure 4a) may be attributed to the Rayleigh scattering of the PS microplastics. Finally, it is notable that while prior studies have reported FL emissions from polystyrene in the range of 300–330 nm when excited at λex 253–265 [52,55,57], our FLE mapping study indicates that the dominant FL emission for PS microplastic detection occurs at λex 360 nm, which is approximately 3.3 times higher than that at λex 310 nm and roughly 7 times higher than that at λex 405 nm.
Figure 4b shows three distinct spectral fingerprints extracted from the FLE map of PET microplastic. The two spectra recorded at excitation wavelengths λex 330 nm and 360 nm correspond to the first bright emission zone of the 2D FLE map of PET in Figure 3b, while the spectrum recorded at λex 405 nm belongs to the second emission region of the same figure. The first spectrum in Figure 4b shows that when excited at 330 nm, there is a broad peak with emission maxima centred at 390 nm, along with a weak shoulder at 410 nm, whilst the second, at 360 nm, shows a significant increase in emission intensity (approximately 5.6 times), resulting in prominent FL emission maxima at 390 nm and 410 nm. All the above fluorescence emissions for the excitation wavelengths 330 nm and 360 nm occurred due to the π*←n electronic transition associated with the carbonyl group of the conjugated phenylene ring. These emissions are quite likely due to the interaction of the carbonyl group with the π-electrons of the phenylene ring, which reduces coplanarity and speeds up the π*←n transition of the non-coplanar C=O group [58]. Similarly, the FL emission bands at 390 and 410 nm from PET polymer were previously reported by Days and Wales [59] at an excitation wavelength of 340 nm, and they were associated with the ground-state monomer, dimer, and excimers of polyethylene terephthalate [53,60,61,62,63]. Further increasing the excitation to 405 nm causes consecutive redshifts with observation of FL emissions with broad maxima at 460 nm (Figure 4b). However, among all acquired FL spectra from PET, the most intense fluorescent emission was observed at λex 360 nm, which is ~1.8 times higher than that at λex 405 nm.
Figure 4c displays the dominant FL features of polypropylene (PP), with the first spectrum corresponding to an excitation of 350 nm exhibiting a broad FL emission with a maximum centred at 435 nm. Increasing the excitation wavelength to 370 nm in the second spectrum shows that the FL emission intensity is significantly enhanced (approximately 2.7 times higher than that at 350 nm), which results in a 20 nm redshift in the emission maxima. The FL emission at 455 nm is associated with the presence of polyenone, and as the polyene length increases, it implies the formation of complexes such as excimers or exciplexes [64]. Increasing the excitation wavelength to 405 nm leads to additional redshifts, as seen in the third spectrum, resulting in an emission at 465 nm and additional shoulder humps, different to those seen previously, at 445 nm (shoulder), 465 nm (main peak), 550 nm (shoulder), and 665 nm (shoulder). The emissions at 455 nm and the broadening of the spectrum are indicative of a higher degree of oxidation [62]. Based on the analysis conducted through FLE mapping, it was determined that polypropylene exhibits the highest FL emission when excited at 370 nm, resulting in an emission peak at 460 nm.
Based on the extracted spectra of all three microplastics (MPs) shown in Figure 4, the spectra selected as fingerprints were those exhibiting the highest fluorescence emission intensity when excited at their respective optimal wavelengths. These unique intrinsic emissions from each type of MP can serve as reference spectral fingerprints for real-time analysis of environmental microplastic samples. Researchers can more accurately identify and quantify microplastics using these reference spectra in various environmental contexts, even with a suitable miniaturised excitation light source and portable USB-type spectrometer. The novelty of our approach lies in optimising excitation wavelengths, as conventional methods typically use a single excitation wavelength, yielding a weaker emission signal. Our study achieves a significantly enhanced emission signal by using optimised wavelengths, thereby improving the sensitivity and applicability of this method for detecting microplastics in real aquatic samples. Furthermore, this technique enables the rapid and label-free identification of microplastics with minimal sample preparation, offering a non-destructive approach for accurately detecting and characterising microplastics in aqueous environments. Moreover, environmental factors such as surface oxidation can further enhance fluorescence signals, offering spectral fingerprints unique to each polymer type [65].
The challenge of distinguishing microplastics (MPs) from other organic materials in real aqueous environments can be catered to using unique excitation–emission characteristics of MPs observed in this study. MPs exhibit distinct spectral profiles due to their polymeric structures and specific additives, differentiating them from natural organic matter that is commonly present in aquatic samples [66]. However, in some cases, the fluorescence spectra of microplastics overlap with the spectra obtained from organic matter, which can complicate the detection and identification process [36,37]. By carefully selecting an optimised excitation wavelength, the intrinsic fluorescence of MPs can be enhanced while minimising interference from other organic compounds, a strategy also highlighted in a recent fluorescence-based detection study [67]. Furthermore, studies have also suggested that integrating machine learning or spectral pattern recognition could significantly improve this method’s ability to distinguish MPs from organic materials present in the aquatic sample [68,69]. These methodological considerations will allow our approach to distinguish MPs better in real aqueous environmental matrices.

4. Conclusions

Our study employed FLE mapping analysis to investigate microplastic contaminants extracted from polystyrene, polyethylene terephthalate, and polypropylene macroscopic materials to gain insights into their dominant intrinsic FL excitation and emission features. Through our analysis, we determined the most intense fluorescence emissions against the optimal excitation wavelengths for each type of microplastic.
  • For polystyrene, peak FL emissions occurred at 380 nm and 405 nm when excited at 360 nm.
  • Polyethylene terephthalate exhibited its most intense FL emissions at 390 nm when excited at 360 nm.
  • Polypropylene displayed its dominant FL emissions at 455 nm when excited at 370 nm.
These distinct fluorescence emissions originated from different molecular properties: Polystyrene’s emissions were tied to its conjugated styrene units; for polyethylene terephthalate, emissions were linked to dimerisation and phenylene-carbonyl transitions; polypropylene’s emissions were associated with polyenone excimers. The unique fluorescence spectra and optimal excitation wavelengths identified for each microplastic type can be invaluable for precise, label-free identification and detection. Our study provides a foundation for the development of a non-destructive and label-free fluorescence spectroscopic method for analysing microplastics across various environmental settings, including plants, food, and aquatic ecosystems. This research holds promise for improving our ability to monitor and address the impact of microplastics in diverse environmental matrices.

Supplementary Materials

The following supporting information can be downloaded at: https://www.mdpi.com/article/10.3390/photochem4040030/s1, Figure S1: SEM images indicating the surface morphologies of (a) polystyrene—PS, (b) polyethylene terephthalate—PET, and (c) polypropylene—PP; Figure S2: Fluorescence excitation–emission map of deionised water; Text S1: Sensitivity of micro/nanoplastic detection by fluorescence spectroscopy [70,71,72,73].

Author Contributions

S.A.I.: conceptualisation, methodology, experimental work, data curation and analysis, writing—original draft preparation, writing—review and editing; A.B.: methodology, experimental work, data curation and analysis, writing—original draft preparation; R.C.M.: conceptualisation, methodology, writing—original draft preparation, writing—review and editing; D.H.: writing—review and editing, funding acquisition; A.R.: conceptualisation, methodology, writing—review and editing, supervision. All authors have read and agreed to the published version of the manuscript.

Funding

This work has received funding from the European Union’s Horizon 2020, under the Marie Skłodowska-Curie Innovative Training Networks (MSCA-ITN-ETN) grant agreement number 860775.

Data Availability Statement

The raw data supporting the conclusions of this article will be made available by the authors on request.

Acknowledgments

The authors acknowledge John Sullivan and Baogui Shi from Midlands Surface Analysis Ltd. for the insightful suggestion and valuable discussion on XPS measurement and analysis.

Conflicts of Interest

The authors declare that they have no known competing financial interests or personal relationships that could have appeared to influence the work reported in this paper.

References

  1. Ogunola, O.S.; Onada, O.A.; Falaye, A.E. Mitigation measures to avert the impacts of plastics and microplastics in the marine environment (a review). Environ. Sci. Pollut. Res. 2018, 25, 9293–9310. [Google Scholar] [CrossRef] [PubMed]
  2. Nirmala, K.; Rangasamy, G.; Ramya, M.; Shankar, V.U.; Rajesh, G. A critical review on recent research progress on microplastic pollutants in drinking water. Environ. Res. 2023, 222, 115312. [Google Scholar] [CrossRef] [PubMed]
  3. Song, Y.K.; Hong, S.H.; Jang, M.; Han, G.M.; Jung, S.W.; Shim, W.J. Combined effects of UV exposure duration and mechanical abrasion on microplastic fragmentation by polymer type. Environ. Sci. Technol. 2017, 51, 4368–4376. [Google Scholar] [CrossRef]
  4. Al Harraq, A.; Brahana, P.J.; Arcemont, O.; Zhang, D.; Valsaraj, K.T.; Bharti, B. Effects of weathering on microplastic dispersibility and pollutant uptake capacity. ACS Environ. Au 2022, 2, 549–555. [Google Scholar] [CrossRef]
  5. Zhou, C.; Bi, R.; Su, C.; Liu, W.; Wang, T. The emerging issue of microplastics in marine environment: A bibliometric analysis from 2004 to 2020. Mar. Pollut. Bull. 2022, 179, 113712. [Google Scholar] [CrossRef]
  6. Xu, L.; Chen, Y.; Feng, A.; Shi, X.; Feng, Y.; Yang, Y.; Wang, Y.; Wu, Z.; Zou, Z.; Ma, W. Study on detection method of microplastics in farmland soil based on hyperspectral imaging technology. Environ. Res. 2023, 232, 116389. [Google Scholar] [CrossRef]
  7. Gasperi, J.; Wright, S.L.; Dris, R.; Collard, F.; Mandin, C.; Guerrouache, M.; Langlois, V.; Kelly, F.J.; Tassin, B. Microplastics in air: Are we breathing it in? Curr. Opin. Environ. Sci. Health 2018, 1, 1–5. [Google Scholar] [CrossRef]
  8. Barboza, L.G.A.; Vethaak, A.D.; Lavorante, B.R.; Lundebye, A.-K.; Guilhermino, L. Marine microplastic debris: An emerging issue for food security, food safety and human health. Mar. Pollut. Bull. 2018, 133, 336–348. [Google Scholar] [CrossRef]
  9. Leslie, H.A.; Van Velzen, M.J.; Brandsma, S.H.; Vethaak, A.D.; Garcia-Vallejo, J.J.; Lamoree, M.H. Discovery and quantification of plastic particle pollution in human blood. Environ. Int. 2022, 163, 107199. [Google Scholar] [CrossRef] [PubMed]
  10. Barrett, J.; Chase, Z.; Zhang, J.; Holl, M.M.B.; Willis, K.; Williams, A.; Hardesty, B.D.; Wilcox, C. Microplastic pollution in deep-sea sediments from the Great Australian Bight. Front. Mar. Sci. 2020, 7, 576170. [Google Scholar] [CrossRef]
  11. Wesch, C.; Bredimus, K.; Paulus, M.; Klein, R. Towards the suitable monitoring of ingestion of microplastics by marine biota: A review. Environ. Pollut. 2016, 218, 1200–1208. [Google Scholar] [CrossRef] [PubMed]
  12. Stock, V.; Böhmert, L.; Lisicki, E.; Block, R.; Cara-Carmona, J.; Pack, L.K.; Selb, R.; Lichtenstein, D.; Voss, L.; Henderson, C.J. Uptake and effects of orally ingested polystyrene microplastic particles in vitro and in vivo. Arch. Toxicol. 2019, 93, 1817–1833. [Google Scholar] [CrossRef] [PubMed]
  13. Cesa, F.S.; Turra, A.; Baruque-Ramos, J. Synthetic fibers as microplastics in the marine environment: A review from textile perspective with a focus on domestic washings. Sci. Total Environ. 2017, 598, 1116–1129. [Google Scholar] [CrossRef]
  14. Xu, J.-L.; Thomas, K.V.; Luo, Z.; Gowen, A.A. FTIR and Raman imaging for microplastics analysis: State of the art, challenges and prospects. TrAC Trends Anal. Chem. 2019, 119, 115629. [Google Scholar] [CrossRef]
  15. Elert, A.M.; Becker, R.; Duemichen, E.; Eisentraut, P.; Falkenhagen, J.; Sturm, H.; Braun, U. Comparison of different methods for MP detection: What can we learn from them, and why asking the right question before measurements matters? Environ. Pollut. 2017, 231, 1256–1264. [Google Scholar] [CrossRef]
  16. Phan, S.; Padilla-Gamiño, J.L.; Luscombe, C.K. The effect of weathering environments on microplastic chemical identification with Raman and IR spectroscopy: Part I. polyethylene and polypropylene. Polym. Test. 2022, 116, 107752. [Google Scholar] [CrossRef]
  17. Dey, T. Microplastic pollutant detection by Surface Enhanced Raman Spectroscopy (SERS): A mini-review. Nanotechnol. Environ. Eng. 2023, 8, 41–48. [Google Scholar] [CrossRef]
  18. Cole, M.; Lindeque, P.; Fileman, E.; Halsband, C.; Goodhead, R.; Moger, J.; Galloway, T.S. Microplastic ingestion by zooplankton. Environ. Sci. Technol. 2013, 47, 6646–6655. [Google Scholar] [CrossRef]
  19. Anger, P.M.; von der Esch, E.; Baumann, T.; Elsner, M.; Niessner, R.; Ivleva, N.P. Raman microspectroscopy as a tool for microplastic particle analysis. TrAC Trends Anal. Chem. 2018, 109, 214–226. [Google Scholar] [CrossRef]
  20. Mogha, N.K.; Shin, D. Nanoplastic detection with surface enhanced Raman spectroscopy: Present and future. TrAC Trends Anal. Chem. 2023, 158, 116885. [Google Scholar] [CrossRef]
  21. Choi, D.S.; Lim, S.; Park, J.-S.; Kim, C.-H.; Rhee, H.; Cho, M. Label-free live-cell imaging of internalized microplastics and cytoplasmic organelles with multicolor CARS microscopy. Environ. Sci. Technol. 2022, 56, 3045–3055. [Google Scholar] [CrossRef] [PubMed]
  22. Fortin, S.; Song, B.; Burbage, C. Quantifying and identifying microplastics in the effluent of advanced wastewater treatment systems using Raman microspectroscopy. Mar. Pollut. Bull. 2019, 149, 110579. [Google Scholar] [CrossRef] [PubMed]
  23. Käppler, A.; Windrich, F.; Löder, M.G.; Malanin, M.; Fischer, D.; Labrenz, M.; Eichhorn, K.-J.; Voit, B. Identification of microplastics by FTIR and Raman microscopy: A novel silicon filter substrate opens the important spectral range below 1300 cm−1 for FTIR transmission measurements. Anal. Bioanal. Chem. 2015, 407, 6791–6801. [Google Scholar] [CrossRef] [PubMed]
  24. Chen, Y.; Wen, D.; Pei, J.; Fei, Y.; Ouyang, D.; Zhang, H.; Luo, Y. Identification and quantification of microplastics using Fourier-transform infrared spectroscopy: Current status and future prospects. Curr. Opin. Environ. Sci. Health 2020, 18, 14–19. [Google Scholar] [CrossRef]
  25. Nahorniak, M.L.; Booksh, K.S. Excitation-emission matrix fluorescence spectroscopy in conjunction with multiway analysis for PAH detection in complex matrices. Analyst 2006, 131, 1308–1315. [Google Scholar] [CrossRef]
  26. Strasburg, G.M.; Ludescher, R.D. Theory and applications of fluorescence spectroscopy in food research. Trends Food Sci. Technol. 1995, 6, 69–75. [Google Scholar] [CrossRef]
  27. Baibarac, M.; Baltog, I.; Lefrant, S.; Mevellec, J.; Bucur, C. Vibrational and photoluminescence properties of the polystyrene functionalized single-walled carbon nanotubes. Diam. Relat. Mater. 2008, 17, 1380–1388. [Google Scholar] [CrossRef]
  28. Healy, M.S.; Hanson, J.E. Fluorescence excitation spectroscopy of polystyrene near the critical concentration c. J. Appl. Polym. Sci. 2007, 104, 360–364. [Google Scholar] [CrossRef]
  29. Torkelson, J.M.; Lipsky, S.; Tirrell, M.; Tirrell, D.A. Fluorescence and absorbance of polystyrene in dilute and semidilute solutions. Macromolecules 1983, 16, 326–330. [Google Scholar] [CrossRef]
  30. Fechine, G.; Souto-Maior, R.; Rabello, M. Photodegradation of multilayer films based on PET copolymers. J. Appl. Polym. Sci. 2007, 104, 51–57. [Google Scholar] [CrossRef]
  31. Charlesby, A.; Partridge, R. Thermoluminescence and phosphorescence in polyethylene under ultra-violet irradiation. Proc. R. Soc. London. Ser. A Math. Phys. Sci. 1965, 283, 329–342. [Google Scholar]
  32. Osawa, Z.; Kuroda, H. Luminescence emission of high-density polyethylene. J. Polym. Sci. Polym. Lett. Ed. 1982, 20, 577–581. [Google Scholar] [CrossRef]
  33. Douminge, L.; Mallarino, S.; Cohendoz, S.; Feaugas, X.; Bernard, J. Extrinsic fluorescence as a sensitive method for studying photo-degradation of high density polyethylene part I. Curr. Appl. Phys. 2010, 10, 1211–1215. [Google Scholar] [CrossRef]
  34. Allen, N.; Homer, J.; McKellar, J.; Wood, D. Identification of the luminescent species in low-density polyethylene. J. Appl. Polym. Sci. 1977, 21, 3147–3152. [Google Scholar] [CrossRef]
  35. Allen, N.; Homer, J.; McKellar, J. Origin and role of the luminescent species in the photo-oxidation of commercial polypropylene. J. Appl. Polym. Sci. 1977, 21, 2261–2267. [Google Scholar] [CrossRef]
  36. Konde, S.; Ornik, J.; Prume, J.A.; Taiber, J.; Koch, M. Exploring the potential of photoluminescence spectroscopy in combination with Nile Red staining for microplastic detection. Mar. Pollut. Bull. 2020, 159, 111475. [Google Scholar] [CrossRef]
  37. Ornik, J.; Sommer, S.; Gies, S.; Weber, M.; Lott, C.; Balzer, J.C.; Koch, M. Could photoluminescence spectroscopy be an alternative technique for the detection of microplastics? First experiments using a 405 nm laser for excitation. Appl. Phys. B 2020, 126, 1–7. [Google Scholar] [CrossRef]
  38. Gies, S.; Schömann, E.-M.; Anna Prume, J.; Koch, M. Exploring the potential of time-resolved photoluminescence spectroscopy for the detection of plastics. Appl. Spectrosc. 2020, 74, 1161–1166. [Google Scholar] [CrossRef]
  39. Bartis, E.A.J.; Luan, P.; Knoll, A.J.; Hart, C.; Seog, J.; Oehrlein, G.S. Polystyrene as a model system to probe the impact of ambient gas chemistry on polymer surface modifications using remote atmospheric pressure plasma under well-controlled conditions. Biointerphases 2015, 10, 029512. [Google Scholar] [CrossRef]
  40. Du, H.; Komuro, A.; Ono, R. Quantitative and selective study of the effect of O radicals on polypropylene surface treatment. Plasma Sources Sci. Technol. 2023, 32, 075013. [Google Scholar] [CrossRef]
  41. Adalsteinsson, V.; Parajuli, O.; Kepics, S.; Gupta, A.; Reeves, W.B.; Hahm, J.-I. Ultrasensitive detection of cytokines enabled by nanoscale ZnO arrays. Anal. Chem. 2008, 80, 6594–6601. [Google Scholar] [CrossRef] [PubMed]
  42. Dorfman, A.; Kumar, N.; Hahm, J.-I. Highly sensitive biomolecular fluorescence detection using nanoscale ZnO platforms. Langmuir 2006, 22, 4890–4895. [Google Scholar] [CrossRef]
  43. Dorfman, A.; Parajuli, O.; Kumar, N.; Hahm, J.-I. Novel Telomeric Repeat Elongation Assay Performed on Zinc Oxide Nanorod Array Supports. J. Nanosci. Nanotechnol. 2008, 8, 410–415. [Google Scholar] [CrossRef] [PubMed]
  44. Lu, H.; Hu, Z.; Feng, S. Nonconventional Luminescence Enhanced by Silicone-Induced Aggregation. Chem. Asian J. 2017, 12, 1213–1217. [Google Scholar] [CrossRef] [PubMed]
  45. Gaft, M.; Nagli, L.; Panczer, G.; Waychunas, G.; Porat, N. The nature of unusual luminescence in natural calcite CaCO3. Am. Mineral. 2008, 93, 158–167. [Google Scholar] [CrossRef]
  46. Padwa, A. Photochemistry of the carbon-nitrogen double bond. Chem. Rev. 1977, 77, 37–68. [Google Scholar] [CrossRef]
  47. Kaszowska, Z.; Malek, K.; Staniszewska-Slezak, E.; Niedzielska, K. Raman scattering or fluorescence emission? Raman spectroscopy study on lime-based building and conservation materials. Spectrochim. Acta Part A Mol. Biomol. Spectrosc. 2016, 169, 7–15. [Google Scholar] [CrossRef] [PubMed]
  48. Mazilu, M.; Luca, A.C.D.; Riches, A.; Herrington, C.S.; Dholakia, K. Optimal algorithm for fluorescence suppression of modulated Raman spectroscopy. Opt. Express 2010, 18, 11382–11395. [Google Scholar] [CrossRef]
  49. Rebollar, E.; Pérez, S.; Hernández, M.; Domingo, C.; Martín, M.; Ezquerra, T.A.; García-Ruiz, J.P.; Castillejo, M. Physicochemical modifications accompanying UV laser induced surface structures on poly(ethylene terephthalate) and their effect on adhesion of mesenchymal cells. Phys. Chem. Chem. Phys. 2014, 16, 17551–17559. [Google Scholar] [CrossRef]
  50. Meng, M.; Feng, Y.; Liu, Y.; Dai, X.; Pan, J.; Yan, Y. Fabrication of submicrosized imprinted spheres attached polypropylene membrane using “two-dimensional” molecular imprinting method for targeted separation. Adsorpt. Sci. Technol. 2017, 35, 162–177. [Google Scholar] [CrossRef]
  51. Guo, X.; Lin, Z.; Wang, Y.; He, Z.; Wang, M.; Jin, G. In-line monitoring the degradation of polypropylene under multiple extrusions based on Raman spectroscopy. Polymers 2019, 11, 1698. [Google Scholar] [CrossRef] [PubMed]
  52. Pichat, L.; Pesteil, P.; Clément, J. Solides fluorescents non cristallins pour mesures de radiactivité. J. De Chim. Phys. 1953, 50, 26–41. [Google Scholar] [CrossRef]
  53. Allen, N.S.; McKellar, J.F. Luminescent species in poly (ethylene terephthalate). Die Makromol. Chem. 1978, 179, 523–526. [Google Scholar] [CrossRef]
  54. Saudrais, F.; Schvartz, M.; Renault, J.-P.; Vieira, J.; Devineau, S.; Leroy, J.; Taché, O.; Boulard, Y.; Pin, S. The Impact of Virgin and Aged Microstructured Plastics on Proteins: The Case of Hemoglobin Adsorption and Oxygenation. Int. J. Mol. Sci. 2024, 25, 7047. [Google Scholar] [CrossRef] [PubMed]
  55. Basile, L.J. Effect of styrene monomer on the fluorescence properties of polystyrene. J. Chem. Phys. 1962, 36, 2204–2210. [Google Scholar] [CrossRef]
  56. Nurmukhametov, R.; Volkova, L.; Kabanov, S. Fluorescence and absorption of polystyrene exposed to UV laser radiation. J. Appl. Spectrosc. 2006, 73, 55–60. [Google Scholar] [CrossRef]
  57. Swank, R.K.; Buck, W.L. The scintillation process in plastic solid solutions. Phys. Rev. 1953, 91, 927. [Google Scholar] [CrossRef]
  58. Chen, L.; Jin, X.; Du, J.; Qian, R. On the origin of the fluorescence emission of poly (ethylene terephthalate) by excitation at 340 nm. Die Makromol. Chem. Macromol. Chem. Phys. 1991, 192, 1399–1408. [Google Scholar] [CrossRef]
  59. Day, M.; Wiles, D. Photochemical degradation of poly (ethylene terephthalate). III. Determination of decomposition products and reaction mechanism. J. Appl. Polym. Sci. 1972, 16, 203–215. [Google Scholar] [CrossRef]
  60. Hemker, D.J.; Frank, C.W.; Thomas, J.W. Photophysical studies of amorphous orientation in poly (ethylene terephthalate) films. Polymer 1988, 29, 437–447. [Google Scholar] [CrossRef]
  61. LaFemina, J.P.; Carter, D.R.; Bass, M.B. Photophysical properties, intermolecular interactions, and molecular dynamics of poly (ethylene terephthalate). J. Phys. Chem. 1992, 96, 2767–2772. [Google Scholar] [CrossRef]
  62. Merrill, R.G.; Roberts, C.W. Photophysical processes and interactions between poly (ethylene terephthalate) and 1-amino-2-(2-methoxyethoxy)-4-hydroxy-9, 10-anthraquinone. J. Appl. Polym. Sci. 1977, 21, 2745–2768. [Google Scholar] [CrossRef]
  63. Sonnenschein, M.; Roland, C. Absorption and fluorescence spectra of poly (ethylene terephthalate) dimers. Polymer 1990, 31, 2023–2026. [Google Scholar] [CrossRef]
  64. Massines, F.; Tiemblo, P.; Teyssedre, G.; Laurent, C. On the nature of the luminescence emitted by a polypropylene film after interaction with a cold plasma at low temperature. J. Appl. Phys. 1997, 81, 937–943. [Google Scholar] [CrossRef]
  65. Ho, D.; Liu, S.; Wei, H.; Karthikeyan, K.G. The glowing potential of Nile red for microplastics Identification: Science and mechanism of fluorescence staining. Microchem. J. 2024, 197, 109708. [Google Scholar] [CrossRef]
  66. Lee, Y.K.; Hong, S.; Hur, J. A fluorescence indicator for source discrimination between microplastic-derived dissolved organic matter and aquatic natural organic matter. Water Res. 2021, 207, 117833. [Google Scholar] [CrossRef]
  67. Motalebizadeh, A.; Fardindoost, S.; Hoorfar, M. Selective on-site detection and quantification of polystyrene microplastics in water using fluorescence-tagged peptides and electrochemical impedance spectroscopy. J. Hazard. Mater. 2024, 480, 136004. [Google Scholar] [CrossRef]
  68. Hu, B.; Dai, Y.; Zhou, H.; Sun, Y.; Yu, H.; Dai, Y.; Wang, M.; Ergu, D.; Zhou, P. Using artificial intelligence to rapidly identify microplastics pollution and predict microplastics environmental behaviors. J. Hazard. Mater. 2024, 474, 134865. [Google Scholar] [CrossRef]
  69. Merlemis, N.; Drakaki, E.; Zekou, E.; Ninos, G.; Kesidis, A.L. Laser induced fluorescence and machine learning: A novel approach to microplastic identification. Appl. Phys. B 2024, 130, 29. [Google Scholar] [CrossRef]
  70. Childress, E.S.; Roberts, C.A.; Sherwood, D.Y.; LeGuyader, C.L.; Harbron, E.J. Ratiometric fluorescence detection of mercury ions in water by conjugated polymer nanoparticles. Anal. Chem. 2012, 84, 1235–1239. [Google Scholar] [CrossRef]
  71. Oki, Y.; Furukawa, K.; Maeda, M. Extremely sensitive Na detection in pure water by laser ablation atomic fluorescence spectroscopy. Opt. Commun. 1997, 133, 123–128. [Google Scholar] [CrossRef]
  72. Costa, C.Q.; Cruz, J.; Martins, J.; Teodósio, M.A.A.; Jockusch, S.; Ramamurthy, V.; Da Silva, J.P. Fluorescence sensing of microplastics on surfaces. Environ. Chem. Lett. 2021, 19, 1797–1802. [Google Scholar] [CrossRef]
  73. Peinador, R.I.; HP, P.T.; Calvo, J.I. Innovative application of Nile Red (NR)-based dye for direct detection of micro and nanoplastics (MNPs) in diverse aquatic environments. Chemosphere 2024, 362, 142609. [Google Scholar] [CrossRef] [PubMed]
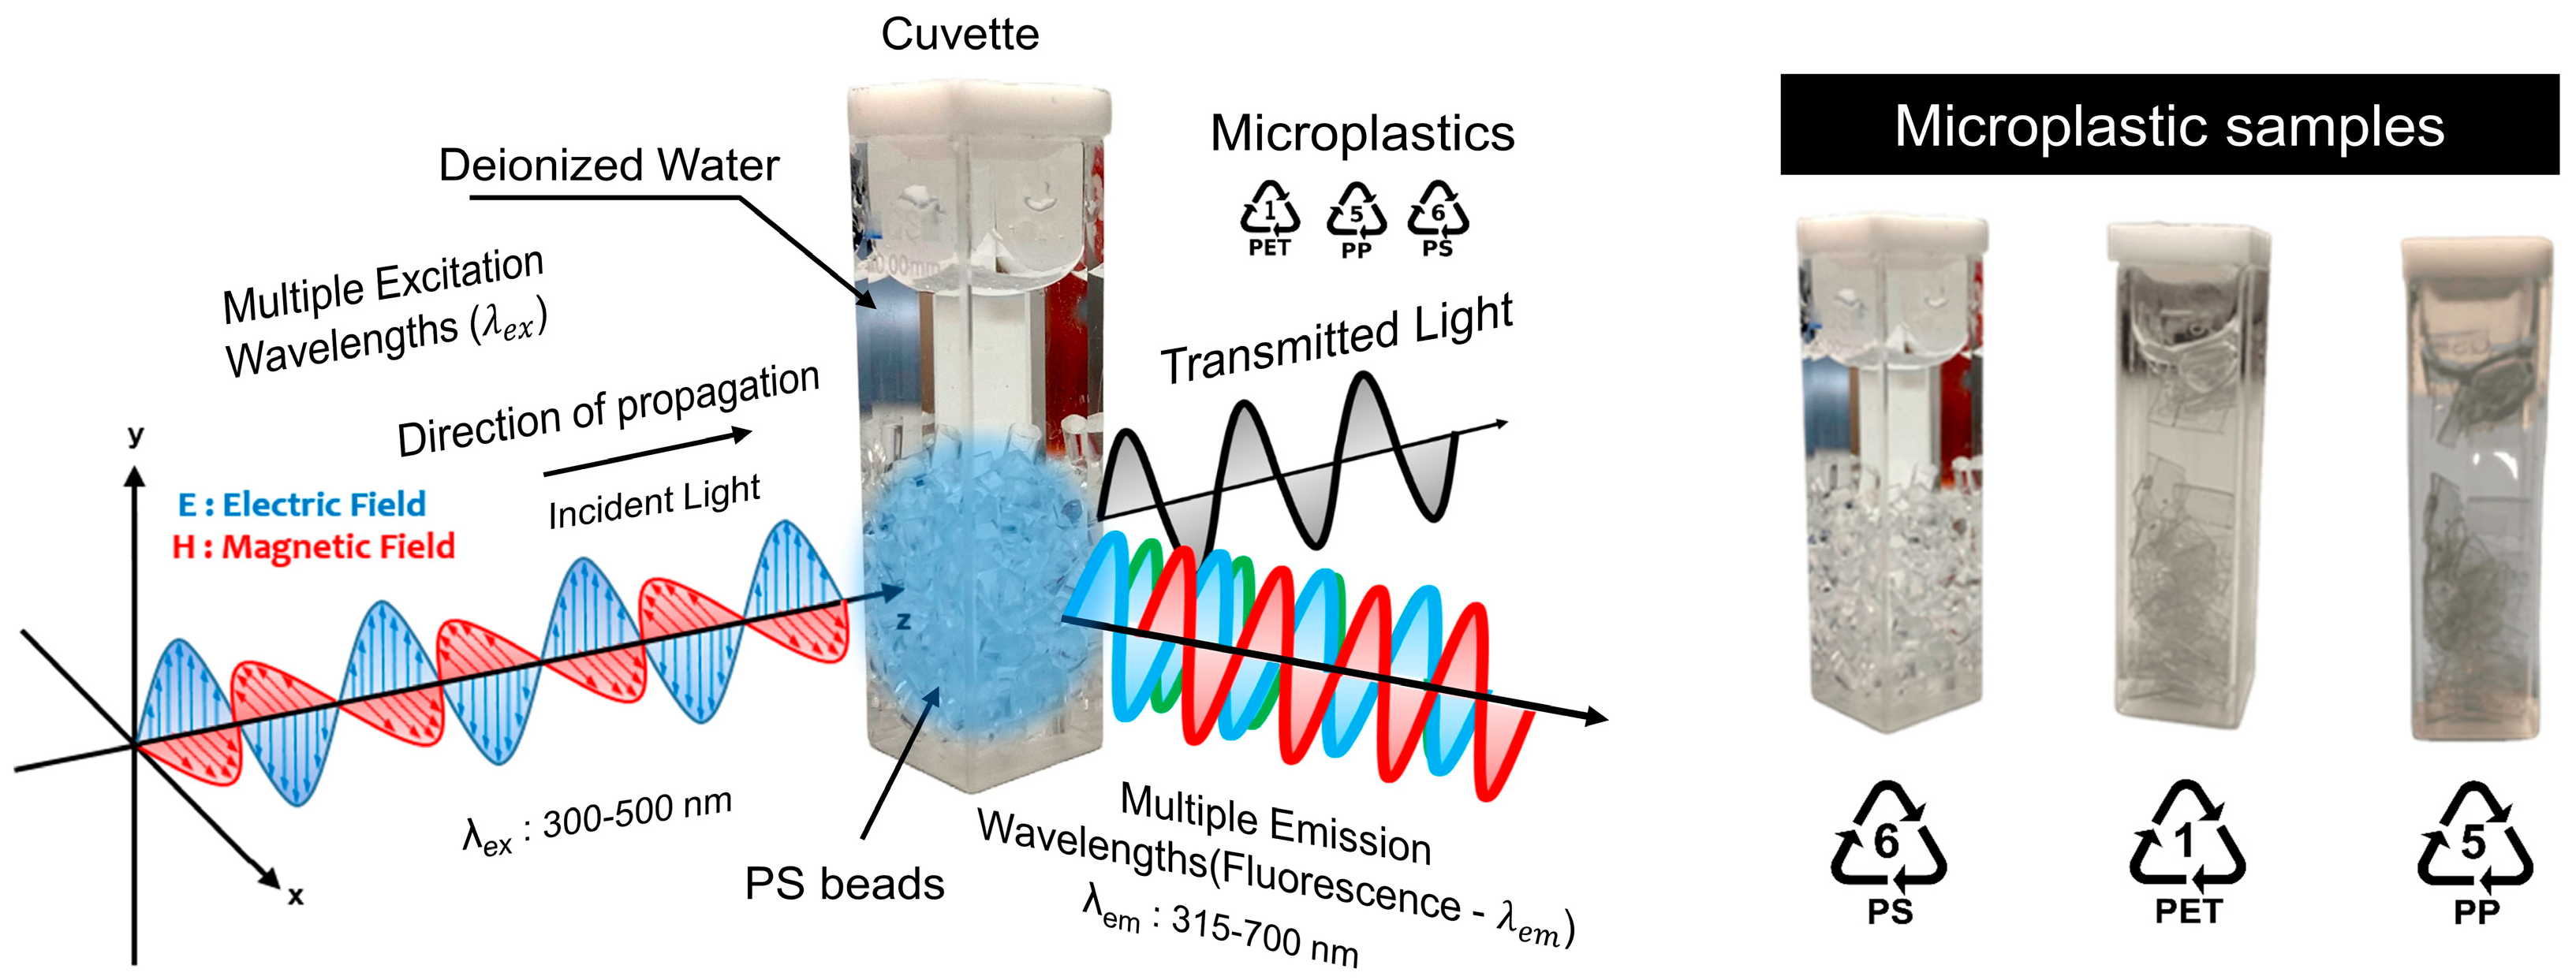
Figure 1. A schematic diagram of multiple excitations and fluorescence emissions from the sample of different microplastics, i.e., PS, PET, and PP, in an aqueous medium. The figure illustrates resin identification codes that indicate the recyclability of various plastics, shown as numbers within a recycling triangle. For instance, PS is labelled as 6, PET as 1, and PP as 5.
Photochem 04 00030 g001
Figure 2. Raman spectra of different microplastics with peaks corresponding to each vibrational bond highlighted. (a) Polystyrene—PS. (b) Polyethylene terephthalate—PET. (c) Polypropylene—PP.
Photochem 04 00030 g002
Figure 3. Two-dimensional FL excitation–emission (FLE) maps of (a) polystyrene—PS microbeads, (b) polyethylene terephthalate—PET, (c) polypropylene—PP and (d) FL spectra of PS (solid black line with squares), PET (solid black line with circles), and PP (solid red line), recorded at optimised excitation wavelengths 360 nm, 360 nm, and 370 nm, respectively. The scale bar for (ac) represents fluorescence emission intensity in counts per second (CPS).
Photochem 04 00030 g003
Figure 4. Fluorescence spectra acquired from (a) polystyrene at excitation wavelengths λex 310 nm (solid black line), λex 360 nm (solid red line), and λex 405 nm (solid blue line); (b) polyethylene terephthalate at excitation wavelengths λex 330 nm (solid black line), λex 360 nm (solid red line), and λex 405 nm (solid blue line); and (c) polypropylene at excitation wavelengths λex 350 nm (solid black line), λex 370 nm (solid red line), and λex 405 nm (solid blue line).
Photochem 04 00030 g004
Table 1. Elemental composition of PS, PET, and PP samples using XPS spectroscopy.
ElementsRelative Atomic Concentration
Polystyrene (PS)Polyethylene Terephthalate (PET)Polypropylene (PP)
C-C/C-H91.274.583.8
C-O7.022.511.2
Si-2.23.9
Zn1.80.10.1
N-0.40.7
Ca-0.20.2
S-0.20.1
Table 2. The vibrational bands corresponding to prominent Raman peaks of different microplastics (PS, PET, and PP).
MicroplasticRaman Peaks (cm−1)Corresponding Vibrational Band
Polystyrene621Ring deformation mode
1001Ring breathing mode
1031C-H in-plane deformation
1155C-C stretch
1450CH2 scissoring
1583C=C stretch
1602Ring skeletal stretch
Polyethylene Terephthalate1100Ester C(O)-O and C-C bond
1165Ring in-plane C-H & C-C stretch
1276C(O)-O stretching
1402CCH bending and OCH bending
1594C-C bond in the aromatic ring
1707Stretching of C=O vibrations
Polypropylene860C-C stretching and CH3 rocking
1142C-C stretching and CH bending
1356CH stretching, CH2 wagging, and CH3 bending
1466CH2 bending and CH3 asymmetrical bending
1762C=O stretching vibration
3090–3209Stretching vibrations of C-H
Disclaimer/Publisher’s Note: The statements, opinions and data contained in all publications are solely those of the individual author(s) and contributor(s) and not of MDPI and/or the editor(s). MDPI and/or the editor(s) disclaim responsibility for any injury to people or property resulting from any ideas, methods, instructions or products referred to in the content.