Article

A Systems Biology- and Machine Learning-Based Study to Unravel Potential Therapeutic Mechanisms of Midostaurin as a Multitarget Therapy on FLT3-Mutated AML

by
Marina Díaz-Beyá
1,2,*,
María García-Fortes
3,
Raquel Valls
4,
Laura Artigas
4,
Mª Teresa Gómez-Casares
5,
Pau Montesinos
6,
Fermín Sánchez-Guijo
7,
Mireia Coma
4,
Meritxell Vendranes
8 and
Joaquín Martínez-López
9
1
Department of Hematology, Hospital Clínic de Barcelona, Institut d’Investigacions Biomèdiques August Pi i Sunyer (IDIBAPS), 08036 Barcelona, Spain
2
Myeloid Neoplasms Group, Josep Carreras Leukaemia Research Institute (IJC), 08916 Badalona, Spain
3
Hematology Department, Hospital Universitario Virgen de la Victoria, 29010 Málaga, Spain
4
Molecular Health Department, Anaxomics Biotech SL, 08007 Barcelona, Spain
5
Hematology Service, Hospital Universitario Insular Materno-Infantil, 35016 Las Palmas de Gran Canaria, Spain
6
Departament of Hematology, Hospital Universitari i Politècnic La Fe, 46026 Valencia, Spain
7
Cancer Research Center (CIC), Instituto de Investigación Biomédica de Salamanca (IBSAL), Hospital Universitario de Salamanca, Universidad de Salamanca, 37007 Salamanca, Spain
8
Novartis Oncology, Novartis España, 08013 Barcelona, Spain
9
Hospital 12 de Octubre. Universidad Complutense. CNIO. Centro de Investigación Biomédica en Red-Oncología (CIBERONC), Instituto Carlos III, 28041 Madrid, Spain
*
Author to whom correspondence should be addressed.
BioMedInformatics 2022, 2(3), 375-397; https://doi.org/10.3390/biomedinformatics2030024
Submission received: 23 May 2022 / Revised: 14 July 2022 / Accepted: 19 July 2022 / Published: 25 July 2022
(This article belongs to the Section Computational Biology and Medicine)

Abstract

:
Acute myeloid leukemia (AML), a hematologic malignancy that results in bone marrow failure, is the most common acute leukemia in adults. The presence of FMS-related tyrosine kinase 3 (FLT3) mutations is associated with a poor prognosis, making the evaluation of FLT3-inhibitors an imperative goal in clinical trials. Midostaurin was the first FLT3-inhibitor approved by the FDA and EMA for the treatment of FLT3-mutated AML, and it showed a significant improvement in overall survival for newly diagnosed patients treated with midostaurin, in combination with standard chemotherapy (RATIFY study). The main interest of midostaurin has been the FLT3-specific inhibition, but little is known about its role as a multikinase inhibitor and whether it may be used in relapse and maintenance therapy. Here, we used systems biology- and machine learning-based approaches to deepen the potential benefits of the multitarget activity of midostaurin and to better understand its anti-leukemic effect on FLT3-mutated AML. The resulting in silico study revealed that the multikinase activity of midostaurin may play a role in the treatment’s efficacy. Additionally, we propose a series of molecular mechanisms that support a potential benefit of midostaurin as a maintenance therapy in FLT3-mutated AML, by regulating the microenvironment. The obtained results are backed up using independent gene expression data.

1. Introduction

Acute myeloid leukemia (AML) is the most common type of acute leukemia in adults and remains a challenging disease due to patient and disease variability, presence of co-morbidities and intrinsic biological factors [1]. Mutations in the FMS-related tyrosine kinase 3 gene (FLT3) occur in approximately 30% of adults with newly diagnosed AML [2].
Over the last decade, FLT3 tyrosine kinase inhibitors (TKIs), which are prescribed either alone or combined with chemotherapy, have improved the outcome of the disease [3]. First generation FLT3 inhibitors (midostaurin, sunitinib, sorafenib and lestaurtinib) are unspecific for FLT3, impacting other pathways involved in AML development. On the other hand, second and third generation inhibitors (quizartinib, crenolanib, gilteritinib and ponatinib) are more potent and specific at inhibiting FLT3 and so, with less toxicities associated with off-target effects, present narrower target activity on non-FLT3 pathways compared to first generation TKIs.
In the first clinical trials with midostaurin (Rydapt, PKC412, manufactured by Novartis AG), safety and pharmacokinetics were evaluated as monotherapy in chronic lymphocytic leukemia (CLL), melanoma [4,5] and diabetes-related macular degeneration [6]. Later, midostaurin was evaluated for FLT3-mutated AML and KIT proto-oncogene receptor tyrosine kinase (KIT) in advanced systemic mastocytosis (SM) [7,8]. In 2017, midostaurin was the first FLT3 TKI approved for the treatment of adult patients with FLT3-mutated AML and advanced SM (EMA, FDA). Currently, midostaurin and other FLT3 inhibitors, such as sorafenib or quizartinib, are being evaluated for the improvement of the treatment of FLT3-mutated AML in several clinical trials, whereas gilteritinib has been recently approved by the FDA and EMA for the treatment of FLT3-mutated relapsed/refractory (R/R) AML [9]. Little is known about the molecular mechanism of TKIs (different than FLT3 inhibition), particularly regarding midostaurin as a multitarget anti-cancer drug.
Midostaurin was firstly described and developed as a PKC inhibitor, by reversibly binding to the catalytic domain of PKC and inhibiting downstream signaling pathways, resulting in growth arrest and enhanced apoptosis [10]. Studies to investigate the potential of midostaurin as a PKC inhibitor revealed that it inhibits cell proliferation by interfering with cell-cycle activity [11]. Moreover, mutations of the FLT3 gene lead to ligand-independent activation and dysregulation of downstream pathways, such as PI3K/AKT, MAPK/ERK and STAT5 [12,13]. These pathways inhibit apoptosis and differentiation, and promote proliferation of hematopoietic cells [14].
The RATIFY (Randomized AML Trial in FLT3 in Patients Less than 60 Years Old, NCT00651261) [8] clinical trial compared midostaurin to placebo in 717 AML patients with FLT3 mutation when administered with standard induction “7 + 3” chemotherapy (daunorubicin/cytarabine) and consolidation chemotherapy (high-dose cytarabine), with a later maintenance in patients not undergoing an allogeneic stem cell transplant. This study led the approval for midostaurin in AML and showed that maintenance therapy (12 months) with midostaurin was well tolerated, although no study has determined the independent effect of maintenance therapy after chemotherapy.
Despite most AML patients achieving remission after chemotherapy, up to 70% of adults will not survive beyond 5 years after the initial clinical response due to AML relapse. Leukemic stem cells (LSCs) play an important role in the occurrence and development of leukemia. LSCs present different characteristics than those defining AML cells; they are more resistant to standard therapy and, therefore, are a source for disease relapse. Relapse in chemoresistant LSCs in specific niches such as the bone marrow (BM) microenvironment is common in AML disease. Understanding the mechanisms underlying the regulation of leukemia-initiating LSCs by the BM niche and the alteration of the BM microenvironment by LSCs is crucial to eradicate AML [15]. Within solid tumors, the status of the immune microenvironment provides valuable insight regarding potential responses to immune therapies. Much less is known about the immune microenvironment within hematologic malignancies; but, the characteristics of this environment are likely to serve a similar predictive role [16]. During leukemogenesis, AML cells (or blasts) progressively occupy and likely alter the BM niche where normal hematopoietic stem cells (HSCs) reside [17]. Emerging evidence suggests that leukemic cells induce molecular changes in distinct hematopoietic and non-hematopoietic cell populations. These changes contribute to the transformation of the normal hematopoietic niche into a ‘leukemic niche’ that becomes permissive to leukemia growth and disrupts normal hematopoiesis [17,18], by mechanisms that still need to be elucidated.
The addition of midostaurin to intensive chemotherapy remains the recommended upfront therapy in newly diagnosed FLT3-mutated AML patients, and whether it is beneficial for maintenance therapy is still under review. The main goal of the present study is to deepen the understanding of the molecular mechanisms of midostaurin on FLT3-mutated AML by employing a combination of systems biology- and machine learning-based methods. Specifically, we aim to identify the mechanisms of the multitarget activity of midostaurin treatment for FLT3-mutated AML, either in combination with chemotherapy or as monotherapy as maintenance therapy. Additionally, publicly available patients’ high throughput data is used as supporting information of the modelling results obtained.

2. Materials and Methods

2.1. TPMS Technology: FLT3-Mutated AML Systems Biology-Based Model Creation

A top-down systems biology approach, namely the Therapeutic Performance Mapping System (TPMS), was used to simulate the behavior of human physiology in silico, as described in [19] and applied elsewhere [20,21]. This mathematical approach is based on machine learning and pattern recognition models that integrate all available biological, pharmacological and medical knowledge of human physiology. In this study, the models generated were centered in FLT3-mutated AML pathophysiology and the targets of midostaurin, daunorubicin and cytarabine.
Two modelling strategies were followed: artificial neural networks (ANNs) [22], with the aim of predicting the strength of biological relationships; and a sampling-based methods [19], in order to mechanistically explore biological relationships. A compendium of biological and clinical data defining human physiology (Table S1) was used as training data. Briefly, ANN models work on a build-in human protein network (HPN) [19] and are trained with known drug-indication relationships, which allow to extract a Multilayer Perceptron-like classifier able to predict the degree of relation to mechanistically associated protein sets. On the other hand, the sampling-based method generates an array of mathematical solutions or models, merged into a meta-model. It also works over the HPN and uses stochastic bootstrapping and simulated annealing [23] and Applications to solve and find all possible mechanisms of action (MoA) between an input protein set (e.g., drug targets) and a response set (e.g., disease characterization). MoA models consist of an ensemble of 4000 mathematical models, each having an accuracy of >0.85 over the used training set data. Additionally, and in order to reproduce the heterogeneity of the disease, the most frequent co-occurring mutations among FLT3-mutated AML patients (Table S2) were identified by a literature review, and considered in the mathematical models with the same ratio. More detailed descriptions of the two methodologies are provided in the Appendix A: Supplementary methods.
Although the models are protein-based, the interactome in which they are built includes gene and RNA regulation data; thus, for standardization purposes, we will use gene names to refer to all genes/proteins mentioned in this manuscript when referring to model results.

2.2. Molecular Characterization of FLT3-Mutated AML Pathophysiology and Drugs

In order to map and study FLT3-mutated AML in the HPN of the models, it was characterized at a protein level by an extensive and careful full-length revision of relevant publications in the PubMed database which was performed (Figure 1, Step 1, Appendix A: Supplementary methods). First, we identified the main pathophysiological processes (namely “motives”) described to be involved in FLT3-mutated AML: (1) impaired myeloblast differentiation in AML; (2) genetic predisposition to AML; (3) epigenetic dysregulation in AML; (4) increased proliferation and survival mediated by FLT3; (5) immunophenotypic features of AML; and (6) microenvironment influence in AML (Table S3). Then, each pathophysiological process was functionally characterized at protein level, resulting in a total of 193 unique proteins (namely “effectors”), used for mapping and analyzing the FLT3-mutated AML in the human biological network models (Table S4).
Similarly, an extensive scientific literature review was conducted to identify the targets modulated by the included drugs (Figure 1, Step 2): midostaurin (and its active metabolites); daunorubicin; and cytarabine (Table S5).
Beside the midostaurin protein target set, information on its impact over cells was compiled to obtain a blueprint of the midostaurin downstream effect. Two sets of proteins were defined, which were used as additional constraints for the MoA mathematical models generation process; as previously described [19,24]. On one hand, a set of proteins previously described to be involved in midostaurin downstream signaling pathways was identified from the literature (Table S6). On the other, a list of genes modulated by midostaurin was extracted from gene expression data associated with the drug’s therapeutic effects in FLT3-mutated AML, using the data from a Gene Expression Omnibus (GEO) experiment for sensitive versus resistant midostaurin cell lines (GSE61715 dataset). The data was processed using the GEO2R tool [25,26], using as significance threshold the adjusted p-value ≤ 0.01 and absolute value of log2FC ≥ 1 (Table S7).

2.3. TPMS Models’ Analysis

Three different model settings were used in order to simulate and understand the therapeutic effects of midostaurin, depending on the treatment: (1) midostaurin in combination with chemotherapy (daunorubicin and cytarabine); (2) FLT3-specific inhibition in combination with chemotherapy; and (3) midostaurin monotherapy (Figure 1, Step 3).
The evaluation of the TPMS models generated was carried out both at a single protein and protein set level, in order to understand the specific and global effect of the three different settings studied (Figure 1, Steps 4–5).
Analysis of the ANN resulting models were performed directly on the output values, representing the degree of relation between two protein sets. Relations with p-values < 0.15 were considered as high-degree relations, p-values in-between 0.15 and 0.25 as medium or possible relations, and p-values > 0.25 as low-degree or unlikely relations.
MoA mathematical models were analyzed both at a single protein level and at a protein set level, and using different input perturbation (e.g., drug target proteins) or response protein sets (e.g., considering different individual motives) combinations. The models’ evaluation was conducted on the resulting signal value of each of the proteins derived from the signal propagation step. While each protein had a signal intensity on its own, the activity of protein sets was quantified through the tSignal parameter, as previously described [19]. That is, the mean signal regarding the modulated proteins of a set:
tSignal prot   set = 1 n i = 1 n v i y i
where n is the number of modulated proteins within the set; v refers to the signal value of protein i ; and y is the protein original sign.
Most differentially modulated proteins between two model settings were considered as those with: (1) a mean signal value difference higher than 0.75 between the two setting models; (2) a statistically significant difference according to a Student’s t-test (multi-test correction using the Benjamini–Hochberg false discovery rate [27], adjusted p-value < 0.05); and (3) mathematical models’ cross-validated accuracy >99% (when comparing all model proteins) or >70% (for microenvironment effector proteins comparison), in linear/quadratic classification analysis.

2.4. Gene Expression Data Collecting and Processing

Several GEO datasets were retrieved and processed in order to obtain molecular or protein patterns of disease stages and used a as trimming or filtering phase for the modelling results (Figure 1, Step 6).
Gene expression data of leukemic blasts from 11 FLT3-mutated AML patients vs. normal hematopoietic cells from 38 healthy donors (data obtained from GSE9476 [28]) were analyzed to extract an FLT3-mutated AML molecular signature, MS0 (Table S8). Data were processed using GEO2R and differentially expressed genes according to adjusted p-value ≤ 0.05 were considered as the molecular signature of FLT3-mutated AML.
Gene expression data from patients with AML at diagnosis and relapse timepoints were analyzed to extract two different resistance and relapse molecular signatures (MS1) using two datasets: (1) MS1.1, using peripheral blood and BM diagnosis and relapse samples from 19 patients (data obtained from GSE83533 [29]); and (2) MS1.2, using peripheral blood mononuclear cells (PBMCs) diagnosis and relapse samples from 11 patients generated by Shlush LI. et al. [30] (Table S8). Each molecular signature was based on the differential expression analyses of log2RPKM data from paired diagnosis and relapse samples for each dataset, using the limma-trend method [31]. Proteins with an adjusted p-value ≤ 0.05 (obtain by a multi-test correction method using the Benjamini–Hochberg false discovery rate [27]) were considered as constituents of the molecular signatures. No overlap between MS1.1 and MS1.2 proteins was present.
Lastly, nine different data sources [32,33,34,35,36,37,38,39,40] were used to obtain a leukemia stem cells (LSC)-mediated molecular signature for relapse prediction (namely “MS2 molecular signature”) (Table S8). Genes with incongruent information between different sources of data (i.e., genes that are upregulated or downregulated in LSC+ according to one source of information but not others) were discarded.

2.5. Enrichment Analysis

Hypergeometric enrichment analyses were performed over all defined molecular signature of resistance and relapse (MS1.1, MS1.2 and MS2), considering up-regulated and down-regulated genes separately following previously described methodology [41]. Additionally, a Gene Set Enrichment Analysis (GSEA) [42] was conducted over the proteins modulated in MoA mathematical models of midostaurin in monotherapy.
All enrichment analysis was performed using sets from several databases, including Gene Ontology (GO) terms (biological process, cellular component and molecular function), according to the European Molecular Biology Laboratory-European Bioinformatics Institute (EMBL-EBI)/UniProt-GO [43], Biological Effectors Database (BED, property of Anaxomics), Kyoto Encyclopedia of Genes and Genomes (KEGG) [44], Pharmacogenomics Knowledgebase (PharmGKB) [45], Small Molecule Pathway Database (SMPDB) [46] and the regulatory molecular mechanisms included in the Transcriptional Regulatory Relationships Unraveled by Sentence-based Text-mining (TRRUST) database [47]. Sets composed by more than 1500 proteins were discarded to avoid the consideration of generalist pathways. Multi-testing correction was run, and sets with adjusted p-value < 0.05 were considered as enriched pathways.

3. Results

3.1. Several Non-FLT3 Midostaurin Targets May Play an Active Role in FLT3-Mutated AML

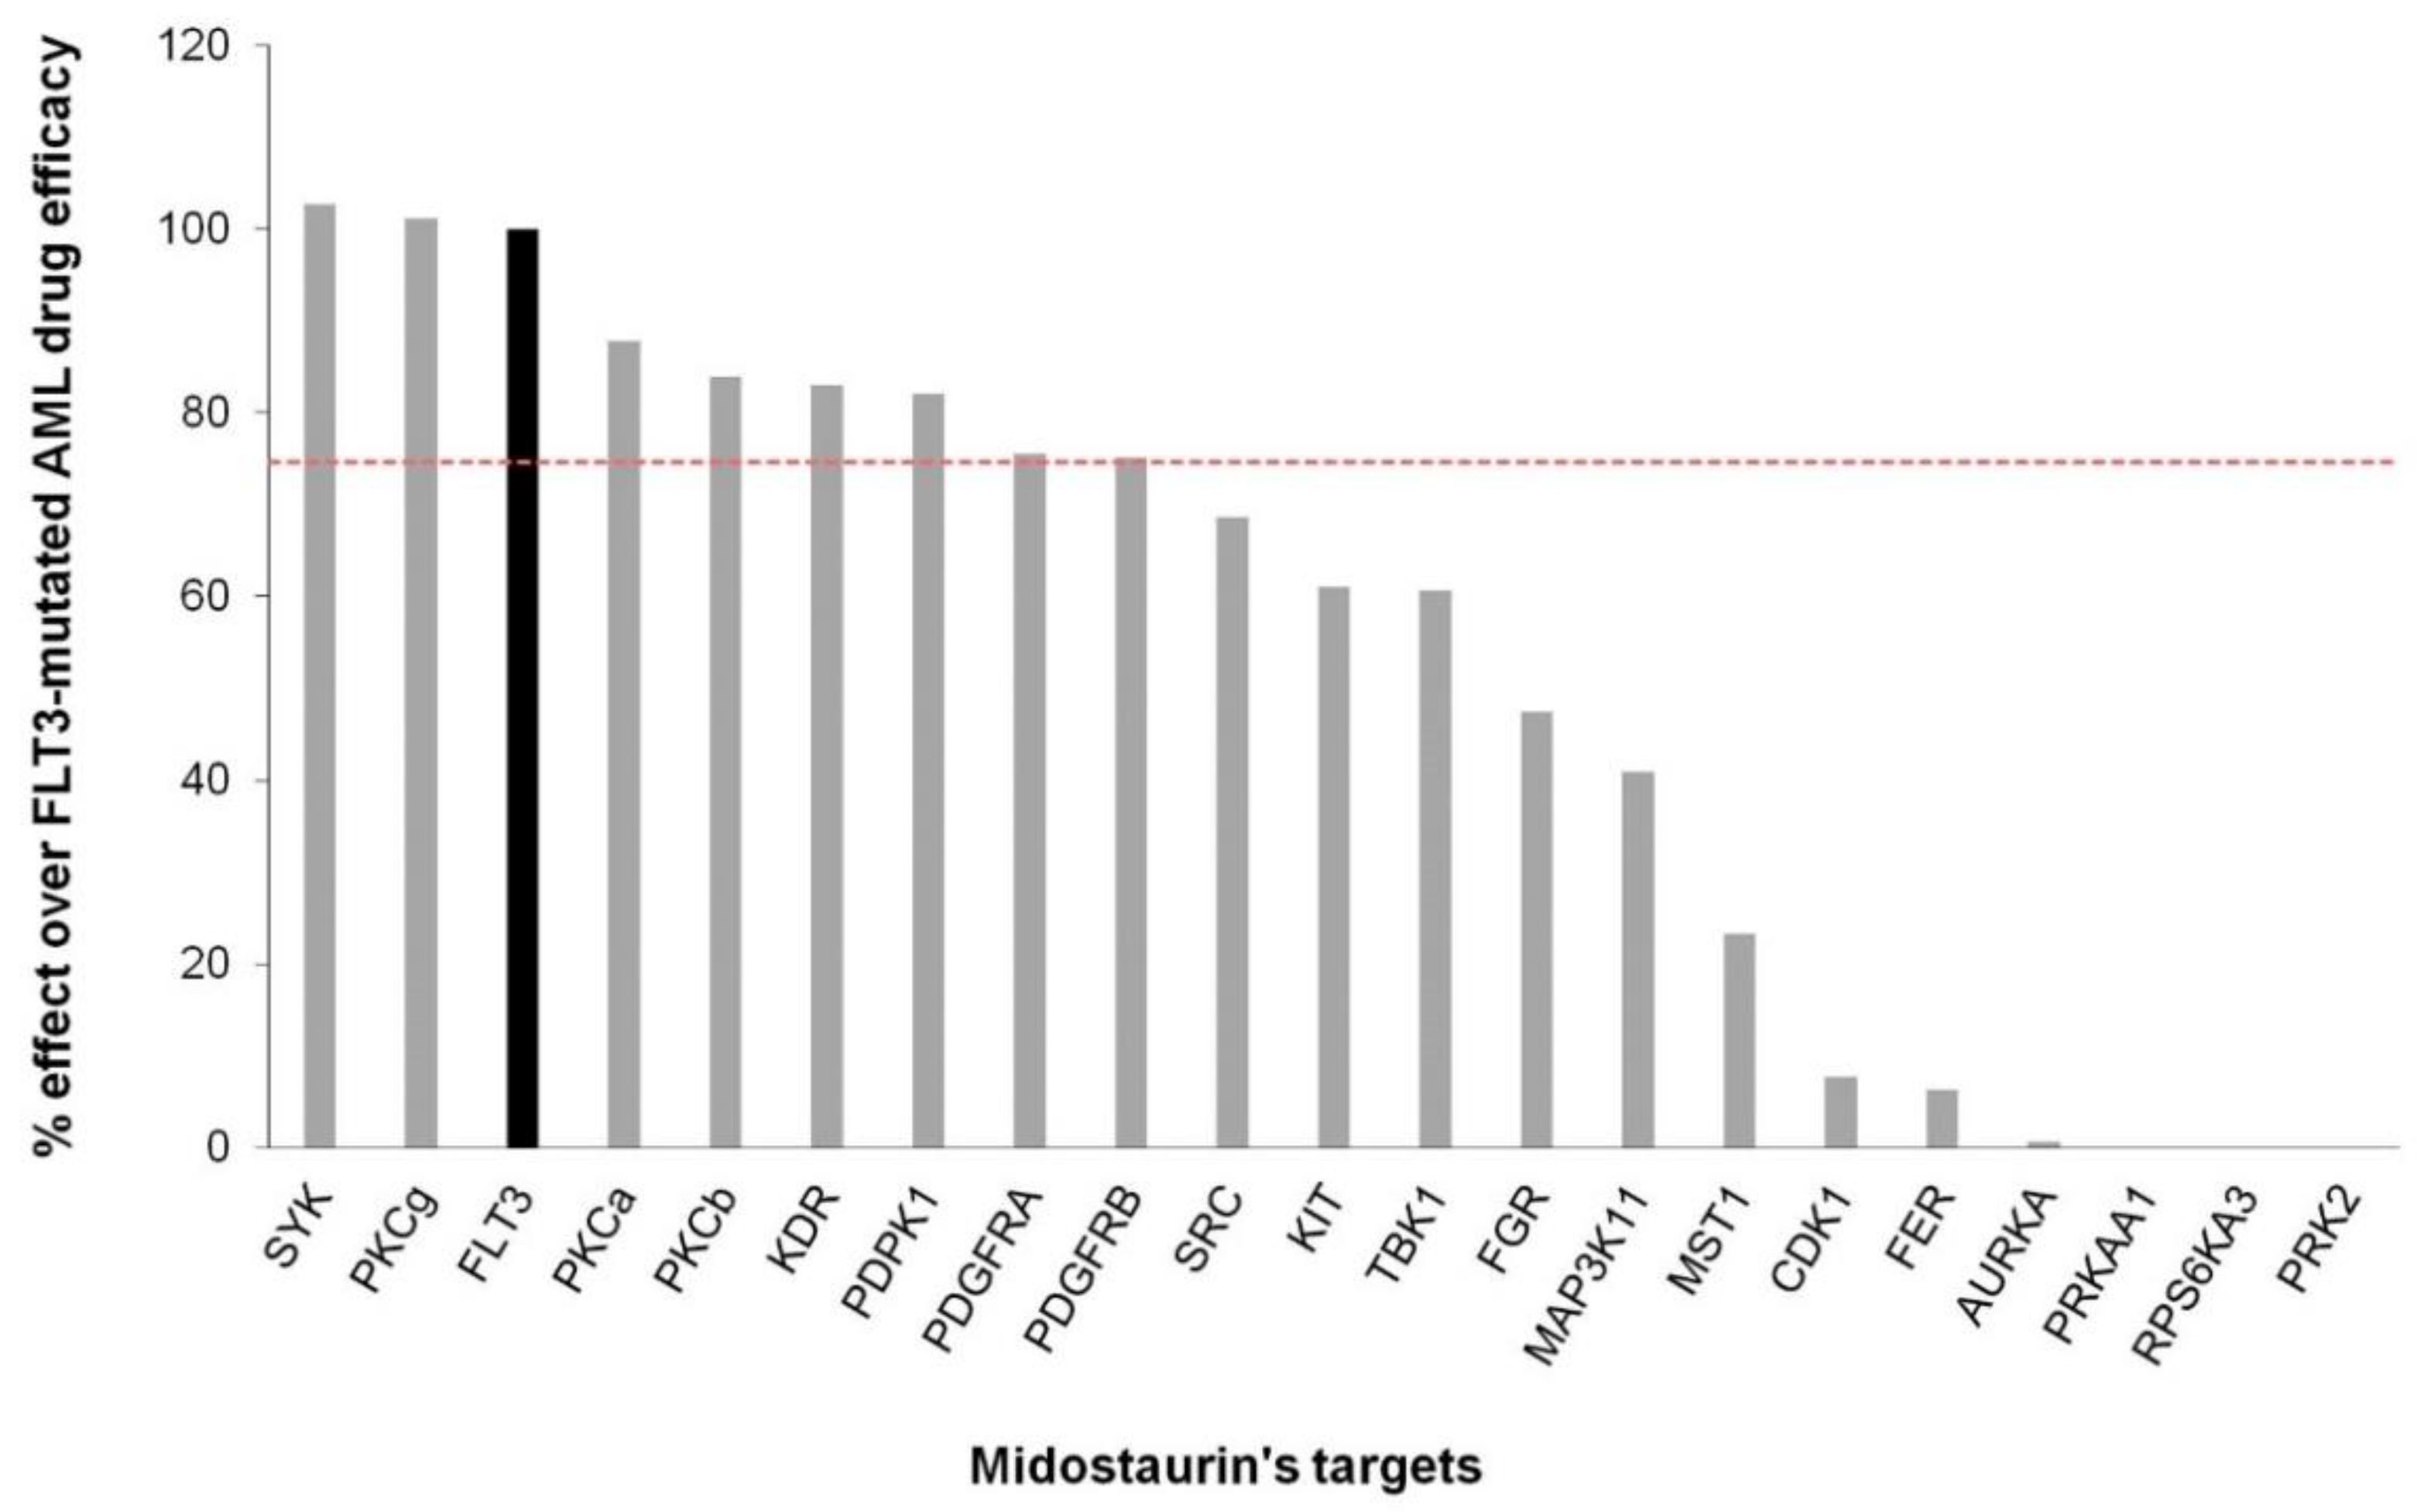
Using the midostaurin combined with chemotherapy mathematical models, the treatment effect over FLT3-mutated AML was extracted for each midostaurin protein targets alone (considering both midostaurin and its metabolites targets). That is, the models’ tSignal was measured for the FLT3-mutated AML characterized proteins (Table S4), after perturbing the generated models with each of the target proteins. Due to its recognized role in FLT3-mutated AML, the effect predicted for FLT3 inhibition alone was used as a reference value to detect other midostaurin targets highly contributing to treatment’s efficacy. Non-FLT3 targets with a predicted effect higher than 75% that of FLT3 were considered as highly involved in the drug’s efficacy on FLT3-mutated AML patients.
Predicted results showed that 8 out of the 20 non-FLT3 targets (Syk/SYK, PKCγ/PRKCG, PKCα/ PRKCA, PKCβ/PRKCB, VEGFR-2/KDR, PDK1/PDPK1, PDGFRα/PDGFRA and PDGFRβ/PDGFRB) are highly contributing to the drug’s efficacy in FLT3-mutated AML patients (Figure 1). Further, midostaurin targets as Syl and PKCγ were predicted to contribute to the efficacy of the treatment at the same level as FLT3 (Figure 2).

3.2. Midostaurin Targets May Act through Cell Proliferation and Survival, AML Microenvironment, and Myeloblast Diferentiation

To identify potential molecular mechanisms modulated by the non-FLT3 targets of midostaurin highly involved in its therapeutic effect, we first compared the predicted activity of the proteins in the MoA models of midostaurin versus the FLT3-specific inhibition, and with the chemo-therapeutic regimen (daunorubicin and cytarabine). Then, we filtered the list by the proteins also present in the FLT3-mutated AML molecular signature MS0, and which also had a reversed state (e.g., activated/upregulated or inhibited/downregulated) between the disease molecular signature and the midostaurin resulting models (Table 1). Thus, the 13 proteins shown in Table 1 are related to a beneficial effect from the treatment, for which FLT3-specific inhibition MoA models showed no effect. Specifically, 12 of them were inhibited by midostaurin, while only one resulted in an activated state (HMGCR).
The mathematical models reproducing the behavior of midostaurin in combination with chemotherapy were next used to explore how the 13 proteins (Table 1), both differential between the two MoA models compared and present in the molecular signature, were involved in midostaurin’s efficacy mechanisms (Figure 3A,B). For that, we focused on identifying which upstream targets were modulating this set of proteins, and which of the six downstream disease motives were then affected. We observed a relation with an increased proliferation and survival, microenvironment influence and impaired myeloblast differentiation. When studying the proteins involved in the resulting modulated molecular mechanisms, midostaurin (through both FLT3 and non-FLT3 mediated mechanisms) presented the following main effects: (1) promotion of caspase-dependent apoptotic pathway (BCL2, CASP3, BAD); (2) blockade of known transcription factors of growth-related genes (MYC, CREB1, ELK1, JUN and STAT5); (3) inhibition of MAPK signalling pathway and on TNF; and (4) activation of the CCAAT/enhancer-binding protein alpha (CEBPA). Some predicted molecular mechanisms were mediated only by non-FLT3 targets of midostaurin, such as: (1) direct blockade of S6K-alpha-3 (RPS6KA3); (2) inhibition of integrin-linked protein kinase (ILK); (3) inhibition of cytochrome b-245 heavy chain (CYBB); (4) inhibition of vascular endothelial growth factor receptor 2 (KDR); and (5) the inhibition of Ras-related C3 botulinum toxin substrate 1 (RAC1). According to our models (Figure 3A), both daunorubicin and cytarabine also contribute to the anti-leukemic effects of the treatment mainly through the promotion of the caspase-dependent apoptotic pathway. A cytarabine-specific mechanism mediated by the inhibition of the M-phase inducer phosphatase 1 (CDC25A) was also identified as being potentially involved in the therapeutic effects of the combination treatment.

3.3. Non-FLT3 Midostaurin Targets Affect FLT3-Mutated AML Mainly through Microenvironment Modulation

The ANN models were used to evaluate the degree of relationship and therapeutic effect between each of the three modelled drug treatment combinations and FLT3-mutated AML (Table 2). The analysis was carried out over the whole disease according to its molecular characterization, and considering the individual pathophysiological motives involved in FLT3-mutated AML.
Results show a higher degree of relationship between the FLT3-mutated AML and midostaurin monotherapy or its combination with chemotherapy regimen, when compared to that of FLT3-specific inhibition.
Increased proliferation and survival mediated by FLT3 was one of the most affected FLT3-mutated AML motives. The other motive, the microenvironment influence in AML, only scored high values for both midostaurin monotherapy and its combination with chemotherapy, but not for FLT3-specific inhibition, indicating a specific beneficial effect of non-FLT3 midostaurin targets on this pathway.
To further explore whether this effect might only be specific to any of the most co-occuring secondary mutations (Table S2), we evaluated our ensemble of MoA mathematical models as a complete set, and considered different model subpopulations based on their mutational profiles. Here, only mutations with a co-occurrence >30% were taken into account. Through quantification and comparison of AML and the different motives’ tSignal, we found midostarutin’s impact over the microenvironment was high regardless of mutations (Table S9).
Next, an in-depth evaluation of effector proteins regarding the microenvironment influence in AML motives was carried out by comparing the mathematical models reproducing the behavior of midostaurin, and the ones simulating the behavior of specific FLT3 inhibition, both in combination with the same chemotherapeutic regimen. We identified the list of microenvironment influence effector proteins inhibited when midostaurin non-FLT3 targets are present. Among them, Table 3 retrieves those that showed statistically significant differences.

3.4. Midostaurin Monotherapy Predicted Potential Activity as Maintenance Therapy in FLT3-Mutated AML

In order to evaluate midostaurin as a potential maintenance therapy in FLT3-mutated AML, we first compared the predicted protein activity values inferred from the MoA mathematical models of midostaurin monotherapy, with the molecular signatures defined in MS1.1, MS1.2 and MS2. Regarding the MS1.1 set, we identified three proteins that were also modulated by midostaurin models: (1) phosphoinositide 3-kinase regulatory subunit 5 (PIK3R5); (2) interkeukin-4 (IL4); and (3) retinoic acid receptor RXR-alpha (RXRA). All were found to be overexpressed in the MS1.1 protein set, while inhibited in midostaurin mathematical models (Table 4).
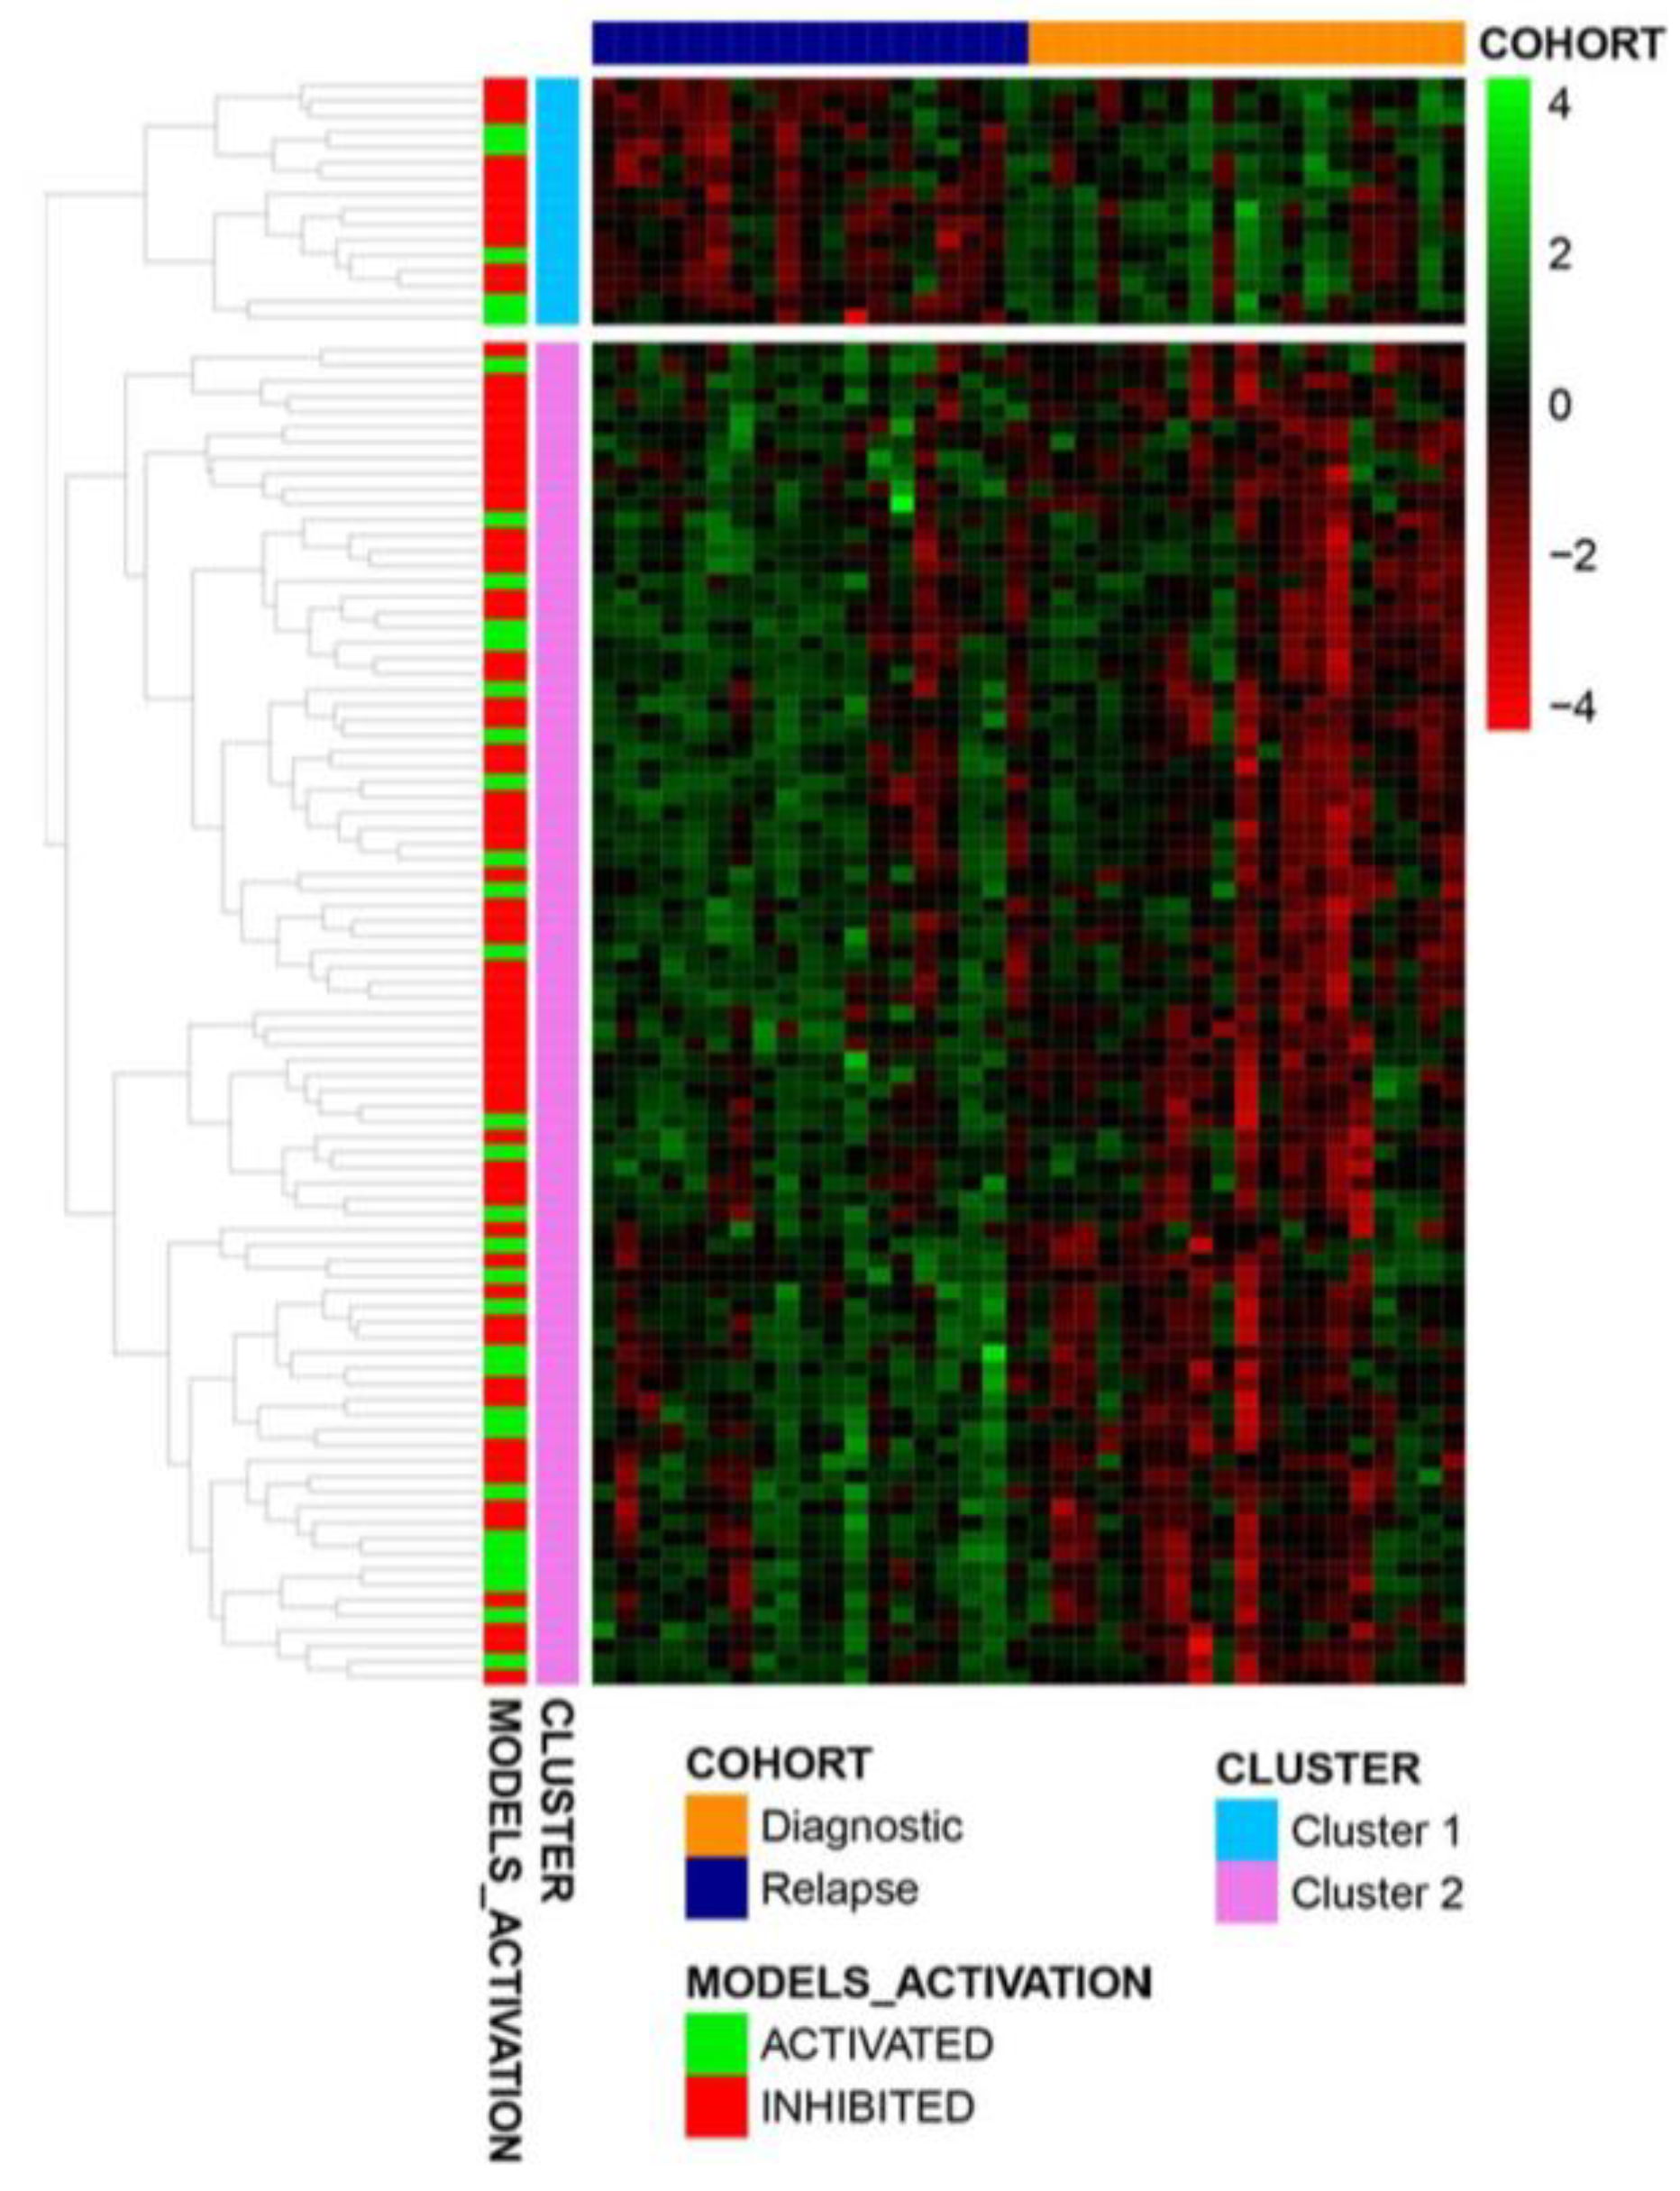
Then, by crossing the protein list of MS1.2 and midostaurin monotherapy mathematical models, we obtained 103 proteins related to AML relapse, which might also be modulated by midostaurin monotherapy treatment (Figure 4). Despite the fact that the MS1.2 molecular signature of relapse in AML is heterogeneous among different patients, relapsed and diagnostic samples showed an inverse pattern of expression for several genes that are modulated by midostaurin monotherapy.
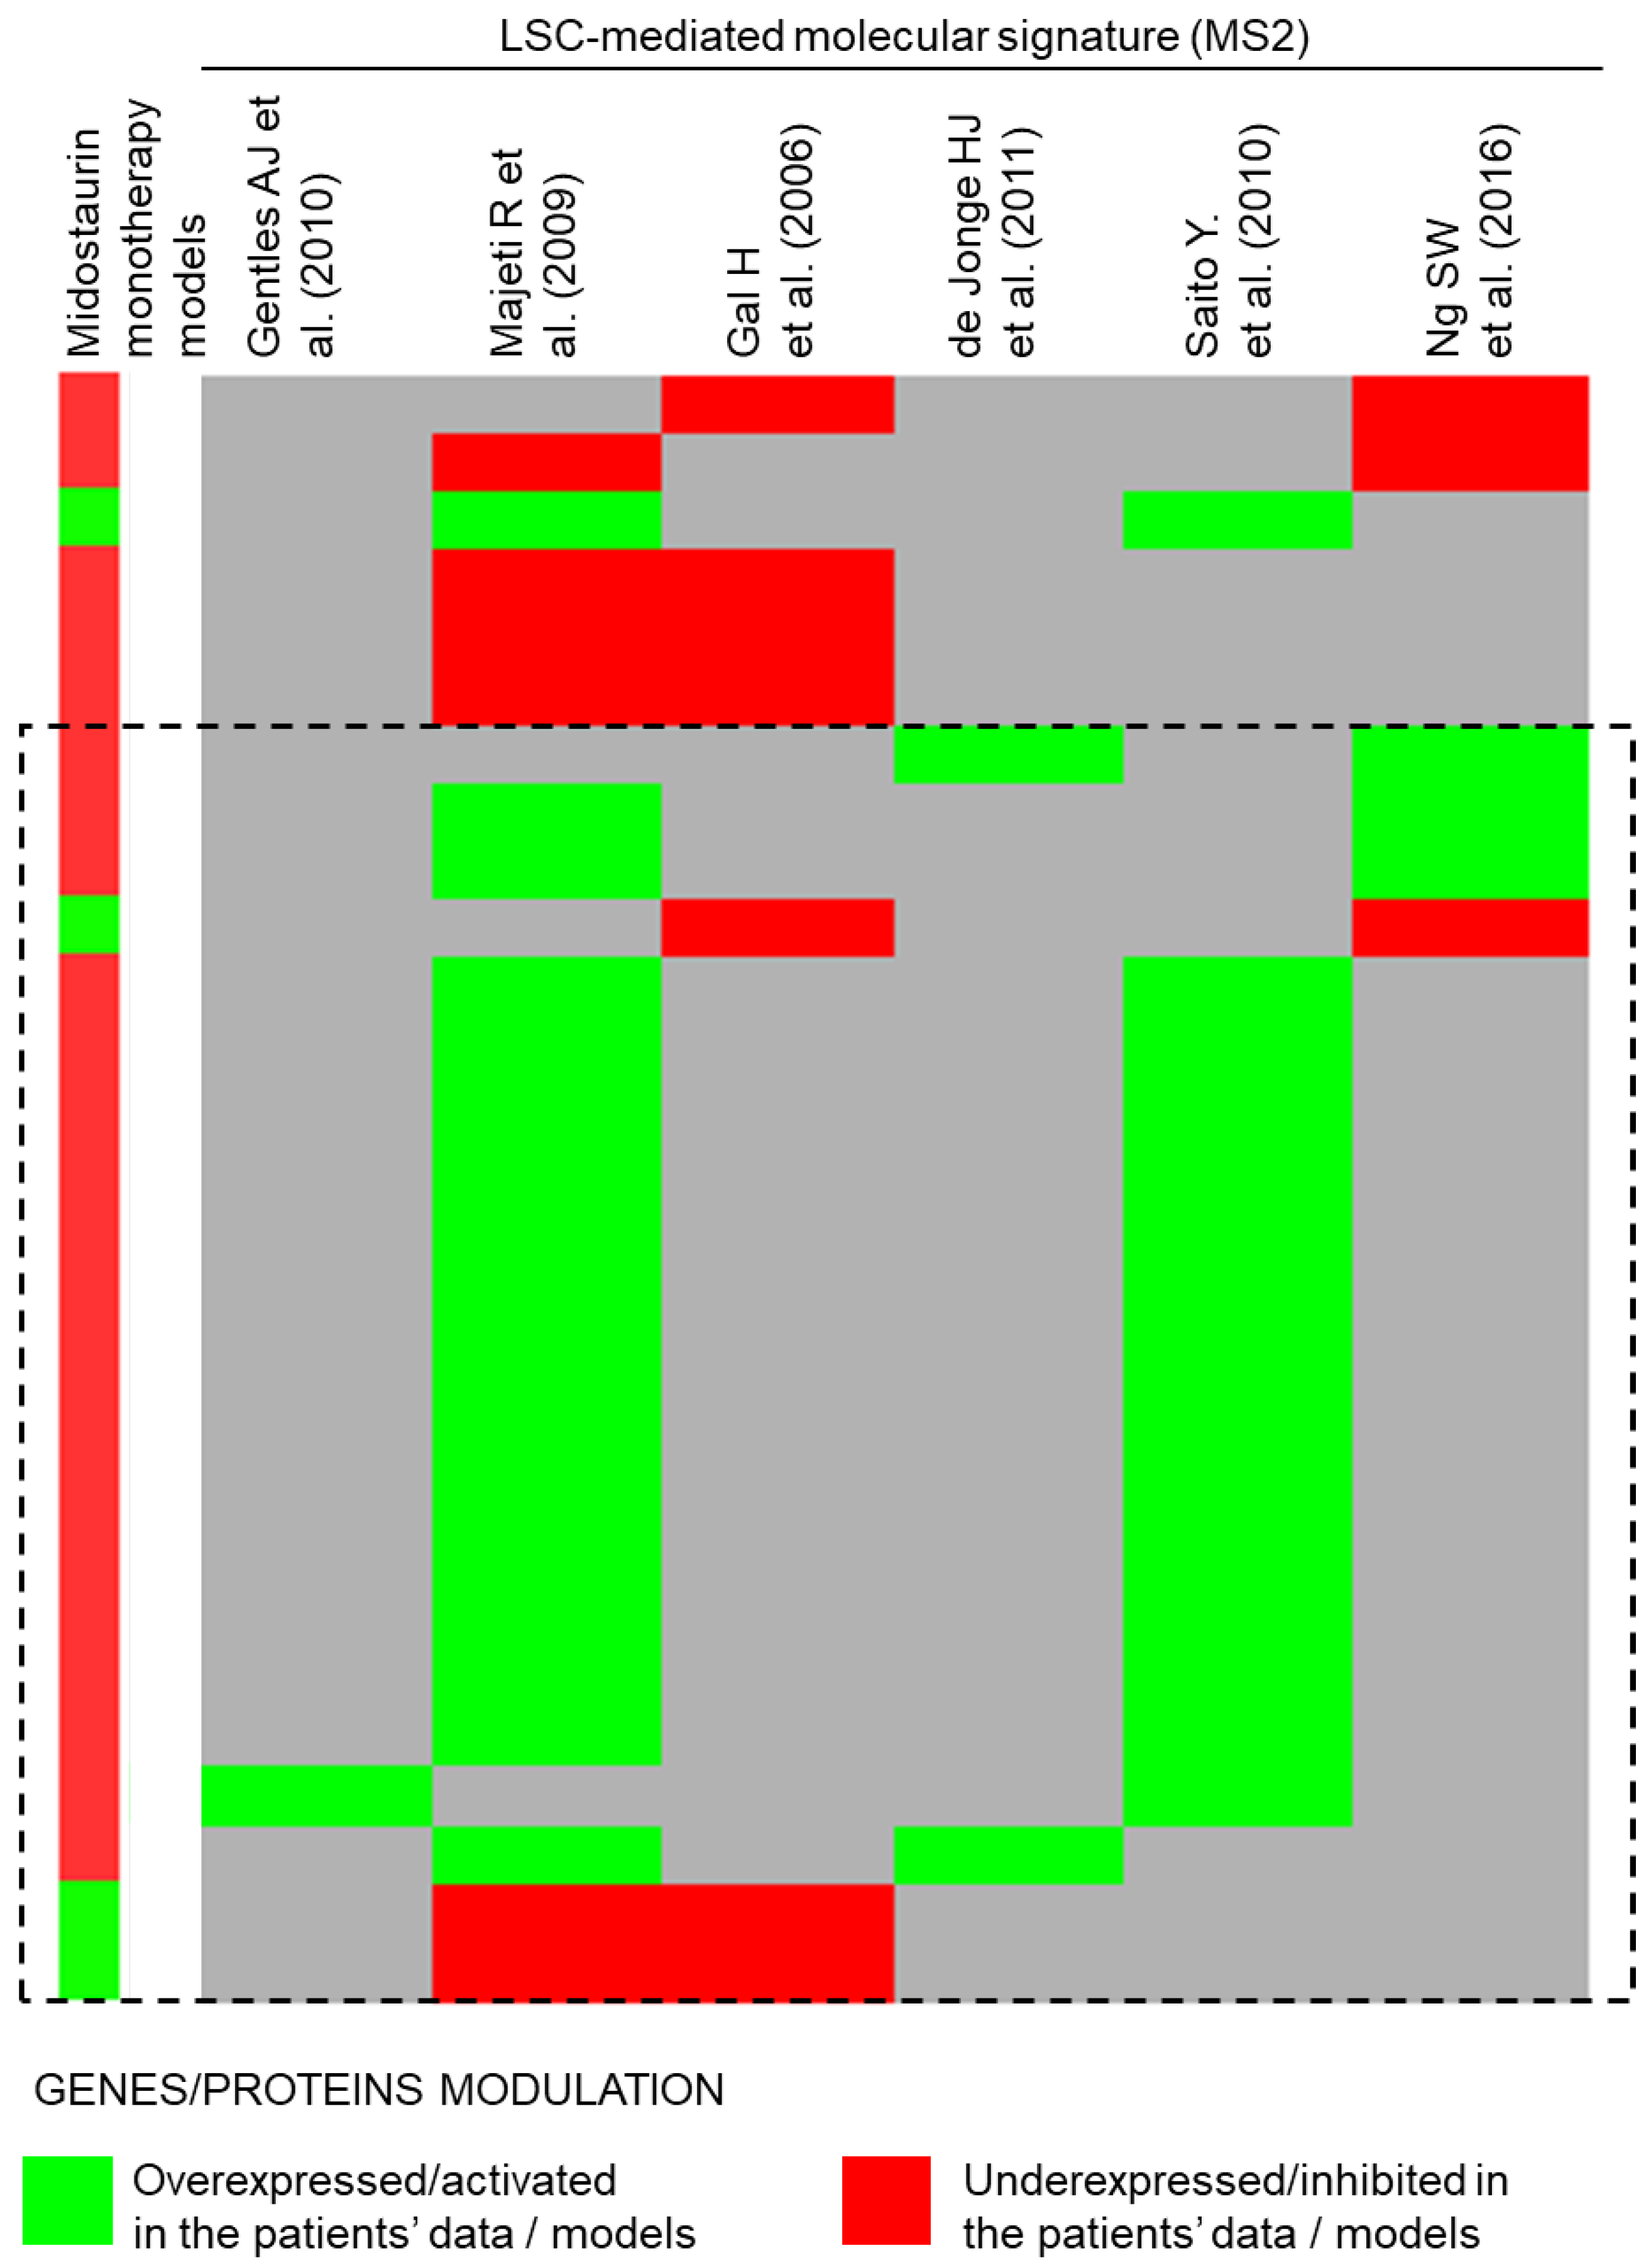
In the case of the MS2, 397 proteins of the extracted signature were found to also be modulated by midostaurin monotherapy in the MoA models. We observed that 54.2% (215 out of these 397 proteins) were reversed by the treatment according to the generated mathematical models. When considering proteins present in at least two out of the six datasets used in MS2 definition, we show that 22 out of 28 (78.6%) overlapping proteins were reversed by midostaurin (Figure 5, Table S10).
A final assessment based on enrichment analyses between MS1.1/MS1.2/MS2 and the MoA model of midostaurin monotherapy was conducted to identify likely proteins and AML motives potentially involved in the treatment. The results obtained show that midostaurin’s potential effects as a maintenance therapy are also mainly mediated through the modulation of the AML microenvironment (Table S11). Several enriched pathways related to microenvironment influence in AML have been detected as up-regulated in AML resistance and relapse (MS1.1 and MS1.2) and LSC-mediated mechanisms (MS2) and down-regulated by midostaurin monotherapy. Cytokines and chemokines present in AML microenvironment, proteins involved in AML microenvironment–stroma interactions and B cells and T cells signaling pathways present in the inflammatory tumor microenvironment seem to be up-regulated in AML relapse and by LSC-mediated mechanisms, and midostaurin might be able to counteract them.

4. Discussion

In this study we have generated systems biology- and machine learning-based models reproducing FLT3-mutated AML patients’ pathophysiology, in order to identify proteins and molecular mechanisms associated with the therapeutic effects of midostaurin mediated by its multikinase activity.
The results show that, not only FLT3, but also several midostaurin targets within its broad-spectrum inhibitory activity might contribute to drug efficacy (SYK, PKC [PKCγ, PKCα, PKCβ], KDR, PDPK1 or PDGFR; Figure 2), suggesting that the multitarget activity of the drug might exert an additional beneficial effect on FLT3-mutated AML. All of them are involved in proliferation and cell survival pathways and associated with disease progression and the development of hematologic malignancies. Interestingly, we identified two protein targets that had a comparable relevance to FLT3 in terms of contribution to the treatment efficacy: SYK and PKCΥ. Spleen tyrosine kinase (Syk) was previously described as a potential target for the treatment of hematologic cancer and is an important regulator of FLT3 in AML [48]. Some experimental evidence relates Syk to other therapeutic effects in FLT3-mutated AML patients, as it is involved in the BCR signaling pathway and is a key component of signal transduction [49]. Moreover, Syk hyperactivation has been related to FLT3 inhibitors resistance [50], so its inhibition in AML suggests an important role in a maintenance therapy context. The frequency of midostaurin targets in FLT3-mutated AML is of key importance to understand the multikinase drug effect.
We identified 13 proteins whose expression was altered by FLT3-mutated AML samples that were modelled to be more strongly modulated by midostaurin than by FLT3-specific inhibition (Table 1). Most of the proteins were signal transduction accessory proteins (RASGRP3, RHEB and G-coupled proteins, such as GNAO1, GNG4, GNGT1, GNG3, GNG13 and GNG12), implicated in the downstream cascades of several tyrosine kinases, and that are typically involved in a wide range of biological processes [51,52]. RHEB holds a relevant role in the regulation of growth and cell cycle progression [53]. Besides these proteins, we also identified other proteins within a range of functions: signalling (MAP2K7), inflammation (NLRP3 and CCL19), oxidative stress regulation (CYBB) and metabolism (HMGCR). We aimed at identifying the mechanisms linking midostaurin targets with these proteins and FLT3-mutated AML molecular changes, and found a mechanism involving MAPK signalling, a CCL19-RARB-NFKB1 regulatory loop and TNF signalling, among others. TNFα plays a role upregulating endothelial adhesion receptors to facilitate vascular adhesion and proliferation in BM niches [54], contributing to the microenvironment influence in AML; according to our models, the effects over TNF would be mediated by both FLT3- and non-FLT3-mediated mechanisms. Caspase-dependent apoptosis also seems to be modulated by both FLT3- and non-FLT3-mediated mechanisms. Deregulated apoptosis plays a relevant role in the outcome of leukemic cells and in the appearance of resistance mechanisms to antitumor drugs [55]. Thus, the development of new drugs that could trigger apoptosis in aggressive hematological malignancies, such as AML restoring their sensitivity to apoptosis stimuli, may be considered a promising antileukemic strategy [56]. In this sense, the promotion of caspase-dependent apoptotic pathway not only by the evaluated chemotherapeutic agents but also by midostaurin points towards the synergy of the combined treatment (midostaurin with chemotherapy) in FLT3-mutated AML.
According to our results, the inhibition of several kinases in addition to FLT3 might: (1) potentiate the drug antileukemic effects promoted by the inhibition of FLT3-mediated mechanisms; and (2) promote some potential FLT3-independent mechanisms, especially in the case of microenvironment influence.
To further characterize the non-FLT3-mediated midostaurin effects, we explored which of the FTL3-mutated AML motives was more affected by midostaurin, considering MoA mathematical models and ANN. We found that the most affected processes were proliferation and survival regulation and pro-leukemic microenvironment presence, through both FLT3-dependent mechanisms and the multitarget role of the drug. However, in the case of modulation of the pro-leukemic microenvironment, the ANN analysis detected a relevant role for FLT3-independent mechanisms to explain the overall midostaurin effects. In leukemia, the BM niche serves as the sanctuary for the majority of leukemic stem cells, and it is well-known that AML is highly dependent on the BM microenvironment, which plays a critical role in the development, progression and relapse of the disease [57]. Resistance to FLT3 inhibitors was proposed to be facilitated by signals from the microenvironment that allow survival of AML cells in the presence of FLT3 inhibitors [58]. Preclinical studies and early phase clinical trials have also demonstrated the potential for targeting the tumor-microenvironment interactions in AML [59]. There are several cytokines, such as TNFα, IFN-γ, IL-6, IL-8, IL-1 and transforming growth factor-beta (TGF-β), and chemokines, such as stromal cell-derived factor-1 (SDF-1 or CXCL12), involved in the regulation of an inflammatory tumor microenvironment [60]. To obtain more detail on these mechanisms, we then explored the proteins that could be behind this effect, and found TNF, as previously discussed, IL6 and CXCR4 to be more correctly modulated in the midostaurin models than when considering FLT3-specific inhibition. IL-6 is a cytokine with complex roles in the regulation of the immune system, known to be altered at the expression and functional levels in AML, and related to poor prognosis [61]; deregulation in the IL-6/STAT3/OXPHOS axis has been recently described as involved in AML chemoresistance [62]. CXCL12/CXCR4 axis is a key factor in the interactions between the AML cells and the BM microenvironment, facilitating leukemia trafficking and homing, and favoring the proliferative cross-talk between the tissues [63]. Stronger modulation of these pathways through a multi-target mechanism would result in reduced survival capacity of AML cells.
Finally, we aimed to explore the effect of midostaurin monotherapy as potential maintenance therapy. Midostaurin shows benefits as a maintenance therapy, either alone or in combination with the standard care of chemotherapy [64], being tolerable and contributing to an inhibition of FLT3 phosphorylation. In the present study, the potential effect of midostaurin monotherapy to avoid FLT3-mutated AML relapse was evaluated as a complementary strategy to assess the potential mechanisms of the treatment as a maintenance therapy. We used different datasets from maintenance studies (MS1.1, MS1.2 and MS2), in order to explore different scenarios: changes occurred between diagnosis and relapse (MS1) and factors related to LSCs leading to relapse (MS2). According to the datasets used, gene expression signatures of relapse in FLT3-mutated AML is heterogeneous among different patients, supporting the polyclonality of FLT3-mutated AML disease (Figure 4 and Figure 5). This may explain the lack of overlapping between proteins modulated by midostaurin in MS1.1 and MS1.2, although it could also be explained by the heterogeneity of the available cells or tissues PBMCs, BM and peripheral blood [29,30]. Nevertheless, we also observed that midostaurin monotherapy seems to modulate genes linked to disease relapse or progression and be related with LSC persistence (Table 4, Figure 4 and Figure 5), potentially interfering with pathways related to cytokines, B cells and T cells and microenvironment–stroma interactions (e.g., “04670_LEUKOCYTE TRANSENDOTHELIAL MIGRATION” in Table S11). According to the obtained results, relapsed samples (MS1.1 and MS1.2) and LSC-mediated mechanisms (MS2) present alterations in immune-related processes, and particularly in cytokines and chemokines, such as IL4R, IL3R, IL13RA1, CXCR4, CXCL2 or IL2R, which midostaurin monotherapy might counteract according to our models. Overall, the results show that midostaurin might also regulate the AML microenvironment, reducing B cells and T cells signaling pathways which are up-regulated in relapsed samples (MS1) and by LSC-mediated mechanisms (MS2).
It should be considered that, despite the power in contributing to the exploration of novel drug functions, our in silico modeling approach, as any computational model, is subject to limitations. The main limitation of all models is often the amount of information about diseases, drugs and the data available in public repositories; in this case, we worked with a very complex disease and drug. On the one hand, our motive-based classification is a simplification of the complexity accounted for by the FLT3-mutated AML condition, which could prevent us from identification of yet-to-be-described protein functions. On the other hand, the pharmacodynamics of midostaurin involve a complex interplay between the drug and its metabolites [65]. For this reason, not only the targets of midostaurin, but also the targets of its main metabolites, were considered in the present study, to allow us a closer evaluation of the in vivo effect of midostaurin. Finally, while we only used high-throughput patient-derived data for model results’ trimming and contextualization, the reduced number of patients included in the generation of molecular signatures, and the lack of available information from patients under maintenance therapy, represent limitation factors in this part of the study. Indeed, the beneficial effect of midostaurin in maintenance is still under investigation as, even though it was part of the RATIFY study in non-transplant patients, the generated data was not enough to extract any definitive conclusions. Notwithstanding these limitations, the models were built by considering the whole HPN and a wide range of drug–pathology relationships in the training set (Table S7) [19], not only limited to FLT3-mutated AML or oncologic indications. These models allow the compilation and reinterpretation of available biological data to generate hypotheses while reproducing known aspects of diseases and drugs. The literature-based approach used, combined with TPMS modelling, has proven useful in other therapeutical areas for the identification of mechanisms prospectively validated [66,67].
In conclusion, this in silico study unveiled that non-FLT3 midostaurin targets may play a role in pathways involved in FLT3-mutated AML treatment, not only acting on leukemic cells, but also through microenvironment modulation. Moreover, midostaurin monotherapy models suggested mechanisms behind the use of midostaurin as maintenance therapy in FLT3-mutated AML, also pointing towards a modulation of the immune system and BM microenvironment. While these results require further validation, they can be used as first steps in further understanding midostaurin mechanisms; most importantly as maintenance therapy, an aspect that is currently under extensive study and that will be further studied in the near future.

Supplementary Materials

The following are available online at https://www.mdpi.com/article/10.3390/biomedinformatics2030024/s1: Table S1, Summary of data (number of entries in the database for each data type) used for models construction (network and training set); Table S2, Most frequent co-occurring mutations in FLT3-mutated AML considered in the TPMS mathematical models; Table S3, Summary of FLT3-mutated AML molecular characterization; Table S4, Proteins included in the FL3-mutated AML molecular characterization; Table S5, Drug targets of midostaurin, daunorubicin and cytarabine considered in the study; Table S6, Genes considered as modulated in the downstream signaling pathways of midostaurin extracted from the literature review; Table S7, Genes considered as modulated in the downstream signaling pathways of midostaurin extracted from the analysis of GSE61715 dataset; Table S8, Patients’ data considered to extract the molecular signatures of FLT3-mutated AML and treatment resistance/relapse; Table S9, Impact of midostaurin combined with chemotherapy and FLT3-specific inhibition combined with the same chemotherapeutic regimen (daunorubicin and cytarabine) over microenvironment influence in AML; Table S10, Proteins overlapped in at least two datasets considered in the LSC-mediated mechanisms (MS2) molecular signature; Table S11, List of enriched pathways associated with microenvironment influence in AML.

Author Contributions

Conceptualization, M.D.-B., M.G.-F., M.T.G.-C., P.M., F.S.-G., M.C., M.V. and J.M.-L.; Data curation, R.V. and L.A.; Formal analysis, R.V. and L.A.; Investigation, R.V. and L.A.; Project administration, M.V.; Supervision, M.C. and J.M.-L.; Writing—original draft, R.V., L.A., M.C. and J.M.-L.; Writing—review & editing, M.D.-B., M.G.-F., R.V., L.A., M.T.G.-C., P.M., F.S.-G., M.C., M.V. and J.M.-L. All authors have read and agreed to the published version of the manuscript.

Funding

This study has been funded by Novartis Spain.

Informed Consent Statement

Not applicable.

Data Availability Statement

All the information, parameters and procedures used for the creation of specific midostaurin mechanistic models in FLT3-mutated patients are included in the article or accompanying Supplementary Materials. The original contributions generated for this study are included in the article or its Supplementary Materials. Further inquiries can be directed to the corresponding author.

Acknowledgments

The authors thank Guillem Jorba (Anaxomics Biotech) for their assistance in writing and editing the manuscript, and Cristina Segú-Vergés (Anaxomics Biotech) for her help in project coordination.

Conflicts of Interest

R.V., L.A. and M.C. are employees at Anaxomics Biotech. M.V. is an employee at Novartis. Honoraria and research funds have been received by M.T.G.-C. from Novartis, Janssen, BMS, Incyte and Pfizer; by J.M.-L. from Novartis, Janssen, B.M.S., Incyte and Roche; by M.G.-F. from Novartis, Jazz Pharmaceutics and Pfizer; by M.D.-B. from Celgene, Novartis, Astellas and Jazz Pharmaceutics; and by P.M. from Novartis. F.S.G. has received speaker’s or consultancy honoraria from Novartis, BMS/Celgene, Pfizer, Ariad/Incyte, Gilead, Amgen, Roche and Takeda, as well as grant/research support from Novartis.

Appendix A. Supplementary Methods

Appendix A1. TPMS Technology: Systems Biology-Based Model Creation and Analysis for FLT3-Mutated AML

Therapeutic Performance Mapping System (TPMS) is a validated top-down systems biology approach that integrates all available biological, pharmacological and medical knowledge, by means of pattern recognition and artificial intelligence techniques to create mathematical models that simulate the behavior of human physiology in silico. In this particular study, two TPMS complementary modelling strategies were used: (1) Sampling-based Methods, to investigate the molecular Mechanisms of Action (MoA) of midostaurin as treatment for FLT3-mutated Acute Myeloid Leukemia (AML); and (2) Artificial Neural Networks (ANNs), to predict the relationship strength between the drug and the disease defined motives.

Appendix A2. Creation of Human Biological Networks

A human protein network (HPN) was initially created, which incorporated the available relationships (edges or links) between proteins (nodes) from a regularly updated in-house database drawn from public sources: KEGG [68], REACTOME [69], INTACT [70], BIOGRID [71], HPRD [72], and TRRUST [47]. All information of the key proteins defined during the molecular characterization, and stored in relevant databases (drug targets, other diseases effectors, biomarkers…), was incorporated into the biological networks. This network was used as core for both modelling strategies.

Appendix A3. FLT3-Mutated AML Molecular Characterization

For FLT3-mutated AML characterization, we applied structured search strategies covering PubMed / MEDLINE database. We reviewed indexed literature reviews in PubMed database, using the following search string (from December 2008 to December 2018): ("acute myeloid leukemia"[Title] OR AML[Title]) AND (molecular OR pathophysiolog*[Title/Abstract] OR pathogen*[Title/Abstract]) AND (english[Language]). All retrieved results were reviewed at the title and abstract level, and those articles that appeared to contain molecular information were carefully reviewed at the full-length level, discarding those clinically-centered and focusing on other non-FLT3-mutated AML. The search was expanded using relevant references listed in the reviewed articles. The pathophysiological processes (motives) described to be involved in FLT3-mutated AML were identified, considering the most widely accepted biologically general concepts reported by the reviewed authors (Table S3). Subsequently, each motive was further functionally characterized at protein level to determine molecular effectors (Table S4). Accordingly, we identified proteins that are associated functionally with the development of the condition through their activity and functions (or lack thereof). This process has been previously successfully applied to create models that have yielded experimentally validated conclusions.

Appendix A4. MoA Mathematical Models Generation

Biological network-maps were transformed into mathematical models capable of both, reproducing existing knowledge and predicting new data. As it was deeply described [19] and applied elsewhere [20,21,73], TPMS sampling method technology uses a set of machine learning algorithms to simulate the human physiology over the HPN [23,74,75,76].
Briefly, a collection of known input-output physiological signal relationships were considered as training set data in order to train the models [77]. This data restrictions were obtained from a compendium of databases that accumulates biological and clinical data [78,79] and provides biological and pharmacological input-output relationships (such as drug-indication pairs). The biological or pathological conditions included as training data are molecularly characterized through specific scientific literature search and hand-curated assignment of proteins to the conditions. This protein mapping relating biological processes (adverse drug reactions, indications, diseases and molecular pathways) to their molecular effectors, i.e. each one of the proteins involved in the physiological process, was done using the biological effectors database (BED) [19]. Additionally, high-throughput data from microarray analysis was included, as well as two proteins sets defining midostaurin impact over cells. Differentially expressed genes from leukemic blasts from 11 FLT3-mutated AML patients vs normal hematopoietic cells from 38 healthy donors (data obtained from GSE9476) were retrieved according to adjusted p-value ≤ 0.05 and absolute value of log2FC >1 (Table S8). The two sets of proteins used as constraints for the MoA mathematical models’ generation process, were included as previously described [19,22]. On one hand, a set of proteins in the midostaurin downstream signaling pathways was identified with a literature review (Table S3). On the other, a list of genes modulated by midostaurin was extracted from gene expression data associated to the drug’s therapeutic effects in FLT3-mutated AML, using the data from a Gene Expression Omnibus (GEO) experiment for sensitive versus resistant midostaurin cell lines (GSE61715 dataset). The data was processed using GEO2R tool [25,80], using as significance threshold the adjusted p-value ≤ 0.01 and absolute value of log2FC ≥ 1 (Table S4). Finally, in order to reproduce the heterogeneity of the disease, the most frequent co-occurring mutations among FLT3-mutated AML patients (Table S2) were identified by a literature review and included in the mathematical models with the same ratio.
Thus, the approach allows creating models that integrate all the available biological, pharmacological and medical knowledge and are able to suggest mechanistic hypotheses that are consistent with actual biological processes. The subsequent models’ accuracy was calculated as their ability to reproduce or comply with the training set restrictions, so the percentage of correctly described restrictions; while model’s error was designated as the percentage of incorrectly described restrictions.
TPMS sampling-based methods models are similar to a Multilayer Perceptron of an Artificial Neural Network, over the human protein network (where neurons are the proteins and the edges of the network are used to transfer the information). This methodology was used for describing with high capability all plausible relationship pathways between an input (or stimulus) and an output (or response). These models use semi-supervised algorithms based on Stochastic-Bootstrapping for model solving, as well as Simulated Annealing for model optimization procedures [23], to solve each model parameter, i.e. the weights and directionality associated to the links between the nodes in the human protein network. The values of activation (+1) and inactivation (−1) of the targets of the drugs were considered as input, or initial signal for perturbing the network. The output results are then the signal values of activation and inactivation arriving at the proteins defining the phenotype (as retrieved from the BED). In this approach, the signal transduction between nodes is limited by considering only interactions that connect drug targets with the remaining of the network proteins in a maximum of three steps, to avoid loops and overfitting. Each node of the protein network then receives as input the output signals of all surrounding, directionally connected nodes, weighted by each link weight. The sum of inputs is transformed by a hyperbolic tangent function to calculate the resulting score of the node (neuron), which become the “output signal” towards subsequent nodes. The weight parameters are obtained by Stochastic Optimization Method based on Simulated Annealing [23], which use probabilistic measures derived from the biological evidences to adjust network interaction types and strengths. Since the number of restrictions in the training set are much smaller than the number of parameters (link weights) within the model, any process modelled by TPMS considers a population of different solutions.
In order to elucidate the multitarget capacity of midostaurin in FLT3-mutated AML, and also its potential as maintenance treatment in monotherapy, several drug vs. disease models were generated using FLT3-mutated AML as response/disease, and considering as drugs: (1) midostaurin in combination with daunorubicin and cytarabine; (2) FLT3 specific inhibition in combination with daunorubicin and cytarabine; and (3) midostaurin monotherapy. Models were constructed using the same optimization process, but modifying the inputs (drug characterization) accordingly. The resulting mechanisms of action are a mean representation of the ensemble of mathematical solutions obtained, with a final step of manual curation, i.e., manually checking for previous description in the literature whether the MoA made sense overall, featuring pathways coherent with the living system and the known pathophysiology of FLT3-mutated AML. The ensemble of models complied with the information in the training set with a mean accuracy >85%.

Appendix A5. Artificial Neural Network Models Generation

ANN models use supervised algorithms that identify relations between proteins (e.g. drug targets) and clinical elements of the network [21,22,74] by calculating the existence of a specific relationship probability between two or more protein sets. The model’s validity is based on the predictive capacity towards the known protein set relations, included in the training set. The learning methodology used consisted in an architecture of stratified ensembles of neural networks as a model, using a multilayer perceptron (MLP) neural network classifier. In order to increase the predictability behavior, 1000 initial MLPs are trained with the training set, each of them with a 10-fold cross-validation step to avoid overfitting, and the best 100 MLPs are used. In order to correctly predict the effect of a drug independently of the number of targets, a different ensemble of neural networks is trained for specific subset of drugs according to their number of protein targets (drugs with 1 target, 2 targets, 3 targets…). Then, the predictions for a query drug are calculated by all the ensembles, and pondered with respect to the number of targets of the query drug (the difference between the number of targets of the query drug and the number of targets of the drugs used to calculate each ensemble is used to ponder the result of each ensemble). That is, ensembles generated with the same, or similar, amount of protein targets will have more influence on the outcome result. A final cross-validation analysis step using the training dataset showed that the ANNs accuracy to reproduce the drug-indications relationships compiled in DrugBank [79,81] is 81.77% for those drugs with all targets in the human biological network. This strategy was used to predict the effectivness strength of drug-disease (motive) relationships, regarding midostaurin or FLT3-specific inhibition and FLT3-mutated AML.

References

  1. Dohner, H.; Weisdorf, D.J.; Bloomfield, C.D. Acute Myeloid Leukemia. N. Engl. J. Med. 2015, 373, 1136–1152. [Google Scholar] [CrossRef]
  2. Daver, N.; Schlenk, R.F.; Russell, N.H.; Levis, M.J. Targeting FLT3 mutations in AML: Review of current knowledge and evidence. Leukemia 2019, 33, 299–312. [Google Scholar] [CrossRef] [PubMed]
  3. Abbas, H.A.; Alfayez, M.; Kadia, T.; Ravandi-Kashani, F.; Daver, N. Midostaurin in Acute Myeloid Leukemia: An Evidence-Based Review And Patient Selection. Cancer Manag. Res. 2019, 11, 8817–8828. [Google Scholar] [CrossRef] [PubMed]
  4. Millward, M.J.; House, C.; Bowtell, D.; Webster, L.; Olver, I.N.; Gore, M.; Copeman, M.; Lynch, K.; Yap, A.; Wang, Y.; et al. The multikinase inhibitor midostaurin (PKC412A) lacks activity in metastatic melanoma: A phase IIA clinical and biologic study. Br. J. Cancer 2006, 95, 829–834. [Google Scholar] [CrossRef] [PubMed]
  5. Virchis, A.; Ganeshaguru, K.; Hart, S.; Jones, D.; Fletcher, L.; Wright, F.; Wickremasinghe, R.; Man, A.; Csermak, K.; Meyer, T.; et al. A novel treatment approach for low grade lymphoproliferative disorders using PKC412 (CGP41251), an inhibitor of protein kinase C. Hematol. J. 2002, 3, 131–136. [Google Scholar] [CrossRef] [PubMed]
  6. Campochiaro, P.A.; Group, C.P.S. Reduction of diabetic macular edema by oral administration of the kinase inhibitor PKC412. Investig. Ophthalmol. Vis. Sci. 2004, 45, 922–931. [Google Scholar] [CrossRef]
  7. Gotlib, J.; Kluin-Nelemans, H.C.; George, T.I.; Akin, C.; Sotlar, K.; Hermine, O.; Awan, F.T.; Hexner, E.; Mauro, M.J.; Sternberg, D.W.; et al. Efficacy and Safety of Midostaurin in Advanced Systemic Mastocytosis. N. Engl. J. Med. 2016, 374, 2530–2541. [Google Scholar] [CrossRef]
  8. Stone, R.M.; Mandrekar, S.J.; Sanford, B.L.; Laumann, K.; Geyer, S.; Bloomfield, C.D.; Thiede, C.; Prior, T.W.; Dohner, K.; Marcucci, G.; et al. Midostaurin plus Chemotherapy for Acute Myeloid Leukemia with a FLT3 Mutation. N. Engl. J. Med. 2017, 377, 454–464. [Google Scholar] [CrossRef]
  9. Short, N.J.; Kantarjian, H.; Ravandi, F.; Daver, N. Emerging treatment paradigms with FLT3 inhibitors in acute myeloid leukemia. Ther. Adv. Hematol. 2019, 10, 1–18. [Google Scholar] [CrossRef]
  10. Propper, D.J.; McDonald, A.C.; Man, A.; Thavasu, P.; Balkwill, F.; Braybrooke, J.P.; Caponigro, F.; Graf, P.; Dutreix, C.; Blackie, R.; et al. Phase I and pharmacokinetic study of PKC412, an inhibitor of protein kinase C. J. Clin. Oncol. 2001, 19, 1485–1492. [Google Scholar] [CrossRef]
  11. Ikegami, Y.; Yano, S.; Nakao, K. Antitumor effect of CGP41251, a new selective protein kinase C inhibitor, on human non-small cell lung cancer cells. Jpn J. Pharmacol. 1996, 70, 65–72. [Google Scholar] [CrossRef] [PubMed]
  12. Meshinchi, S.; Appelbaum, F.R. Structural and functional alterations of FLT3 in acute myeloid leukemia. Clin. Cancer Res. 2009, 15, 4263–4269. [Google Scholar] [CrossRef] [PubMed]
  13. Morales, M.L.; Arenas, A.; Ortiz-Ruiz, A.; Leivas, A.; Rapado, I.; Rodriguez-Garcia, A.; Castro, N.; Zagorac, I.; Quintela-Fandino, M.; Gomez-Lopez, G.; et al. MEK inhibition enhances the response to tyrosine kinase inhibitors in acute myeloid leukemia. Sci. Rep. 2019, 9, 18630. [Google Scholar] [CrossRef] [PubMed]
  14. Chen, P.; Levis, M.; Brown, P.; Kim, K.T.; Allebach, J.; Small, D. FLT3/ITD mutation signaling includes suppression of SHP-1. J. Biol. Chem. 2005, 280, 5361–5369. [Google Scholar] [CrossRef]
  15. Tabe, Y.; Konopleva, M. Role of Microenvironment in Resistance to Therapy in AML. Curr. Hematol. Malig. Rep. 2015, 10, 96–103. [Google Scholar] [CrossRef]
  16. Lamble, A.J.; Lind, E.F. Targeting the Immune Microenvironment in Acute Myeloid Leukemia: A Focus on T Cell Immunity. Front. Oncol. 2018, 8, 213. [Google Scholar] [CrossRef]
  17. Forte, D.; Krause, D.S.; Andreeff, M.; Bonnet, D.; Mendez-Ferrer, S. Updates on the hematologic tumor microenvironment and its therapeutic targeting. Haematologica 2019, 104, 1928–1934. [Google Scholar] [CrossRef]
  18. Cao, Z.; Ding, B.S.; Guo, P.; Lee, S.B.; Butler, J.M.; Casey, S.C.; Simons, M.; Tam, W.; Felsher, D.W.; Shido, K.; et al. Angiocrine factors deployed by tumor vascular niche induce B cell lymphoma invasiveness and chemoresistance. Cancer Cell 2014, 25, 350–365. [Google Scholar] [CrossRef]
  19. Jorba, G.; Aguirre-Plans, J.; Junet, V.; Segu-Verges, C.; Ruiz, J.L.; Pujol, A.; Fernandez-Fuentes, N.; Mas, J.M.; Oliva, B. In-silico simulated prototype-patients using TPMS technology to study a potential adverse effect of sacubitril and valsartan. PLoS ONE 2020, 15, e0228926. [Google Scholar] [CrossRef]
  20. Carcereny, E.; Fernandez-Nistal, A.; Lopez, A.; Montoto, C.; Naves, A.; Segu-Verges, C.; Coma, M.; Jorba, G.; Oliva, B.; Mas, J.M. Head to head evaluation of second generation ALK inhibitors brigatinib and alectinib as first-line treatment for ALK+ NSCLC using an in silico systems biology-based approach. Oncotarget 2021, 12, 316–332. [Google Scholar] [CrossRef]
  21. Romeo-Guitart, D.; Fores, J.; Herrando-Grabulosa, M.; Valls, R.; Leiva-Rodriguez, T.; Galea, E.; Gonzalez-Perez, F.; Navarro, X.; Petegnief, V.; Bosch, A.; et al. Neuroprotective Drug for Nerve Trauma Revealed Using Artificial Intelligence. Sci. Rep. 2018, 8, 1879. [Google Scholar] [CrossRef] [PubMed]
  22. Artigas, L.; Coma, M.; Matos-Filipe, P.; Aguirre-Plans, J.; Farres, J.; Valls, R.; Fernandez-Fuentes, N.; de la Haba-Rodriguez, J.; Olvera, A.; Barbera, J.; et al. In-silico drug repurposing study predicts the combination of pirfenidone and melatonin as a promising candidate therapy to reduce SARS-CoV-2 infection progression and respiratory distress caused by cytokine storm. PLoS ONE 2020, 15, e0240149. [Google Scholar] [CrossRef] [PubMed]
  23. Pierre Collet, J.-P.R. Stochastic Optimization Algorithms. In Intelligent Information Technologies: Concepts, Methodologies, Tools, and Applications; Sugumaran, V., Ed.; IGI Global: Hershey, PA, USA, 2008; pp. 1121–1137. [Google Scholar] [CrossRef]
  24. Iborra-Egea, O.; Galvez-Monton, C.; Roura, S.; Perea-Gil, I.; Prat-Vidal, C.; Soler-Botija, C.; Bayes-Genis, A. Mechanisms of action of sacubitril/valsartan on cardiac remodeling: A systems biology approach. NPJ Syst. Biol. Appl. 2017, 3, 12. [Google Scholar] [CrossRef] [PubMed]
  25. Davis, S.; Meltzer, P.S. GEOquery: A bridge between the Gene Expression Omnibus (GEO) and BioConductor. Bioinformatics 2007, 23, 1846–1847. [Google Scholar] [CrossRef] [PubMed]
  26. Smyth, G.K. limma: Linear Models for Microarray Data. In Bioinformatics and Computational Biology Solutions Using R and Bioconductor. Statistics for Biology and Health; Gentleman, R., Carey, V.J., Huber, W., Irizarry, R.A., Dudoit, S., Eds.; Springer: New York, NY, USA, 2005. [Google Scholar]
  27. Benjamini, Y.; Hochberg, Y. Controlling The False Discovery Rate—A Practical And Powerful Approach To Multiple Testing. J. Royal Statist. Soc. Ser. B 1995, 57, 289–300. [Google Scholar] [CrossRef]
  28. Stirewalt, D.L.; Meshinchi, S.; Kopecky, K.J.; Fan, W.; Pogosova-Agadjanyan, E.L.; Engel, J.H.; Cronk, M.R.; Dorcy, K.S.; McQuary, A.R.; Hockenbery, D.; et al. Identification of genes with abnormal expression changes in acute myeloid leukemia. Genes Chromosomes Cancer 2008, 47, 8–20. [Google Scholar] [CrossRef]
  29. Li, S.; Garrett-Bakelman, F.E.; Chung, S.S.; Sanders, M.A.; Hricik, T.; Rapaport, F.; Patel, J.; Dillon, R.; Vijay, P.; Brown, A.L.; et al. Distinct evolution and dynamics of epigenetic and genetic heterogeneity in acute myeloid leukemia. Nat. Med. 2016, 22, 792–799. [Google Scholar] [CrossRef]
  30. Shlush, L.I.; Mitchell, A.; Heisler, L.; Abelson, S.; Ng, S.W.K.; Trotman-Grant, A.; Medeiros, J.J.F.; Rao-Bhatia, A.; Jaciw-Zurakowsky, I.; Marke, R.; et al. Tracing the origins of relapse in acute myeloid leukaemia to stem cells. Nature 2017, 547, 104–108. [Google Scholar] [CrossRef]
  31. Law, C.W.; Chen, Y.; Shi, W.; Smyth, G.K. voom: Precision weights unlock linear model analysis tools for RNA-seq read counts. Genome Biol. 2014, 15, R29. [Google Scholar] [CrossRef]
  32. Ng, S.W.; Mitchell, A.; Kennedy, J.A.; Chen, W.C.; McLeod, J.; Ibrahimova, N.; Arruda, A.; Popescu, A.; Gupta, V.; Schimmer, A.D.; et al. A 17-gene stemness score for rapid determination of risk in acute leukaemia. Nature 2016, 540, 433–437. [Google Scholar] [CrossRef]
  33. Eppert, K.; Takenaka, K.; Lechman, E.R.; Waldron, L.; Nilsson, B.; van Galen, P.; Metzeler, K.H.; Poeppl, A.; Ling, V.; Beyene, J.; et al. Stem cell gene expression programs influence clinical outcome in human leukemia. Nat. Med. 2011, 17, 1086–1093. [Google Scholar] [CrossRef] [PubMed]
  34. Gentles, A.J.; Plevritis, S.K.; Majeti, R.; Alizadeh, A.A. Association of a leukemic stem cell gene expression signature with clinical outcomes in acute myeloid leukemia. JAMA 2010, 304, 2706–2715. [Google Scholar] [CrossRef] [PubMed]
  35. Majeti, R.; Becker, M.W.; Tian, Q.; Lee, T.L.; Yan, X.; Liu, R.; Chiang, J.H.; Hood, L.; Clarke, M.F.; Weissman, I.L. Dysregulated gene expression networks in human acute myelogenous leukemia stem cells. Proc. Natl. Acad. Sci. USA 2009, 106, 3396–3401. [Google Scholar] [CrossRef]
  36. Yang, X.H.; Li, M.; Wang, B.; Zhu, W.; Desgardin, A.; Onel, K.; de Jong, J.; Chen, J.; Chen, L.; Cunningham, J.M. Systematic computation with functional gene-sets among leukemic and hematopoietic stem cells reveals a favorable prognostic signature for acute myeloid leukemia. BMC Bioinform. 2015, 16, 97. [Google Scholar] [CrossRef] [PubMed]
  37. Gal, H.; Amariglio, N.; Trakhtenbrot, L.; Jacob-Hirsh, J.; Margalit, O.; Avigdor, A.; Nagler, A.; Tavor, S.; Ein-Dor, L.; Lapidot, T.; et al. Gene expression profiles of AML derived stem cells; similarity to hematopoietic stem cells. Leukemia 2006, 20, 2147–2154. [Google Scholar] [CrossRef] [PubMed]
  38. Ishikawa, F.; Yoshida, S.; Saito, Y.; Hijikata, A.; Kitamura, H.; Tanaka, S.; Nakamura, R.; Tanaka, T.; Tomiyama, H.; Saito, N.; et al. Chemotherapy-resistant human AML stem cells home to and engraft within the bone-marrow endosteal region. Nat. Biotechnol. 2007, 25, 1315–1321. [Google Scholar] [CrossRef] [PubMed]
  39. De Jonge, H.J.; Woolthuis, C.M.; Vos, A.Z.; Mulder, A.; van den Berg, E.; Kluin, P.M.; van der Weide, K.; de Bont, E.S.; Huls, G.; Vellenga, E.; et al. Gene expression profiling in the leukemic stem cell-enriched CD34+ fraction identifies target genes that predict prognosis in normal karyotype AML. Leukemia 2011, 25, 1825–1833. [Google Scholar] [CrossRef] [PubMed]
  40. Saito, Y.; Kitamura, H.; Hijikata, A.; Tomizawa-Murasawa, M.; Tanaka, S.; Takagi, S.; Uchida, N.; Suzuki, N.; Sone, A.; Najima, Y.; et al. Identification of therapeutic targets for quiescent, chemotherapy-resistant human leukemia stem cells. Sci. Transl. Med. 2010, 2, 17ra19. [Google Scholar] [CrossRef]
  41. Rivals, I.; Personnaz, L.; Taing, L.; Potier, M.C. Enrichment or depletion of a GO category within a class of genes: Which test? Bioinformatics 2007, 23, 401–407. [Google Scholar] [CrossRef]
  42. Subramanian, A.; Tamayo, P.; Mootha, V.K.; Mukherjee, S.; Ebert, B.L.; Gillette, M.A.; Paulovich, A.; Pomeroy, S.L.; Golub, T.R.; Lander, E.S.; et al. Gene set enrichment analysis: A knowledge-based approach for interpreting genome-wide expression profiles. Proc. Natl. Acad. Sci. USA 2005, 102, 15545–15550. [Google Scholar] [CrossRef]
  43. UniProt, C. UniProt: A hub for protein information. Nucleic Acids Res 2015, 43, D204–D212. [Google Scholar] [CrossRef]
  44. Kanehisa, M.; Goto, S. KEGG: Kyoto encyclopedia of genes and genomes. Nucleic Acids Res. 2000, 28, 27–30. [Google Scholar] [CrossRef] [PubMed]
  45. Whirl-Carrillo, M.; McDonagh, E.M.; Hebert, J.M.; Gong, L.; Sangkuhl, K.; Thorn, C.F.; Altman, R.B.; Klein, T.E. Pharmacogenomics knowledge for personalized medicine. Clin. Pharmacol. Ther. 2012, 92, 414–417. [Google Scholar] [CrossRef] [PubMed]
  46. Frolkis, A.; Knox, C.; Lim, E.; Jewison, T.; Law, V.; Hau, D.D.; Liu, P.; Gautam, B.; Ly, S.; Guo, A.C.; et al. SMPDB: The Small Molecule Pathway Database. Nucleic Acids Res. 2010, 38, D480–D487. [Google Scholar] [CrossRef] [PubMed]
  47. Han, H.; Shim, H.; Shin, D.; Shim, J.E.; Ko, Y.; Shin, J.; Kim, H.; Cho, A.; Kim, E.; Lee, T.; et al. TRRUST: A reference database of human transcriptional regulatory interactions. Sci. Rep. 2015, 5, 11432. [Google Scholar] [CrossRef] [PubMed]
  48. Boros, K.; Puissant, A.; Back, M.; Alexe, G.; Bassil, C.F.; Sinha, P.; Tholouli, E.; Stegmaier, K.; Byers, R.J.; Rodig, S.J. Increased SYK activity is associated with unfavorable outcome among patients with acute myeloid leukemia. Oncotarget 2015, 6, 25575–25587. [Google Scholar] [CrossRef]
  49. Liu, D.; Mamorska-Dyga, A. Syk inhibitors in clinical development for hematological malignancies. J. Hematol. Oncol. 2017, 10, 145. [Google Scholar] [CrossRef]
  50. Puissant, A.; Fenouille, N.; Alexe, G.; Pikman, Y.; Bassil, C.F.; Mehta, S.; Du, J.; Kazi, J.U.; Luciano, F.; Ronnstrand, L.; et al. SYK is a critical regulator of FLT3 in acute myeloid leukemia. Cancer Cell 2014, 25, 226–242. [Google Scholar] [CrossRef]
  51. Syrovatkina, V.; Alegre, K.O.; Dey, R.; Huang, X.Y. Regulation, Signaling, and Physiological Functions of G-Proteins. J. Mol. Biol. 2016, 428, 3850–3868. [Google Scholar] [CrossRef]
  52. Bar-Sagi, D.; Hall, A. Ras and Rho GTPases: A family reunion. Cell 2000, 103, 227–238. [Google Scholar] [CrossRef]
  53. Aspuria, P.J.; Tamanoi, F. The Rheb family of GTP-binding proteins. Cell Signal 2004, 16, 1105–1112. [Google Scholar] [CrossRef] [PubMed]
  54. Korn, C.; Mendez-Ferrer, S. Myeloid malignancies and the microenvironment. Blood 2017, 129, 811–822. [Google Scholar] [CrossRef] [PubMed]
  55. Vogler, M.; Walter, H.S.; Dyer, M.J.S. Targeting anti-apoptotic BCL2 family proteins in haematological malignancies—From pathogenesis to treatment. Br. J. Haematol. 2017, 178, 364–379. [Google Scholar] [CrossRef]
  56. Carter, J.L.; Hege, K.; Yang, J.; Kalpage, H.A.; Su, Y.; Edwards, H.; Huttemann, M.; Taub, J.W.; Ge, Y. Targeting multiple signaling pathways: The new approach to acute myeloid leukemia therapy. Signal Transduct. Target Ther. 2020, 5, 288. [Google Scholar] [CrossRef] [PubMed]
  57. Abdul-Aziz, A.M.; Sun, Y.; Hellmich, C.; Marlein, C.R.; Mistry, J.; Forde, E.; Piddock, R.E.; Shafat, M.S.; Morfakis, A.; Mehta, T.; et al. Acute myeloid leukemia induces protumoral p16INK4a-driven senescence in the bone marrow microenvironment. Blood 2019, 133, 446–456. [Google Scholar] [CrossRef]
  58. Ghiaur, G.; Levis, M. Mechanisms of Resistance to FLT3 Inhibitors and the Role of the Bone Marrow Microenvironment. Hematol. Oncol. Clin. N. Am. 2017, 31, 681–692. [Google Scholar] [CrossRef]
  59. Rashidi, A.; Uy, G.L. Targeting the microenvironment in acute myeloid leukemia. Curr. Hematol. Malig. Rep. 2015, 10, 126–131. [Google Scholar] [CrossRef]
  60. Sun, Z.; Wang, S.; Zhao, R.C. The roles of mesenchymal stem cells in tumor inflammatory microenvironment. J. Hematol. Oncol. 2014, 7, 14. [Google Scholar] [CrossRef]
  61. Li, P.; Ji, M.; Park, J.; Bunting, K.D.; Ji, C.; Tse, W. Th17 related cytokines in acute myeloid leukemia. Front. Biosci. 2012, 17, 2284–2294. [Google Scholar] [CrossRef]
  62. Hou, D.; Wang, B.; You, R.; Wang, X.; Liu, J.; Zhan, W.; Chen, P.; Qin, T.; Zhang, X.; Huang, H. Stromal cells promote chemoresistance of acute myeloid leukemia cells via activation of the IL-6/STAT3/OXPHOS axis. Ann. Transl. Med. 2020, 8, 1346. [Google Scholar] [CrossRef]
  63. Cho, B.S.; Kim, H.J.; Konopleva, M. Targeting the CXCL12/CXCR4 axis in acute myeloid leukemia: From bench to bedside. Korean J. Intern. Med. 2017, 32, 248–257. [Google Scholar] [CrossRef] [PubMed]
  64. Schlenk, R.F.; Weber, D.; Fiedler, W.; Salih, H.R.; Wulf, G.; Salwender, H.; Schroeder, T.; Kindler, T.; Lubbert, M.; Wolf, D.; et al. Midostaurin added to chemotherapy and continued single-agent maintenance therapy in acute myeloid leukemia with FLT3-ITD. Blood 2019, 133, 840–851. [Google Scholar] [CrossRef] [PubMed]
  65. Manley, P.W.; Caravatti, G.; Furet, P.; Roesel, J.; Tran, P.; Wagner, T.; Wartmann, M. Comparison of the Kinase Profile of Midostaurin (Rydapt) with That of Its Predominant Metabolites and the Potential Relevance of Some Newly Identified Targets to Leukemia Therapy. Biochemistry 2018, 57, 5576–5590. [Google Scholar] [CrossRef] [PubMed]
  66. Bayes-Genis, A.; Iborra-Egea, O.; Spitaleri, G.; Domingo, M.; Revuelta-Lopez, E.; Codina, P.; Cediel, G.; Santiago-Vacas, E.; Cserkoova, A.; Pascual-Figal, D.; et al. Decoding empagliflozin’s molecular mechanism of action in heart failure with preserved ejection fraction using artificial intelligence. Sci. Rep. 2021, 11, 12025. [Google Scholar] [CrossRef] [PubMed]
  67. Loren, V.; Garcia-Jaraquemada, A.; Naves, J.E.; Carmona, X.; Manosa, M.; Aransay, A.M.; Lavin, J.L.; Sanchez, I.; Cabre, E.; Manye, J.; et al. ANP32E, a Protein Involved in Steroid-Refractoriness in Ulcerative Colitis, Identified by a Systems Biology Approach. J. Crohns. Colitis 2019, 13, 351–361. [Google Scholar] [CrossRef] [PubMed]
  68. Kanehisa, M.; Furumichi, M.; Tanabe, M.; Sato, Y.; Morishima, K. KEGG: New perspectives on genomes, pathways, diseases and drugs. Nucleic Acids Res. 2017, 45, D353–D361. [Google Scholar] [CrossRef]
  69. Croft, D.; Mundo, A.F.; Haw, R.; Milacic, M.; Weiser, J.; Wu, G.; Caudy, M.; Garapati, P.; Gillespie, M.; Kamdar, M.R.; et al. The Reactome pathway knowledgebase. Nucleic Acids Res. 2014, 42, D472–D477. [Google Scholar] [CrossRef]
  70. Orchard, S.; Ammari, M.; Aranda, B.; Breuza, L.; Briganti, L.; Broackes-Carter, F.; Campbell, N.H.; Chavali, G.; Chen, C.; del-Toro, N.; et al. The MIntAct project--IntAct as a common curation platform for 11 molecular interaction databases. Nucleic Acids Res. 2014, 42, D358–D363. [Google Scholar] [CrossRef]
  71. Salwinski, L.; Licata, L.; Winter, A.; Thorneycroft, D.; Khadake, J.; Ceol, A.; Aryamontri, A.C.; Oughtred, R.; Livstone, M.; Boucher, L.; et al. Recurated protein interaction datasets. Nat. Methods 2009, 6, 860–861. [Google Scholar] [CrossRef]
  72. Keshava Prasad, T.S.; Goel, R.; Kandasamy, K.; Keerthikumar, S.; Kumar, S.; Mathivanan, S.; Telikicherla, D.; Raju, R.; Shafreen, B.; Venugopal, A.; et al. Human Protein Reference Database—2009 update. Nucleic Acids Res. 2009, 37, D767–D772. [Google Scholar] [CrossRef]
  73. Segu-Verges, C.; Coma, M.; Kessel, C.; Smeets, S.; Foell, D.; Aldea, A. Application of systems biology-based in silico tools to optimize treatment strategy identification in Still’s disease. Arthritis Res. Ther. 2021, 23, 126. [Google Scholar] [CrossRef] [PubMed]
  74. Bishop, C.M. Pattern Recognition and Machine Learning; Springer: New York, NY, USA, 2006. [Google Scholar]
  75. Kirkpatrick, S.; Gelatt, C.D., Jr.; Vecchi, M.P. Optimization by simulated annealing. Science 1983, 220, 671–680. [Google Scholar] [CrossRef] [PubMed]
  76. Russell, S.a.P.N. Artificial Intelligence: A Modern Approach.; Prentice Hall Press: Hoboken, NJ, USA, 2009. [Google Scholar]
  77. Anellis, I.H. Peirce’s Truth-functional Analysis and the Origin of the Truth Table. Hist. Philos. Logic 2012, 33, 87–97. [Google Scholar] [CrossRef]
  78. Kuhn, M.; Letunic, I.; Jensen, L.J.; Bork, P. The SIDER database of drugs and side effects. Nucleic Acids Res. 2016, 44, D1075–D1079. [Google Scholar] [CrossRef] [PubMed]
  79. Wishart, D.S.; Knox, C.; Guo, A.C.; Cheng, D.; Shrivastava, S.; Tzur, D.; Gautam, B.; Hassanali, M. DrugBank: A knowledgebase for drugs, drug actions and drug targets. Nucleic Acids Res. 2008, 36, D901–D906. [Google Scholar] [CrossRef]
  80. Edgar, R.; Domrachev, M.; Lash, A.E. Gene Expression Omnibus: NCBI gene expression and hybridization array data repository. Nucleic Acids Res. 2002, 30, 207–210. [Google Scholar] [CrossRef]
  81. Wishart, D.S.; Feunang, Y.D.; Guo, A.C.; Lo, E.J.; Marcu, A.; Grant, J.R.; Sajed, T.; Johnson, D.; Li, C.; Sayeeda, Z.; et al. DrugBank 5.0: A major update to the DrugBank database for 2018. Nucleic Acids Res. 2018, 46, D1074–D1082. [Google Scholar] [CrossRef]
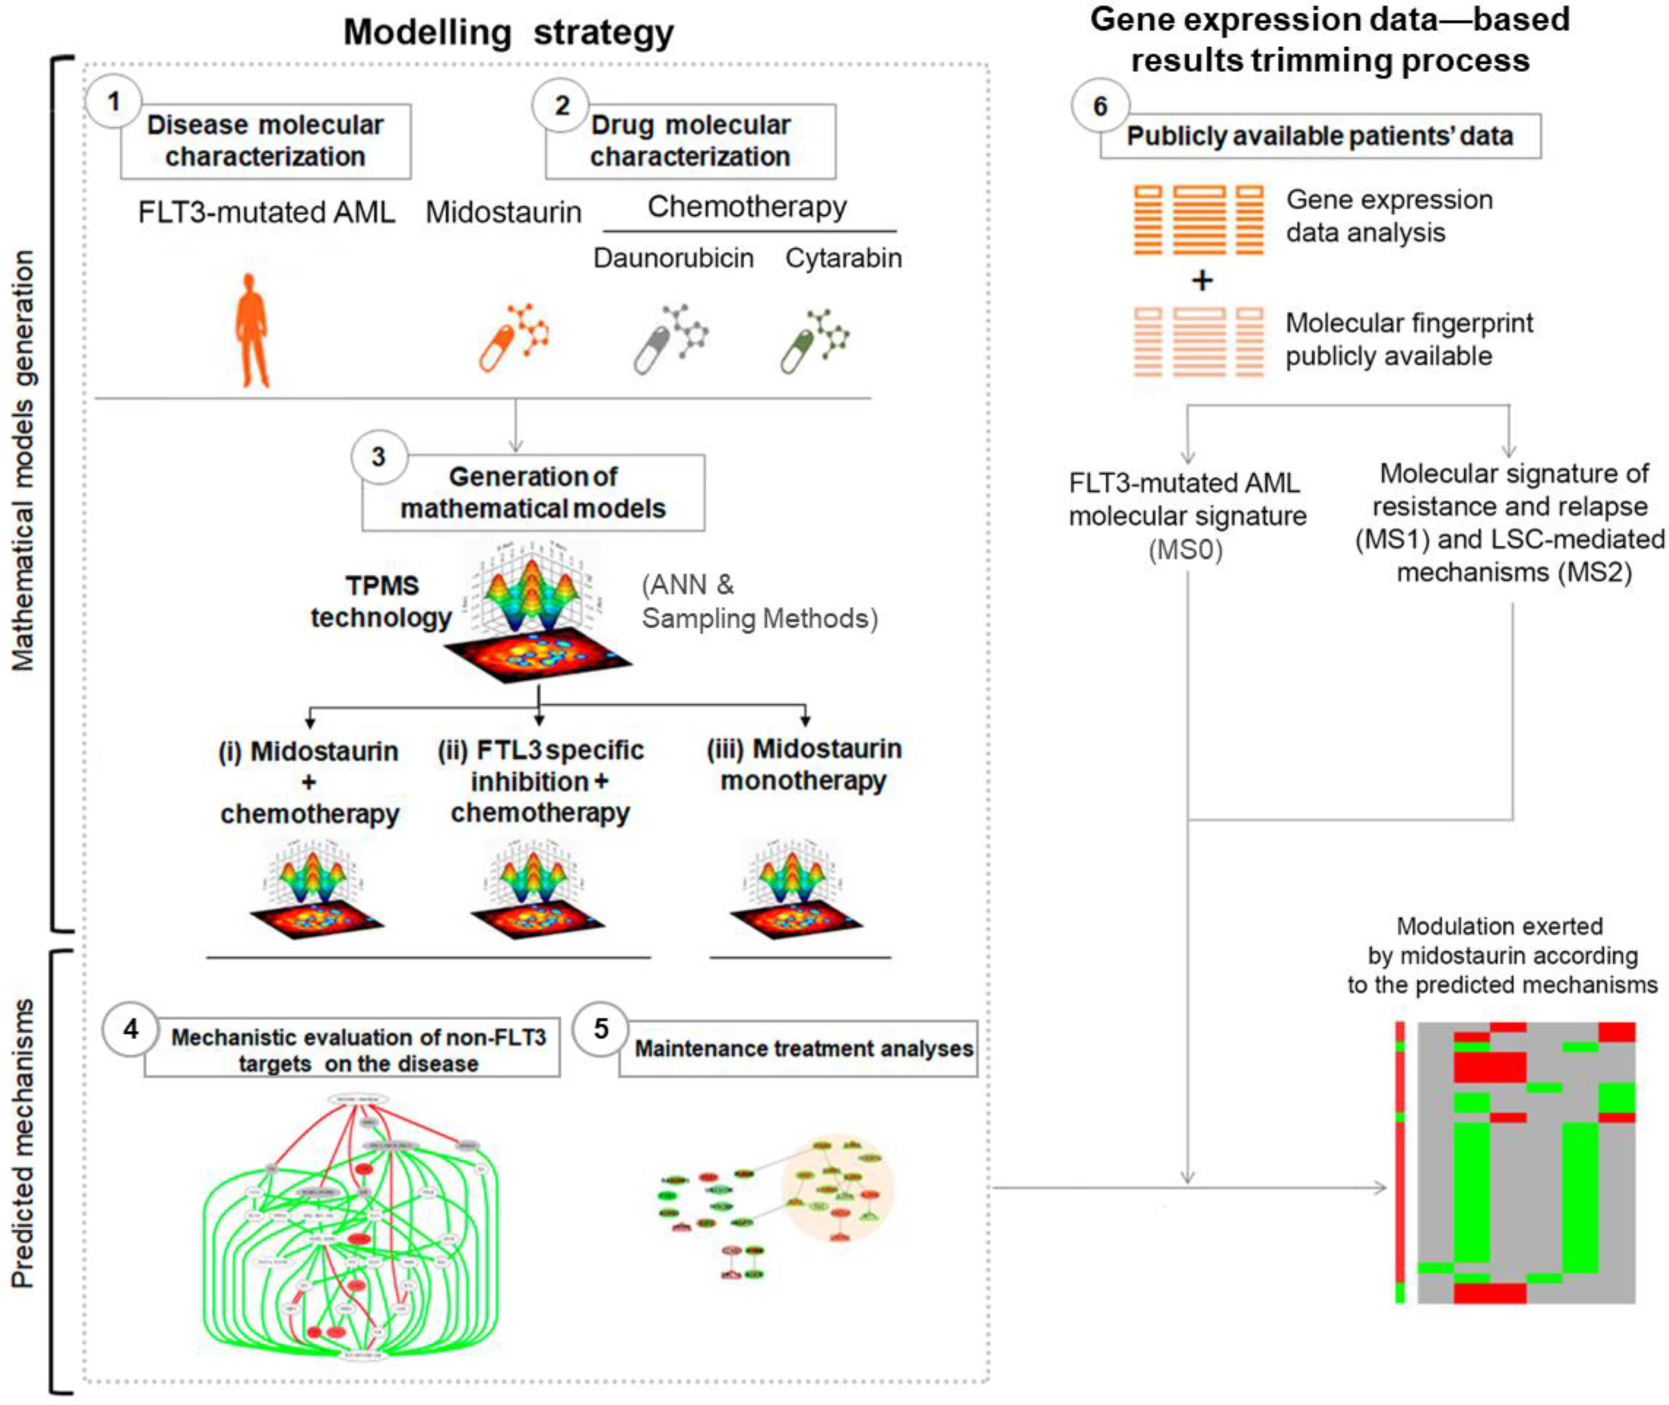
Figure 1. Schematic view of the Therapeutic Performance Mapping System (TPMS) approach used in the study. TPMS approach encompasses six steps: (1) the molecular characterization of FTL3-mutated AML and (2) drugs (midostaurin, daunorubicin and cytarabine) through dedicated bibliographical revision; (3) generation of TPMS-based mathematical models (for midostaurin in combination with daunorubicin and cytarabine, FLT3-specific inhibition with the same chemotherapeutic regimen, and midostaurin monotherapy); (4) evaluation of the contribution of the non-FLT3 midostaurin targets over FTL3-mutated AML, were FLT3-mutated AML signature was used to contrast the predicted hypotheses; (5) evaluation of the potential effect of midostaurin monotherapy as maintenance therapy; and (6) compilation and processing of publicity available patients’ data to describe FLT3-mutated AML molecular signature and AML relapse molecular signatures; data used for model results contextualization within available data. Region framed by dotted lines englobe the modelling generation and analysis steps.
Biomedinformatics 02 00024 g001
Figure 2. Midostaurin targets contribution (percentage effect) over FTL3-mutated AML. Results have been normalized considering the predicted effect (tSignal) of FLT3 (the known therapeutic target in FLT3-mutated AML). Dotted line indicates the percentage (75%) considered as threshold for midostaurin targets with highest contribution.
Biomedinformatics 02 00024 g002
Figure 3. Predicted mechanisms affected midostaurin and chemotherapy treatment. (A) Predicted molecular mechanisms potentially involved in the efficacy of midostaurin in combination with its common chemotherapeutic regimen (daunorubicin and cytarabine) in FLT3-mutated AML. Color boxes correspond to: pale red, FLT-3-dependent midostaurin (MF); red, non-FLT3-dependent midostaurin (MNF); dark blue, daunorubicin (D); and blue, cytarabine (C). (B) Molecular pathways mediated by midostaurin most contributing targets, over AML, affecting cell proliferation and survival and myeloblast differentiation; and predicted mechanisms affecting microenvironment of leukemic stem cells (LSC), bone marrow mesenchymal stem cells (BM-MSCs) interactions, and the ability of endothelial cells to promote angiogenesis and the secretion of growth factors. Non-FTL3 midostaurin affecting targets extrapolated from the literature review are indicated with red arrows. Proteins differentially modulated by midostaurin in combination with daunorubicin and cytarabine in comparison with FLT3-specific inhibition combined with the same chemotherapeutic regimen are highlighted in red. PKCs refer to PKCα, PKCβ and PKCγ.
Biomedinformatics 02 00024 g003
Figure 4. Cluster heatmap of the patients’ gene expressions in MS1.2 molecular signature, and the proteins modulated by midostaurin according to the monotherapy mathematical models. Cluster heatmap of the 103 differentially expressed genes in AML relapse extracted from GSE83533 series that are also modulated by midostaurin monotherapy according to the predicted models.
Biomedinformatics 02 00024 g004
Figure 5. Cluster heatmap of MS2 molecular signatures and the modulation exerted by midostaurin monotherapy in MoA models. Cluster heatmap of the 28 proteins from MS2 molecular signature overlapped in at least two leukemia stem cells (LSC) datasets, also modulated by midostaurin (according to the generated MoA models). Proteins not present in a LSC dataset are indicated in grey in the heatmap. Proteins squared in the dotted line are those from LSC-mediated molecular signatures that are reversed by midostaurin. Dataset references: Gentles AJ et al. (2010) [34], Majeti R et al. (2009) [35], Gal H et al. (2006) [37], de Jonge HJ et al. (2011) [39], Satio Y. et al. (2010) [40], Ng SW et al. (2016) [32].
Biomedinformatics 02 00024 g005
Table 1. Differentially modulated genes/proteins potentially associated with the contributory effect of non-FLT3 midostaurin targets over FLT3-mutated AML. Mean activation values of each protein (ranging from −1, totally inhibited, to 1, totally activated) in both models (midostaurin + chemotherapy and FLT3-specific inhibition + chemotherapy) and gene expression results from patients’ data (obtained from GSE9476 series). Adj. p-value: adjusted p-value obtained after Student’s t-test. ACC: classification analysis accuracy. CrossVal p-value: cross validated p-value. Gene expression (LogFC): differential gene expression value from patients’ data (obtained from GSE9476 series) expressed in LogFC.
Gene
Symbol
Uniprot
ID
Models’ Mean Signal ValuesT TestClassification
Analysis
MS0-FLT3-
Mutated AML vs. Healthy Samples
Midostaurin
+
Chemotherapy
FLT3-Specific
Target Inhibition + Chemotherapy
Adj.
p-Value
ACCCrossVal
p-Value
Differential Gene
Expression (LogFC)
CYBBP04839−10<0.05100<0.010.07
GNAO1P09471−0.890<0.0599.99<0.010.09
MAP2K7O14733−0.970<0.0599.98<0.010.03
GNG4P50150−0.870<0.05100<0.010.17
GNGT1P63211−0.870<0.05100<0.010.3
GNG3P63215−0.870<0.05100<0.010.07
RHEBQ15382−0.980<0.05100<0.010.1
RASGRP3Q8IV61−0.750<0.0599.99<0.011.31
NLRP3Q96P20−0.780<0.0599,99<0.011.21
CCL19Q99731−0.860<0.0599.98<0.010.13
GNG13Q9P2W3−0.870<0.05100<0.010.1
GNG12Q9UBI6−0.890<0.0599.99<0.010.1
HMGCRP0403510<0.05100<0.01−0.93
Table 2. Effect of midostaurin or FLT3-specific inhibition in FLT3-mutated AML by means of Artificial Neural Network (ANN) scores. Relationship between midostaurin monotherapy, its combination with chemotherapy and FLT3-specific inhibition in combination with chemotherapy (daunorubicin and cytarabine) over FLT3-mutated AML (A) and its associated pathophysiological motives (B). ANN scores are the probability of the resulted relationship as a true positive where: + corresponds to ANN score with p-value > 0.25; ++ corresponds to values between 0.15 and 0.25; and +++ corresponds to p-values < 0.15. Last column indicates whether the non-FLT3 targets of midostaurin contribute to the evaluated effects (yes) or not (no).
Midostaurin
Monotherapy
Midostaurin + ChemotherapyFLT3-Specific Target
Inhibition + Chemotherapy
Improvement by Non-FLT3 Targets
(A) FTL3-AML molecular definition (whole disease)++++++++yes
(B) FTL3-AML pathophysiological
motives
Epigenetic dysregulation in AML+++no
Genetic predisposition to AML+++++no
Immunophenotypic features of AML+++no
Impaired myeloblast differentiation in AML+++no
Increased proliferation and survival mediated by FLT3+++++++++no
Microenvironment influence in AML+++++++yes
Table 3. Differentially modelled microenvironment’s effector proteins/genes between midostaurin and FLT3-specific inhibition MoA models. Mean signal values of each protein (ranging from 1, totally activated, to −1, totally inhibited) in both MoA models (midostaurin+chemotherapy and FLT3-inhibition+chemotherapy). Adj. p-value: adjusted p-value obtained after Student’s t-test. ACC: classification analysis accuracy. CrossVal p-value: cross validated p-value. The state of activation of the proteins in microenvironment influence in AML is also indicated in the “Protein activation state in AML microenvironment” column, according to the available scientific literature (Table S6). Proteins are overactivated (1) or inhibited (−1) in the context of FLT3-mutated AML.
Gene SymbolUniProt IDModels’ Mean Signal ValuesT TestClassification
Analysis
Protein
Activation State in AML
Microenvironment
Midostaurin + ChemotherapyFLT3-Specific
Target Inhibition + Chemotherapy
Adj.
p-Value
ACCCrossVal
p-Value
TNFP01375−0.970.13<0.0591.25<0.011
IL6P05231−0.820.26<0.0579.66<0.011
CXCR4P61073−0.89−0.11<0.0571.61<0.011
Table 4. Proteins/genes modulated by midostaurin monotherapy and present in MS1 definition. Mean signal values of each protein (ranging from 1, totally activated, to −1, totally inhibited) in midostaurin monotherapy MoA model. Log2FC: differential gene expression value from patients’ data (obtained from Shlush LI. et al. [30]) expressed in Log2FC. Adj. p-value: adjusted p-value, from the differential expression analysis.
Gene
Symbol
UniProt IDMidostaurin
Monotherapy Model Mean Signal Values
Differential Gene Expression
Log2FCAdj.
p-Value
PIK3R5Q8WYR1−1.000.950.04
IL4RP24394−1.001.290.02
RXRAP19793−0.381.950.04
Publisher’s Note: MDPI stays neutral with regard to jurisdictional claims in published maps and institutional affiliations.