Article

Deep Learning Model for COVID-19-Infected Pneumonia Diagnosis Using Chest Radiography Images

by
Bunyodbek Ibrokhimov
1,* and
Justin-Youngwook Kang
2,*
1
Department of Computer Engineering, Inha University, Inha-ro, 100, Nam-gu, Incheon 22212, Republic of Korea
2
Postbaccalaureate Premedical Program, University of Southern California, Los Angeles, CA 90089, USA
*
Authors to whom correspondence should be addressed.
BioMedInformatics 2022, 2(4), 654-670; https://doi.org/10.3390/biomedinformatics2040043
Submission received: 14 November 2022 / Revised: 19 November 2022 / Accepted: 22 November 2022 / Published: 25 November 2022
(This article belongs to the Section Imaging Informatics)

Abstract

:
Accurate and early detection of causes of pneumonia is important for implementing fast treatment and preventive strategies, reducing the burden of infections, and establishing more effective ways of interventions. After the outbreak of COVID-19, the new cases of pneumonia and conditions of breathing problems called acute respiratory distress syndrome have increased. Chest radiography, known as CXR or simply X-ray has become a significant source to diagnose COVID-19-infected pneumonia in designated institutions and hospitals. It is essential to develop automated computer systems to assist doctors and medical experts to diagnose pneumonia in a fast and reliable manner. In this work, we propose a deep learning (DL)-based computer-aided diagnosis system for rapid and easy detection of pneumonia using X-ray images. To improve classification accuracy and faster conversion of the models, we employ transfer learning and parallel computing techniques using well-known DL models such as VGG19 and ResNet50. Experiments are conducted on the large COVID-QU-Ex dataset of X-ray images with three classes, such as COVID-19-infected pneumonia, non-COVID-19 infections (other viral and bacterial pneumonia), and normal (uninfected) images. The proposed model outperformed compared methodologies, achieving an average classification accuracy of 96.6%. Experimental results demonstrate that the proposed method is effective in diagnosing pneumonia using X-ray images.

1. Introduction

Since the first case of novel coronavirus COVID-19 in December in China, it has infected 230 countries and led to 640,273,401 new cases and 6,615,322 deaths worldwide [1]. It also affected the world economy, overall healthcare, and the lives of every individual. Due to its highly contagious nature, the overall control of the virus outbreak has been challenging and there have been rapid infections in public. The main symptoms of COVID-19 are sore throat, cough, fever, pain in the chest area, and shortness of breath. Sometimes it can also lead to several severe complications such as induced pneumonia and acute respiratory distress syndrome (ARDS) [2]. With the help of mass vaccinations being used around the world, the prevention of COVID-19 has improved to a certain degree. The Reverse Transcription Polymerase Chain Reaction (RT-PCR) test, commonly known as a PCR test, has become a common practice to diagnose the COVID-19 virus. Initially, individuals had to go to hospitals or specialized local laboratories to get PCR tests. Nowadays, it has become one of the gold-standard methods and with the help of PCR special kits, individuals can get tested quickly and easily at home anytime, especially when suspicious symptoms arise. However, such PCR tests alone are insufficient in diagnosing the virus due to high false negatives when get tested at home. Additionally, the test shows positive or negative results and cannot classify the complications of the virus such as pneumonia or ARDS. Differentiating COVID-19-infected pneumonia and other viral or bacterial pneumonia types is important to effectively fight against the disease and/or implement preventive measures in healthcare. Latency in the treatment can lead to death or different complications such as reduced lung functions and the development of chronic non-communicable respiratory diseases including chronic obstructive pulmonary disease or asthma [3,4,5]. Early diagnosis and treatment of pneumonia in children are especially important since it is the major cause of childhood mortality [6]. In practice, chest imaging modalities are used to diagnose and classify different types of COVID-19 symptoms and their complications. Such imaging modalities include ultrasound, magnetic resonance imaging (MRI), computed tomography (CT) scan, and chest tomography (X-ray). Among them, ultrasound is mostly used in children because it is less affected by crying and body movement [6,7] and also less costly than other modalities. However, ultrasound images are unable to visualize the whole lung and cannot identify consolidation when it is deep in the lung parenchyma [8]. Additionally, the spleen in the stomach can sometimes be misinterpreted as lung consolidation [9]. CT scanning is more reliable in many cases but not recommended for routine diagnosis and for children and pregnant women due to high radiation risks. It is also an expensive imaging modality and is sparsely available in many local hospitals and healthcare centers [10]. MRI can be used to avoid the radiation risks of CT scanning [11,12]. Moreover, due to a cross-sectional imaging technique, MRI is useful to identify severe cases of pneumonia. However, MRI scanning is challenging with children who are too young to cooperate [13,14], and more than often sedation or anesthesia is required, which is highly discouraged. Moreover, the sparse availability of expert radiologists in local healthcare facilities to interpret the MRI results makes it less usable on many occasions. X-ray is one of the common practices for diagnosing many lung-related diseases due to its availability in many countries and healthcare facilities. It is also cheaper and faster compared to CT and MRI. However, unlike MRI imaging modality, X-ray is a two-dimensional image and offers less information in general. In this work, we use X-ray images dataset as it is primarily used to diagnose COVID-19.
With recent advancements in artificial intelligence (AI) and deep learning (DL) methods, many DL-based computer-aided diagnosis (CAD) systems and other computer vision methodologies are introduced to help medical experts, practitioners, radiologists, and doctors diagnose various medical data [15,16,17,18]. In the literature, the roles and contributions of such CAD systems are already well established. For example, in recent years, DL-based CAD systems have been widely used to diagnose numerous diseases, such as brain cancer, lung cancer, breast cancer, skin cancer, ophthalmology, and even day-to-day healthcare practices [19,20,21,22,23]. The integration of such DL-based methodologies into disease diagnosis is also called radiomics or deep radiomics, which is an emerging field of study [24,25,26,27,28,29]. Moreover, research work done in translational medicine [30,31] addressed how to fill the gap between medical-clinical practices with other basic sciences such as computer science. Translational medicine is helpful to employ advancements in DL methods into radiology and other clinical practices. Additionally, as demonstrated by recent studies [32,33], some DL-based object detection and segmentation models can potentially perform as well as radiologists or even outperform them in standalone mode by producing reliable and accurate results [23]. Several studies have shown such CAD systems can be used to diagnose COVID-19 and induced pneumonia using X-ray images [34,35,36,37,38,39,40,41,42,43,44,45,46]. Moreover, the introduction of more and more radiomics methods in recent years contributed to the wide integration and employment of AI methods in medicine, from segmentation models to detection and classification models [24,25,26,27,28]. This trend is presented by Roy et al. [24] and an overall review of the employment of AI models in various medical applications is discussed.
In this study, based on the knowledge of the current literature, we design and develop a DL-based CAD system to diagnose and classify COVID-19-infected pneumonia from chest X-ray images. Pneumonia diagnosis using X-ray images includes correctly identifying key features and biomarkers, classifying the disease and corresponding abnormalities into proper categories, and using these findings to distinguish between viral and bacterial or mixed bacterial-viral infections. Even though there are many existing research studies regarding the diagnosis of pneumonia and COVID-19-induced pneumonia from X-ray images in the literature, the majority of these studies used small-to-medium X-ray samples of COVID-19-infected pneumonia cases [34,35,36,38,39,40,41,42,43,44]. However, with the overall development of deep learning models and the introduction of larger X-ray image datasets, it is now possible to design and develop more accurate and highly efficient DL-based CAD systems. In this work, we propose an end-to-end DL-based CAD model to diagnose and classify X-ray images into three classes, such as COVID-19-infected pneumonia, non-COVID-19 infections (other viral and bacterial pneumonia), and normal (uninfected) images. We address the limited data problem by employing a large X-ray image dataset and push the performance and training time of the proposed DL models further by employing transfer learning and parallel computing techniques. We use the COVID-QU-Ex dataset [47] consisting of 33,920 chest X-ray images that belong to a total of three classes. The dataset is collected from 10 different datasets by the researchers of Qatar University and is openly available to the public. The dataset is fairly balanced consisting of 11,956 COVID-19 cases, 11,263 non-COVID-19 infections (other viral and bacterial pneumonia), and 10,701 normal (uninfected) X-ray images. Our key contribution in this work is twofold. Firstly, we employ deep transfer learning techniques to train several well-known convolutional neural network (CNN) based models for faster convergence. Based on the literature review and experimental results obtained by research work [36,37,47], we have selected two best-performing model architectures, namely VGG19 [48] and ResNet50 [49]. Using these architectures, we train each model on the COVID-QU-Ex dataset and evaluate their performance. Secondly, we propose a parent–child parallel training mechanism to accelerate the training process. In this training mechanism, the dataset is divided into several portions and trained by child nodes parallelly and corresponding trained parameters (i.e., weights and biases) are passed to the parent node. The parent node then combines these parameters and redistributes them to child nodes. Such training methods are especially beneficial when multiple models need to be trained on large datasets such as COVID-QU-Ex. Even though these contributions are not novel in computer engineering, their combination presents novelty in the context of DL-based CAD systems for medical data diagnosis.
The remaining structure of this paper is as follows. Section 2 discusses related works in the literature on pneumonia and COVID-19 diagnosis. Section 3 explains the proposed parallel computing and transfer learning mechanisms. Section 4 describes the experiment environment, evaluation metrics, and the dataset used in this study. We also demonstrate experiment results, findings, and comparisons of our models. Comparisons and discussions are shown in Section 5. Finally, Section 6 concludes the paper.

2. Related Literature

In recent years, DL-based CAD systems have been widely used to diagnose numerous diseases in radiology, oncology, and pulmonology. Among them, we will discuss related methods that use chest X-ray images. Even though there are many proposed works to diagnose COVID-19 and other pneumonia types in the literature, they differ a lot in terms of CAD system design, network structure, and datasets. Therefore, it is difficult to assess the performance of each method and perform a one-to-one comparison. For example, Narin et al. [38], Minaee et al. [39], Hemdan et al. [40], and Sethy et al. [41] proposed different CNN-based diagnosis systems. However, the dataset used in their study was too small. Narin et al. [38] obtained 98% accuracy with ResNet50 using 50 normal and 50 COVID-19 X-ray images. Hemdan et al. [40] proposed a COVIDX-Net model. In the experiments, they obtained 90% classification accuracy using a total of 50 images (25 normal and 25 COVID-19). With the same dataset, Sethy et al. [41] obtained 95.4% classification accuracy. They employed the ResNet50 model with support vector machines (SVM). In comparison, Minaee et al. [39] used a larger dataset, containing 100 COVID-19 and 5000 non-COVID-19 X-ray images. Their proposed Deep-COVID model obtained 97.5% and 90% sensitivity score and specificity score, respectively. Even though the dataset is larger in comparison to prior work, the dataset used by [39] is highly imbalanced.
Oh et al. [42] proposed ResNet18-based model and obtained 88.9% accuracy. Even though they used only 502 sample images, the dataset contains five classes (191 normal, 54 bacterial, 20 viral, 57 tuberculosis, and 180 COVID-19 cases).
Khan et al. [36], Apostolopoulos et al. [43], and Ozturk et al. [44] used around 1200–1500 X-ray image data belonging to two-three classes. Apostolopoulos et al. [43] obtained 98.8% accuracy using various networks including VGG19, MobileNet, and Inception network architectures. Ozturk et al. [44] proposed the DarkCovidNet model. Using 1625 X-ray images, they achieved 87% accuracy. Khan et al. [36] trained VGG16 and VGG19 models using transfer learning and obtained 99.4% classification accuracy using 1683 X-ray images. Even though they obtained great results, the dataset used in their work contains only two classes, normal and COVID-19 with 200 test images.
Wang et al. [45], Narayanan et al. [46], and Brima et al. [37] used relatively big datasets containing more than 5800 X-ray images. Narayanan et al. [46] trained ResNet50, Inceptionv3, Xception, and DenseNet201 models using 5658 total images. The best-reported result was 98% accuracy. Wang et al. [45] used a total of 13,975 images to train VGG19 and ResNet50 models. By employing transfer learning, they achieved 93.3% classification accuracy across three classes, such as normal, COVID-19, and pneumonia. Brima et al. [37] obtained the best accuracy of 94% from VGG19, DenseNet121, and ResNet50 using the COVID-19 Radiography Database. This dataset is one of the biggest datasets in the literature and contains 21,165 chest X-ray images across four classes (3616 COVID-19, 10,192 normal, 6012 lung opacity, and 1345 viral pneumonia images). The dataset is not well balanced, but it contains a larger number of samples and more classes compared to other datasets.
In this work, we use an even bigger dataset called COVID-QU-Ex dataset with more than 33,900 well-sorted and filtered X-ray images. Moreover, the COVID-QU-Ex dataset is fairly balanced with around 11,000 images per class. According to the experimental results and findings from the discussed literature, VGG19 and ResNet50 network architectures are found to be the most effective in diagnosing and classifying chest X-ray image data. Therefore, we employ these two networks in this study.

3. Proposed Methodology

The overall process of the proposed DL-based CAD method is shown in Figure 1. In this study, we use two popular CNN-based deep network architectures to evaluate their performance on the COVID-QU-Ex dataset. The initial networks were trained on the ImageNet classification dataset with over a million images. We then employ a transfer learning technique to learn X-ray image data. Moreover, during training, we further accelerate the training process by employing a parent–child parallel computing mechanism. Each mechanism is explained in detail in the following sections.

3.1. Data Preprocessing

Generally, data preprocessing is used to filter, clean, and augment the dataset before training. Since the COVID-QU-Ex dataset is already cleaned by eliminating duplicates and low-quality images, we only use data augmentation at this stage. Data augmentation refers to the concept of generating new data using the existing data by applying some steps. Popular data augmentation methods are resizing, flipping the image horizontally and vertically, zooming, cropping, and rotating the image. However, since the purpose of this work is to diagnose X-ray images, cropping, flipping vertically, and zooming methods are not suitable. Therefore, we only use resizing, horizontal flipping, and rotation.
All images are resized into 256 × 256 × 3 dimensions. For rotation, up to 12-degree rotation is used to keep the image alignment. For every image, one rotation or horizontal flip is randomly applied during training. No data augmentation is performed for validation and test images.

3.2. Transfer Learning

The overall workflow of transfer learning is illustrated in Figure 2. When transferring the knowledge of the network from the source domain to the target domain, the initial layers of the deep neural network remain unchanged. In other words, initial convolutional layers are frozen, and the training is conducted to optimize the remaining network parameters for the target domain data.
The transfer learning process consists of two stages. First, the network is trained on the source domain to achieve optimal performance on the test samples of the source domain. Secondly, the network parameters are fine-tuned (i.e., optimized) for the target domain by training the network on the training samples. Finally, the model is tested on the test samples of the target domain to evaluate the performance of the transfer learning for the target domain.
Even though the target domain, which contains X-ray image data, and the source domain, which contains ImageNet data of various classes, these two domains share similarities for network training. The purpose of initial convolutional layers, which contain multiple filters, is to detect low-level and high-level features from input images. Low-level features include the detection of colors, lines, curves, edges and commonly known as edge detection, whereas high-level features include small objects, local surfaces and attributes. Additionally, together they make up for feature extraction, where the unique features of the input images are obtained. Later, these extracted features are combined in the fully connected layers to obtain different characteristics of the input image in order to distinguish several images from each other depending on the underlying differences of the present features.

3.3. Parallel Computing

The concept of parent–child parallel computing method is demonstrated in Figure 3. Unlike serial training method which involves training whole dataset and updating network parameters at once, parallel training mechanism divides the dataset X into multiple portions, e.g., P portions, and then uses P child nodes to train all portions.
Let Equations (1) and (2) denote the parameter update functions of conventional training. Then, Equations (4) and (5) shows the update functions for parallel computing.
W ( t ) = W ( t 1 ) α E ( t 1 ) W ( t 1 )
b ( t ) = c ( t 1 ) + α E ( t 1 ) W ( t 1 )
where W and b denote weights and bias of the network, t denotes iteration, α denotes learning rate, and E denotes error function (i.e., loss function) given as:
E = 1 K k = 1 K ( Y a c t u a l k Y p r e d k ) 2
where K denotes number of training samples, Y a c t u a l and Y p r e d denote target labels and corresponding output values. In parallel computing method, the original training dataset X is divided into P portions so that error function defined in Equation (3) is changed as:
E = 1 K p = 1 P k = 1 K ( Y a c t u a l k Y p r e d k ) 2
Subsequently, the update functions are changes as:
W ( t ) = W ( t 1 ) α p = 1 P E p ( t 1 ) W ( t 1 )
b ( t ) = c ( t 1 ) + α p = 1 P E p ( t 1 ) W ( t 1 )
where E p denotes the error function for the sub-dataset X p . In this way, all child nodes compute updated weights and biases and transfer them to the parent node. The parent node updates the parameters of the network by processing the results transferred by the child nodes and again broadcasts the updated parameters to each child node, where child node resumes network training using its local data X p . This procedure is repeated until the training process is finished. When the accuracy is not improved for several iterations, the learning rate α is reduced by a factor of 10 to further optimize the network parameters. Finally, the network parameters are fine-tuned for a few epochs to generalize the gradients and obtain optimal convergence.

4. Experimental Environment

Our method is implemented using Pytorch deep learning framework and the experiments are carried out on a local machine equipped with Nvidia Titan X Pascal 12 GB graphics processing unit. The effectiveness of the proposed DL-based CAD model is justified via several evaluation metrics.

4.1. Performance Evaluation Metrics
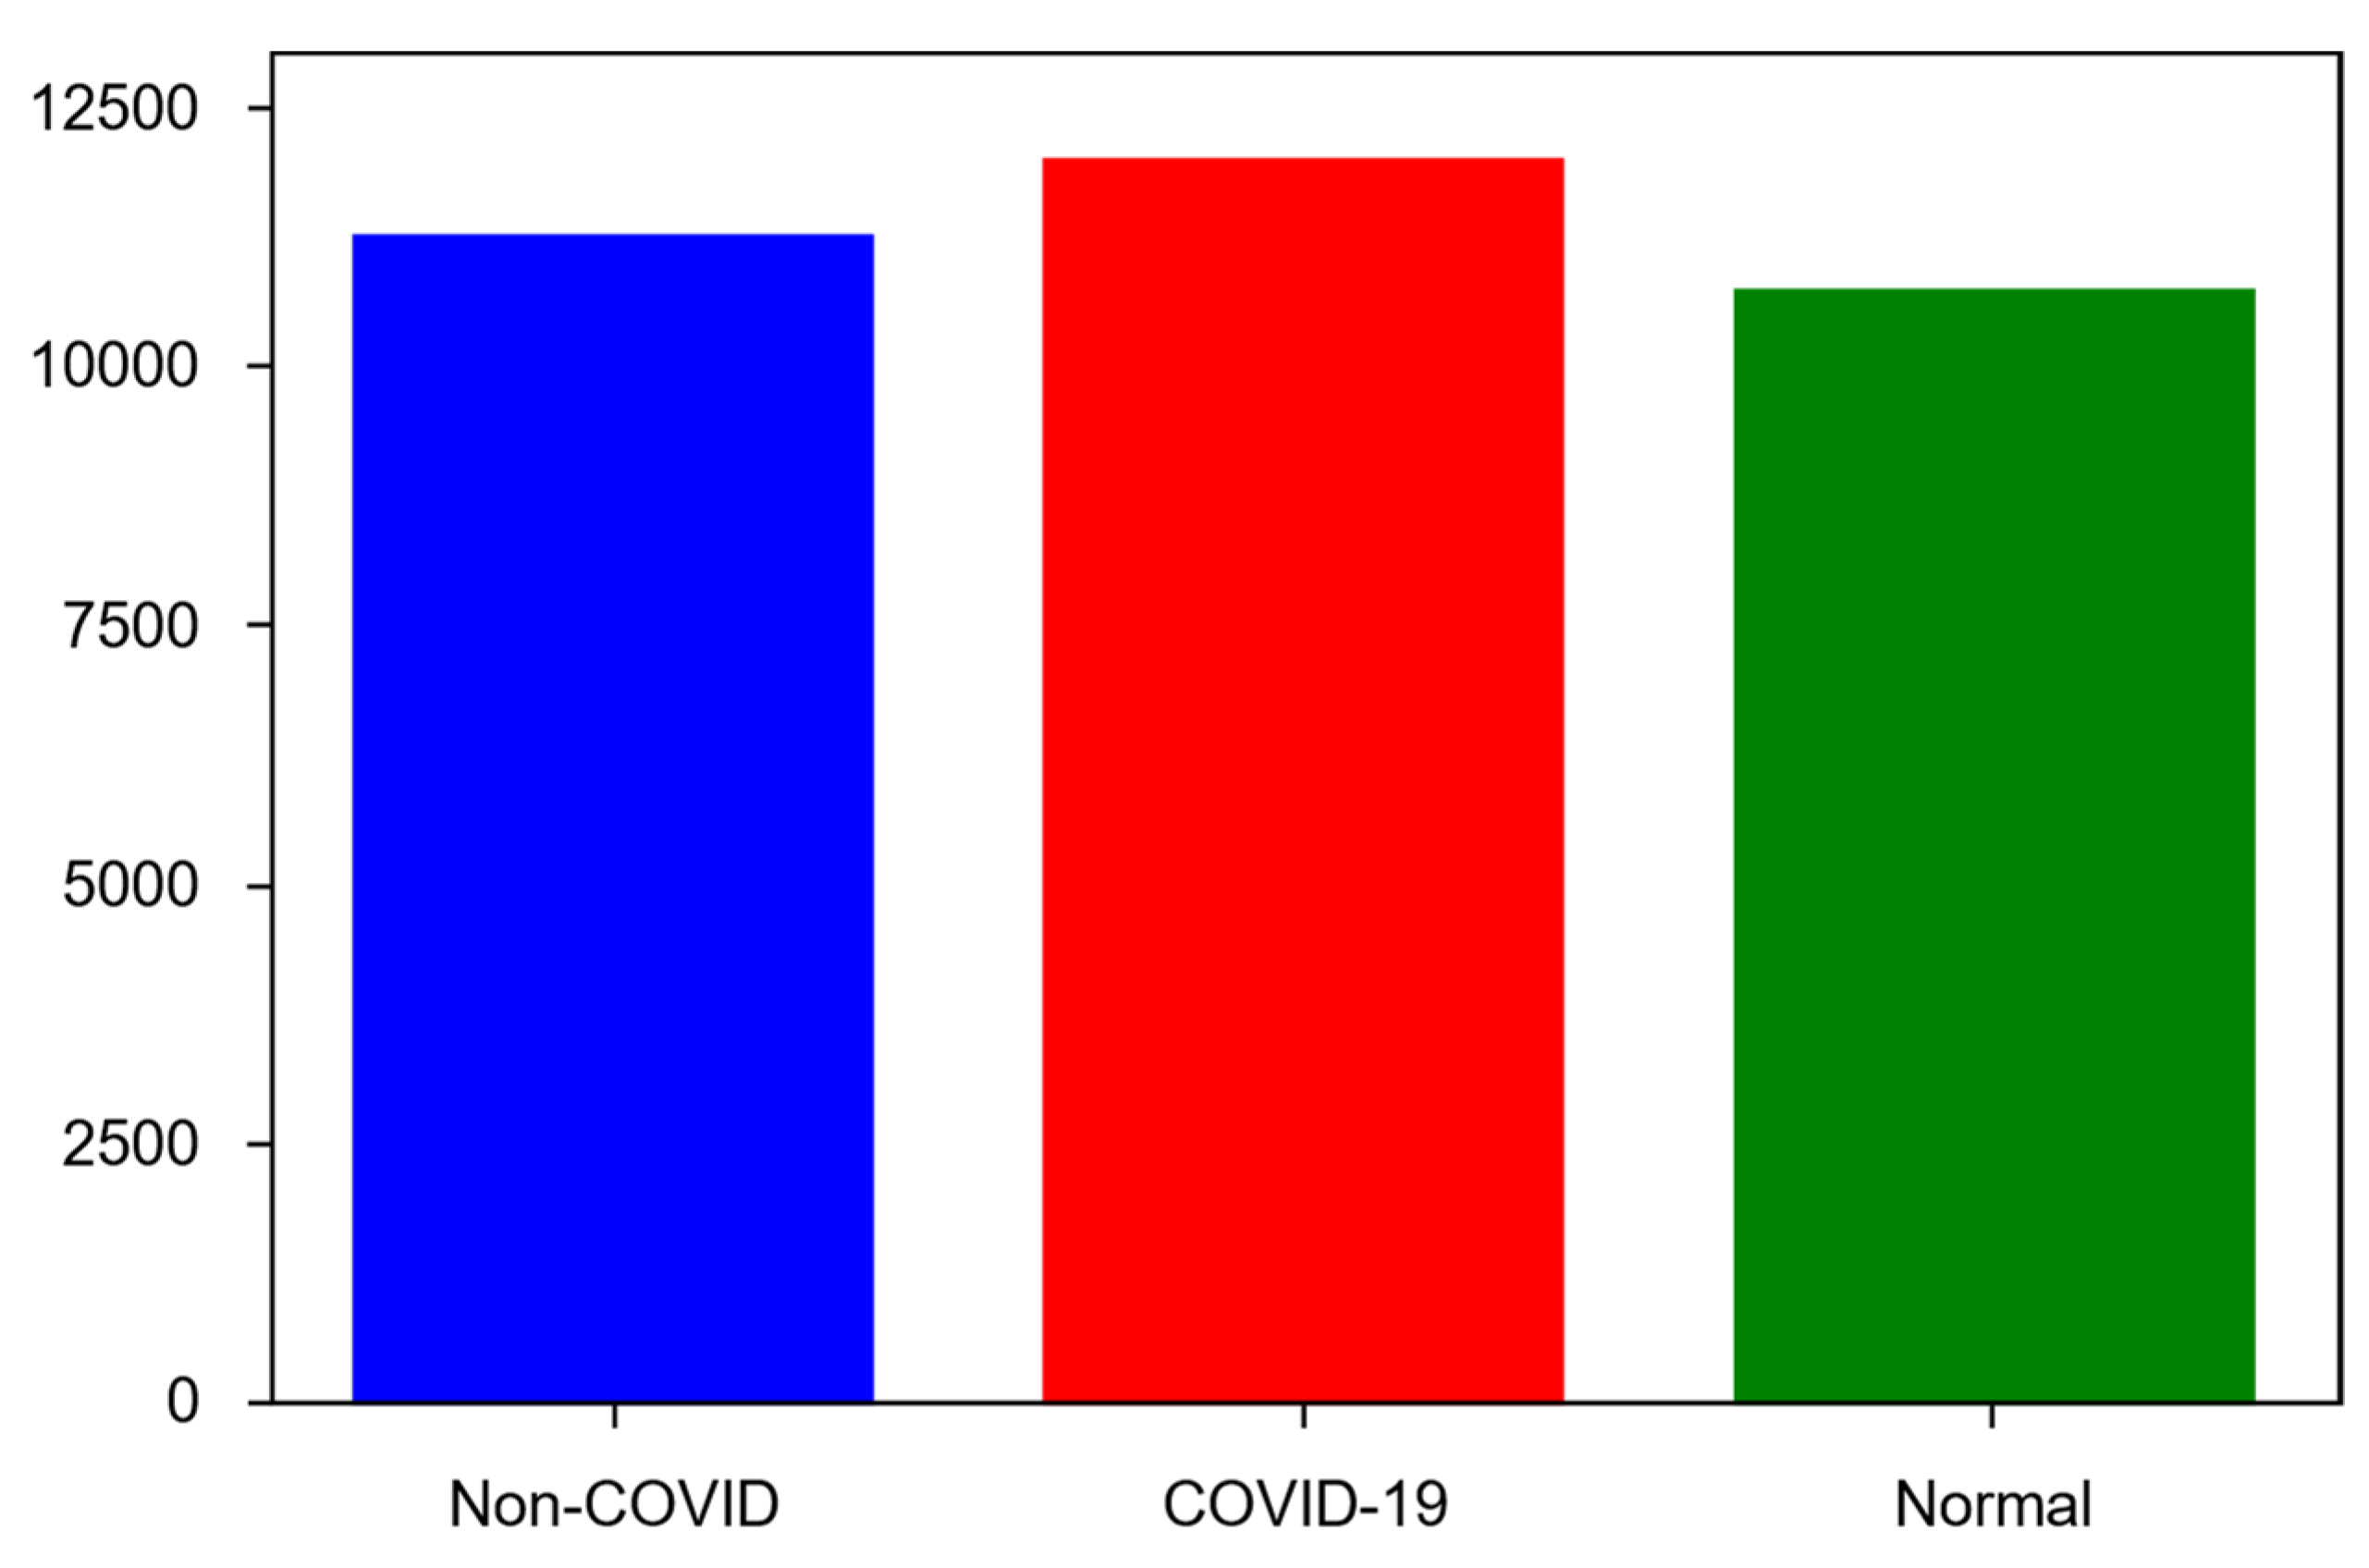
The performance of the models is measured by calculating appropriate error functions. In this work, we used confusion matrix, classification accuracy, true positive rate, false positive rate, receiver operating characteristic (ROC) curve to evaluate the results and compare the performance of the models. The equations for accuracy, true positive rate (TPR), and false positive rate (FPR) are given as follows:
Acc   ( % ) = T P + T N T P + F P + T N + F N × 100 %
TPR = T P T P + F N  
FPR = F P F P + T N  
Precision = T P F P + T P  
where TP, TN, FP, and FN denote true positives, true negatives, false positives, and false negatives, respectively.

4.2. Dataset

The COVID-QU-Ex dataset was collected by the researchers of Qatar University and contains 33,920 chest X-ray images with the following class distribution:
  • COVID-19—11,956 samples;
  • Non-COVID infections (viral or bacterial pneumonia)—11,263 samples;
  • Normal (uninfected)—10,701 samples.
As shown in Figure 4, the dataset is fairly balanced, therefore conducting exploratory data analysis or data augmentation for data balancing is not necessary on the dataset Moreover, DL models used in this research work, VGG19 and ResNet50, are capable of handling small class imbalance very well. Non-COVID infection cases represent 33% of the whole dataset, COVID-19 cases represent 35% of the dataset, and normal (healthy) cases represent 32% of the dataset Figure 5 presents samples from each class for comparison, where each class sample is randomly selected from the dataset Table 1 shows the summary of dataset training, validation, and test splits.
As shown in Table 1, there are 21,715 training X-ray images, 5417 validation images, and 6788 test images. Validation images are used to validate the model performance during training and test images are used to evaluate the performance of the final models. Test images are not used during training in any way for a fair evaluation of the model performance.

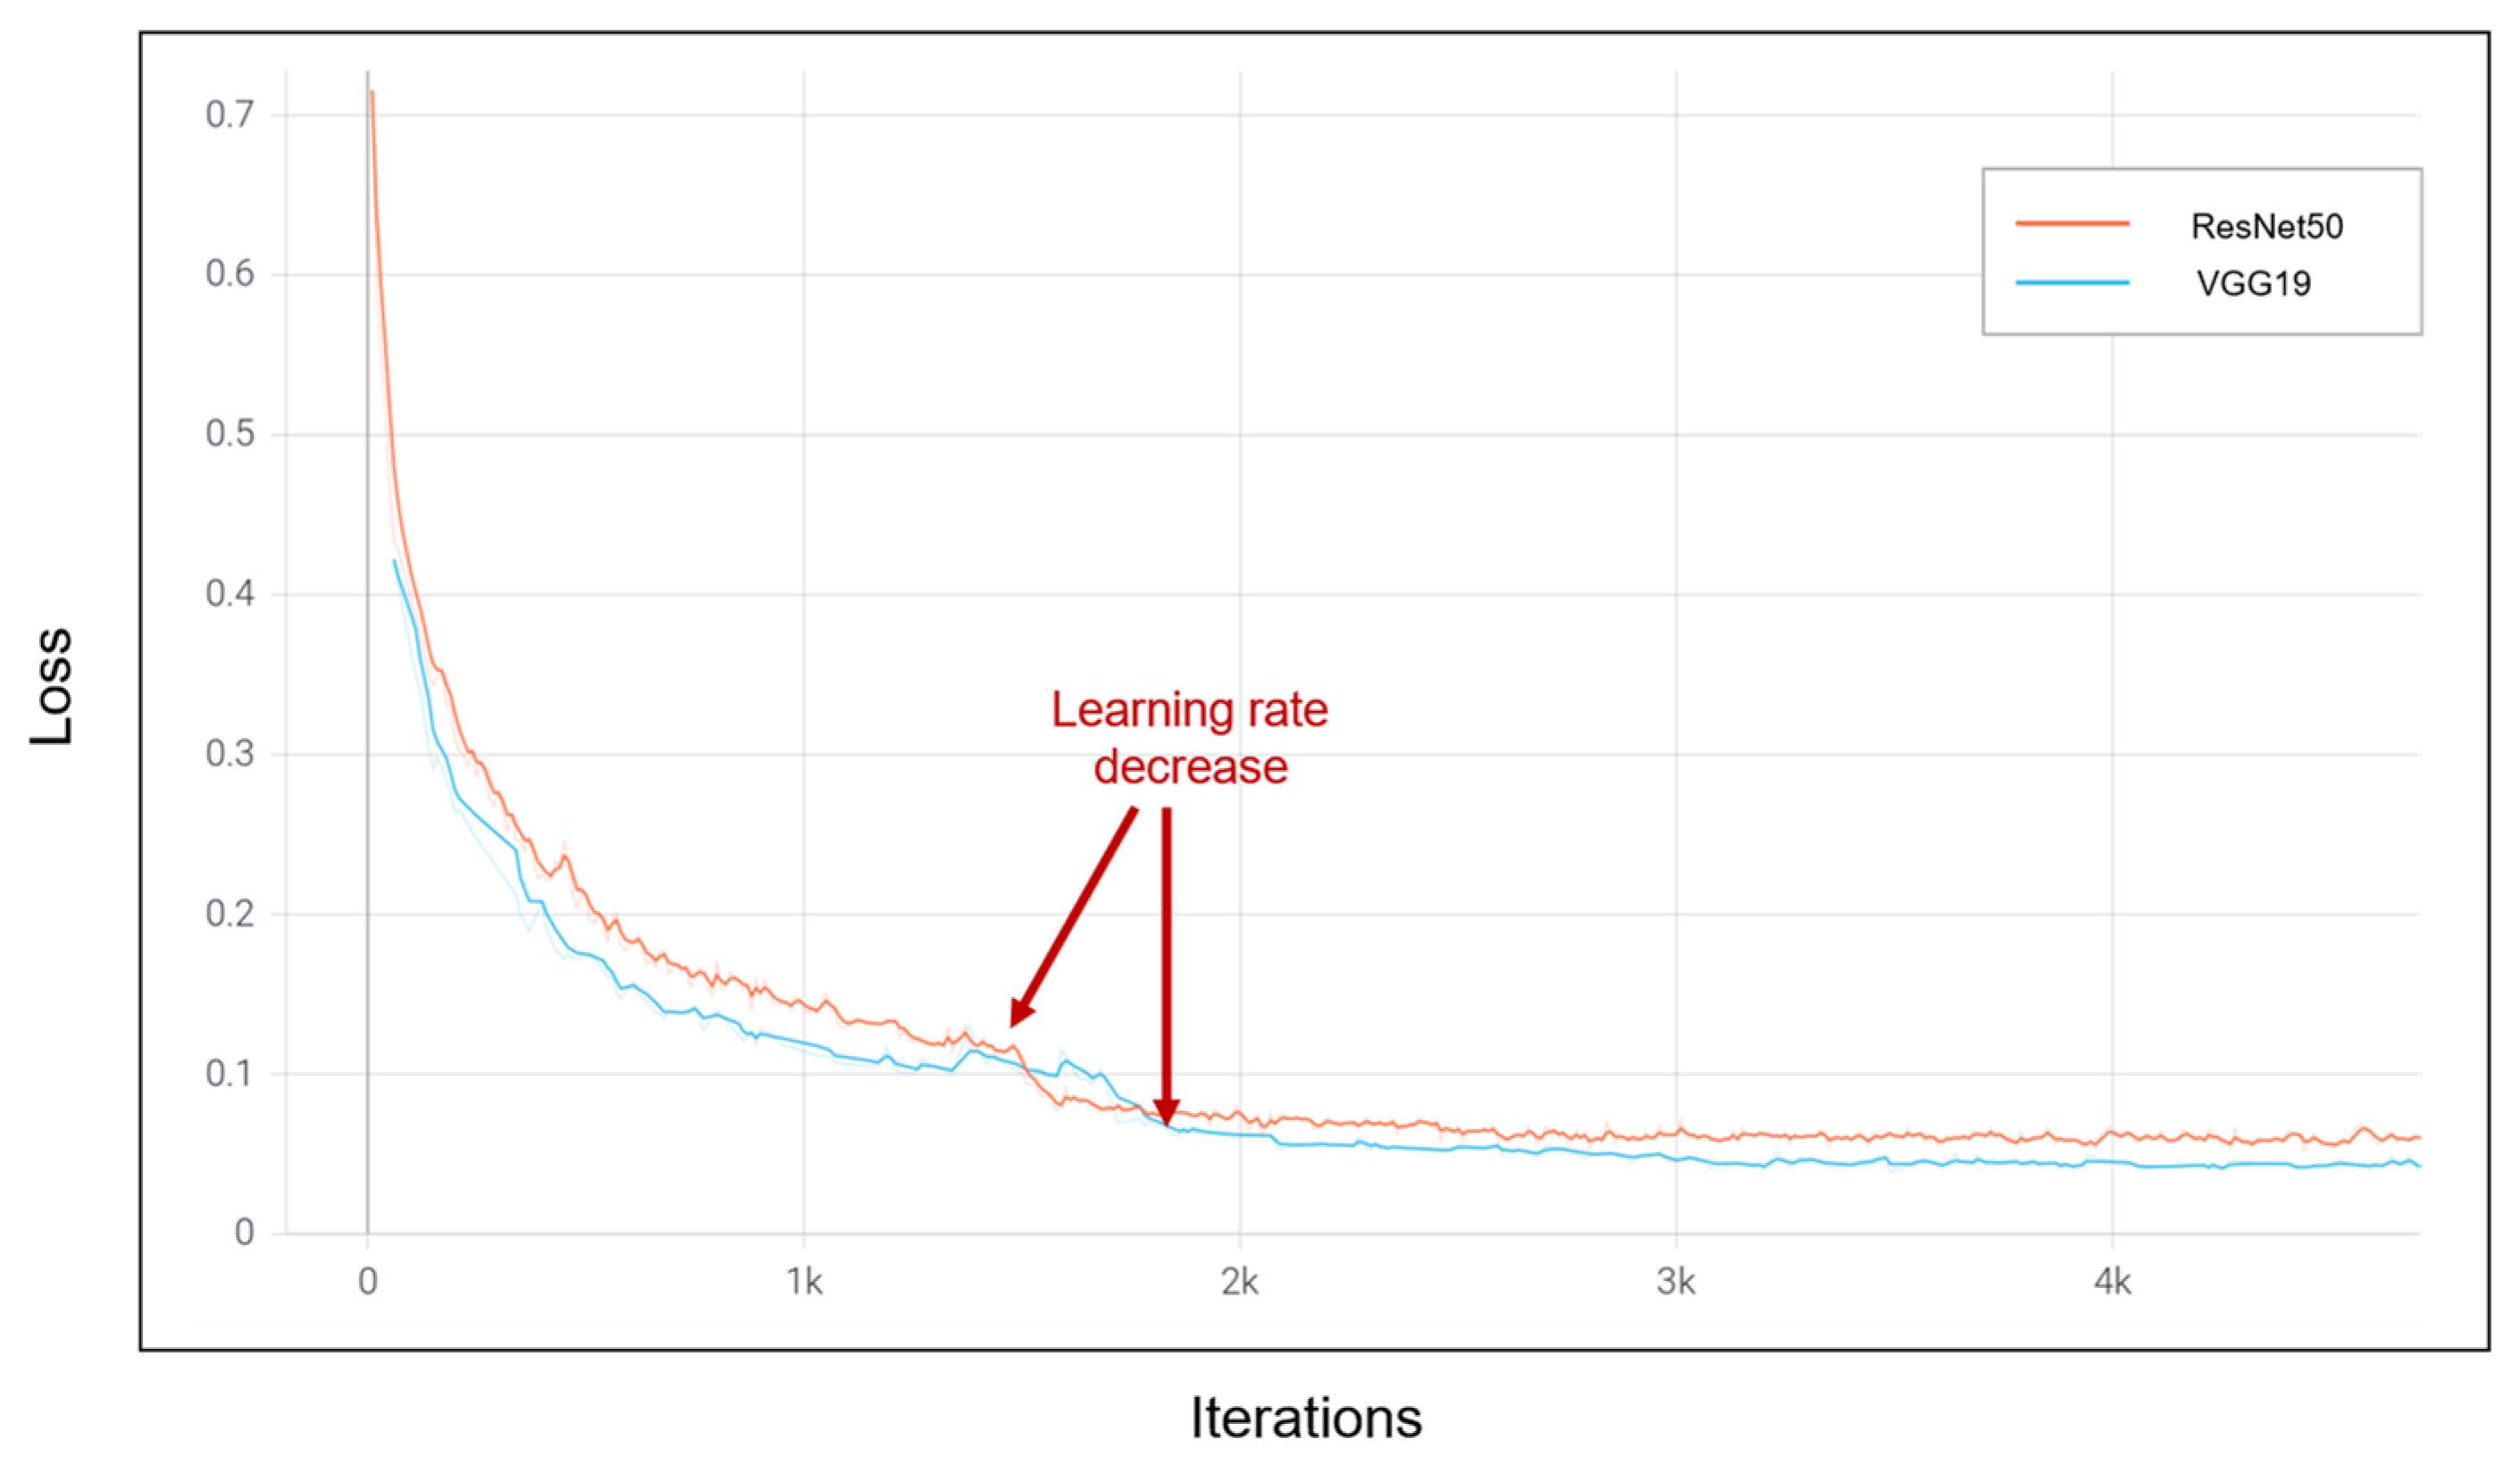
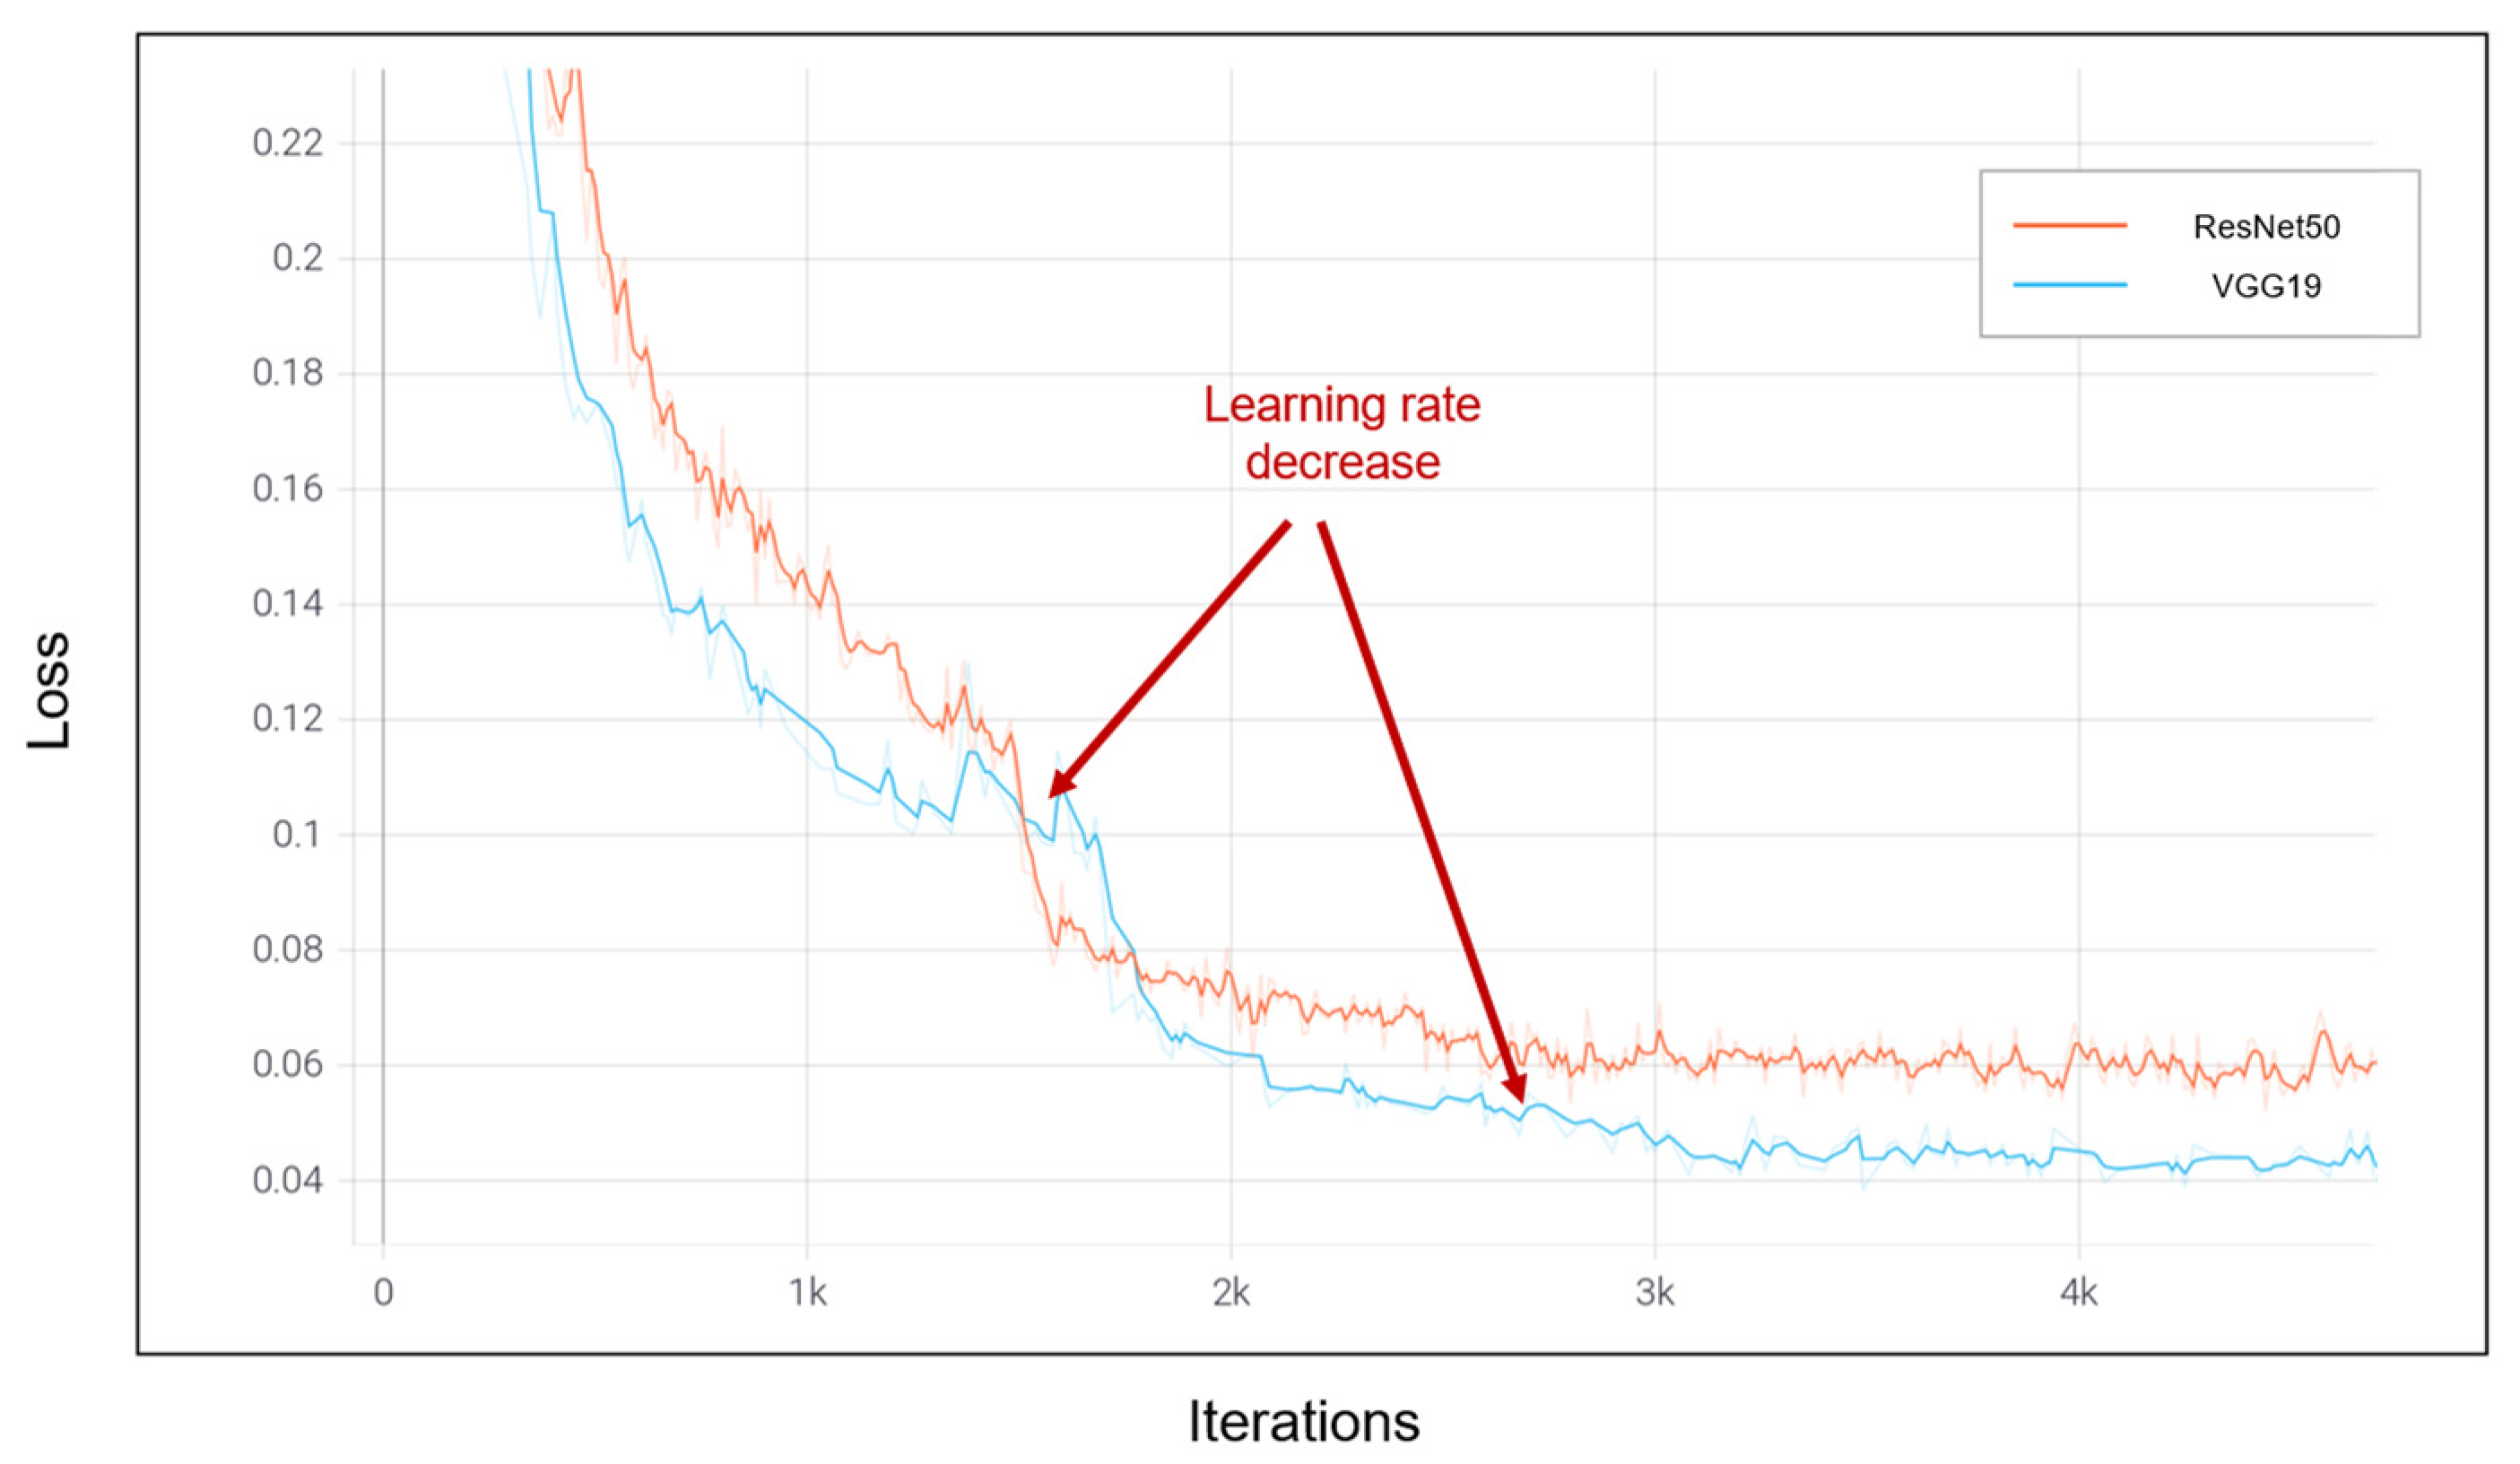
4.3. Numerical Results

This section presents experiment results and findings on two selected network architectures: VGG19 and ResNet50 due to their prior success in similar datasets in the literature. Both networks are trained for 180 epochs using transfer learning and parallel computing mechanisms explained in the previous section. For fairness, we trained models for the same epochs using the same data preprocessing steps and training data. The best model is saved at a certain iteration when it achieves the best results on the validation dataset. Among all saved models, the best model is selected to perform tests. In the experiments, we omit the ablation studies on how parallel computing accelerates the training time since it has already been validated and justified in the literature. Moreover, the purpose of employing a parallel computing technique is to avoid training the model using one node. Additionally, in order to show the improvements, the models need to be trained in the serial method, which takes about 50–60% longer time [50].
Firstly, we analyze the training accuracy and training loss of VGG19 and ResNet50 models. Figure 6 shows the accuracy plots for VGG19 and ResNet50 models. In the COVID-QU-Ex dataset, VGG19 outperformed the ResNet50 model with better training convergence. Figure 7 shows a scaled version of the same training plots for better readability. In both figures, the x-axis denotes the iteration of the training and the y-axis denotes accuracy. We used iterations instead of epochs as the model can improve within the duration of the epoch.
The VGG19 model achieved the best training accuracy of 98.75%, whereas ResNet50 achieved 98.02%. In the plots, sudden jumps highlighted in red refer to the learning rate decrease. In our proposed CAD model, the learning rate is decreased by a factor of 10 if the model does not improve accuracy for a while. The learning rate change plots for VGG19 and ResNet50 models are shown in Figure 8, where the learning rate for both models decreased three times. However, the learning rate for ResNet50 decreased earlier, which indicates that the VGG19 model improved for more iterations compared to ResNet50. This can also be seen in the training accuracy plots, where the convergence of VGG19 is better than ResNet50.
Figure 9 and Figure 10 show training loss plots and scaled training loss plots for both models, respectively. Similar to previous plots, sudden jumping points are highlighted in red. From the figures, it is seen that the loss of VGG19 decreased more than the ResNet50 model, which is intuitive given that the accuracy plot of VGG19 showed better convergence in contrast to the ResNet50 model.
Next, we evaluate the performance of each model using a confusion matrix and ROC curves using a total of 6788 test X-ray images. Looking at the training accuracy plots and loss plots, it is hard to determine which model performs better on the test data. Figure 11 and Figure 12 show the confusion matrix and ROC curves for the VGG19 model on the test dataset, respectively. The model correctly classified 97.2% of COVID-19 test samples, 96.7% of non-COVID pneumonia test samples, and 95.9% of normal (uninfected) test samples, achieving 96.6% of average classification accuracy across all three classes. Unusually, the VGG19 model wrongly classified 82 normal cases as non-COVID pneumonia infections and only 4 cases as COVID-19. 74 cases of non-COVID pneumonia cases were misclassified, where 53 of these cases were classified as normal and 21 cases were classified as COVID-19. Similarly, 68 cases of COVID-19 were misclassified, of which 31 of them were classified as normal and 37 cases were classified as non-COVID infections. In general, among all these three classes, the rate of misclassification as COVID-19 is very low which indicates a high precision score of 0.99 for COVID-19. This can also be supported by the ROC curve shown in Figure 12. The area under the curve (AUC) score for COVID-19 is higher than the rest of the classes with a score of 0.98. In comparison, an AUC score of non-COVID pneumonia and normal cases showed 0.97 each.
Additionally, for all classes, lines in the ROC curve are fairly straight and the turning corners are sharp. This indicates that the model not only correctly classifies the test images but also does it with high confidence scores (e.g., close to 1 when positive, close to 0 when negative). In comparison to precision scores, the advantage of the ROC curve is that it maps true positive rate to the false positive rate. The performance of the VGG19 network validates that the DL-based CAD model can identify the difference between COVID-19, non-COVID viral or bacterial pneumonia, and healthy cases well with high performance.
In the next experiment, we evaluate the performance of the ResNet50 model using 6788 test X-ray images. Figure 13 and Figure 14 show a confusion matrix and ROC curves for the ResNet50 model on the test dataset, respectively. From Figure 13, it is seen that the model correctly classified 96.6% of COVID-19 test samples, 95.4% of non-COVID pneumonia test samples, and 95.5% of normal (uninfected) test samples, achieving 95.8% of average classification accuracy across all classes, which is 0.8% lower than the average classification accuracy of VGG19 model. Similar to the VGG19 model, the rate of misclassification as COVID-19 in the ResNet50 model is very low which indicates a high precision score of 0.99 for COVID-19 (the same as VGG19). In comparison to VGG19′s 74 cases, 104 cases of non-COVID pneumonia were misclassified, where 86 of these cases were classified as normal and 18 cases were classified as COVID-19. Although the number of misclassifications is higher in total, in ResNet50, fewer cases of non-COVID infections were misclassified as COVID-19. A total of 81 cases of COVID-19 were misclassified, of which 49 of them were classified as normal and 32 cases were classified as non-COVID infections. Moreover, the lines in the ROC curve shown in Figure 14 are not as straight as those of VGG19 which indicates that the confidence scores for the predictions are lower than that of VGG19. This means, VGG19 not only outperforms ResNet50 in terms of accuracy of correct classification but also does it with higher confidence.
Even though ResNet50 results fall short in comparison to the performance of the VGG19 network, ResNet50 still shows great results in classifying test images into COVID-19, non-COVID viral or bacterial pneumonia, and healthy cases, achieving 95.8% of average classification accuracy across all classes.

5. Comparison and Discussion

Table 2 shows the comparison between our proposed models and the existing works in the literature. The study reference, datasets used (with the number of classes and the sample size), the proposed methodology/model, and the reported accuracies are presented in the table. In this study, we achieved 96.6% test accuracy with the VGG19 model across three classes. In Table 2, we only listed related work with more than 1000 images used in their studies, except the study conducted by [42]. This is because Oh et al. [42] used four classes in total. There is another study [37] that used four classes (normal, pneumonia, lung opacity, and COVID-19). Moreover, the study conducted by Brima et al. [37] used a total of 21,165 X-ray images, the second largest dataset in Table 2. They used a total of three models, VGG19, DenseNet121, and ResNet50, in the experiments and achieved 94% test accuracy with the VGG19 network architecture. Wang et al. [45] used the third biggest dataset with 13,962 X-ray samples and achieved 93.3% test accuracy with their COVIDNet model. However, their dataset is not balanced with COVID-19 samples representing only 2.6% of the whole dataset. Ozturk et al. [44] also used a fairly imbalanced dataset and achieved 87% accuracy with their DarkCovidNet model. Narayan et al. [46], Apostolopoulos et al. [43], and Khan et al. [36] achieved classification accuracy higher than our proposed model, with 98%, 98.75%, and 99.38% accuracy, respectively. However, they used small samples of test images to evaluate their model performance. Especially, Khan et al. 28] achieved the best accuracy of 99.38% with only 200 test images belonging to two classes, 100 normal and 100 COVID-19.
Even though our model did not achieve the highest performance in terms of classification accuracy, we believe the proposed methodology in this study has the overall best accuracy. This is because we used the largest datasets with over 33,900 X-ray images that belong to three classes. Additionally, we evaluated the performance of our VGG19 and ResNet50 models using a test-set with over 6780 test samples which is more than the entire dataset size of most of the proposed methods. In comparison to two of the studies with over 10,000 X-ray samples, Wang et al. [45] (with an accuracy of 93.3%) and Brima et al. [37] (with an accuracy of 94%), our model VGG19 showed superior performance with a classification accuracy of 96.6%.
The overall comparison results showed that VGG19 and ResNet50 network architectures are generally best-suited in diagnosing COVID-19 and pneumonia cases using X-ray images, with VGG19 being a little more superior in many research studies. Additionally, these two network architectures are the most selected architectures by other works, followed by various types of Inception and DenseNet network architectures.
Finally, it is seen from the comparison that, generally, DL-based CAD systems can be used to assist radiologists, doctors, and medical experts in the diagnosis of COVID-19-infected pneumonia and other types of viral and bacterial pneumonia, as they (i.e., top-performing models) achieved more than 93% reported accuracy.

6. Conclusions

This paper presented an end-to-end DL-based CAD method to diagnose COVID-19-infected pneumonia. We employed transfer learning and parent–child parallel computing methods to accelerate the training process. Experiment results on VGG19 and ResNet50 network architectures validated the feasibility of employing a DL-based model for the diagnosis of COVID-19 and other viral and bacterial pneumonia using X-ray images. On a large COVID-QU-Ex dataset with 33,920 X-ray samples, the VGG19 model showed superior performance in comparison to ResNet50, with 96.6% average classification accuracy across all three classes. VGG19 model also achieved 0.98 ROC-AUC score for COVID-19 along with 97.2% accuracy and 0.99 precision score. In comparison to the discussed related work, our methodology shows superior performance. Firstly, our experiments are conducted on the largest dataset of 33,920 images (the second largest contains 21,165 images). Additionally, secondly, we obtained an average of 96.6% classification accuracy in comparison to 94% of Brima et al. [37] and 93.3% of Wang et al. [45].
The results show that the proposed DL-based method can be used to assist medical professionals in the diagnosis of pneumonia infected by COVID-19 and other types of viral and bacterial pneumonia. Even though the proposed method showed great performance in the diagnosis of pneumonia using X-ray images, there is room for future improvements. In future work, the performance of diagnosis using MRI and CT scan modalities should be studied and respective experiments should be carried out. Additionally, in this work, parallel computing is applied to only data distribution between child nodes to speed up the training process. In the future, both data-distributed and model-distributed computing mechanisms should be implemented to further accelerate the training. Lastly, most existing research studies (including this study) used VGG19 and ResNet50 networks. In the future, more customized network architectures (specially designed for X-ray images) should be studied.

Author Contributions

Conceptualization, B.I. and J.-Y.K.; methodology, B.I.; validation, B.I.; formal analysis, B.I. and J.-Y.K.; investigation, B.I.; resources, J.-Y.K.; data curation, B.I.; writing—original draft preparation, B.I.; writing—review and editing, B.I. and J.-Y.K.; visualization, B.I.; project administration, B.I. and J.-Y.K.; funding acquisition, J.-Y.K. All authors have read and agreed to the published version of the manuscript.

Funding

This research received no external funding.

Institutional Review Board Statement

Not applicable.

Informed Consent Statement

Informed consent was obtained from all subjects involved in the study.

Data Availability Statement

Publicly available dataset is used in this study. The dataset can be found here: https://www.kaggle.com/datasets/anasmohammedtahir/covidqu (accessed on 14 November 2022).

Conflicts of Interest

The authors declare no conflict of interest.

References

  1. COVID-19 Worldwide Statistics. Available online: https://www.worldometers.info/coronavirus/ (accessed on 14 November 2022).
  2. Coronavirus and Pneumonia. Available online: https://www.webmd.com/lung/covid-and-pneumonia#1 (accessed on 14 November 2022).
  3. Gray, D.; Willemse, L.; Visagie, A.; Czövek, D.; Nduru, P.; Vanker, A.; Zar, H.J. Determinants of early-life lung function in African infants. Thorax 2017, 72, 445–450. [Google Scholar] [CrossRef] [PubMed] [Green Version]
  4. Chan, J.Y.; Stern, D.A.; Guerra, S.; Wright, A.L.; Morgan, W.J.; Martinez, F.D. Pneumonia in childhood and impaired lung function in adults: A longitudinal study. Pediatrics 2015, 135, 607–616. [Google Scholar] [CrossRef] [PubMed] [Green Version]
  5. Cecilie, S.; Sunyer, J.; Plana, E.; Dharmage, S.; Heinrich, J.; Jarvis, D.; de Marco, R. Early life origins of chronic obstructive pulmonary disease. Thorax 2010, 65, 14–20. [Google Scholar]
  6. Zar, H.J.; Andronikou, S.; Nicol, M.P. Advances in the diagnosis of pneumonia in children. BMJ 2017, 358, j2739. [Google Scholar] [CrossRef]
  7. Iuri, D.; De Candia, A.; Bazzocchi, M. Evaluation of the lung in children with suspected pneumonia: Usefulness of ultrasonography. La Radiol. Med. 2009, 114, 321–330. [Google Scholar] [CrossRef] [PubMed]
  8. Tomà, P.; Owens, C.M. Chest ultrasound in children: Critical appraisal. Pediatr. Radiol. 2013, 43, 1427–1434. [Google Scholar] [CrossRef]
  9. Shah, V.P.; Tunik, M.G.; Tsung, J.W. Prospective evaluation of point-of-care ultrasonography for the diagnosis of pneumonia in children and young adults. JAMA Pediatr. 2013, 167, 119–125. [Google Scholar] [CrossRef] [PubMed] [Green Version]
  10. Gorycki, T.; Lasek, I.; Kamiński, K.; Studniarek, M. Evaluation of radiation doses delivered in different chest CT protocols. Pol. J. Radiol. 2014, 79, 1. [Google Scholar]
  11. Sodhi, K.S.; Khandelwal, N.; Saxena, A.K.; Singh, M.; Agarwal, R.; Bhatia, A.; Lee, E.Y. Rapid lung MRI in children with pulmonary infections: Time to change our diagnostic algorithms. J. Magn. Reson. Imaging 2016, 43, 1196–1206. [Google Scholar] [CrossRef]
  12. Biederer, J.; Mirsadraee, S.; Beer, M.; Molinari, F.; Hintze, C.; Bauman, G.; Puderbach, M. MRI of the lung (3/3)—Current applications and future perspectives. Insights Imaging 2012, 3, 373–386. [Google Scholar] [CrossRef] [Green Version]
  13. Hirsch, W.; Sorge, I.; Krohmer, S.; Weber, D.; Meier, K.; Till, H. MRI of the lungs in children. Eur. J. Radiol. 2008, 68, 278–288. [Google Scholar] [CrossRef] [PubMed]
  14. Boiselle, P.M.; Biederer, J.; Gefter, W.B.; Lee, E.Y. Expert opinion: Why is MRI still an under-utilized modality for evaluating thoracic disorders? J. Thorac. Imaging 2013, 28, 137. [Google Scholar] [CrossRef] [PubMed]
  15. Aboutalib, S.S.; Mohamed, A.A.; Berg, W.A.; Zuley, M.L.; Sumkin, J.H.; Wu, S. Deep learning to distinguish recalled but benign mammography images in breast cancer screening. Clin. Cancer Res. 2018, 24, 5902–5909. [Google Scholar] [CrossRef] [PubMed] [Green Version]
  16. Kim, E.K.; Kim, H.E.; Han, K.; Kang, B.J.; Sohn, Y.M.; Woo, O.H.; Lee, C.W. Applying data-driven imaging biomarker in mammography for breast cancer screening: Preliminary study. Sci. Rep. 2018, 8, 1–8. [Google Scholar] [CrossRef] [Green Version]
  17. Shariaty, F.; Mousavi, M. Application of CAD systems for the automatic detection of lung nodules. Inform. Med. Unlocked 2019, 15, 100173. [Google Scholar] [CrossRef]
  18. Gu, Y.; Chi, J.; Liu, J.; Yang, L.; Zhang, B.; Yu, D.; Lu, X. A survey of computer-aided diagnosis of lung nodules from CT scans using deep learning. Comput. Biol. Med. 2021, 137, 104806. [Google Scholar] [CrossRef]
  19. Balyen, L.; Peto, T. Promising artificial intelligence-machine learning-deep learning algorithms in ophthalmology. Asia-Pac. J. Ophthalmol. 2019, 8, 264–272. [Google Scholar]
  20. Kumar, A.; Fulham, M.; Feng, D.; Kim, J. Co-learning feature fusion maps from PET-CT images of lung cancer. IEEE Trans. Med. Imaging 2019, 39, 204–217. [Google Scholar] [CrossRef] [Green Version]
  21. Podnar, S.; Kukar, M.; Gunčar, G.; Notar, M.; Gošnjak, N.; Notar, M. Diagnosing brain tumours by routine blood tests using machine learning. Sci. Rep. 2019, 9, 1–7. [Google Scholar] [CrossRef] [Green Version]
  22. Esteva, A.; Kuprel, B.; Novoa, R.A.; Ko, J.; Swetter, S.M.; Blau, H.M.; Thrun, S. Dermatologist-level classification of skin cancer with deep neural networks. Nature 2017, 542, 115–118. [Google Scholar] [CrossRef]
  23. Ibrokhimov, B.; Kang, J.Y. Two-Stage Deep Learning Method for Breast Cancer Detection Using High-Resolution Mammogram Images. Appl. Sci. 2022, 12, 4616. [Google Scholar] [CrossRef]
  24. Roy, S.; Meena, T.; Lim, S.J. Demystifying Supervised Learning in Healthcare 4.0: A New Reality of Transforming Diagnostic Medicine. Diagnostics 2022, 12, 2549. [Google Scholar] [CrossRef] [PubMed]
  25. Meena, T.; Roy, S. Bone fracture detection using deep supervised learning from radiological images: A paradigm shift. Diagnostics 2022, 12, 2420. [Google Scholar] [CrossRef]
  26. Pal, D.; Reddy, P.B.; Roy, S. Attention UW-Net: A fully connected model for automatic segmentation and annotation of chest X-ray. Comput. Biol. Med. 2022, 150, 106083. [Google Scholar] [CrossRef]
  27. Gunjan, V.K.; Singh, N.; Shaik, F.; Roy, S. Detection of lung cancer in CT scans using grey wolf optimization algorithm and recurrent neural network. Health Technol. 2022, 12, 1197–1210. [Google Scholar] [CrossRef]
  28. Gangopadhyay, T.; Halder, S.; Dasgupta, P.; Chatterjee, K.; Ganguly, D.; Sarkar, S.; Roy, S. MTSE U-Net: An architecture for segmentation, and prediction of fetal brain and gestational age from MRI of brain. Netw. Model. Anal. Health Inform. Bioinform. 2022, 11, 1–14. [Google Scholar] [CrossRef]
  29. Tomaszewski, M.R.; Gillies, R.J. The biological meaning of radiomic features. Radiology 2021, 298, 505–516. [Google Scholar] [CrossRef]
  30. Mediouni, M.; Madiouni, R.; Gardner, M.; Vaughan, N. Translational medicine: Challenges and new orthopaedic vision (Mediouni-Model). Curr. Orthop. Pract. 2020, 31, 196–200. [Google Scholar] [CrossRef]
  31. Mediouni, M.; RSchlatterer, D.; Madry, H.; Cucchiarini, M.; Rai, B. A review of translational medicine. The future paradigm: How can we connect the orthopedic dots better? Curr. Med. Res. Opin. 2018, 34, 1217–1229. [Google Scholar] [CrossRef]
  32. Rodriguez-Ruiz, A.; Lång, K.; Gubern-Merida, A.; Broeders, M.; Gennaro, G.; Clauser, P.; Sechopoulos, I. Stand-alone artificial intelligence for breast cancer detection in mammography: Comparison with 101 radiologists. JNCI J. Natl. Cancer Inst. 2019, 111, 916–922. [Google Scholar] [CrossRef]
  33. Shen, L.; Margolies, L.R.; Rothstein, J.H.; Fluder, E.; McBride, R.; Sieh, W. Deep learning to improve breast cancer detection on screening mammography. Sci. Rep. 2019, 9, 1–12. [Google Scholar] [CrossRef] [Green Version]
  34. Latif, S.; Usman, M.; Manzoor, S.; Iqbal, W.; Qadir, J.; Tyson, G.; Crowcroft, J. Leveraging data science to combat COVID-19: A comprehensive review. IEEE Trans. Artif. Intell. 2020, 1, 85–103. [Google Scholar] [CrossRef]
  35. Swapnarekha, H.; Behera, H.S.; Nayak, J.; Naik, B. Role of intelligent computing in COVID-19 prognosis: A state-of-the-art review. Chaos Solitons Fractals 2020, 138, 109947. [Google Scholar] [CrossRef] [PubMed]
  36. Khan, I.U.; Aslam, N. A deep-learning-based framework for automated diagnosis of COVID-19 using X-ray images. Information 2020, 11, 419. [Google Scholar] [CrossRef]
  37. Brima, Y.; Atemkeng, M.; Tankio Djiokap, S.; Ebiele, J.; Tchakounté, F. Transfer Learning for the Detection and Diagnosis of Types of Pneumonia including Pneumonia Induced by COVID-19 from Chest X-ray Images. Diagnostics 2021, 11, 1480. [Google Scholar] [CrossRef]
  38. Narin, A.; Kaya, C.; Pamuk, Z. Automatic detection of coronavirus disease (covid-19) using x-ray images and deep convolutional neural networks. Pattern Anal. Appl. 2021, 24, 1207–1220. [Google Scholar] [CrossRef]
  39. Minaee, S.; Kafieh, R.; Sonka, M.; Yazdani, S.; Soufi, G.J. Deep-COVID: Predicting COVID-19 from chest X-ray images using deep transfer learning. Med. Image Anal. 2020, 65, 101794. [Google Scholar] [CrossRef]
  40. Hemdan EE, D.; Shouman, M.A.; Karar, M.E. Covidx-net: A framework of deep learning classifiers to diagnose covid-19 in x-ray images. arXiv 2020, arXiv:2003.11055. [Google Scholar]
  41. Sethy, P.K.; Behera, S.K. Detection of Coronavirus Disease (COVID-19) Based on Deep Features; Preprints 2020, 2020030300. Available online: https://www.preprints.org/manuscript/202003.0300/v1 (accessed on 13 November 2022).
  42. Oh, Y.; Park, S.; Ye, J.C. Deep learning COVID-19 features on CXR using limited training data sets. IEEE Trans. Med. Imaging 2020, 39, 2688–2700. [Google Scholar] [CrossRef]
  43. Apostolopoulos, I.D.; Mpesiana, T.A. Covid-19: Automatic detection from x-ray images utilizing transfer learning with convolutional neural networks. Phys. Eng. Sci. Med. 2020, 43, 635–640. [Google Scholar] [CrossRef] [Green Version]
  44. Ozturk, T.; Talo, M.; Yildirim, E.A.; Baloglu, U.B.; Yildirim, O.; Acharya, U.R. Automated detection of COVID-19 cases using deep neural networks with X-ray images. Comput. Biol. Med. 2020, 121, 103792. [Google Scholar] [CrossRef] [PubMed]
  45. Wang, J.; Peng, Y.; Xu, H.; Cui, Z.; Williams, R.O. The COVID-19 vaccine race: Challenges and opportunities in vaccine formulation. AAPS PharmSciTech 2020, 21, 1–12. [Google Scholar] [CrossRef] [PubMed]
  46. Narayanan, B.N.; Hardie, R.C.; Krishnaraja, V.; Karam, C.; Davuluru VS, P. Transfer-to-transfer learning approach for computer aided detection of COVID-19 in chest radiographs. AI 2020, 1, 539–557. [Google Scholar] [CrossRef]
  47. Tahir, A.M.; Chowdhury, M.E.; Khandakar, A.; Rahman, T.; Qiblawey, Y.; Khurshid, U.; Hamid, T. COVID-19 infection localization and severity grading from chest X-ray images. Comput. Biol. Med. 2021, 139, 105002. [Google Scholar] [CrossRef]
  48. Simonyan, K.; Zisserman, A. Very deep convolutional networks for large-scale image recognition. arXiv 2014, arXiv:1409.1556. [Google Scholar]
  49. He, K.; Zhang, X.; Ren, S.; Sun, J. Deep residual learning for image recognition. In Proceedings of the IEEE Conference on Computer Vision and Pattern Recognition, Las Vegas, NV, USA, 27–30 June 2016; pp. 770–778. [Google Scholar]
  50. Zhao, L.; Zhou, Y.; Lu, H.; Fujita, H. Parallel computing method of deep belief networks and its application to traffic flow prediction. Knowl. -Based Syst. 2019, 163, 972–987. [Google Scholar] [CrossRef]
Figure 1. The overall flowchart of the method. The pretrained ResNet50 or VGG19 model and the target data which are X-ray images are received. Then, new data is generated using data augmentation steps. To speed up the network training, the input dataset is divided into portions and each child node is trained on that data portion. Finally, network parameters are optimized for the target data.
Biomedinformatics 02 00043 g001
Figure 2. Illustration of transfer learning. When the knowledge is transferred from source domain to the target domain, initial layers are frozen and later layers are trained on the target domain data.
Biomedinformatics 02 00043 g002
Figure 3. Illustration of a parent–child parallel computing method. The dataset X is divided into P portions and each child node p trains the model using the sub-dataset it was assigned ( X p ).
Biomedinformatics 02 00043 g003
Figure 4. The distribution of X-ray images per class.
Biomedinformatics 02 00043 g004
Figure 5. Samples from COVID-QU-Ex dataset From left to right: normal, non-COVID infection, COVID-19.
Biomedinformatics 02 00043 g005
Figure 6. Training accuracy plots of VGG19 and ResNet50 models. Sudden jumps highlighted with red arrows refer to the learning rate decrease.
Biomedinformatics 02 00043 g006
Figure 7. A scaled training accuracy plots of VGG19 and ResNet50 models. Sudden jumps highlighted with red arrows refer to the learning rate decrease.
Biomedinformatics 02 00043 g007
Figure 8. Learning rate change plots for VGG19 and ResNet50 models.
Biomedinformatics 02 00043 g008
Figure 9. Training loss plots of VGG19 and ResNet50 models. The red arrows refer to the learning rate decrease which result in sudden change in the loss function.
Biomedinformatics 02 00043 g009
Figure 10. A scaled training loss plots of VGG19 and ResNet50 models. The red arrows refer to the learning rate decrease which result in sudden change in the loss function.
Biomedinformatics 02 00043 g010
Figure 11. Confusion matrix for the VGG19 model on the test dataset.
Biomedinformatics 02 00043 g011
Figure 12. ROC curve for the VGG19 model on the test dataset.
Biomedinformatics 02 00043 g012
Figure 13. Confusion matrix for the ResNet50 model on the test dataset.
Biomedinformatics 02 00043 g013
Figure 14. ROC curve for the ResNet50 model on the test dataset.
Biomedinformatics 02 00043 g014
Table 1. The dataset summary across different classes and train-validation-test splits.
DatasetNormalNon-COVID InfectionsCOVID-19Total
Train68497208765821,715
Validation1712180219035417
Test2140225323956788
Table 2. Comparison of the proposed methodology with the related methods.
StudyDatasetMethodAccuracy
Oh et al. [42]191 Normal
74 Pneumonia
57 Tuberculosis
180 COVID-19
ResNet1888.9%
Ozturk et al. [44]1000 Normal
500 Pneumonia
125 COVID-19
DarkCovidNet87%
Wang et al. [45]8066 Normal
5538 Pneumonia
358 COVID-19
COVIDNet, VGG19,
ResNet50
93.3%
Narayanan et al. [46]1583 Normal
1493 Viral Pneumonia
2780 Bacterial Pneumonia
ResNet50, Inceptionv3,
Xception, DenseNet201
98%
Apostolopoulos et al. [43]504 Normal
714 Pneumonia
224 COVID-19
VGG19, Inception,
Xception, MobileNet
98.75%
Brima et al. [37]10,192 Normal
1345 Pneumonia
6012 Lung opacity
3616 COVID-19
VGG19, DenseNet121,
ResNet50
94%
Khan et al. [36]802 Normal
790 COVID-19
VGG16, VGG1999.38%
Our method10,701 Normal
11,263 Pneumonia
11,956 COVID-19
VGG19, ResNet5096.6%
Publisher’s Note: MDPI stays neutral with regard to jurisdictional claims in published maps and institutional affiliations.

