Article

Predictive Analysis of Endoscope Demand in Otolaryngology Outpatient Settings

1
Lieutenant Colonel Charles S. Kettles VA Medical Center, Ann Arbor, MI 48105, USA
2
Department of Industrial and Systems Engineering, Wayne State University, Detroit, MI 48201, USA
*
Author to whom correspondence should be addressed.
BioMedInformatics 2024, 4(1), 721-732; https://doi.org/10.3390/biomedinformatics4010040
Submission received: 12 December 2023 / Revised: 4 February 2024 / Accepted: 21 February 2024 / Published: 2 March 2024
(This article belongs to the Special Issue Feature Papers in Applied Biomedical Data Science)

Abstract

:
Background: There has been a trend to transit reprocessing of flexible endoscopes from a high-level disinfectant (HLD) centralized manner to sterilization performed by nursing staff in some Ear, Nose, and Throat (ENT) clinics. In doing so, the clinic nursing staff are responsible for predicting and managing clinical demand for flexible endoscopes. The HLD disinfection process is time-consuming and requires specialized training and competency to be performed safely. Solely depending on human expertise for predicting the flexible endoscope demands is unreliable and produced a concern of an inadequate supply of devices available for diagnostic purposes. Method: The demand for flexible endoscopes for future patient visits has not been well studied but can be modeled based on patients’ historical information, provider, and other visit-related factors. Such factors are available to the clinic before the visit. Binary classifiers can be used to help inform the sterile processing department of reprocessing needs days or weeks earlier for each patient. Results: Among all our trained models, Logistic Regression reports an average AUC ROC score of 89% and accuracy of 80%. Conclusion: The proposed framework not only significantly reduces the reprocessing efforts in terms of time spent on communication, cleaning, scheduling, and transferring scopes, but also helps to improve patient safety by reducing the exposure risk to potential infections.

1. Introduction

Efficient endoscope (scope) reprocessing is crucial in healthcare, safeguarding patient safety by preventing infections and ensuring the reliability of diagnostic and therapeutic procedures. It underscores the commitment of healthcare facilities to deliver safe and effective care. Flexible endoscope procedures, particularly Nasopharyngoscopy, are commonly conducted in clinics using reusable medical devices (RMD) categorized as such by manufacturers. These scopes necessitate high-level disinfection or sterilization after each use, as outlined in the manufacturer’s instructions. A crucial step involves immediate manual pre-cleaning post-procedure at the point of use to eliminate organic material and prevent the formation of bacterial biofilm, which could resist subsequent disinfection and sterilization. Reprocessing decisions are facility-driven, influenced by factors such as space availability, processing time, staff competency, overall cost, and the remaining useful life of the device. High-level disinfection is favored for its cost-effectiveness compared to sterilization, which demands more intricate equipment, materials, and time. Estimated between $22 k to $40 k, the cost of one scope aligns with its useful life of 100 cleaning and disinfecting cycles under high-level disinfection or sterilization conditions, subject to variations based on handling and maintenance practices [1].
Several factors influence the selection of disinfection processes for scopes, encompassing considerations such as the scope’s design and its resilience to disinfectant chemicals or sterilization, the assessment of associated reprocessing risks, and the potential for disease transmission. Additionally, operational demands may play a role in determining the appropriate reprocessing procedure.
Tasking clinic nurses with non-direct patient care activities and provider support could have adverse effects on the clinic’s overall performance. Nursing leadership has identified the reprocessing of RMD as a significant contributor to non-value-added time, with the industry average for scope reprocessing being 76 min [1]. The typical in-clinic scope reprocessing procedure follows a dirty-to-clean workflow, where scopes undergo pre-cleaning with a solution at the point of use before being transported to a soiled utility room for reprocessing. Upon arrival in the utility room, adherence to manufacturers’ instructions necessitates completing the reprocessing within 60 min, involving 33 steps. This process includes nurses donning specific personal protective equipment (PPE), such as specialized gloves, gowns, face and eye protection, and footwear.
While utilizing a centralized shared service, such as a Sterile Processing department, to reprocess scopes for the ENT clinic could be a potential solution, these services typically prioritize high-reprocess demands like Surgical services. Transitioning the reprocessing responsibility to the clinics ensures that scope reprocessing receives prioritized attention, enhancing patient access, a crucial metric for outpatient clinics. Patient access directly influences the flow and effectiveness of outpatient ENT clinics, with proper equipment availability in examination rooms playing a pivotal role. The “Choice” act of 2014, enacted in response to a healthcare wait time scandal, highlights the imperative for prompt access to care. The Centers for Medicare & Medicaid Services (CMS) also underscores the critical nature of healthcare access, emphasizing its role in preventing unmet health needs, delays in care, financial burdens, and avoidable hospitalizations [2,3].
This study introduces a binary classification framework designed to predict the necessity of endoscope usage during a medical visit. Implementing this framework empowers reprocessing staff at medical centers to anticipate scope requirements, ensuring timely availability for providers, streamlining patient care in outpatient clinics, and mitigating access barriers to clinic services. The remainder of the paper is organized as follows: Section 2 reviews existing literature on utilizing data science for decision support tools in healthcare and ENT. Section 3 details our proposed framework, while Section 4 presents our findings. Finally, Section 5 concludes the study.

2. Literature Review

In the healthcare sector, Machine Learning (ML) finds application across diverse areas, encompassing disease diagnosis [4,5,6,7], patient management [8,9,10,11], and administrative tasks [12,13,14,15]. In the realm of diagnosis, ML contributes to the analysis of medical images, including X-rays [16,17], MRIs [18,19,20], and CT scans [21,22], facilitating early disease detection. Predictive analytics by ML extends to forecasting health risks [23], readmission probabilities [24], and anticipating disease outbreaks [25]. ML also aids in electronic health records management through data mining [26] and natural language processing, enhancing overall patient care [27]. In drug discovery, ML identifies potential drug candidates and optimizes clinical trial processes [28,29]. Its applications extend to personalizing treatments and ensuring medication adherence [30], improving telemedicine and remote patient monitoring [31], and detecting healthcare fraud [32]. Specifically, ML plays a crucial role in predicting equipment demand, optimizing resource allocation, and ensuring the efficient availability of medical equipment, thereby enhancing healthcare operational efficiency.
In the healthcare domain, the increasing prevalence of Machine Learning (ML) in diagnostic applications and as a clinical decision support tool for healthcare providers is noteworthy [33]. Traditional decision support tools often rely on intuition or deduction, where intuitive approaches draw on clinical knowledge or patterns for quicker decisions but carry a higher risk of errors. Deduction-based methods are more methodical but demand significant intellectual input, time, and cost for reasoned outcomes [33,34]. ML models offer a balanced approach by closely mimicking clinical patterns, utilizing expert knowledge, and incorporating impactful factors in their analysis. Consequently, the healthcare literature abounds with ML applications, yet limited attention has been directed toward predicting demand for instruments such as endoscopes and other reusable medical equipment (RME).
Flexible Nasopharyngoscopy has been a common practice in ENT clinics since the 1950s [35], offering a highly precise diagnostic tool for assessing head and neck complaints with remarkable accuracy. A study by [4], focusing primarily on adult subjects (with only 6% below 20 years), demonstrated the effectiveness of flexible Nasopharyngoscopy as a diagnostic procedure for patients with upper airway-related symptoms. Beyond identifying abnormalities, it serves to rule out issues that might otherwise necessitate evaluation in the operating room under sedation. According to [36], 59% of flexible Nasopharyngoscopy examinations resulted in a “normal” outcome. For patients, this low-risk procedure provides accurate diagnostic information, making it a valuable tool in routine clinic examinations for concerns related to voice changes, swallowing problems, throat sensations, sleep apnea evaluation, or symptoms suggestive of head-neck cancers [35].
From the perspective of RME reprocessing, flexible endoscopes present the most intricate challenges for reuse [37]. As of now, inadequate reprocessing of endoscopes ranks among the top 10 health hazards in the US, underscoring the urgency and relevance of the proposed framework for medical centers. The authors of [37] outline the Spaulding Classification as determining the “appropriate level of disinfection for medical devices according to their intended use.” The classification designates procedures using flexible endoscopes as semi-critical, recommending HLD. However, recent infection control issues have prompted experts to contemplate revisions to the Spaulding Classification, advocating for the sterilization of flexible endoscopes due to safety concerns.

3. Materials and Methods

This paper introduces a classification framework designed to assist clinicians and hospital administrators in determining whether incoming patients will require the use of an endoscope. Illustrated in Figure 1, the proposed framework initiates with data processing and statistical analysis. The first phase emphasizes data collection, exploration, and processing, while the subsequent phase focuses on developing and evaluating predictive models, including logistic regression, gradient boosting, and light gradient boosting. The classification models are assessed for performance on test datasets through 10-fold cross-validation, employing metrics such as accuracy, precision, recall, Area Under the Receiver Operating Characteristic Curve (AUCROC), and F1 score.

3.1. Data Preprocessing

The dataset was sourced from a predefined clinic report utilized by clinic leadership to assess visit types and procedures conducted through Current Procedural Terminology (CPT) at a 100-bed healthcare facility in the Midwest catering to the Veteran population. Visits often encompassed multiple CPTs, resulting in multiple instances associated with a single CPT per data record on the report. Preparing this report for model utilization involved transforming the “many-to-one” relationship into a “one-to-one” mapping of CPT to visit occurrences. This process also included generating the scope used label using CPT information, deidentifying Personally Identifiable Information (PII) from the data, coding data by creating age groupings, breaking down ICD codes by alpha characters (categories) from the rest of the code, and conducting Exploratory Data Analysis (EDA), which involved addressing missing values through imputation.
The initial report was organized by sorting patient names, visit dates, and visit times, grouping rows with multiple CPT codes associated with a single visit together. Each individual CPT code provided information about the visit encounter, including visit type (new patient, follow-up patient, or consultation), with additional CPT codes detailing procedures conducted during the visit, such as the use of endoscopes. To label visits as either utilizing scopes or not, rows related to this information were extracted, leaving only the CPT row indicating visit type in the dataset. For HIPAA compliance, personally identifiable information such as name, date of birth, and social security number was removed during the deidentification process. The next step involved consolidating visit-level data by diagnosis into a single row. During this consolidation, binary labels of 0 and 1 were assigned based on post-visit CPT code information, designating the presence or absence of endoscope use in each visit. Post-visit CPTs, crucial for medical documentation, classify visit types (e.g., new patient or consult) and medical procedures performed during the visit, including diagnostic laryngoscopy, indicating the use of endoscopes.
Lastly, EDA was employed to enhance comprehension of the data. The initial raw data encompassed 24 features, including continuous and categorical visit-related CPT codes, patient identifiable information, and provider details. During the initial exploratory phase, several features were eliminated either due to lack of relevance or to prevent label leakage. For the retained features, one-hot and ordinal encoding techniques were applied. Subsequently, missing values were imputed, and to address dataset imbalance, oversampling was implemented. Lastly, dimension reduction techniques were applied to streamline and reduce the number of features in the dataset.

3.2. Predictive Analytics

The predictive analytics phase concentrates on training and evaluating binary classifiers. In this phase, various classification algorithms were employed, including logistic regression (LR), gradient boosting (GB), light gradient boosting (LGB), random forest, extra tree classifier, ridge classifier, linear discriminant analysis, AdaBoost classifier, and support vector machines. However, for the purpose of this study, the results of the top three models—logistic regression (LR), light gradient boosting (LGB), and gradient boosting (GB)—are discussed.
Ensemble learning methods amalgamate classification outcomes from multiple learning algorithms. In comparison to conventional binary classifiers like LR, these models not only pledge superior performance but also ensure a more resilient classification. This study incorporates two boosting ensemble models within the proposed framework. Boosting is a specific technique within ensemble learning that emphasizes sequentially training models to correct errors, giving more importance to misclassified instances. While GB generates a classification model comprising an ensemble of weak prediction models like decision trees, LGB is built upon a more efficient boosting decision tree algorithm, leveraging histogram-based trees to enhance training speed and reduce memory usage. Both boosting models are contrasted with a LR model trained on the same dataset.
Ten-fold cross-validation is utilized to provide robust performance metrics. In this process, the dataset undergoes ten random 2/3–1/3 splits, designating 2/3 for training and 1/3 for testing in each split. At every split, multiple models are generated using the training set and assessed using the corresponding test set. The performance metrics reported are the average scores across all ten folds for the specified metrics of interest. This approach ensures a comprehensive evaluation of the model’s performance by considering various subsets of the data for training and testing, promoting generalizability and reliability of the reported metrics. Performance metrics such as accuracy (Equation (1)), recall (Equation (2)), precision (Equation (3)), F1 score (Equation (4)), and area AUCROC are reported for all models.
Accuracy = (TP + TN)/(TP + FP + TN + FN)
Recall = TP/(TP + F)
Precision = TP/(TP + FP)
F1 Score = (2 × Pecision×Recall)/(Pecision + Recall)
where TP, TN, FP, and FN stand for True Positive, True Negative, False Positive, and False Negative, respectively. All these metrics accept values between 0.0 and 1.0, and higher scores represent better performance. Accuracy gauges the overall correctness of a classification model by assessing the ratio of correctly predicted instances to the total number of instances. While intuitive, accuracy is not sufficient when working with unbalanced datasets as it fails to measure the performance of the model in correctly identifying the minority class. When working with unbalanced datasets, using additional metrics such as recall and precision become critical for evaluating the performance of the classifiers with regards to the majority and minority labels. Precision measures the accuracy of positive predictions, indicating the ratio of true positives to the sum of true positives and false positives. Recall, also known as sensitivity, evaluates the model’s ability to identify all relevant instances by calculating the ratio of true positives to the sum of true positives and false negatives. While recall is a better metric when the cost associated with false negative is high, precision is more reliable when the costs of false positive is high. The F1 score, the harmonic mean of precision and recall, offers a balanced measure that considers both false positives and false negatives, providing an overall assessment of a classification model’s effectiveness. AUCROC quantifies a model’s performance across various threshold settings in binary classification, illustrating the trade-off between sensitivity and specificity.

4. Results and Discussion

The data utilized in this study were gathered between August 2019 and February 2022 at a 100-bed medical facility in the Midwest, dedicated to serving the Veteran population. The initial dataset comprised 9027 records, encompassing 24 features.

4.1. Data Preprocessing

Following the de-identification process, the original 9027 records were streamlined to 4129 through consolidation, where each record signifies an individual visit and is accompanied by a binary label. Of the initial 24 features, 19 were nominal, non-metric values, four were defined as ratios, and one as an interval. Following the elimination of non-relevant features and addressing label leakage (specifically, removal of post-visit CPT codes), the features were reduced to 14. The EDA (Figure 2) reveals two key insights. Firstly, certain age groups exhibit a higher propensity for visits, with the top three leading age groups being 70s, 60s, and 50s. Given the facility’s focus on serving the Veteran population, younger patients (20 years or below) are less likely to have met service requirements. The level of service-connected disability may also influence the demographic seeking care at the facility. Additionally, the prevalence of head and neck cancers tends to increase with advancing age, particularly beyond 50 [17].
Further data analysis led to identifying the top 10 CPT codes corresponding to most visits. These CPT codes are 99213, 99214, 99244, 99212, 99243, 99204, 99203, 99245, 99215, and 99211 as displayed in Figure 3.
As displayed in Figure 3, these CPT codes correspond to the type of visit that the patient will have, the patient type (new patient or established), and the anticipated duration of the visit. Although CPT code 99213 is associated with the highest number of visits (i.e., 28%), it is CPT code 99214 which is accountable for 10% of visits leading to utilization of an endoscope. Description of CPT codes explain the severity of the underlying problems, and whether the patient is new (i.e., 23%), established (i.e., 63%), or unknown (i.e., 24%).
Following the EDA, feature encoding expanded the number of features to 18. To handle missing values and address imbalances in the dataset, iterative imputation and SMOTE techniques were applied, respectively. Subsequently, the dataset’s dimensionality was reduced using PyCaret’s feature selection tool, which amalgamates various permutation importance techniques like Random Forest, AdaBoost, and Linear correlation with the target variable (i.e., scope used or not). Parts a and b in Figure 4 illustrate the effects of balancing and dimension reduction in our dataset.
While Figure 4a displays the distribution of labels before and after balancing, Figure 4b exhibits the top 10 features holding the highest feature importance scores. As shown in Figure 4a, although both oversampling and under sampling can address the label skewness, the size of the dataset reduces significantly when implementing undersampling. Undersampling relies on deleting rows of data from the majority label to balance the dataset, while oversampling addresses the gap but duplicates instances from the minority class. The original dataset contained 4129 datapoints, undersampling reduced the size to 2448 while oversampling through SMOTE led to a dataset of size 5810. Given the small size of the original dataset, SOMTE is implemented within the framework to address the data imbalance.
As shown in Figure 4b, most of the reported top ten features are ICD-10 codes. ICD-10 stands for the International Classification of Diseases—Tenth Revision, which is an international diagnosis system designed for representing conditions and diseases and any health-related problems, abnormal findings, signs and symptoms, injuries, and external causes of injuries and diseases [18]. The ICD-10 codes are a part of the patient’s medical record and may require imaging, labs, or a clinical workup based on a patient’s chief complaint(s) for the visit. These codes are generally available for returning patients to ENT before a clinic visit. New patients to specialty clinics such as ENT may have pre-visit ICD-10 codes included in their referral to the clinic which is then validated during the visit. ICD-10 codes R49.9 (Unspecified voice and resonance disorder (hoarseness)), R13.10 (Dysphagia, unspecified), J38.3 (Other diseases of vocal cords), H92.01 (Otalgia, right ear), and H92.02 (Otalgia, left ear) were all pre-visit diagnoses that may result in scope use during the patient’s visit. J38.3 (Other diseases of vocal cords) and H92.02 (Otalgia, left ear) were identified as important features by the model.
Revisiting the original dataset, the presence of those ICD-10 codes such as J38.3 and R49.9 resulted in lack of scope usage in a majority of visits. Figure 5 displays the distribution of usage of five ICD codes (i.e., H92.01, H92.02, J38.3, R13.10, and R49.0) across 15 different clinicians over 140 visits. As displayed, although some ICD codes such as R49.9 seem to bias against using scopes in the visits, we had physicians that used scopes for 100%, 50%, or 33% of their patients presenting with R49.9.
But by having a closer look at R49.9, where 94% of the code resulted in not using scopes, the distribution is vastly different across different clinicians as illustrated in Figure 5. Figure 6 displays the top ten reported ICD-10 codes in our dataset.

4.2. Predictive Analytics

The data preprocessing phase is followed by training and evaluating predictive models. The predictive analytics starts by implementing 10-fold cross validation, where datasets are divided into training and testing sets (2/3 and 1/3, respectively) in each fold. Evaluating the performance of models trained over 10 folds, GB, LGB, and LR have the best performance among all the trained models. Figure 7 displays the ROC curves for the trained GB (Figure 7a), LGB (Figure 7b), and LR (Figure 7c) models. These curves demonstrate the performance of the mentioned classification models for both classes in addition to the micro- and macro-averages across different thresholds. The developed GB, LGB, and LR models presented ROCAUC scores of 96%, 98%, and 99%, respectively. The diagonal line in ROC curves represents the behavior of a random classifier which has no better chance of detecting positive/negative labels than flipping a fair coin. The distance among the trained models’ ROC curve from the 45-degree diagonal of the ROC space demonstrates the high performance of these models.
Table 1 reports performance metrics such as accuracy, AUCROC, recall, precision, and F1 score for all three models over the training set. As shown in Table 1, while GB outperformed LR and LGB models in accuracy (94%), recall (86%), precision (94%), and F1 score (90%), the LGB provided a better AUCROC score of 99% over the train dataset.
Figure 8 demonstrates the average performance of all trained models over the test dataset compared to their averages on the training dataset. Over the test datasets, LGB models have the best performance with an AUCROC score of 89% and accuracy of 80%. Both GB and LR models are followed closely by AUCROC of 87% and 87% and accuracy scores of 82% and 81%, respectively.
Although the F1 scores are close, ranging across 64%, 68%, and 70% for GB, LGB, and LR, respectively, the boosting algorithms have higher precision while LR models have higher recall. This shows that the logistic regression produced more false positives while the boosting models produced more false negatives. As false negatives (falsely predicting scope will not be needed) are costlier for this application, the logistic regression model provides marginally better recommendations for this application.
Providing this ability to predict scopes usage provides several benefits. For the ENT clinic, a key benefit is the increased capacity for the nursing staff to be involved in more direct patient care related activities. Secondly, this predictive framework can help to avoid potential rescheduled appointments due to scope unavailability. Third, a smaller number of scopes needs to be preprocessed on average as the proposed framework reduces the uncertainty around the need for scopes in visits. This may significantly reduce the reprocessing efforts as less time will be spent on negotiation, cleaning, scheduling, and transferring scopes. Finally, this proposed framework helps to improve the service quality for the patients.
Next steps include the deployment of the model for operational use at the medical center. Web-based deployment would streamline the process, allowing the ENT staff to upload the clinic appointment schedule including the additional elements needed for the ML. The current scheduling template would require some transformation to fit the input file structure needed for the model. This could be accomplished using an application native to the nurses and clinic staff such as a macro enabled Excel file.
Model prediction performance would need to be reviewed periodically for accuracy purposes. The medical center’s quality management office will develop the maintenance schedule, develop test scenarios, and track accuracy throughout the life of the model. This would address the concern of monitoring changes that could impact model performance mentioned in the literature review. Changes could result from clinic operational changes due to rotation of providers in residency programs, retirement, or promotion of attending providers or nurse practitioners, or advancements in the ICD-10 or CPT coding documents.
There are some limitations that should be addressed here. Training our classifiers on a dataset limited to a certain age range (i.e., 50s to 70s) introduces several limitations, primarily stemming from the restricted representation of the overall population. Our models may struggle to generalize well to age groups outside the specified range. Any patterns or relationships learned might not be applicable to individuals outside the trained age range. Features that are crucial for predicting outcomes within the specified age range might not hold the same significance or relevance for individuals in other age groups. The models may miss age-specific patterns or nuances. To mitigate these limitations, we will incorporate a more diverse age group in our training data to enhance the model’s generalization across a broader population in our future work. In addition, we will be looking at predictive models that would rely on augmented data beyond individual patients to predict the demand for flexible endoscopes.

5. Conclusions

The ENT clinic within a 100-bed healthcare center in the Midwest, dedicated to serving the Veteran population, has undergone a significant shift by centralizing the reprocessing of scopes to a sterile processing department. Given the uncertainty surrounding the demand for scopes during incoming patient visits, this work introduces a classification framework designed to predict the utilization of endoscopes based on a range of factors, including patient information, providers, and various visit-related parameters. Leveraging these factors, which are accessible prior to the patient’s visit, the framework employs binary classification models to predict whether a scope will be necessary for the upcoming visit. The top-performing models demonstrated notable efficacy, reporting an average AUCROC score of 89%, an accuracy of 80%, and an F1 score of 68%. The proposed framework extends its utility beyond the ENT clinic, offering a valuable tool for healthcare systems facing resource constraints. This predictive model can be implemented in areas where centralized services depend on limited resources, aiding in the anticipation and prioritization of workload, thereby optimizing operational efficiency throughout the broader health system. By harnessing ML algorithms to analyze historical data and key parameters, healthcare providers can proactively allocate resources where they are needed most, ensuring efficient resource management, better patient care, and a more resilient healthcare system.

Author Contributions

Conceptualization, D.L., C.R., G.Y. and S.M.; methodology, D.L. and S.M.; software, D.L. and S.M.; validation, D.L. and S.M.; data curation, D.L.; writing original draft, D.L., C.R., G.Y. and S.M.; review and editing, D.L., C.R., G.Y. and S.M.; visualization D.L. and S.M.; supervision, S.M. All authors have read and agreed to the published version of the manuscript.

Funding

This research received no external funding.

Institutional Review Board Statement

Not applicable.

Informed Consent Statement

Informed consent was obtained from all subjects involved in the study.

Data Availability Statement

The de-identified data would be made available upon request. To ask for data please reach out to David Lanier at [email protected].

Conflicts of Interest

The authors declare no conflicts of interest.

References

  1. Benedict, M. Delays in Endoscope Reprocessing … and the Biofilms within; Olympus Corporation, Olympus America Inc.: Tokyo, Japan, 2018; Available online: https://medical.olympusamerica.com/sites/default/files/us/files/pdf/Whitepaper---Delays-in-Endoscope-Reprocessing-FINAL-APPROVED-single-page-version.pdf (accessed on 2 April 2023).
  2. Gurewich, D.; Shwartz, M.; Beilstein-Wedel, E.; Davila, H.; Rosen, A. Did Access to Care Improve Since Passage of the Veterans Choice Act?: Differences between Rural and Urban Veterans. Med. Care 2021, 59, S270–S278. [Google Scholar] [CrossRef]
  3. Centers for Medicare & Medicaid Services. Access Measures. Measure Management & You; Centers for Medicare & Medicaid Services: Baltimore, MD, USA, 2018; pp. 1–2. [Google Scholar]
  4. Etu, E.E.; Monplaisir, L.; Masoud, S.; Arslanturk, S.; Emakhu, J.; Tenebe, I.; Miller, J.B.; Hagerman, T.; Jourdan, D.; Krupp, S. A comparison of univariate and multivariate forecasting models predicting emergency department patient arrivals during the COVID-19 pandemic. Healthcare 2022, 10, 1120. [Google Scholar] [CrossRef]
  5. Ahsan, M.M.; Luna, S.A.; Siddique, Z. Machine-learning-based disease diagnosis: A comprehensive review. Healthcare 2022, 10, 541. [Google Scholar] [CrossRef] [PubMed]
  6. Etu, E.E.; Larot, J.; Gunaga, S.; Tenebe, T.; Merklen, C.; Masoud, S.; Emakhu, J.; Morton, T.; Rammal, J.-A.; Chien, C.; et al. 313 Leveraging Decision Trees to Forecast Ambulance Traffic in Emergency Departments. Ann. Emerg. Med. 2023, 82, S136–S137. [Google Scholar] [CrossRef]
  7. Emakhu, J.; Monplaisir, L.; Aguwa, C.; Arslanturk, S.; Masoud, S.; Nassereddine, H.; Hamam, M.S.; Miller, J.B. Acute coronary syndrome prediction in emergency care: A machine learning approach. Comput. Methods Programs Biomed. 2022, 225, 107080. [Google Scholar] [CrossRef]
  8. Ray, A.; Chaudhuri, A.K. Smart healthcare disease diagnosis and patient management: Innovation, improvement and skill development. Mach. Learn. Appl. 2021, 3, 100011. [Google Scholar] [CrossRef]
  9. Zgheib, R.; Chahbandarian, G.; Kamalov, F.; El Messiry, H.; Al-Gindy, A. Towards an ML-based semantic IoT for pandemic management: A survey of enabling technologies for COVID-19. Neurocomputing 2023, 528, 160–177. [Google Scholar] [CrossRef]
  10. Ben-Israel, D.; Jacobs, W.B.; Casha, S.; Lang, S.; Ryu, W.H.A.; de Lotbiniere-Bassett, M.; Cadotte, D.W. The impact of machine learning on patient care: A systematic review. Artif. Intell. Med. 2020, 103, 101785. [Google Scholar] [CrossRef]
  11. Johnson, A.E.; Ghassemi, M.M.; Nemati, S.; Niehaus, K.E.; Clifton, D.A.; Clifford, G.D. Machine learning and decision support in critical care. Proc. IEEE 2016, 104, 444–466. [Google Scholar] [CrossRef] [PubMed]
  12. Davenport, T.; Kalakota, R. The potential for artificial intelligence in healthcare. Future Healthc. J. 2019, 6, 94. [Google Scholar] [CrossRef]
  13. Kimbugwe, N.; Pei, T.; Kyebambe, M.N. Application of deep learning for quality of service enhancement in internet of things: A review. Energies 2021, 14, 6384. [Google Scholar] [CrossRef]
  14. Ross, J.; Webb, C.; Rahman, F. Artificial Intelligence in Healthcare; Academy of Medical Royal Colleges: London, UK, 2019. [Google Scholar]
  15. Erickson, B.J.; Korfiatis, P.; Akkus, Z.; Kline, T.L. Machine learning for medical imaging. Radiographics 2017, 37, 505–515. [Google Scholar] [CrossRef]
  16. Çallı, E.; Sogancioglu, E.; van Ginneken, B.; van Leeuwen, K.G.; Murphy, K. Deep learning for chest X-ray analysis: A survey. Med. Image Anal. 2021, 72, 102125. [Google Scholar] [CrossRef]
  17. Akcay, S.; Breckon, T. Towards automatic threat detection: A survey of advances of deep learning within X-ray security imaging. Pattern Recognit. 2022, 122, 108245. [Google Scholar] [CrossRef]
  18. Cuocolo, R.; Cipullo, M.B.; Stanzione, A.; Ugga, L.; Romeo, V.; Radice, L.; Brunetti, A.; Imbriaco, M. Machine learning applications in prostate cancer magnetic resonance imaging. Eur. Radiol. Exp. 2019, 3, 35. [Google Scholar] [CrossRef] [PubMed]
  19. Kim, Y.K.; Na, K.S. Application of machine learning classification for structural brain MRI in mood disorders: Critical review from a clinical perspective. Prog. Neuro-Psychopharmacol. Biol. Psychiatry 2018, 80, 71–80. [Google Scholar] [CrossRef] [PubMed]
  20. Khalid, H.; Hussain, M.; Al Ghamdi, M.A.; Khalid, T.; Khalid, K.; Khan, M.A.; Fatima, K.; Masood, K.; Almotiri, S.H.; Farooq, M.S.; et al. A comparative systematic literature review on knee bone reports from mri, X-rays and ct scans using deep learning and machine learning methodologies. Diagnostics 2020, 10, 518. [Google Scholar] [CrossRef] [PubMed]
  21. Wang, S.; Summers, R.M. Machine learning and radiology. Med. Image Anal. 2012, 16, 933–951. [Google Scholar] [CrossRef] [PubMed]
  22. Hampe, N.; Wolterink, J.M.; Van Velzen, S.G.; Leiner, T.; Išgum, I. Machine learning for assessment of coronary artery disease in cardiac CT: A survey. Front. Cardiovasc. Med. 2019, 6, 172. [Google Scholar] [CrossRef]
  23. Shinde, S.A.; Rajeswari, P.R. Intelligent health risk prediction systems using machine learning: A review. Int. J. Eng. Technol. 2018, 7, 1019–1023. [Google Scholar] [CrossRef]
  24. Mišić, V.V.; Gabel, E.; Hofer, I.; Rajaram, K.; Mahajan, A. Machine learning prediction of postoperative emergency department hospital readmission. Anesthesiology 2020, 132, 968–980. [Google Scholar] [CrossRef] [PubMed]
  25. Alfred, R.; Obit, J.H. The roles of machine learning methods in limiting the spread of deadly diseases: A systematic review. Heliyon 2021, 7, e07371. [Google Scholar] [CrossRef] [PubMed]
  26. Wu, J.; Roy, J.; Stewart, W.F. Prediction modeling using EHR data: Challenges, strategies, and a comparison of machine learning approaches. Med. Care 2010, 48, S106–S113. [Google Scholar] [CrossRef]
  27. Friedman, C.; Elhadad, N. Natural language processing in health care and biomedicine. In Biomedical Informatics: Computer Applications in Health Care and Biomedicine; Springer: London, UK, 2014; pp. 255–284. [Google Scholar]
  28. Vamathevan, J.; Clark, D.; Czodrowski, P.; Dunham, I.; Ferran, E.; Lee, G.; Li, B.; Madabhushi, A.; Shah, P.; Spitzer, M.; et al. Applications of machine learning in drug discovery and development. Nat. Rev. Drug Discov. 2019, 18, 463–477. [Google Scholar] [CrossRef]
  29. Dara, S.; Dhamercherla, S.; Jadav, S.S.; Babu, C.M.; Ahsan, M.J. Machine learning in drug discovery: A review. Artif. Intell. Rev. 2022, 55, 1947–1999. [Google Scholar] [CrossRef]
  30. Sebastiani, M.; Vacchi, C.; Manfredi, A.; Cassone, G. Personalized medicine and machine learning: A roadmap for the future. J. Clin. Med. 2022, 11, 4110. [Google Scholar] [CrossRef]
  31. Malgwi, Y.M.; Goni, I.; Ahmad, B.M. A Survey on Recent Advances in Medical Diagnosis and Telemedicine Using Machine Learning Techniques. Orient. J. Comput. Sci. Technol. 2023, 16. Available online: https://bit.ly/3qCZ7DN (accessed on 2 April 2023).
  32. Bauder, R.A.; Khoshgoftaar, T.M. Medicare fraud detection using machine learning methods. In Proceedings of the 2017 16th IEEE International Conference on Machine Learning and Applications (ICMLA), Cancun, Mexico, 18–21 December 2017; pp. 858–865. [Google Scholar]
  33. Eghbali-Zarch, M.; Tavakkoli-Moghaddam, R.; Esfahanian, F.; Masoud, S. Prioritizing the glucose-lowering medicines for type 2 diabetes by an extended fuzzy decision-making approach with target-based attributes. Med. Biol. Eng. Comput. 2022, 60, 2423–2444. [Google Scholar] [CrossRef] [PubMed]
  34. Emakhu, J.; Etu, E.E.; Monplaisir, L.; Aguwa, C.; Arslanturk, S.; Masoud, S.; Tenebe, I.T.; Nassereddine, H.; Hamam, M.; Miller, J. A hybrid machine learning and natural language processing model for early detection of acute coronary syndrome. Healthc. Anal. 2023, 4, 100249. [Google Scholar] [CrossRef]
  35. Alvi, S.; Harsha, P. Flexible Nasopharyngoscopy; StatPearls [Internet]: Treasure Island, FL, USA, 2022. [Google Scholar]
  36. Aremu, S.K. Evaluation and appraisal of its diagnostic yield, The Nigerian experience. J. Fam. Med. Prim. Care 2019, 8, 3399–3403. [Google Scholar] [CrossRef]
  37. Pynnonen, M.A.; Whelan, J. Reprocessing Flexible Endoscopes in the Otolaryngology Clinic. Otolaryngol. Clin. N. Am. 2019, 52, 391–402. [Google Scholar] [CrossRef] [PubMed]
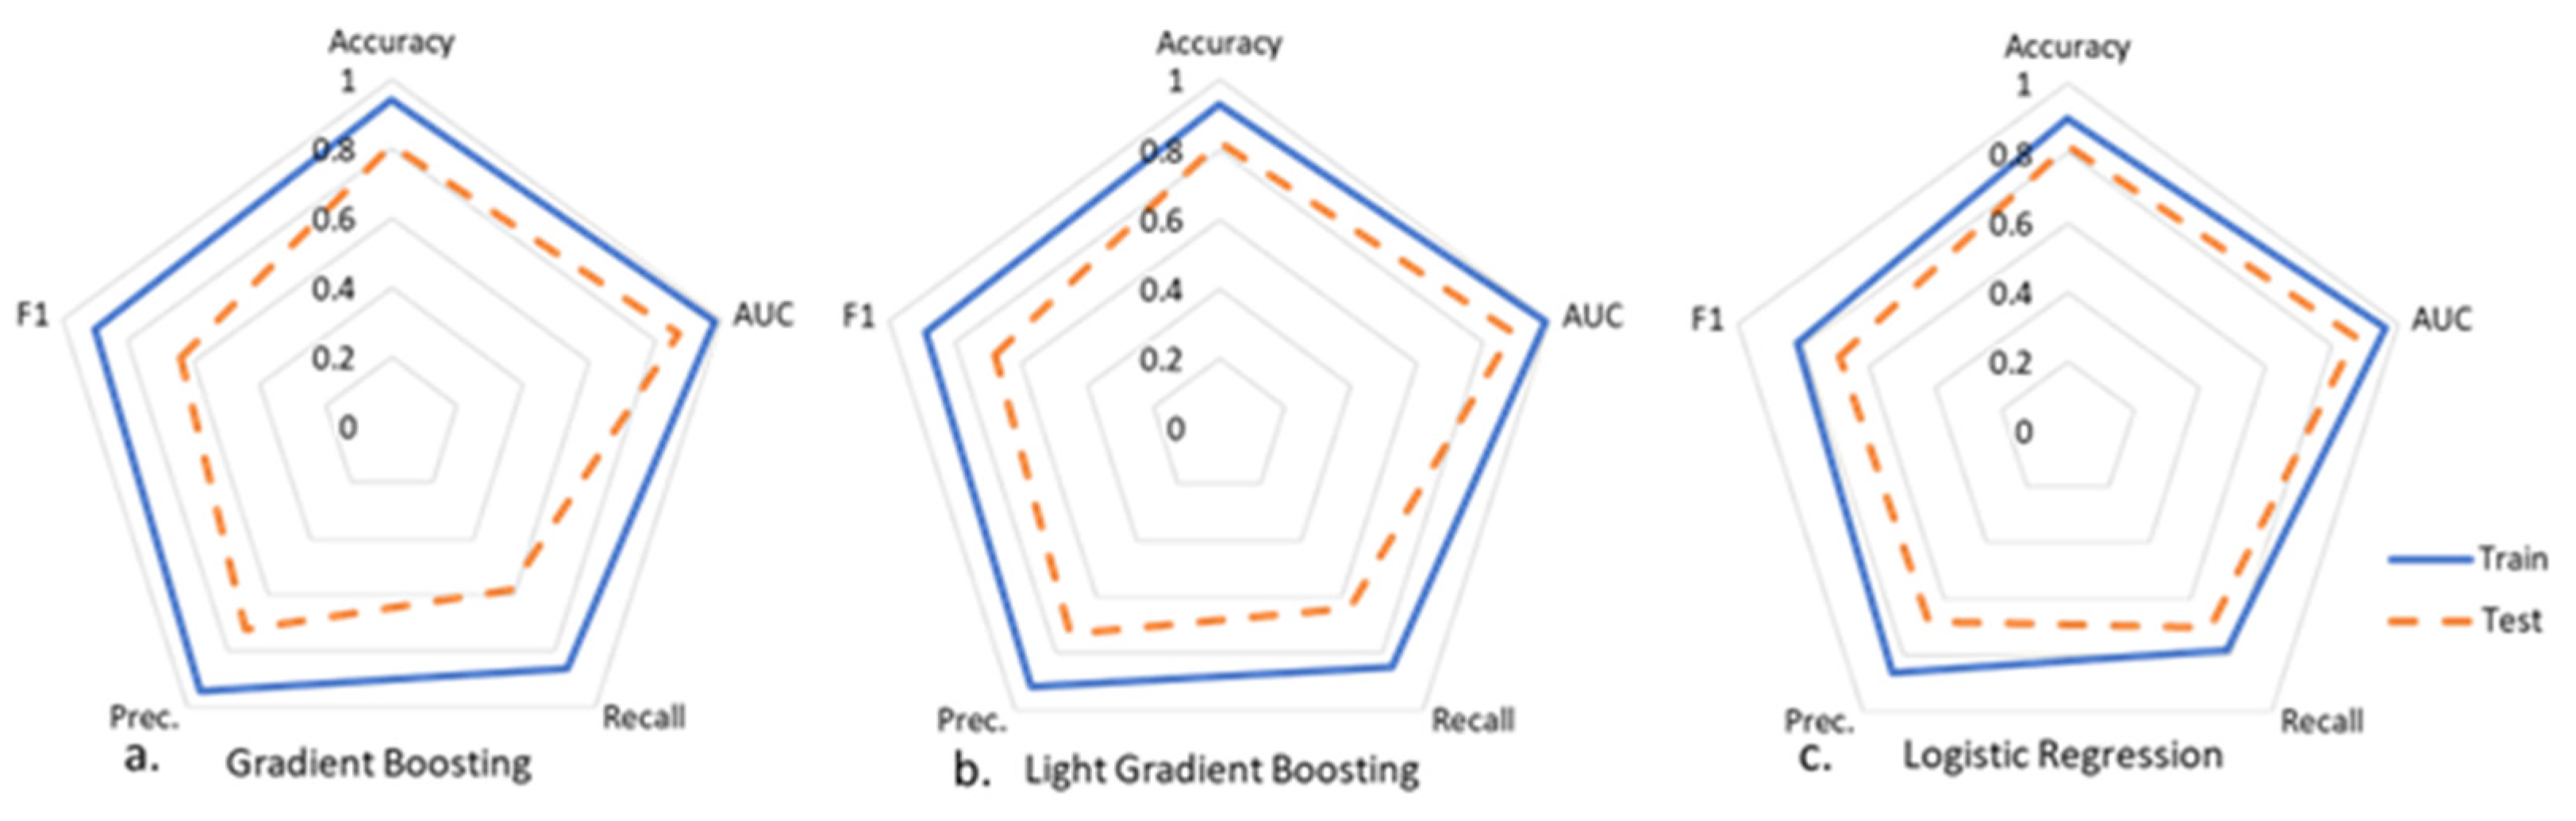
Figure 1. Proposed framework for classifying whether patient’s visit will need an endoscope.
Biomedinformatics 04 00040 g001
Figure 2. Visit days distributions of the patients.
Biomedinformatics 04 00040 g002
Figure 3. Top ten encounter types (described by the CPT code listed) by scope use during visit.
Biomedinformatics 04 00040 g003
Figure 4. The impacts of balancing (a) and feature selection (b) on data.
Biomedinformatics 04 00040 g004
Figure 5. The distribution of ICD codes on scopes’ usage in visits, where H92.01, H92.02, J38.3, R13.10, and R49.9 stand for Otalgia-right ear, Otalgia-left ear, other diseases of vocal cords, Dysphagia-unspecified, Unspecified voice resonance disorder, respectively.
Biomedinformatics 04 00040 g005
Figure 6. Top ten primary ICD-10 codes (a) with descriptions (b) for each unique patient visit agnostic of scope use during visit.
Biomedinformatics 04 00040 g006
Figure 7. ROC curves of both classes along with the micro- and macro-averages for (a) Gradient Boosting, (b) Light Gradient Boosting, and (c) Logistic Regression, where ROC and AUC stands for Receiver Operating Characteristic and Area Under the Curve, respectively.
Biomedinformatics 04 00040 g007
Figure 8. Comparison of the performance of the trained model on the training and test datasets for (a) Gradient Boosting, (b) Light Gradient Boosting, and (c) Logistic Regression trained models, where F1, AUC, and Prec stand for F1 score, Area under the curve, and Precision respectively.
Biomedinformatics 04 00040 g008
Table 1. Performance of the models in terms of accuracy, AUC, precision, recall, and F1 score metrics.
ModelAccuracyArea under the Curve (AUC)RecallPrecisionF1 Score
Logistic Regression (LR)90%96%78%86%82%
Gradient Boosting (GB)94%98%86%94%90%
Light Gradient Boosting (LGB)93%99%85%92%89%
Disclaimer/Publisher’s Note: The statements, opinions and data contained in all publications are solely those of the individual author(s) and contributor(s) and not of MDPI and/or the editor(s). MDPI and/or the editor(s) disclaim responsibility for any injury to people or property resulting from any ideas, methods, instructions or products referred to in the content.

