
A Study on the Effects of Cementless Total Knee Arthroplasty Implants’ Surface Morphology via Finite Element Analysis


 , ,
, , 
Abstract
1. Introduction
2. Methods
2.1. Implant Model
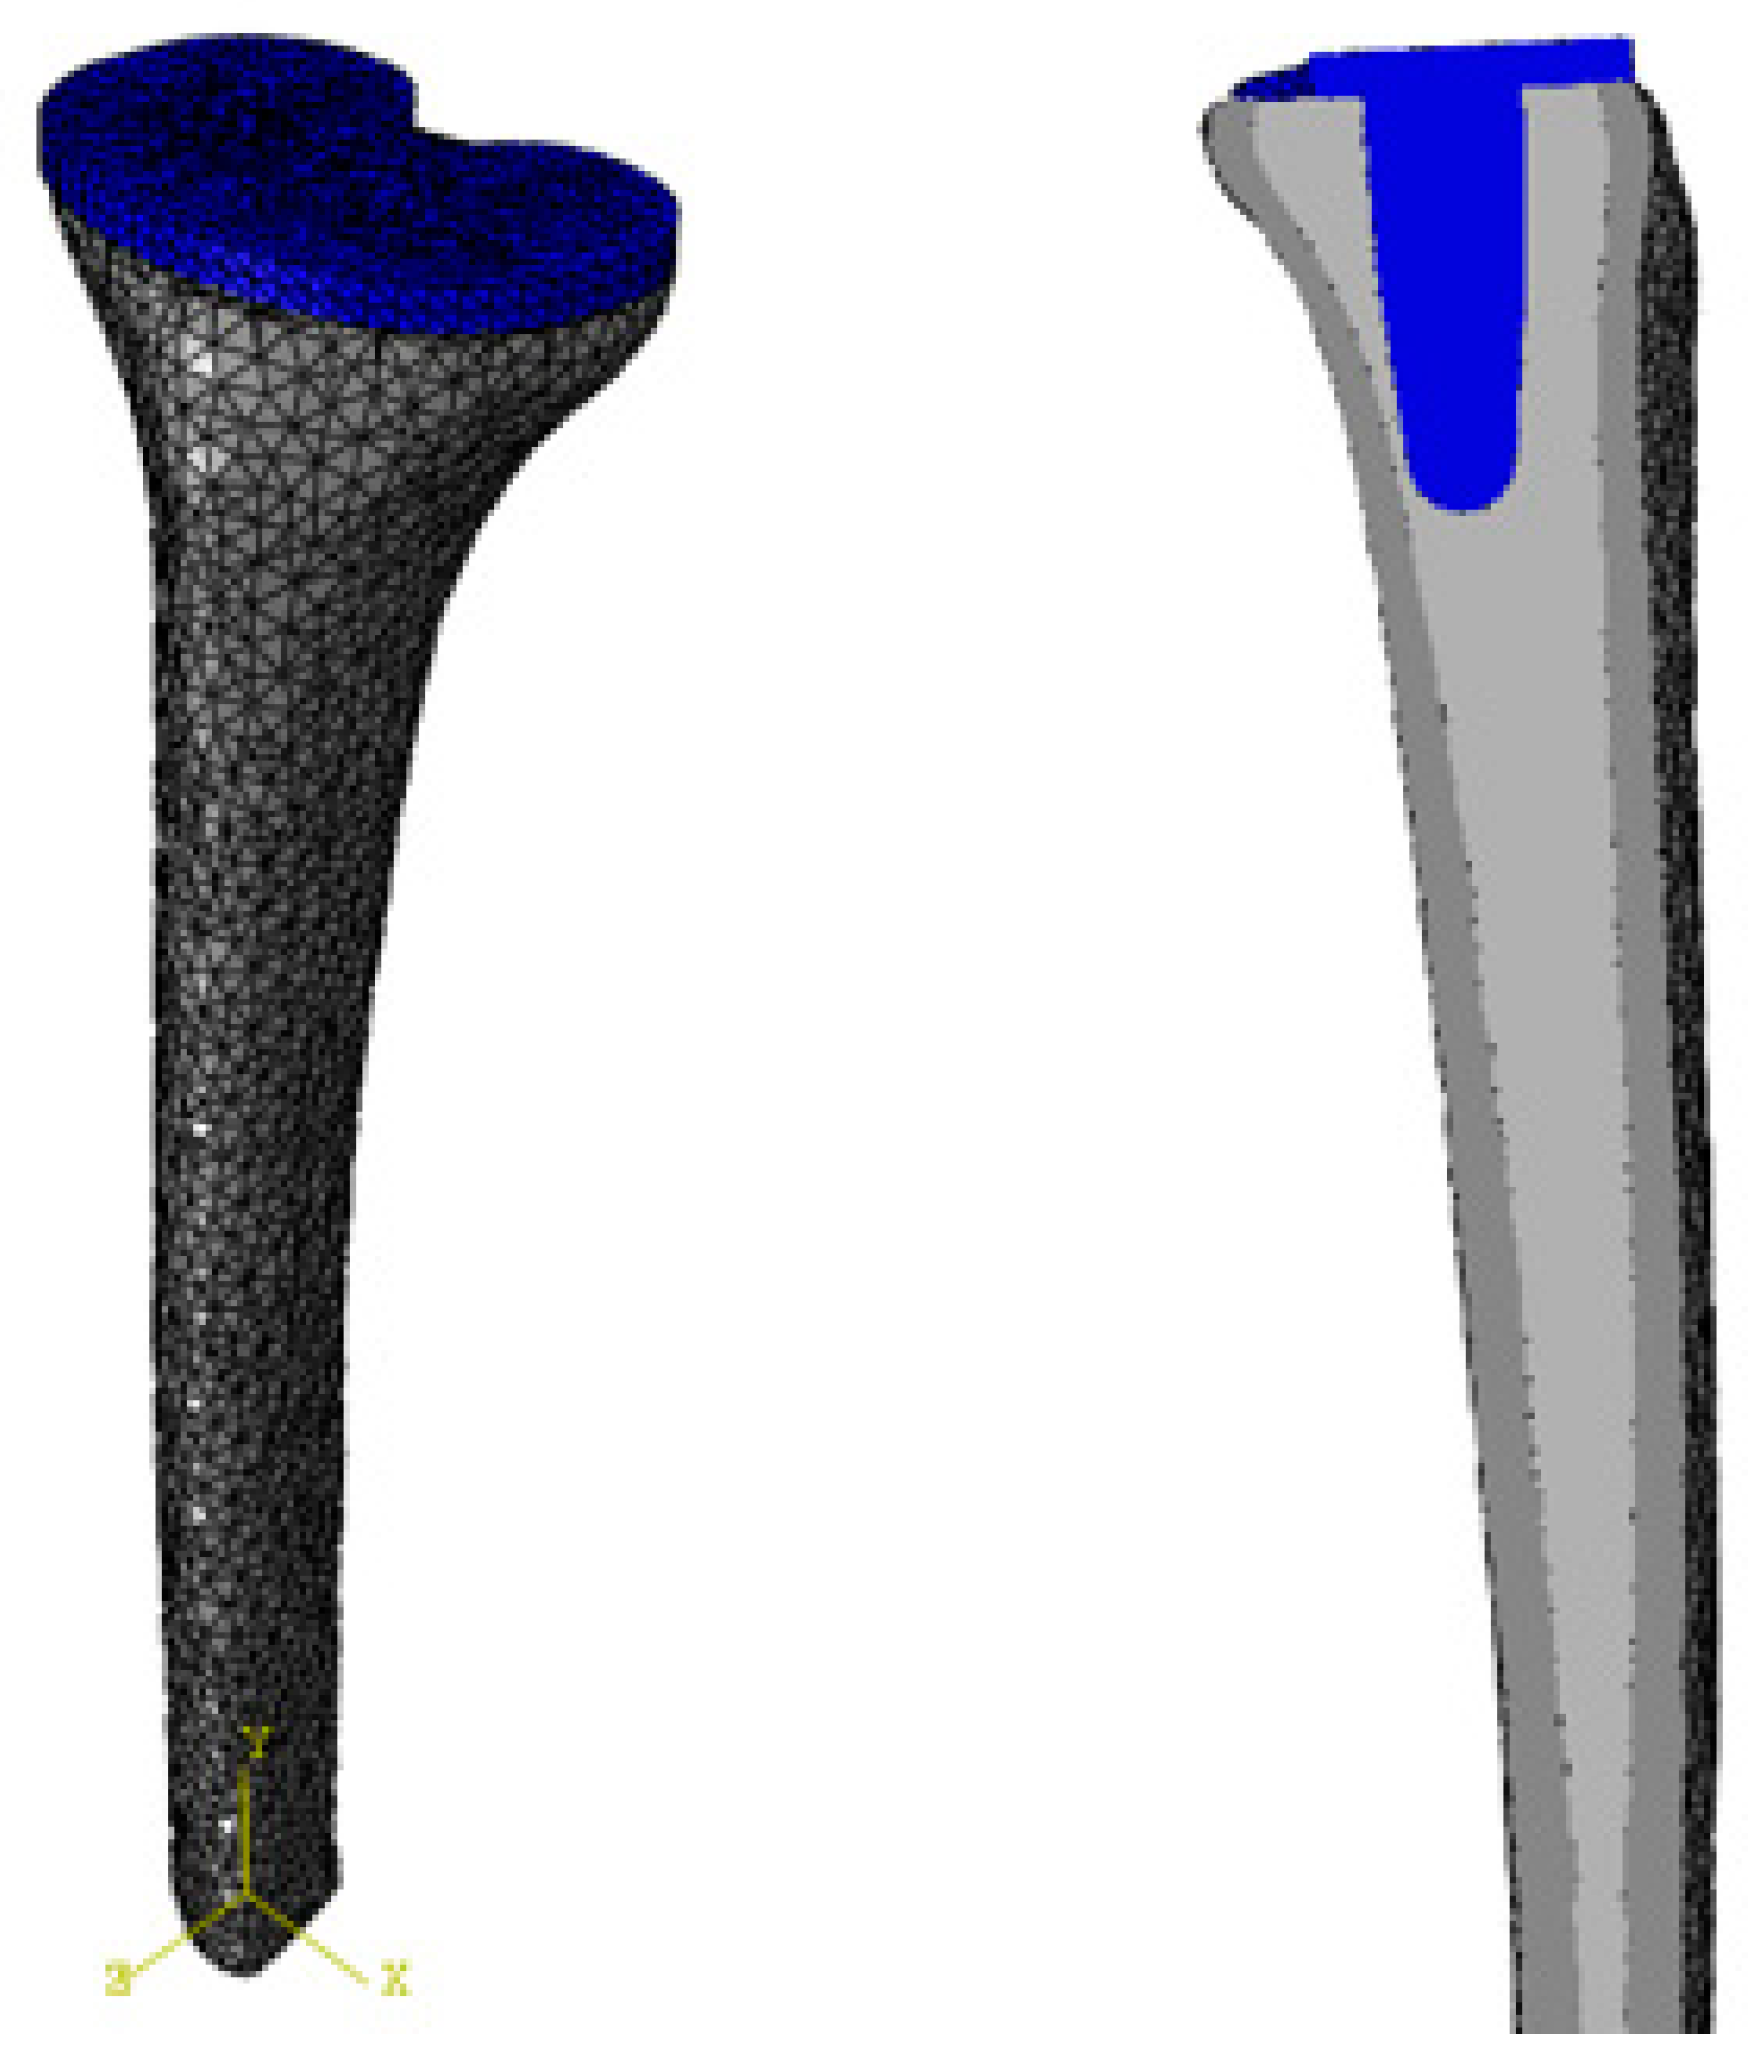
2.2. Bone Model
2.3. Interactions
2.4. Applied Loads and BCs
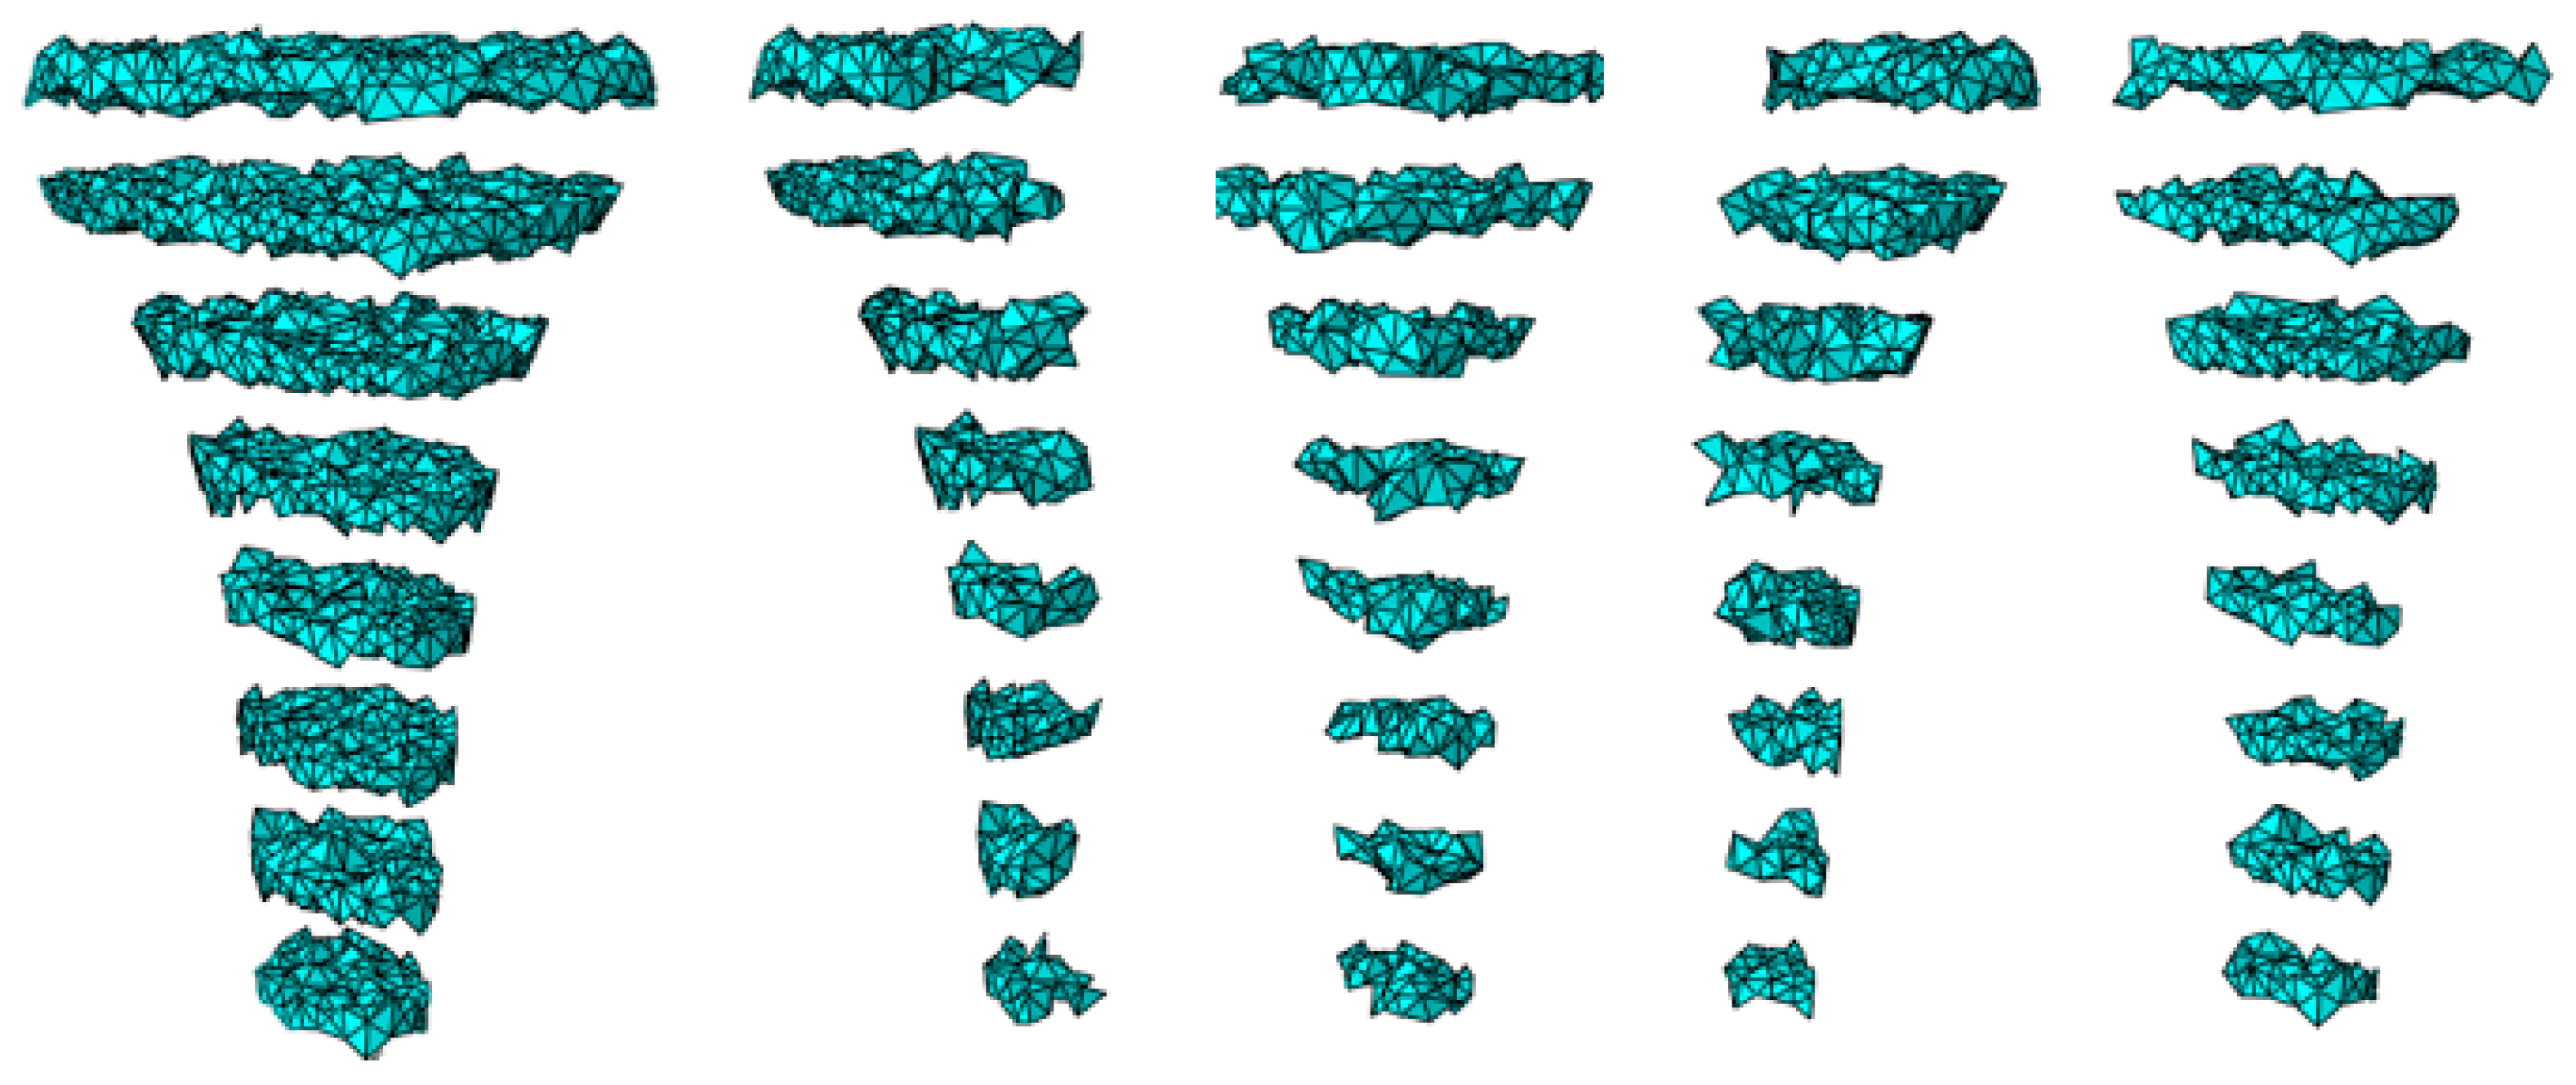
2.5. Mesh Generation
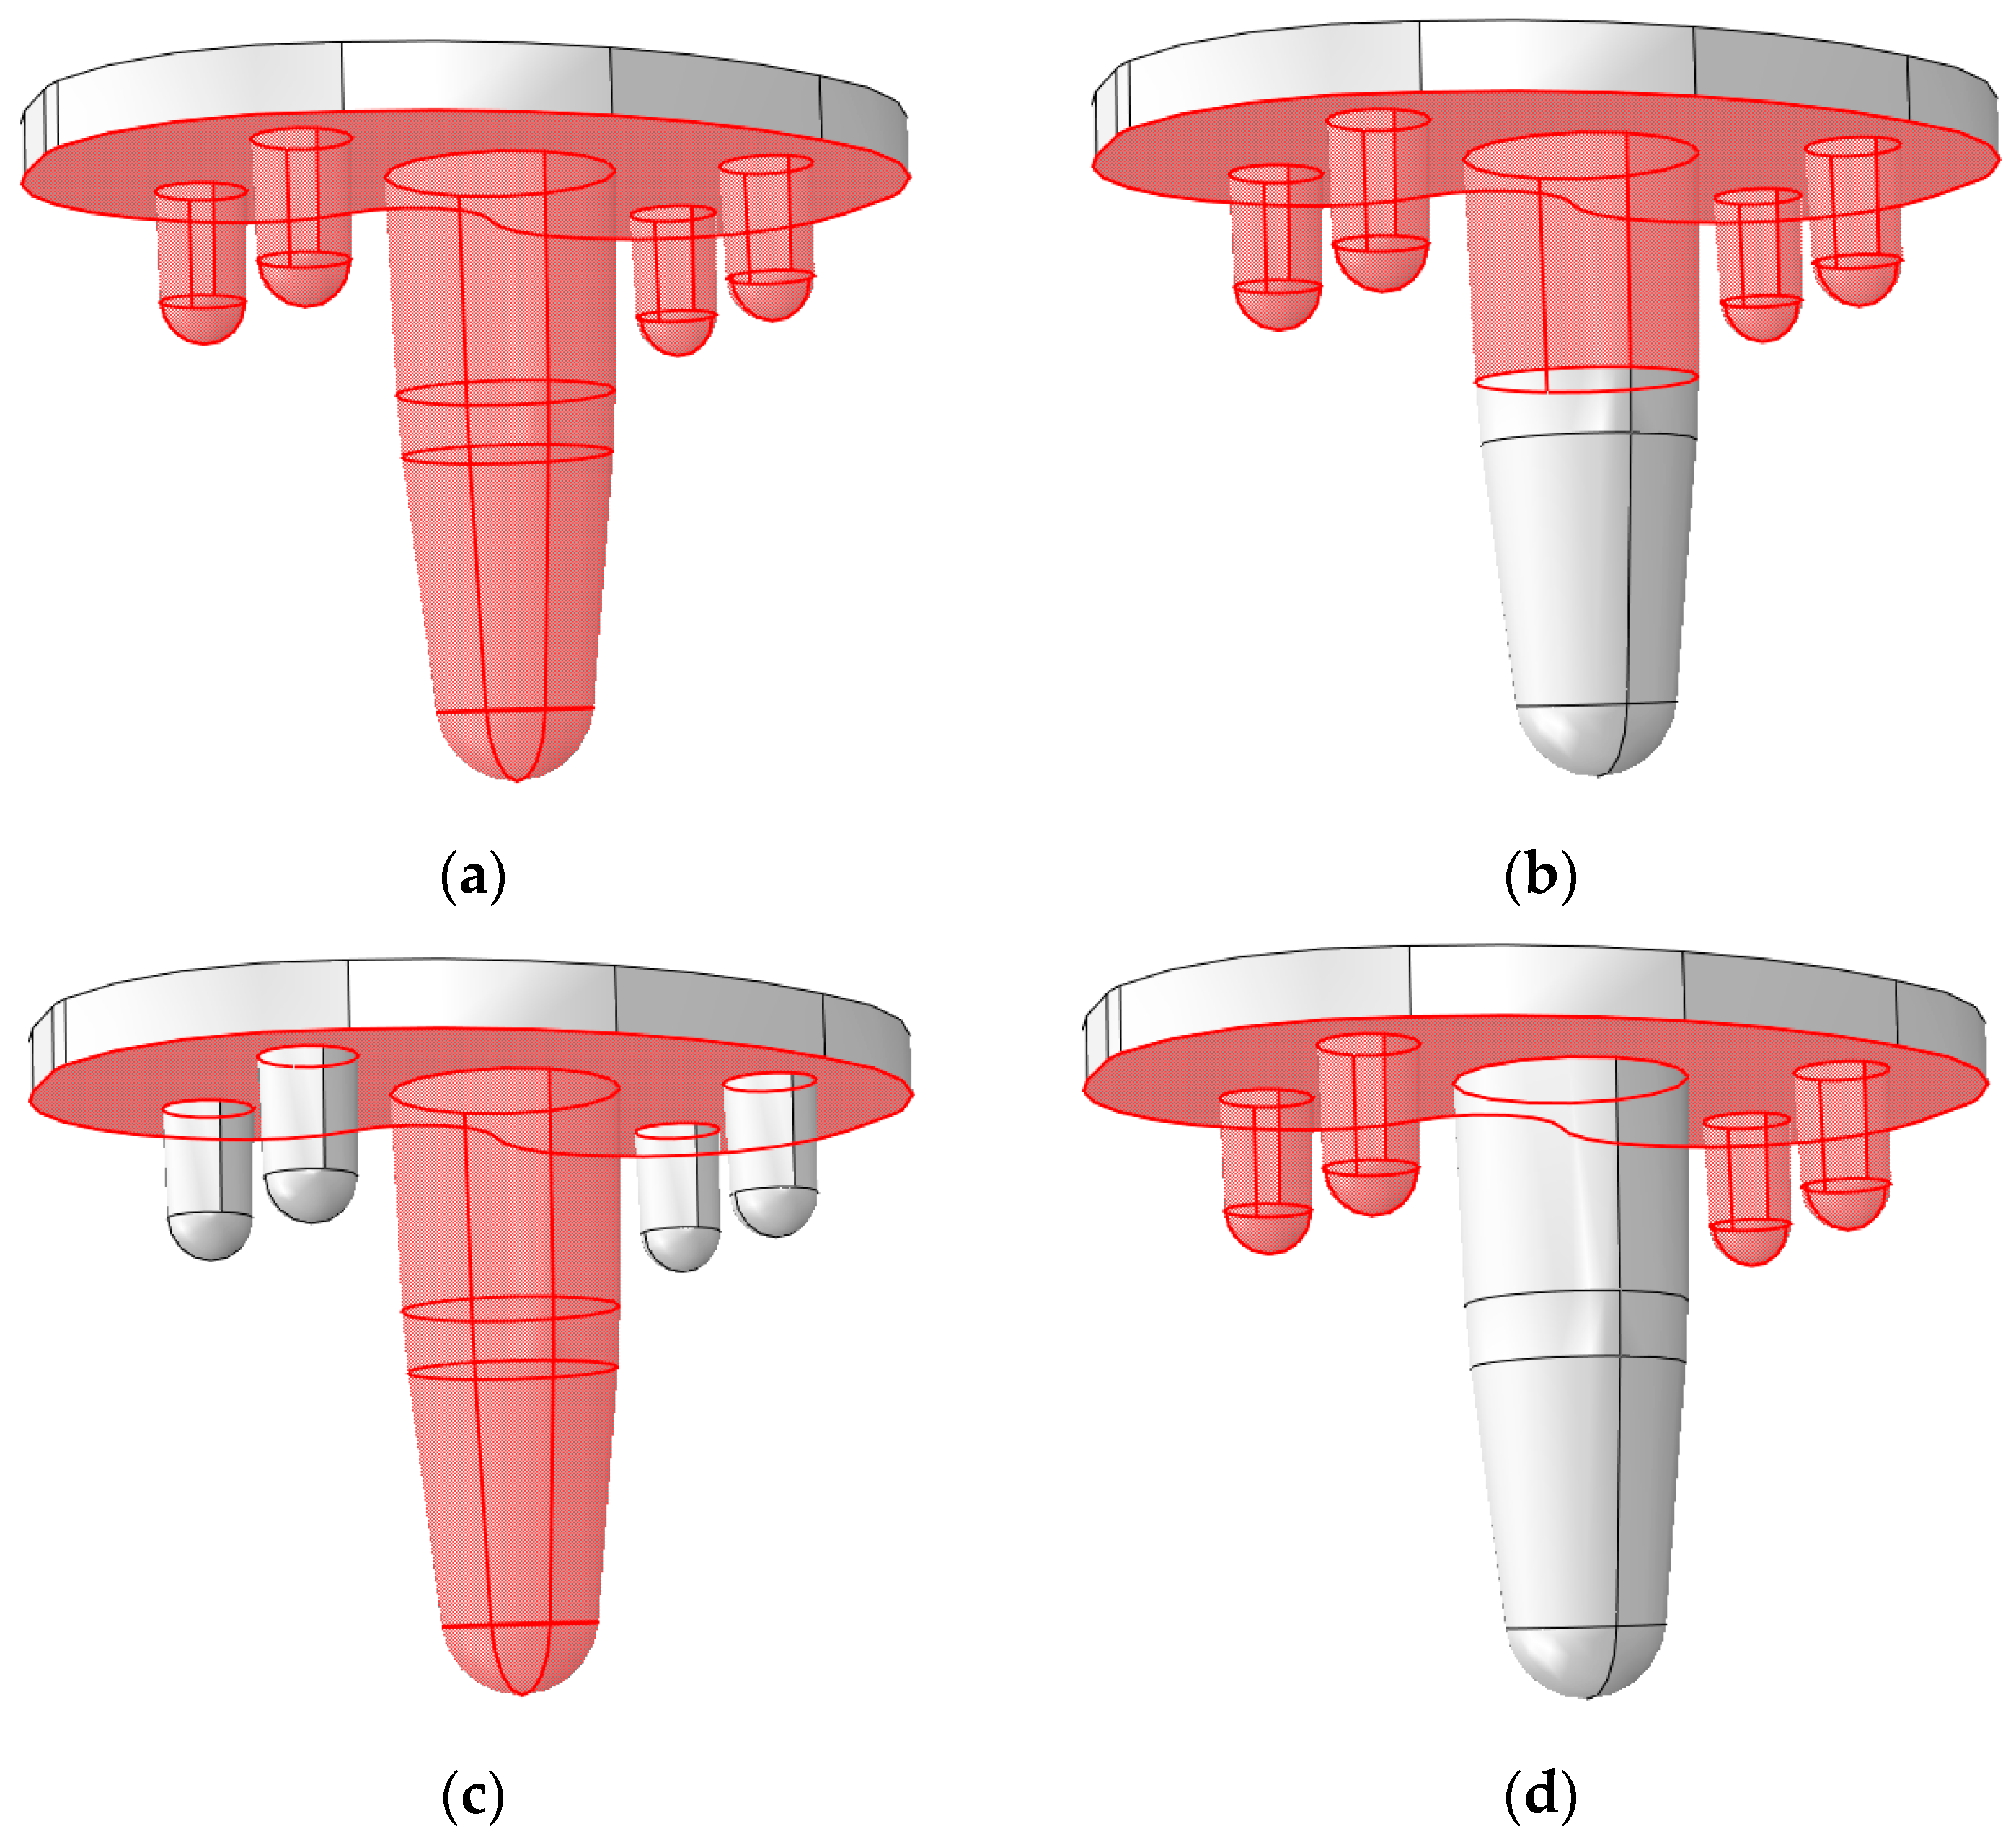
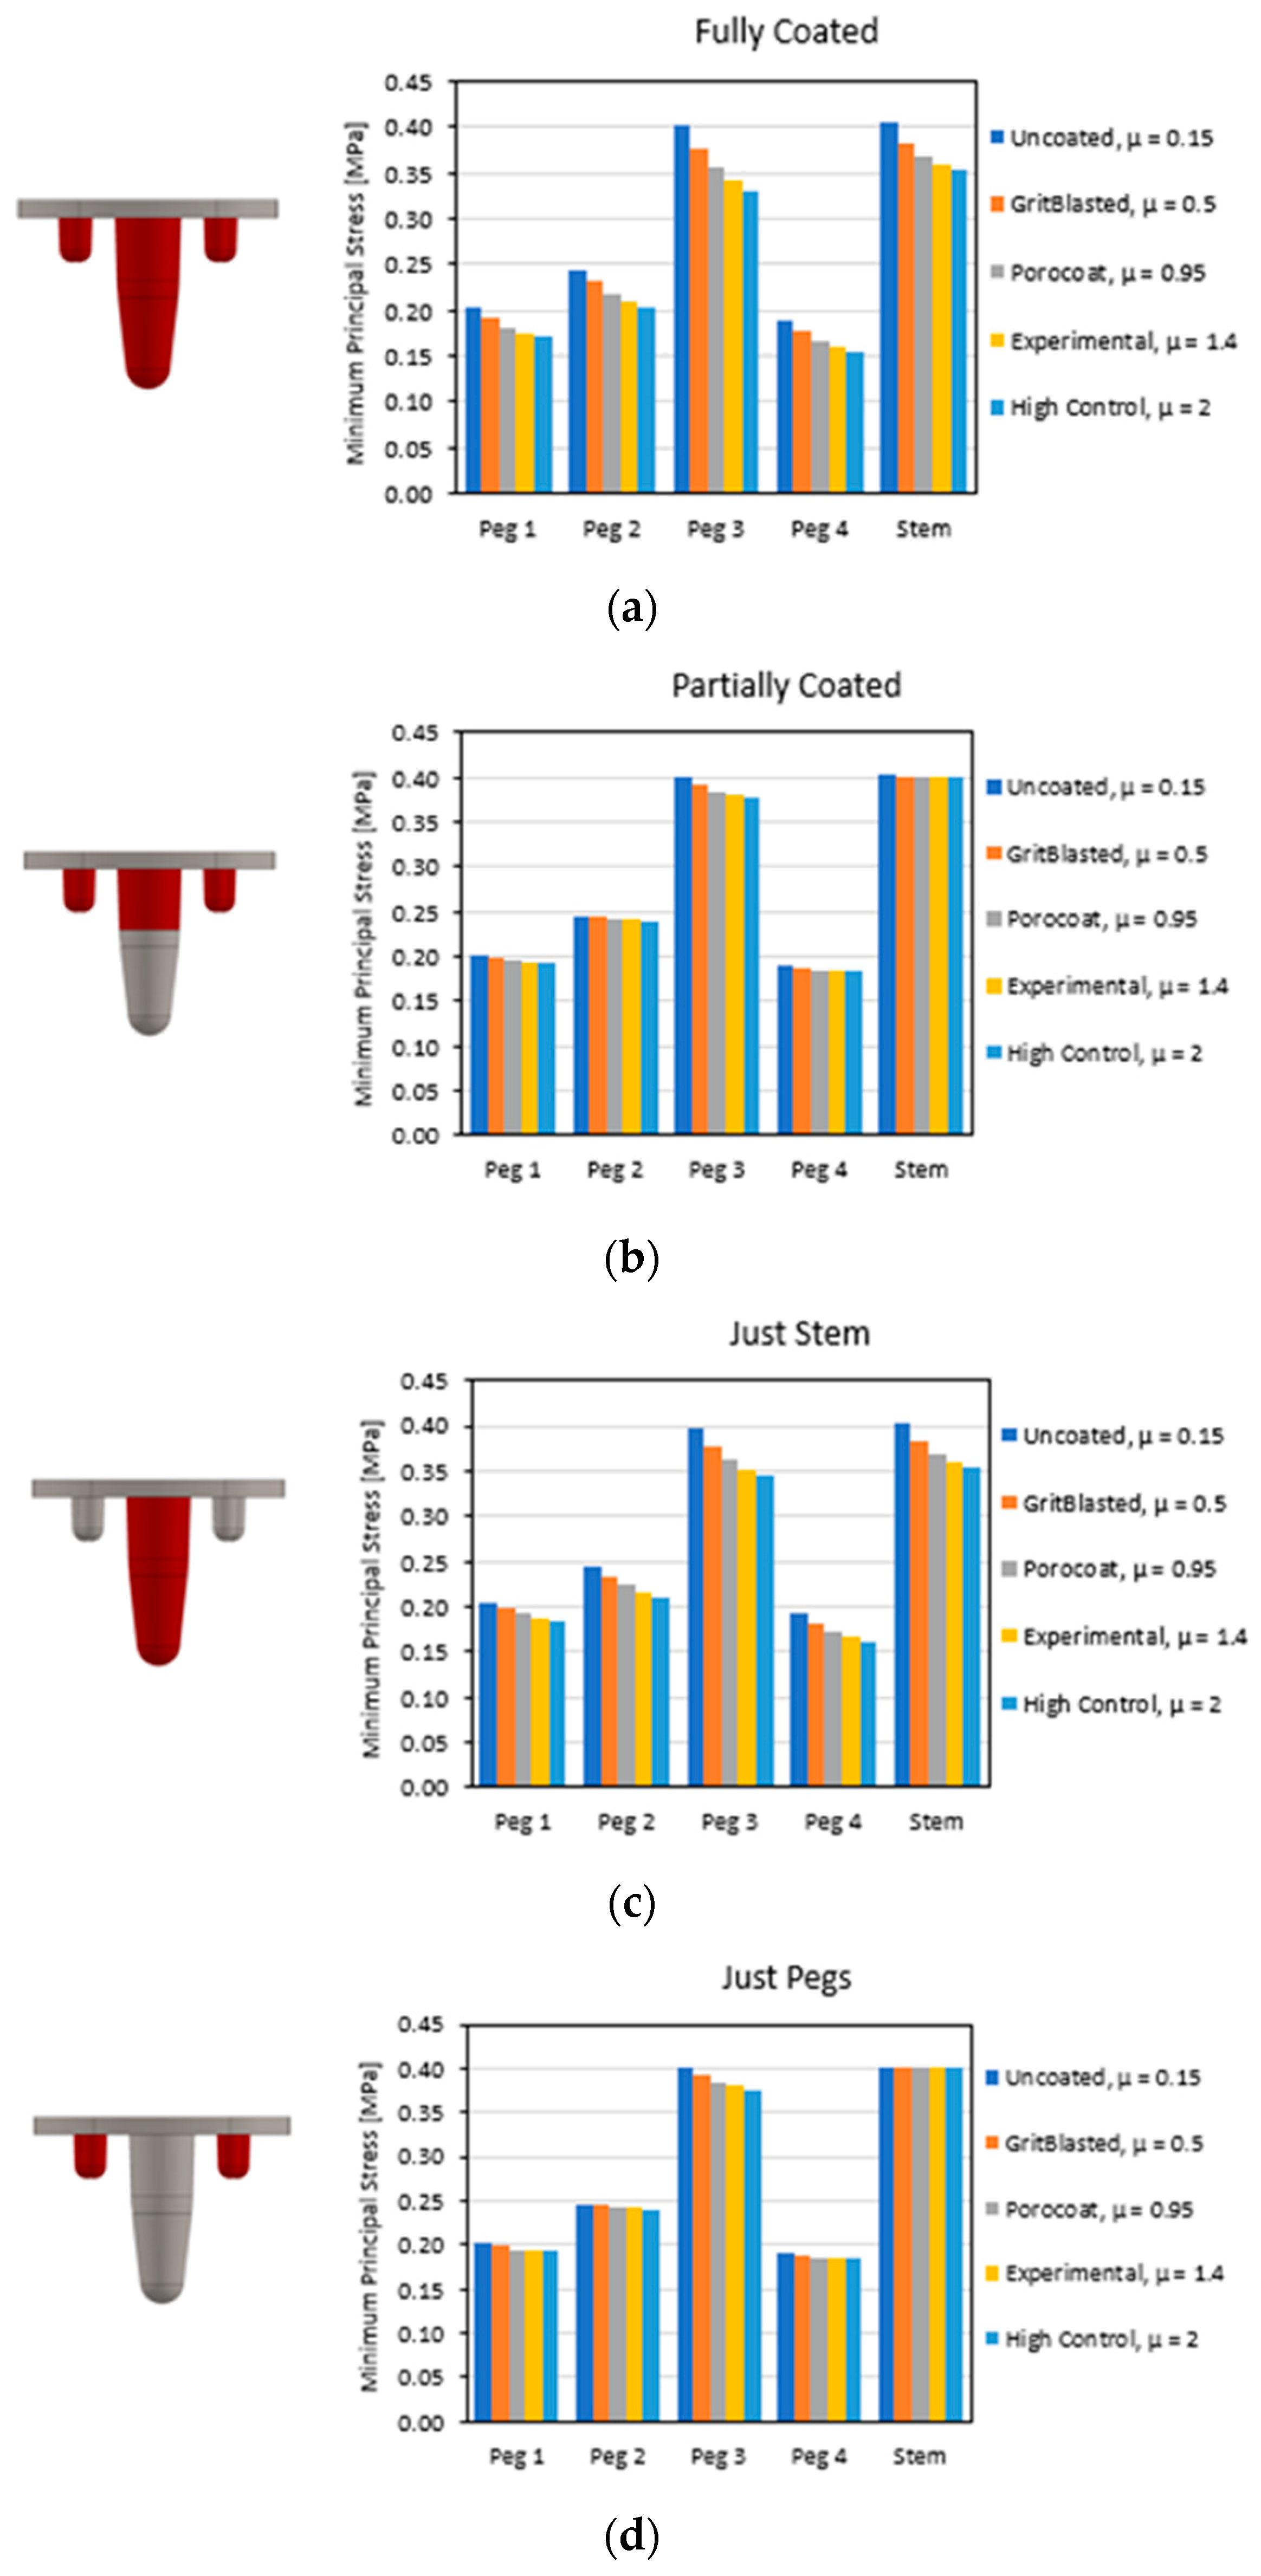
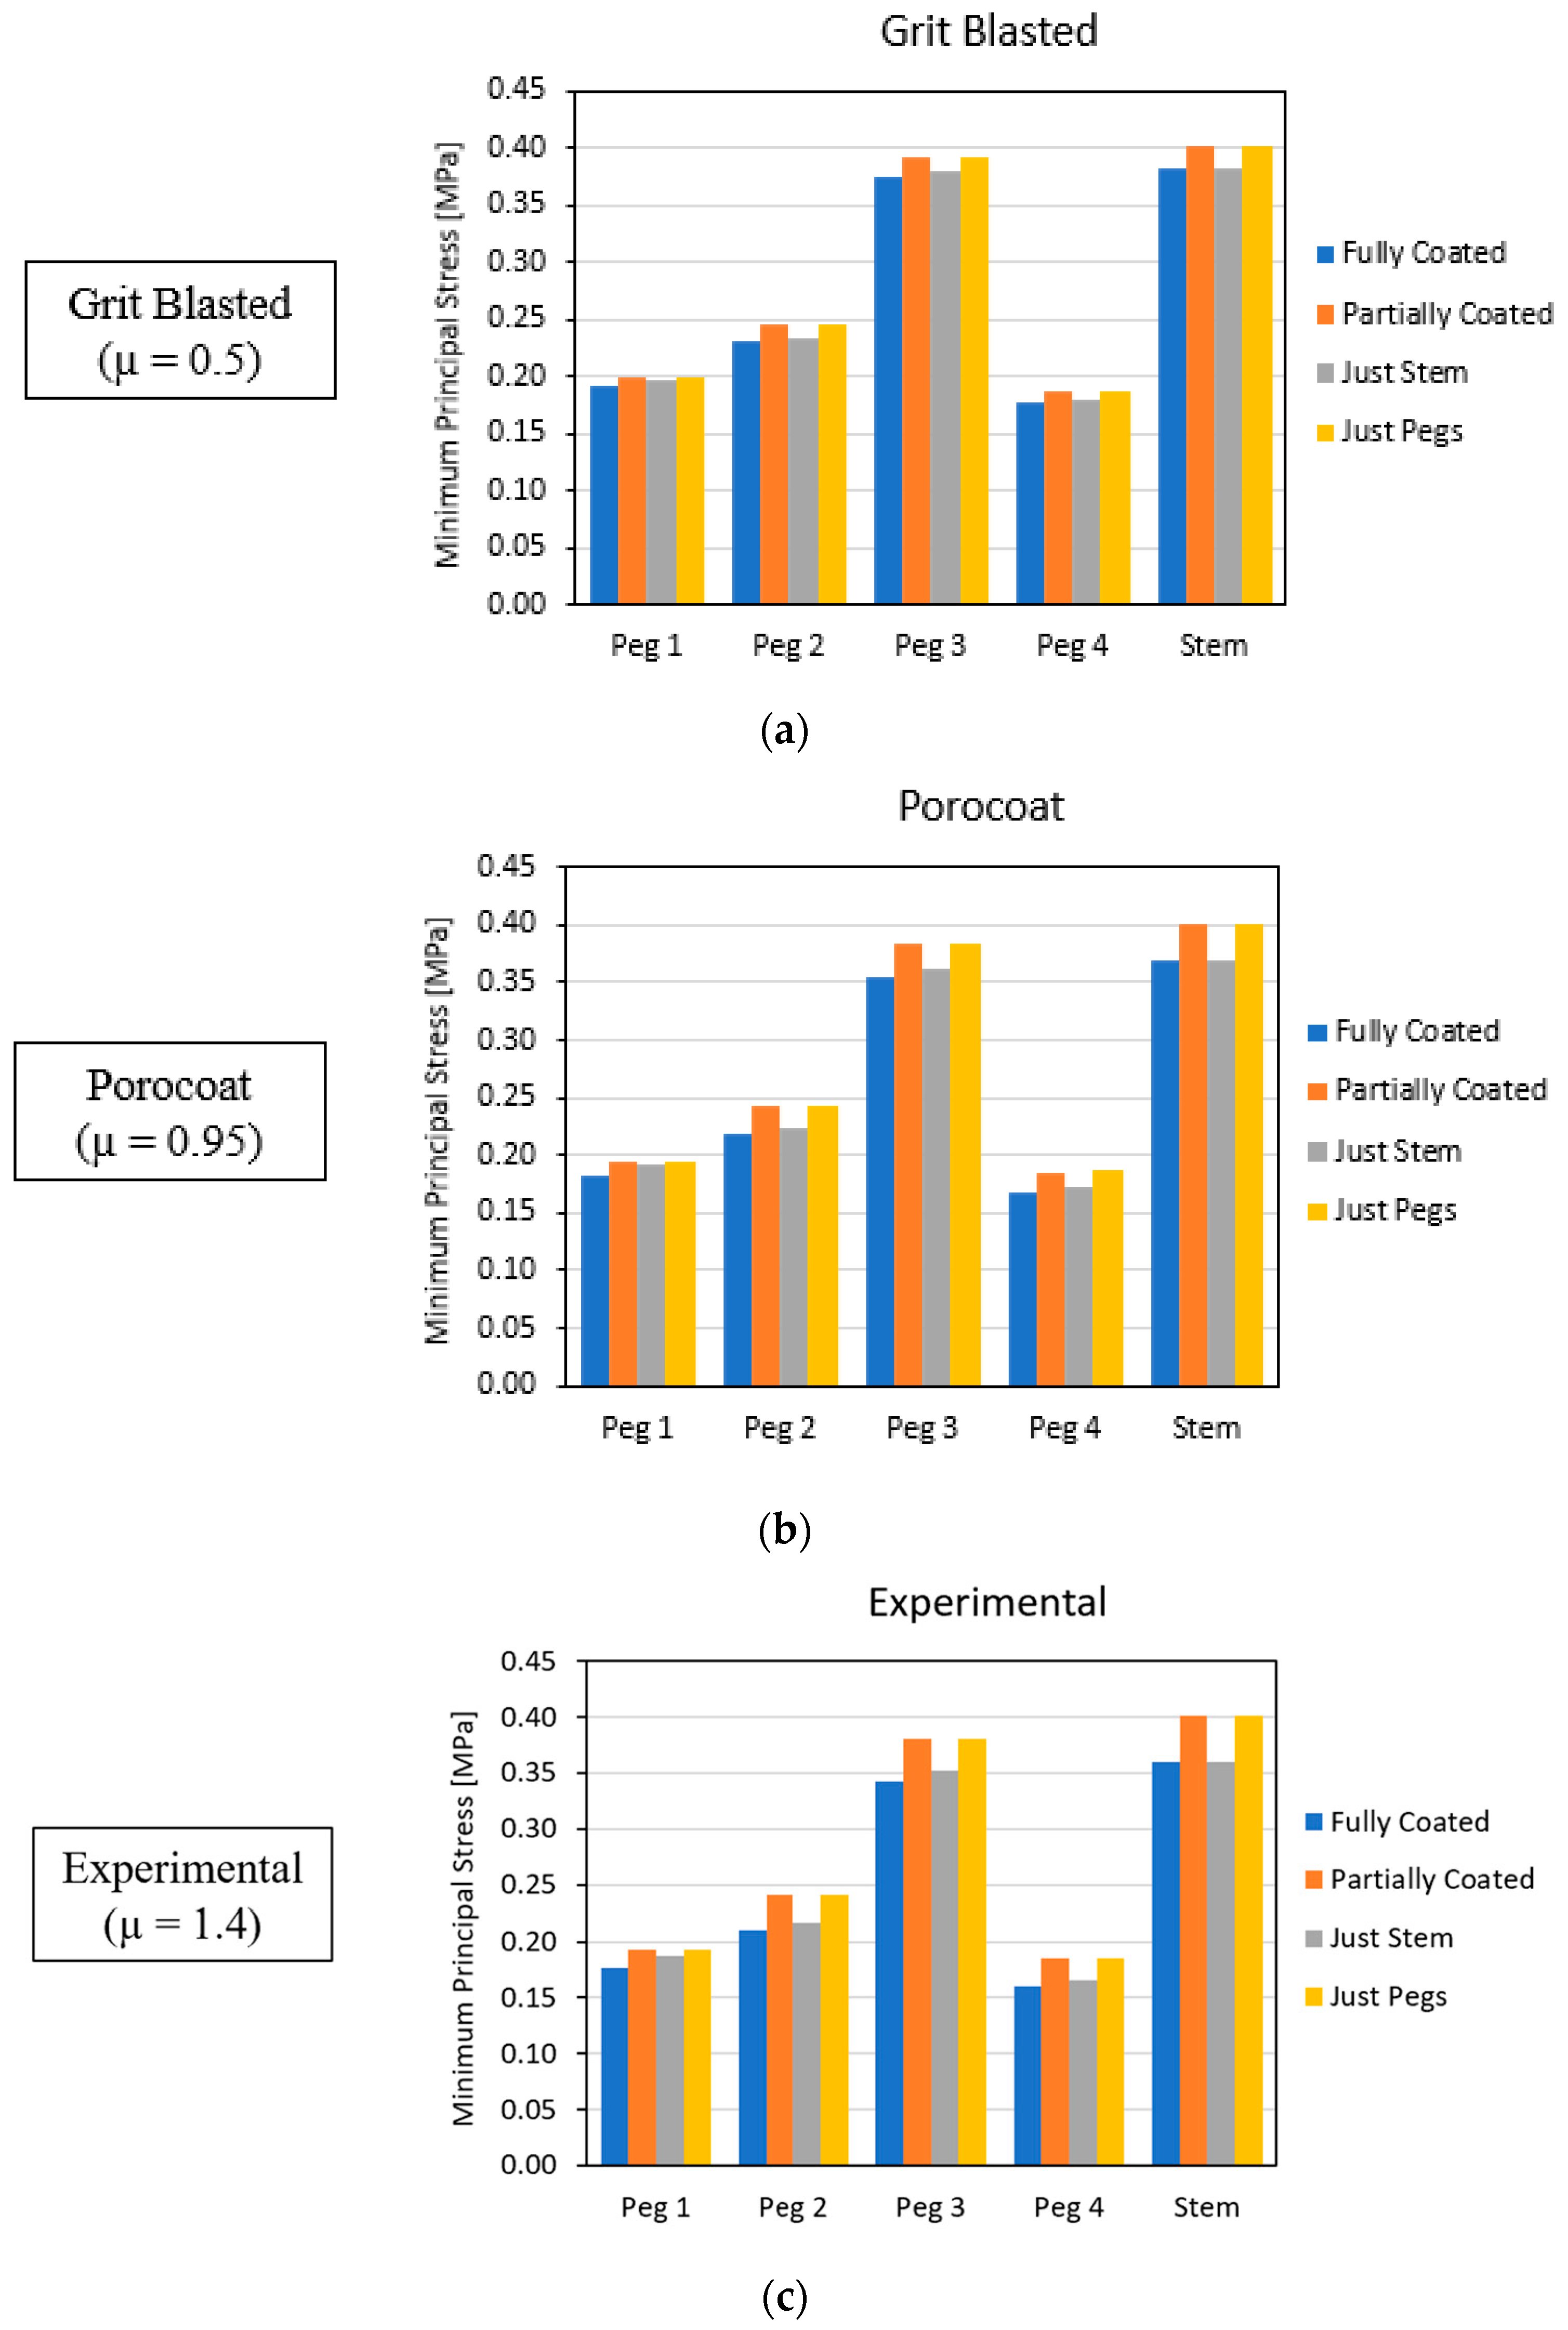
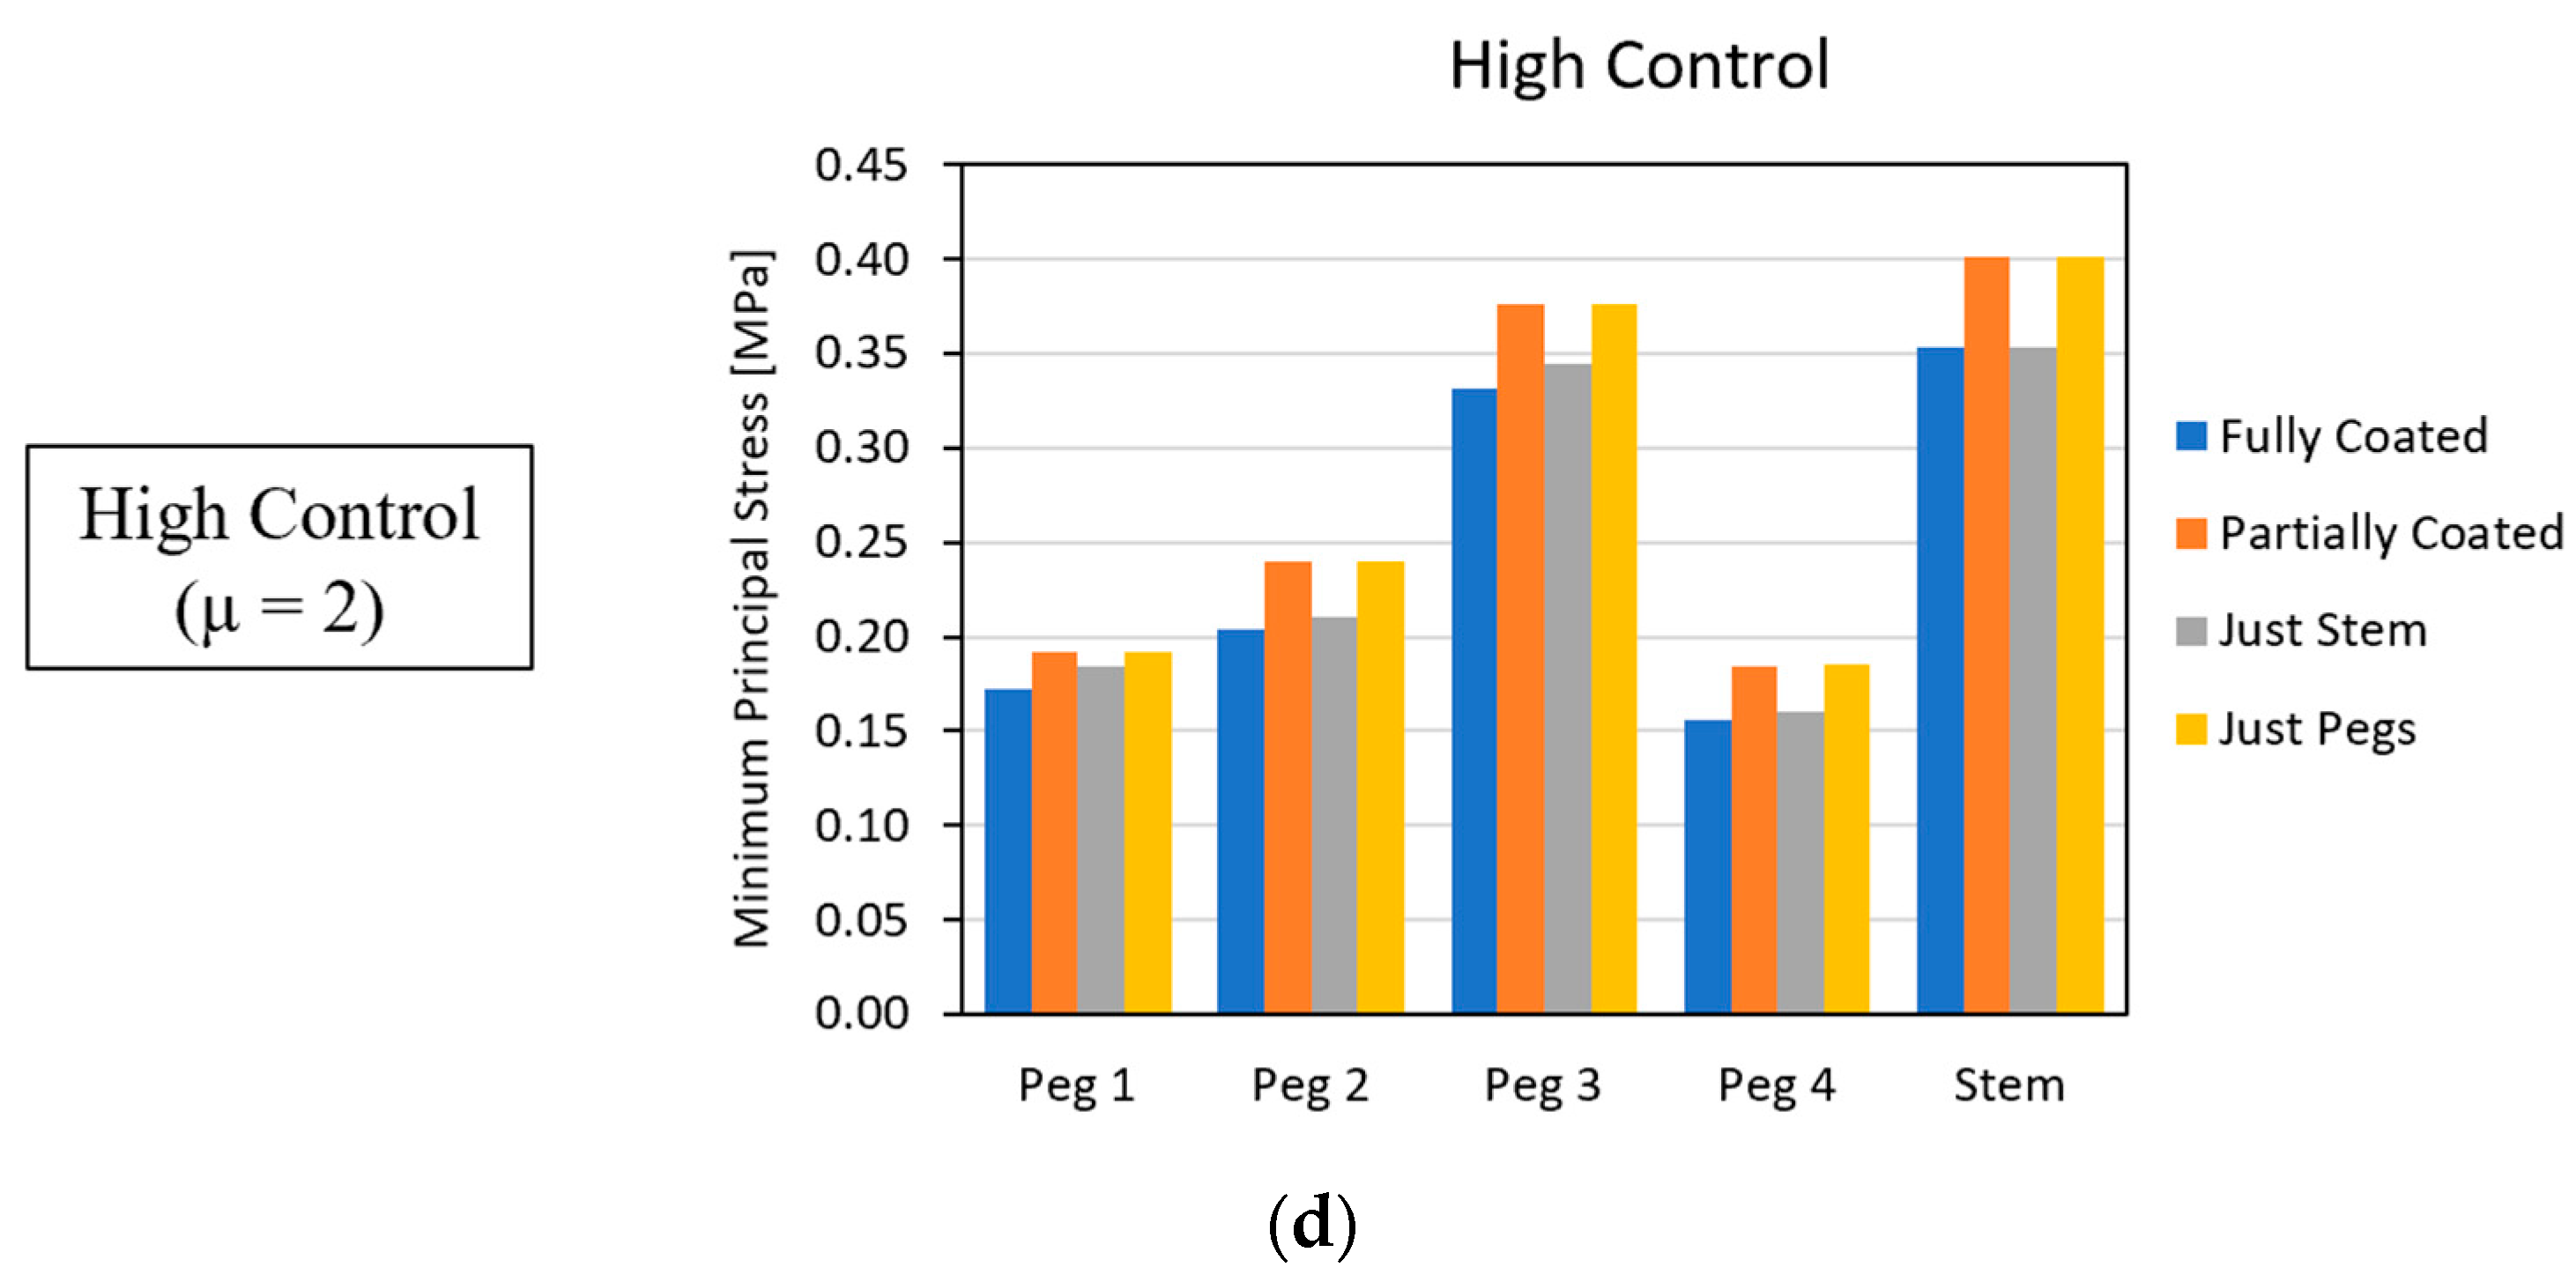
2.6. Configurations
2.7. Post-Processing
3. Results
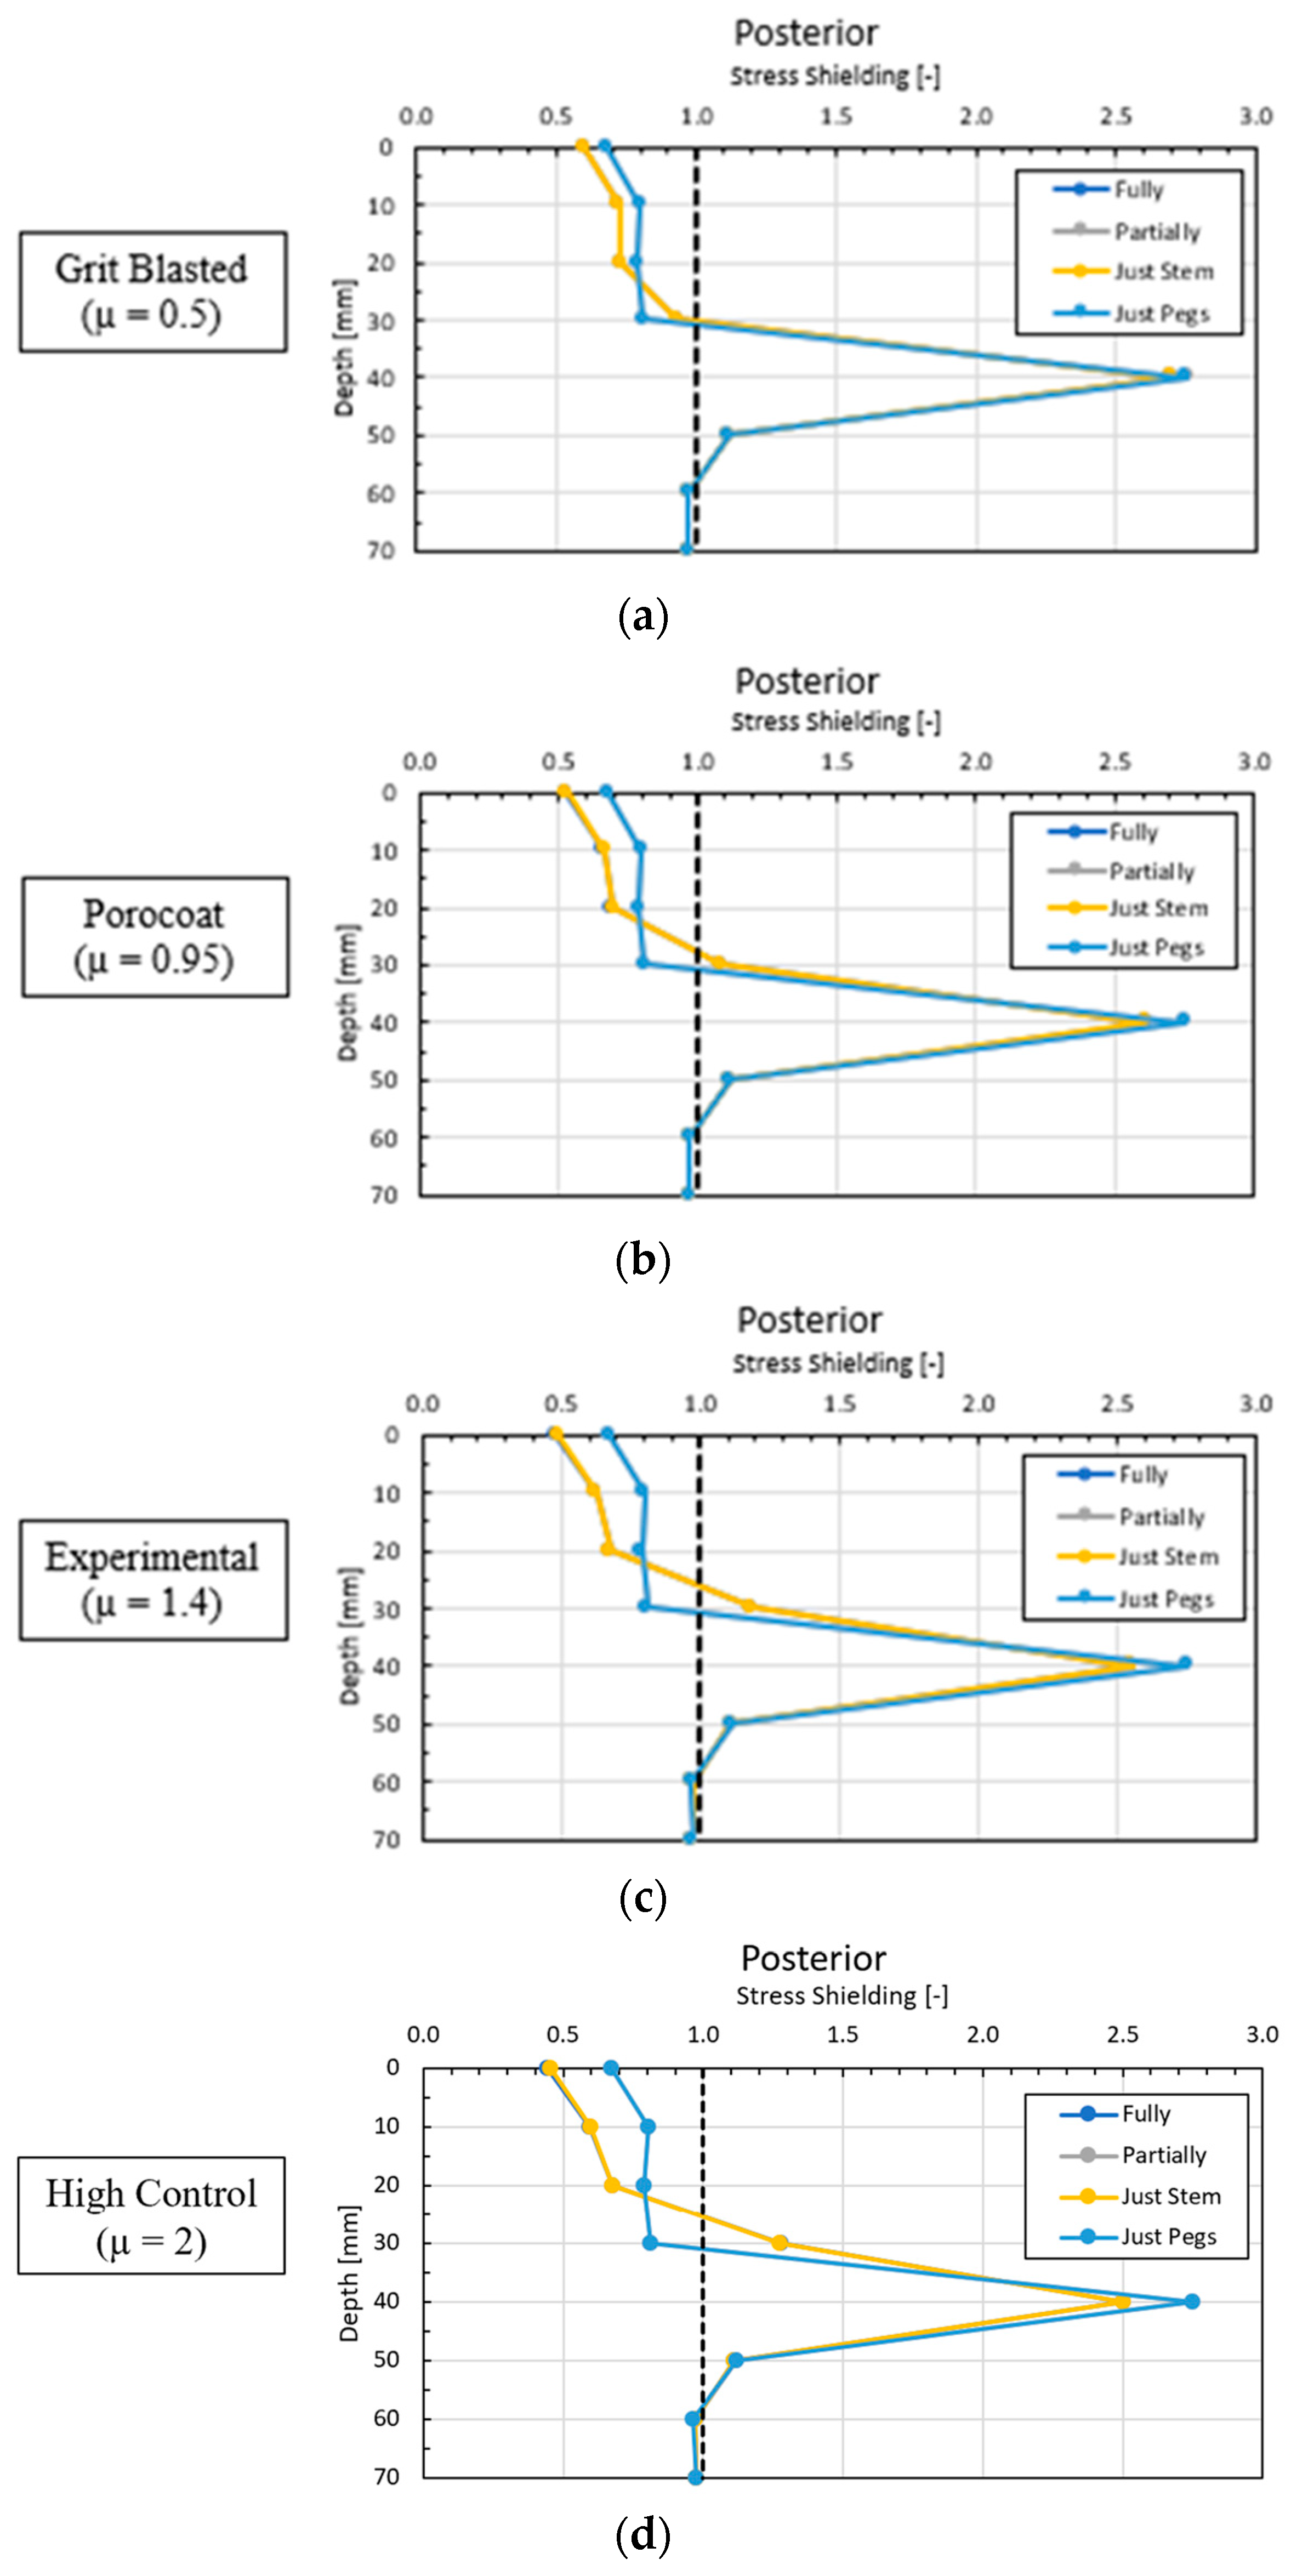
3.1. Global Results: Optimal Coefficient of Friction
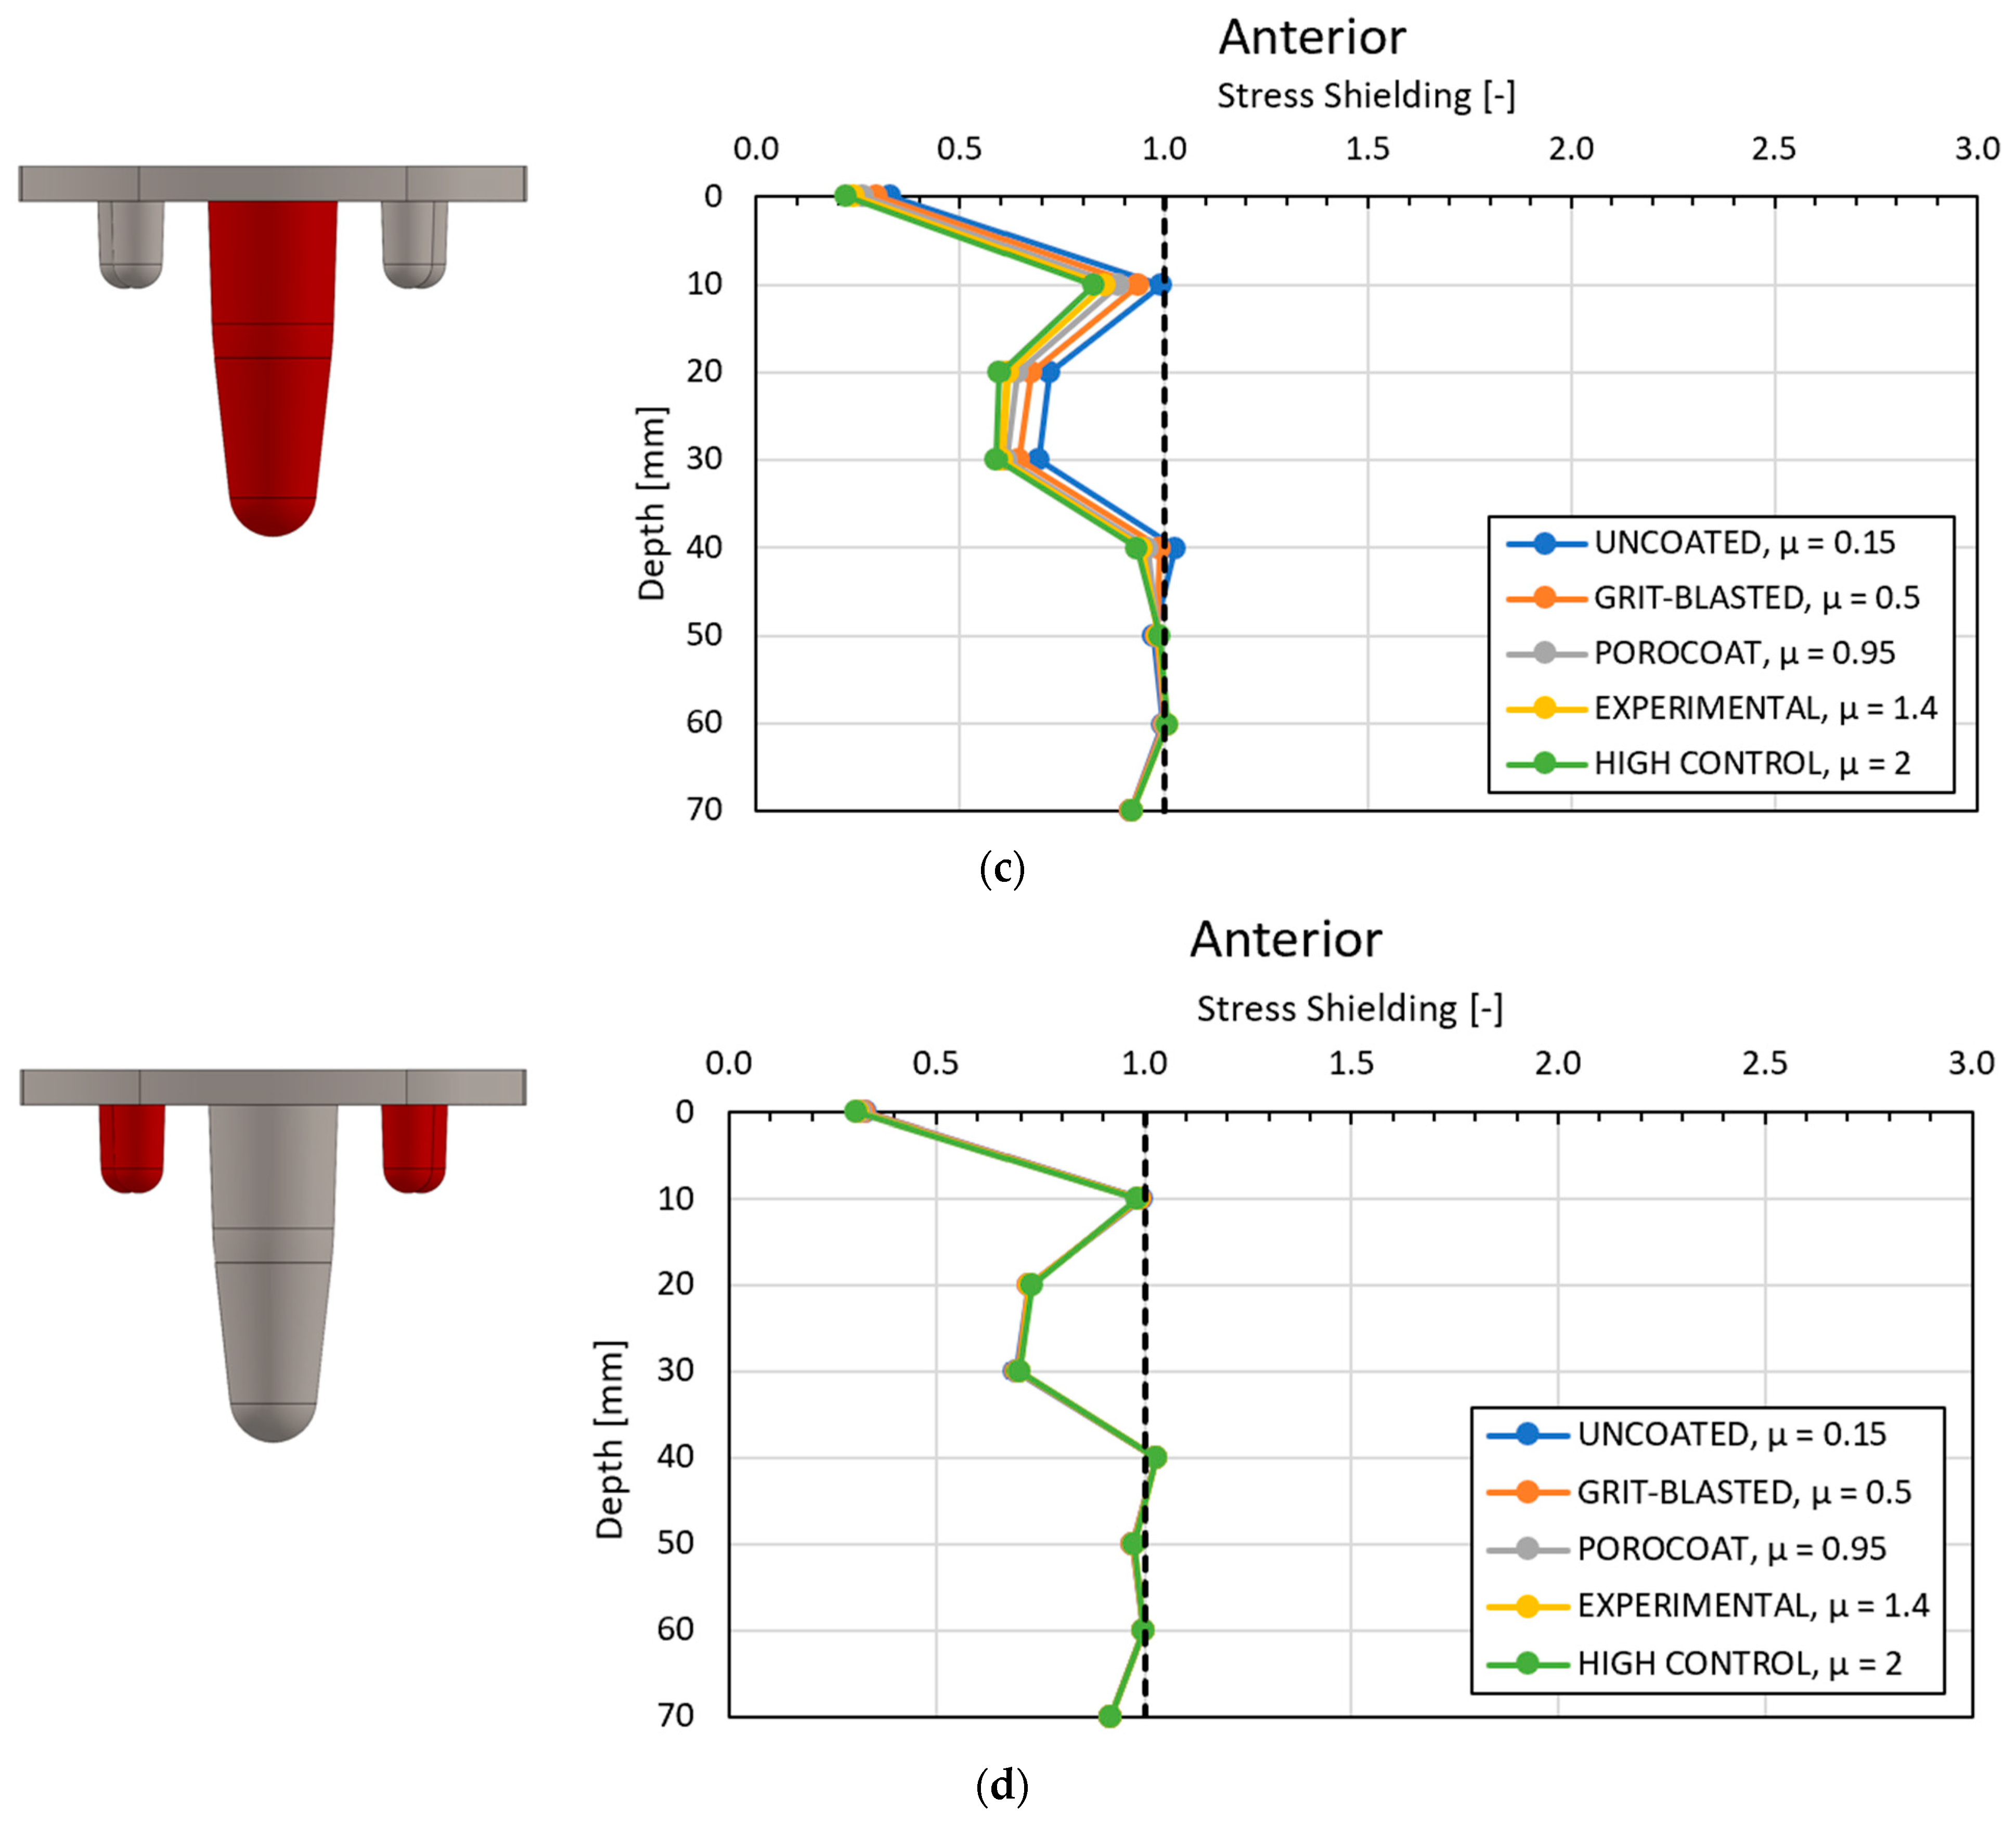
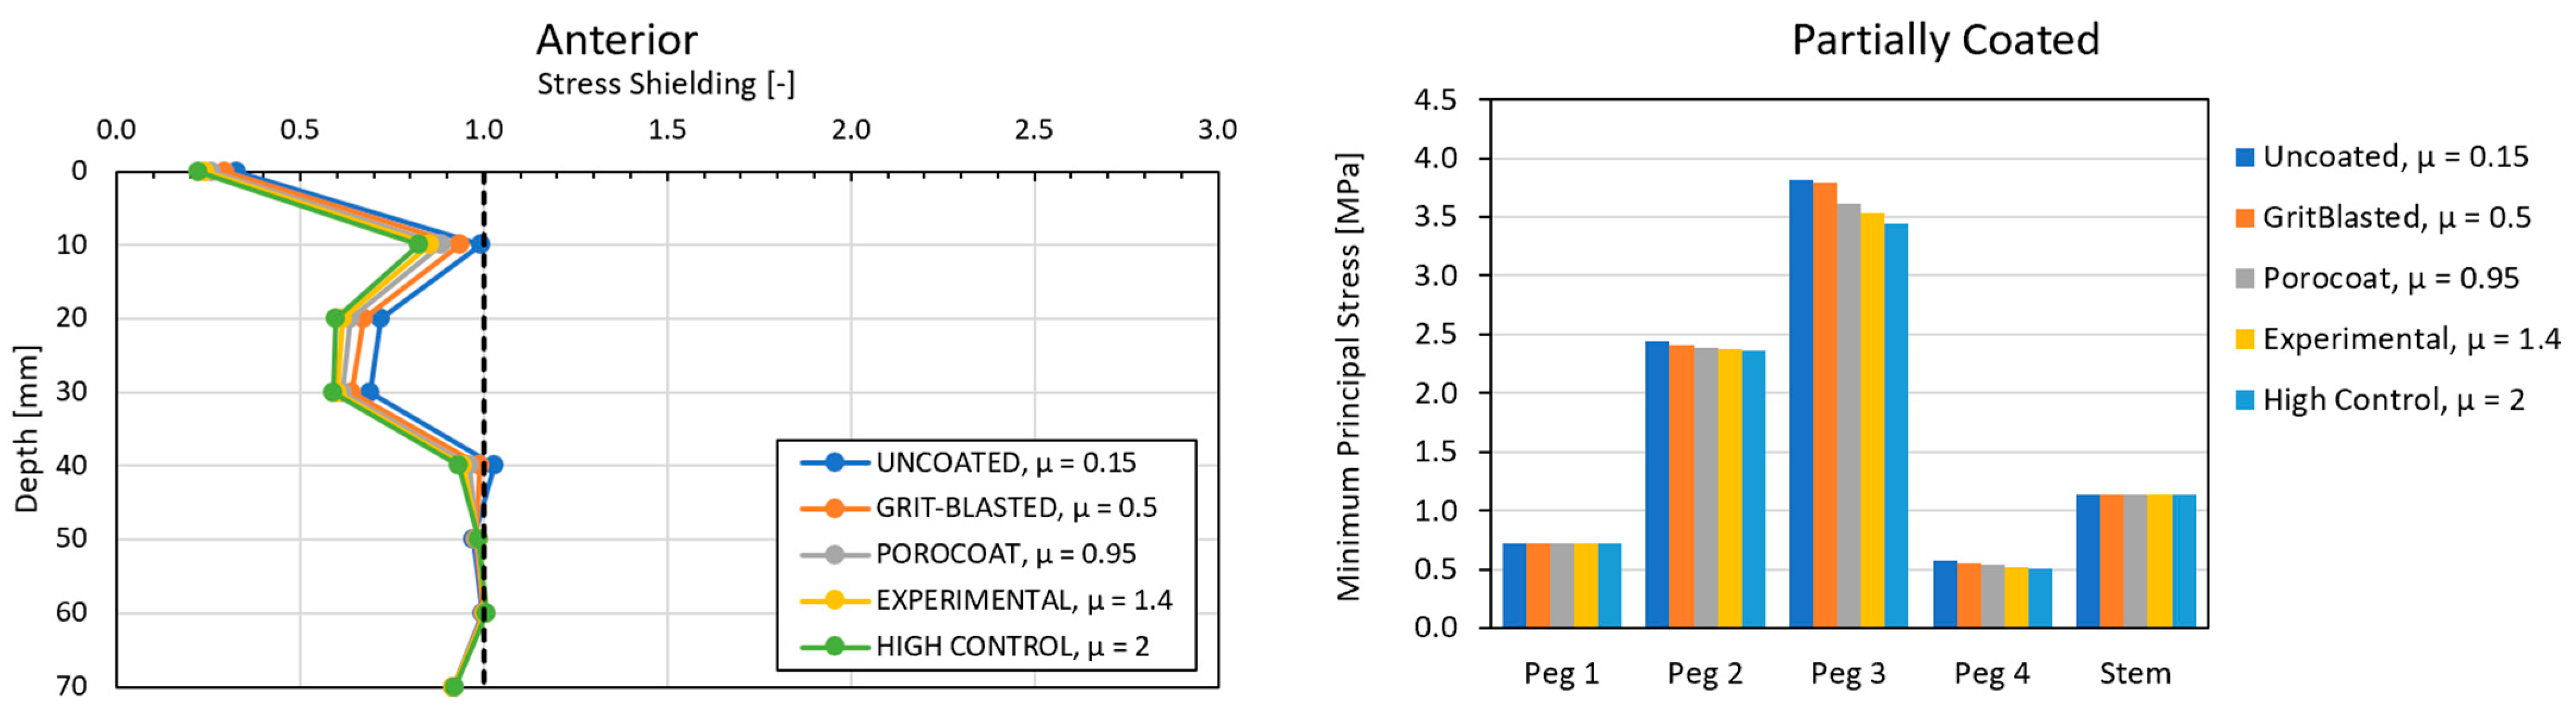
3.2. Global Results: Optimal Coating Location
3.3. Local Results: Optimal Coefficient of Friction
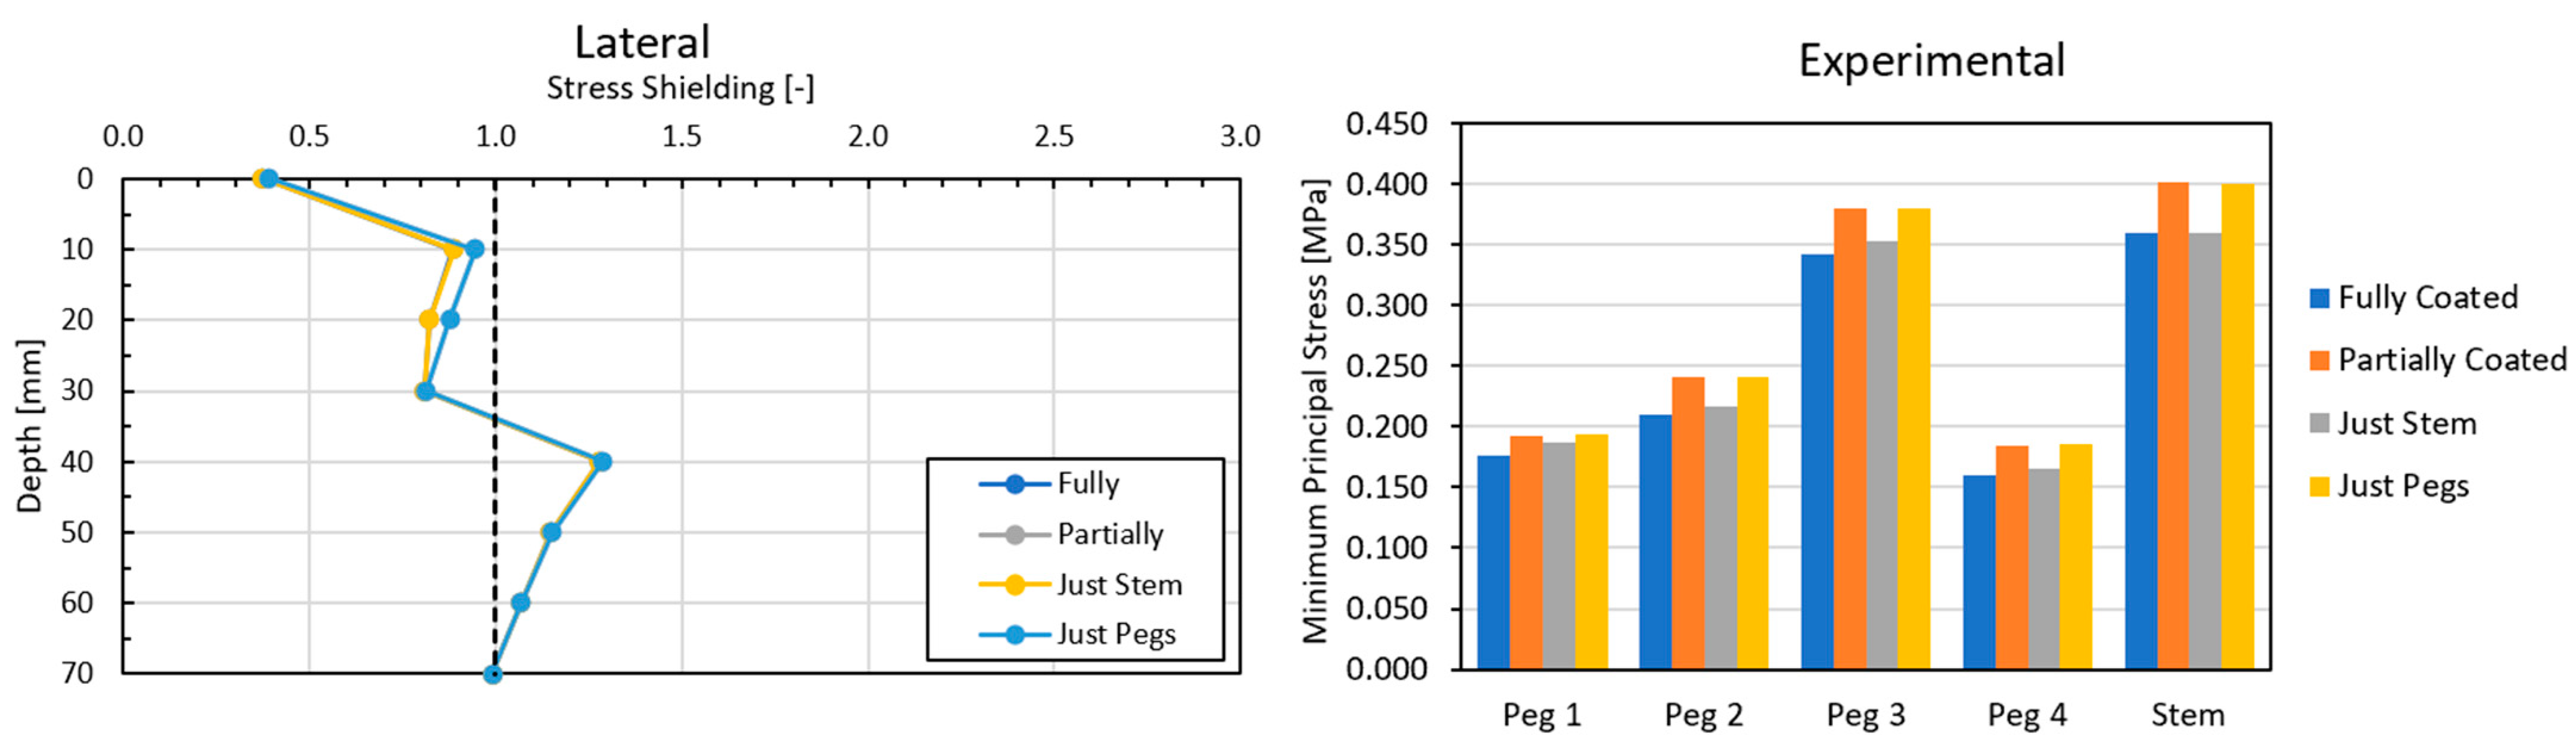
3.4. Local Results: Optimal Coating Location
4. Discussion
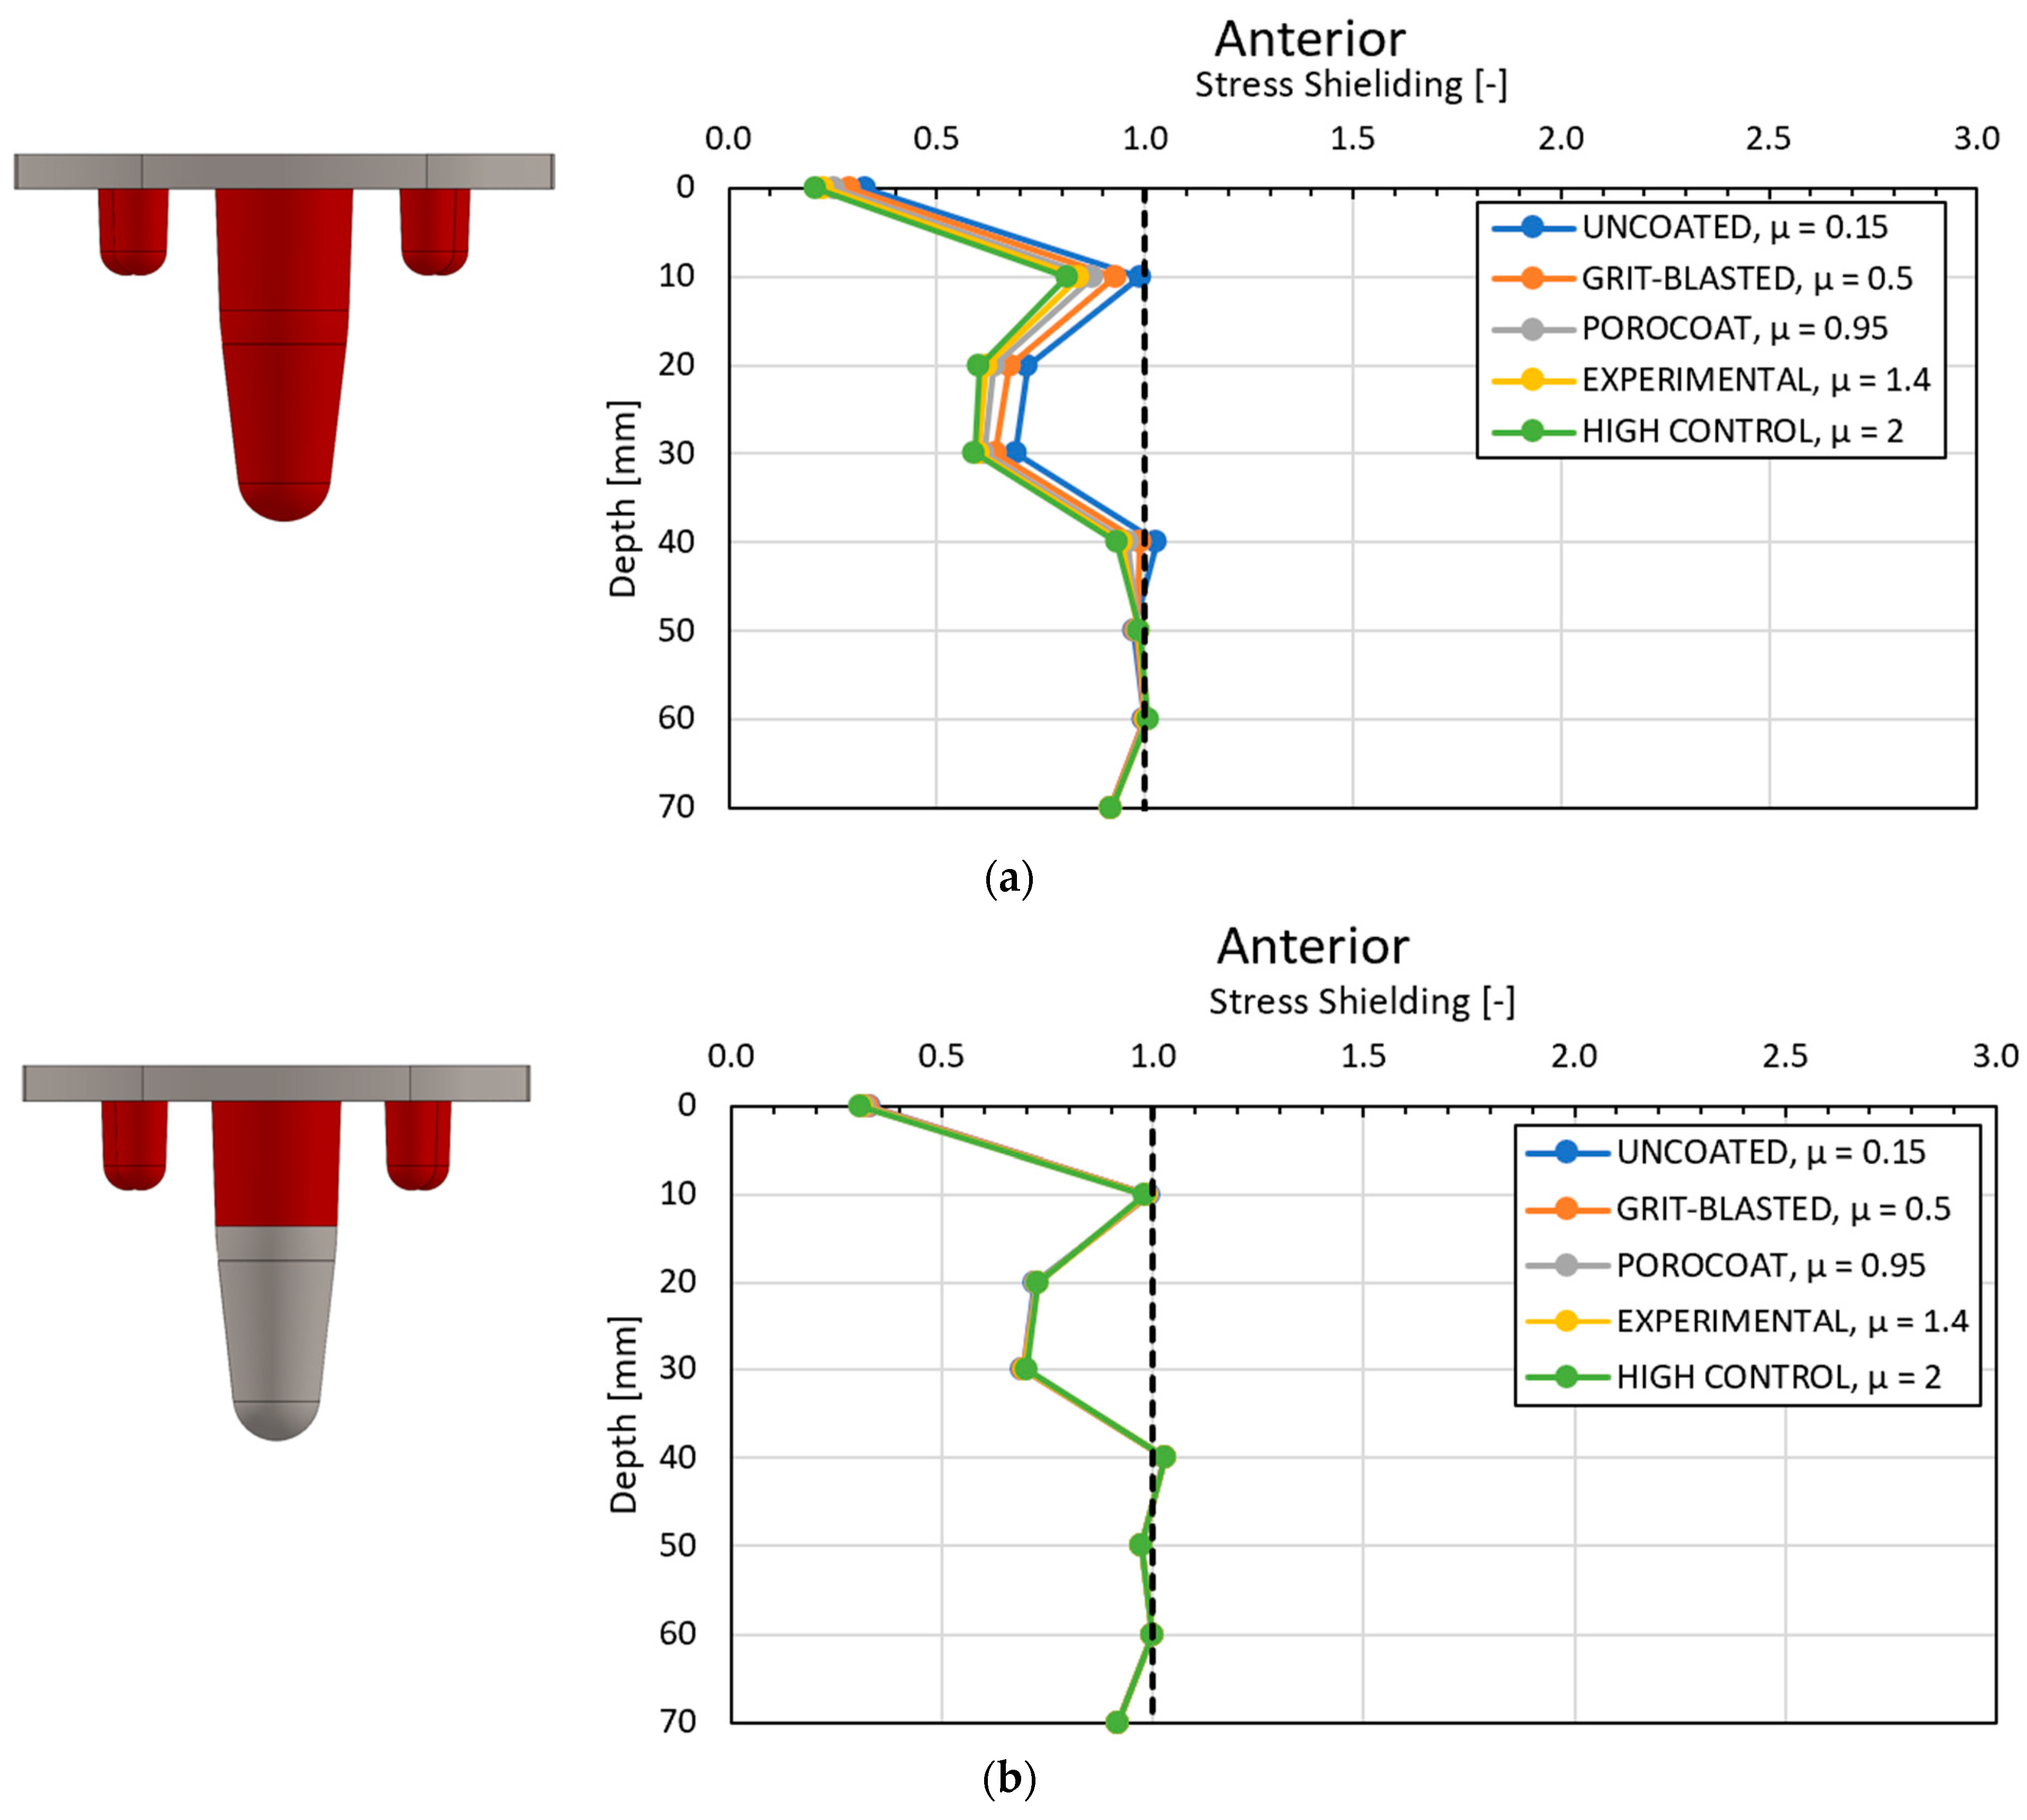
4.1. Stress-Shielding Results
4.2. Similarity between Configurations
4.3. Global and Local Results
4.3.1. Optimal Coefficient of Friction
4.3.2. Optimal Coating Location
5. Conclusions
Author Contributions
Funding
Institutional Review Board Statement
Informed Consent Statement
Data Availability Statement
Conflicts of Interest
References
- Pabinger, C.; Lothaller, H.; Geissler, A. Utilization rates of knee-arthroplasty in OECD countries. Osteoarthr. Cartil. 2015, 23, 1664–1673. [Google Scholar] [CrossRef] [PubMed]
- Memtsoudis, S.G.; della Valle, A.G.; Besculides, M.C.; Gaber, L.; Demographics, R.L.T.I.; Profiles, C. In-Hospital Complications and Mortality Associated with Primary Knee Arthroplasty. J. Arthroplast. 2009, 24, 518–527. [Google Scholar] [CrossRef]
- Schrurs, W.B.; Hannink, G. Total joint arthroplasty in younger patients: Heading for trouble? Lancet 2017, 389, 1410–1423. [Google Scholar] [CrossRef] [PubMed]
- Forlenza, E.M.; Serino, J., 3rd; Terhune, E.B.; Weintraub, M.T.; Nam, D.; Della Valle, C.J. Cementless Total Knee Arthroplasty is Associated With Early Aseptic Loosening in a Large National Database. J. Arthroplast. 2023, 38, S215–S220. [Google Scholar] [CrossRef] [PubMed]
- Lum, Z.C.; Shieh, A.K.; Dorr, L.D. Why total knees fail-A modern perspective review. World J. Orthop. 2018, 9, 60–64. [Google Scholar] [CrossRef] [PubMed]
- American Academy of Orthopaedic Surgeons (AAOS); American Joint Replacement Registry (AJRR). 2019 Annual Report; American Academy of Orthopaedic Surgeons: Rosement, IL, USA, 2019. [Google Scholar]
- Kamath, A.F.; Siddiqi, A.; Malkani, A.L.; Krebs, V.E. Cementless Fixation in Primary Total Knee Arthroplasty: Historical Perspective to Contemporary Application. J. Am. Acad. Orthop. Surg. 2021, 29, e363–e379. [Google Scholar] [CrossRef] [PubMed]
- Matassi, F.; Carulli, C.; Civinini, R.; Innocenti, M. Cemented versus cementless fixation in total knee arthroplasty. Joints 2014, 1, 121–125. [Google Scholar] [CrossRef] [PubMed]
- Fenton, P.; Al-Nammari, S.; Blundell, C.; Davies, M. The patterns of injury and management of cuboid fractures A RETROSPECTIVE CASE SERIES. Bone Jt. J. 2016, 98B, 1003–1008. [Google Scholar] [CrossRef]
- van der List, J.P.; Sheng, D.L.; Kleeblad, L.J.; Chawla, H.; Pearle, A.D. Outcomes of cementless unicompartmental and total knee arthroplasty: A systematic review. Knee 2017, 24, 497–507. [Google Scholar] [CrossRef]
- Bahraminasab, M.; Sahari, B.B.; Edwards, K.L.; Farahmand, F.; Arumugam, M. Aseptic loosening of femoral components—Materials engineering and design considerations. Mater Des. 2013, 44, 155–163. [Google Scholar] [CrossRef]
- Damm, N.B.; Morlock, M.M.; Bishop, N.E. Friction coefficient and effective interference at the implant-bone interface. J. Biomech. 2015, 48, 3517–3521. [Google Scholar] [CrossRef] [PubMed]
- Sánchez, E.; Schilling, C.; Grupp, T.M.; Giurea, A.; Wyers, C.; van den Bergh, J.; Verdonschot, N.; Janssen, D. The effect of different interference fits on the primary fixation of a cementless femoral component during experimental testing. J. Mech. Behav. Biomed. Mater. 2021, 113, 104189. [Google Scholar] [CrossRef] [PubMed]
- Berahmani, S.; Janssen, D.; Wolfson, D.; Rivard, K.; de Waal Malefijt, M.; Verdonschot, N. The effect of surface morphology on the primary fixation strength of uncemented femoral knee prosthesis: A cadaveric study. J. Arthroplast. 2015, 30, 300–307. [Google Scholar] [CrossRef]
- de Vries, E.; Sánchez, E.; Janssen, D.; Matthews, D.; van der Heide, E. Predicting friction at the bone–Implant interface in cementless total knee arthroplasty. J. Mech. Behav. Biomed. Mater. 2022, 128, 105103. [Google Scholar] [CrossRef] [PubMed]
- Berahmani, S.; Janssen, D.; Verdonschot, N. Experimental and computational analysis of micromotions of an uncemented femoral knee implant using elastic and plastic bone material models. J. Biomech. 2017, 61, 137–143. [Google Scholar] [CrossRef] [PubMed]
- Morrison, I.B. The mechanics of the knee joint in relation to normal walking. J. Biomech. 1970, 3, 51–61. [Google Scholar] [CrossRef] [PubMed]
- Walpole, S.C.; Prieto-Merino, D.; Edwards, P.; Cleland, J.; Stevens, G.; Roberts, I. The weight of nations: An estimation of adult human biomass. BMC Public Health 2012, 12, 439. [Google Scholar] [CrossRef] [PubMed]
- Zhao, D.; Banks, S.A.; D’Lima, D.D.; Colwell, C.W.; Fregly, B.J. In vivo medial and lateral tibial loads during dynamic and high flexion activities. J. Orthop. Res. 2007, 25, 593–602. [Google Scholar] [CrossRef] [PubMed]
- Fukubayashi, T.; Kurosawa, H. The contact area and pressure distribution pattern of the knee: A study of normal and osteoarthrotic knee joints. Acta Orthop. 1980, 51, 871–879. [Google Scholar] [CrossRef]
- Completo, A.; Talaia, P.; Fonseca, F.; Simões, J.A. Relationship of design features of stemmed tibial knee prosthesis with stress shielding and end-of-stem pain. Mater Des. 2009, 30, 1391–1397. [Google Scholar] [CrossRef]
- Au, A.G.; Liggins, A.B.; Raso, V.J.; Amirfazli, A. A parametric analysis of fixation post shape in tibial knee prostheses. Med. Eng. Phys. 2005, 27, 123–134. [Google Scholar] [CrossRef] [PubMed]


| Geometric Feature | Dimension |
|---|---|
| Stem | Diameter: ~14.7 mm Length: ~40 mm |
| Pegs | Diameter: 6 mm Length: 10 mm |
| Baseplate | Thickness: 4 mm |
| Material | Young’s Modulus (GPa) | Poisson’s Ratio |
|---|---|---|
| Titanium | 110 | 0.3 |
| Cortical bone | 14.2 | 0.3 |
| Trabecular bone | 1.75 | 0.3 |
| Description | Coefficient of Friction |
|---|---|
| Uncoated | 0.15 |
| Grit-blasted | 0.5 |
| Porocoat | 0.95 |
| DePuy Synthes experimental | 1.4 |
| High control | 2 |
Disclaimer/Publisher’s Note: The statements, opinions and data contained in all publications are solely those of the individual author(s) and contributor(s) and not of MDPI and/or the editor(s). MDPI and/or the editor(s) disclaim responsibility for any injury to people or property resulting from any ideas, methods, instructions or products referred to in the content. |
© 2024 by the authors. Licensee MDPI, Basel, Switzerland. This article is an open access article distributed under the terms and conditions of the Creative Commons Attribution (CC BY) license (https://creativecommons.org/licenses/by/4.0/).
Share and Cite
Hunt, P.J.; Noori, M.; Hazelwood, S.J.; Noori, N.B.; Altabey, W.A. A Study on the Effects of Cementless Total Knee Arthroplasty Implants’ Surface Morphology via Finite Element Analysis. BioMedInformatics 2024, 4, 1425-1440. https://doi.org/10.3390/biomedinformatics4020078
Hunt PJ, Noori M, Hazelwood SJ, Noori NB, Altabey WA. A Study on the Effects of Cementless Total Knee Arthroplasty Implants’ Surface Morphology via Finite Element Analysis. BioMedInformatics. 2024; 4(2):1425-1440. https://doi.org/10.3390/biomedinformatics4020078
Chicago/Turabian StyleHunt, Peter J., Mohammad Noori, Scott J. Hazelwood, Naudereh B. Noori, and Wael A. Altabey. 2024. "A Study on the Effects of Cementless Total Knee Arthroplasty Implants’ Surface Morphology via Finite Element Analysis" BioMedInformatics 4, no. 2: 1425-1440. https://doi.org/10.3390/biomedinformatics4020078
APA StyleHunt, P. J., Noori, M., Hazelwood, S. J., Noori, N. B., & Altabey, W. A. (2024). A Study on the Effects of Cementless Total Knee Arthroplasty Implants’ Surface Morphology via Finite Element Analysis. BioMedInformatics, 4(2), 1425-1440. https://doi.org/10.3390/biomedinformatics4020078