Article

Predicting Resistance to Immunotherapy in Melanoma, Glioblastoma, Renal, Stomach and Bladder Cancers by Machine Learning on Immune Profiles

by
Guillaume Mestrallet
Division of Hematology and Oncology, Hess Center for Science & Medicine, Tisch Cancer Institute, Icahn School of Medicine at Mount Sinai, New York, NY 10029, USA
Onco 2024, 4(3), 192-206; https://doi.org/10.3390/onco4030014
Submission received: 3 June 2024 / Revised: 5 August 2024 / Accepted: 15 August 2024 / Published: 20 August 2024

Abstract

:

Simple Summary

This study addresses the limitations of immune checkpoint inhibitors (ICBs) in cancer therapy, where over 38% of patients show resistance and disease progression. Analyzing diverse cancer types (melanoma, clear cell renal carcinoma, glioblastoma, bladder, and stomach cancers) undergoing ICB treatment, we identified several resistance mechanisms, including impaired macrophage and T cell responses, defective antigen presentation, and elevated levels of immunosuppressive molecules. Using these insights, we developed 20 machine learning models to predict responses and resistances to ICBs based on immune profiles. These models, which achieved accuracies between 0.79 and 1, leverage patient-specific immune profiles to forecast treatment outcomes. The study underscores the potential for personalized immunotherapy approaches, integrating computational models to tailor treatments based on individual immune characteristics and enhance the efficacy of ICBs in cancer care.

Abstract

Strategies for tackling cancer involve surgery, radiotherapy, chemotherapy, and immune checkpoint inhibitors (ICB). However, the effectiveness of ICB remains constrained, prompting the need for a proactive strategy to foresee treatment responses and resistances. This study undertook an analysis across diverse cancer patient cohorts (including melanoma, clear cell renal carcinoma, glioblastoma, bladder, and stomach cancers) subjected to various immune checkpoint blockade treatments. Surprisingly, our findings unveiled that over 38% of patients demonstrated resistance and persistent disease progression despite undergoing ICB intervention. To unravel the intricacies of resistance, we scrutinized the immune profiles of cancer patients experiencing ongoing disease progression and resistance post-ICB therapy. These profiles delineated multifaceted defects, including compromised macrophage, monocyte, and T cell responses, impaired antigen presentation, aberrant regulatory T cell (Tregs) responses, and an elevated expression of immunosuppressive and G protein-coupled receptor molecules (TGFB1, IL2RA, IL1B, EDNRB, ADORA2A, SELP, and CD276). Building upon these insights into resistance profiles, we harnessed machine learning algorithms to construct models predicting the response and resistance to ICB and developed the accompanying software. While previous work on glioblastoma with only one type of algorithm had an accuracy of 0.82, we managed to develop 20 models that provided estimates of future events of resistance or response in five cancer types, with accuracies ranging between 0.79 and 1, based on their distinct immune characteristics. In conclusion, our approach advocates for the personalized application of immunotherapy in cancer patients based on patient-specific attributes and computational models.

1. Introduction

A total of 1,918,030 new cancer cases and 609,360 cancer deaths are projected to occur in the United States every year, and much more worldwide, underscoring the pressing need for innovative research and therapeutic strategies [1]. Therapeutic options include surgery, chemotherapy, radiotherapy, and immune checkpoint blockade (ICB). However, most of the patients remain resistant to ICB in the adjuvant settings, except for patients with mismatch repair deficiency [2,3].
Cancer cells can develop various mechanisms to evade or resist the immune response triggered by ICB. It can be due to the infiltration of immunosuppressive cells, such as regulatory T cells (Tregs) and myeloid-derived suppressor cells (MDSCs), in the tumor microenvironment (TME) [4]. Cancer cells may also lose the expression of antigens recognized by T cells, rendering them invisible to the immune system [5]. Moreover, the loss of MHC-I expression or defects in antigen processing and presentation can hinder T cell recognition [6,7]. Tumors with low mutational burden may have fewer neoantigens for T cells to target, reducing the efficacy of ICB [8]. The overexpression of other immune checkpoints, such as TIM-3, LAG-3, or VISTA, can also inhibit T cell function even when PD-1 or CTLA-4 is blocked [2,9]. The production of immunosuppressive cytokines like TGFB and IL-10 may also create an immunosuppressive environment in the TME [10]. Physical or functional barriers could prevent T cells from infiltrating the tumor, known as “cold tumors” [11]. In addition, some tumors, such as melanoma, are inherently resistant to ICB due to their unique molecular and genetic characteristics [12]. Epigenetic modifications in tumor cells may alter gene expression patterns and immune recognition [13]. Tumors are often heterogeneous, and different subclones may have varying responses to ICB [14]. Finally, alterations in cancer cell metabolism can create an immunosuppressive TME and promote resistance to ICB [15].
Understanding and addressing these resistance mechanisms is critical for developing more effective immunotherapies and combination treatments that can overcome these challenges and improve the response rates of cancer patients to immune checkpoint blockade.
Thus, conducting a meta-analysis of cancer patient cohorts will be instrumental in characterizing the mechanisms underpinning the response and resistance to ICB. These cohorts were selected because information about patient responses to immunotherapy and immune profiles were available on the CRI iAtlas website. Meta-analysis of data from multiple cohorts may also facilitate the identification of optimal targets to develop combination therapies and improve patient outcomes. The development of software using machine learning approaches will enhance the precision of response and resistance prediction to ICB. Machine-learning approaches showed promising results in predicting patient outcomes in gliomas and lung and gastric cancers [16,17,18,19,20]. While previous work using RandomForest in glioblastoma with only one type of algorithm had an accuracy of 0.82, we aim to develop more models that will predict response and resistance in five cancer types with better accuracy. This will improve the diagnosis and subsequent therapeutic strategies according to patient-specific characteristics.
We aim to identify immune features associated with either resistance or positive response to therapy. These identified features will serve as the input for training machine learning algorithms (RandomForestClassifier, GradientBoosting, SupportVectorMachine, and LogisticRegression algorithms), enabling the development of personalized prediction models tailored to individual patients based on their unique immune profiles. This approach aims to refine treatment decisions, ultimately improving outcomes for cancer patients undergoing immunotherapy, even if the size of glioblastoma, melanoma, and stomach cancer cohorts may be a limitation.

2. Material and Methods

We selected multiple patient cohorts with immune profiles and response status to immunotherapy.

2.1. RNAseq Datasets and Selection of Cohorts

Patient cohorts were selected using the CRI iAtlas Portal [21] (Table 1). We selected the following RNAseq datasets for GBM patients: Zhao 2019—GBM, PD-1, Prins 2019—GBM, and PD-1 [22,23]. We used the following group filters: Progression, Drug, and GBM. Non-Progressors are defined as patients with mRECIST of Partial Response, Complete Response, or Stable disease, whereas Progressors are those with Progressive Disease. We selected the following RNAseq datasets for SKCM patients: Gide 2019—SKCM, PD-1 +/− CTLA4, Hugo 2016—SKCM, PD-1, Liu 2019—SKCM, PD-1, Riaz 2017—SKCM, PD-1, Van Allen 2015—SKCM, CTLA-4, Chen 2016—SKCM, Anti-CTLA4, Prat 2017—HNSC, LUAD, LUSC, SKCM, and Anti-PD-1 [23,24,25,26,27,28,29]. We used the following group filters: Responder, Drug, and SKCM. Responders are defined as patients with mRECIST of Partial Response or Complete Response, whereas Non-Responders are those with Progressive Disease or Stable Disease. We selected the following RNAseq datasets for KIRC metastatic patients: Choueiri 2016—KIRC, PD-1, IMmotion150—KIRC, PD-L1 and Miao 2018—KIRC, PD-1 +/− CTLA4, and PD-L1 [30,31,32]. We used the following group filters: Responder, Drug, Target, and modified Response Evaluation Criteria in Solid Tumors (mRECIST Response). Responders are defined as patients with mRECIST of Partial Response or Complete Response, whereas Non-Responders are those with Progressive Disease or Stable Disease. We selected the following RNAseq datasets for STAD patients: KIM 2018—STAD and PD-1 [33]. We used the following group filters: Responder, Drug, Target, and modified Response Evaluation Criteria in Solid Tumors (mRECIST Response). Responders are defined as patients with mRECIST of Partial Response or Complete Response, whereas Non-Responders are those with Progressive Disease or Stable Disease. We selected the following RNAseq datasets for BLCA patients: IMVigor210 2018—BLCA and PD-L1 [10,34]. We used the following group filters: Responder, Drug, Target, and modified Response Evaluation Criteria in Solid Tumors (mRECIST Response). Responders are defined as patients with mRECIST of Partial Response or Complete Response, whereas Non-Responders are those with Progressive Disease or Stable Disease. Then, we used the ICI Analysis Modules. The current version of the iAtlas Portal was built in R using code hosted at https://github.com/CRI-iAtlas/iatlas-app (accessed on 1 March 2024). Assayed samples were collected prior to immunotherapy.

2.2. Clinical Description of Patients

Datasets merged according to drug therapy and cancer type are described in Table 1. For GBM patients that received Pembrolizumab, targeting PD1, there were 15 (44%) non-progressors and 19 (56%) progressors. For KIRC patients that received Atezolizumab, targeting PD-L1, there were 48 (29%) responders and 117 (71%) non-responders. For SKCM patients that received Ipilimumab and Pembrolizumab, targeting PD1 and CTLA4, there were 12 (37.5%) non-responders and 20 (62.5%) responders. For STAD patients that received Pembrolizumab, targeting PD-1, there were 12 (27%) responders and 33 (73%) non-responders. For BLCA patients that received Atezolizumab, targeting PD-L1, there were 68 (23%) responders and 230 (77%) non-responders.

2.3. Statistics

Statistical significance of the observed differences was determined using both independent Wilcoxon and t-tests. All data are presented as mean ± SEM. Standard error of the mean (SEM) measures how far the sample mean (average) of the data is likely to be from the true population mean. The difference was considered as significant when the p value was below 0.05. *: p < 0.05 for both tests. These tests are the only ones available on the CRI iAtlas portal.

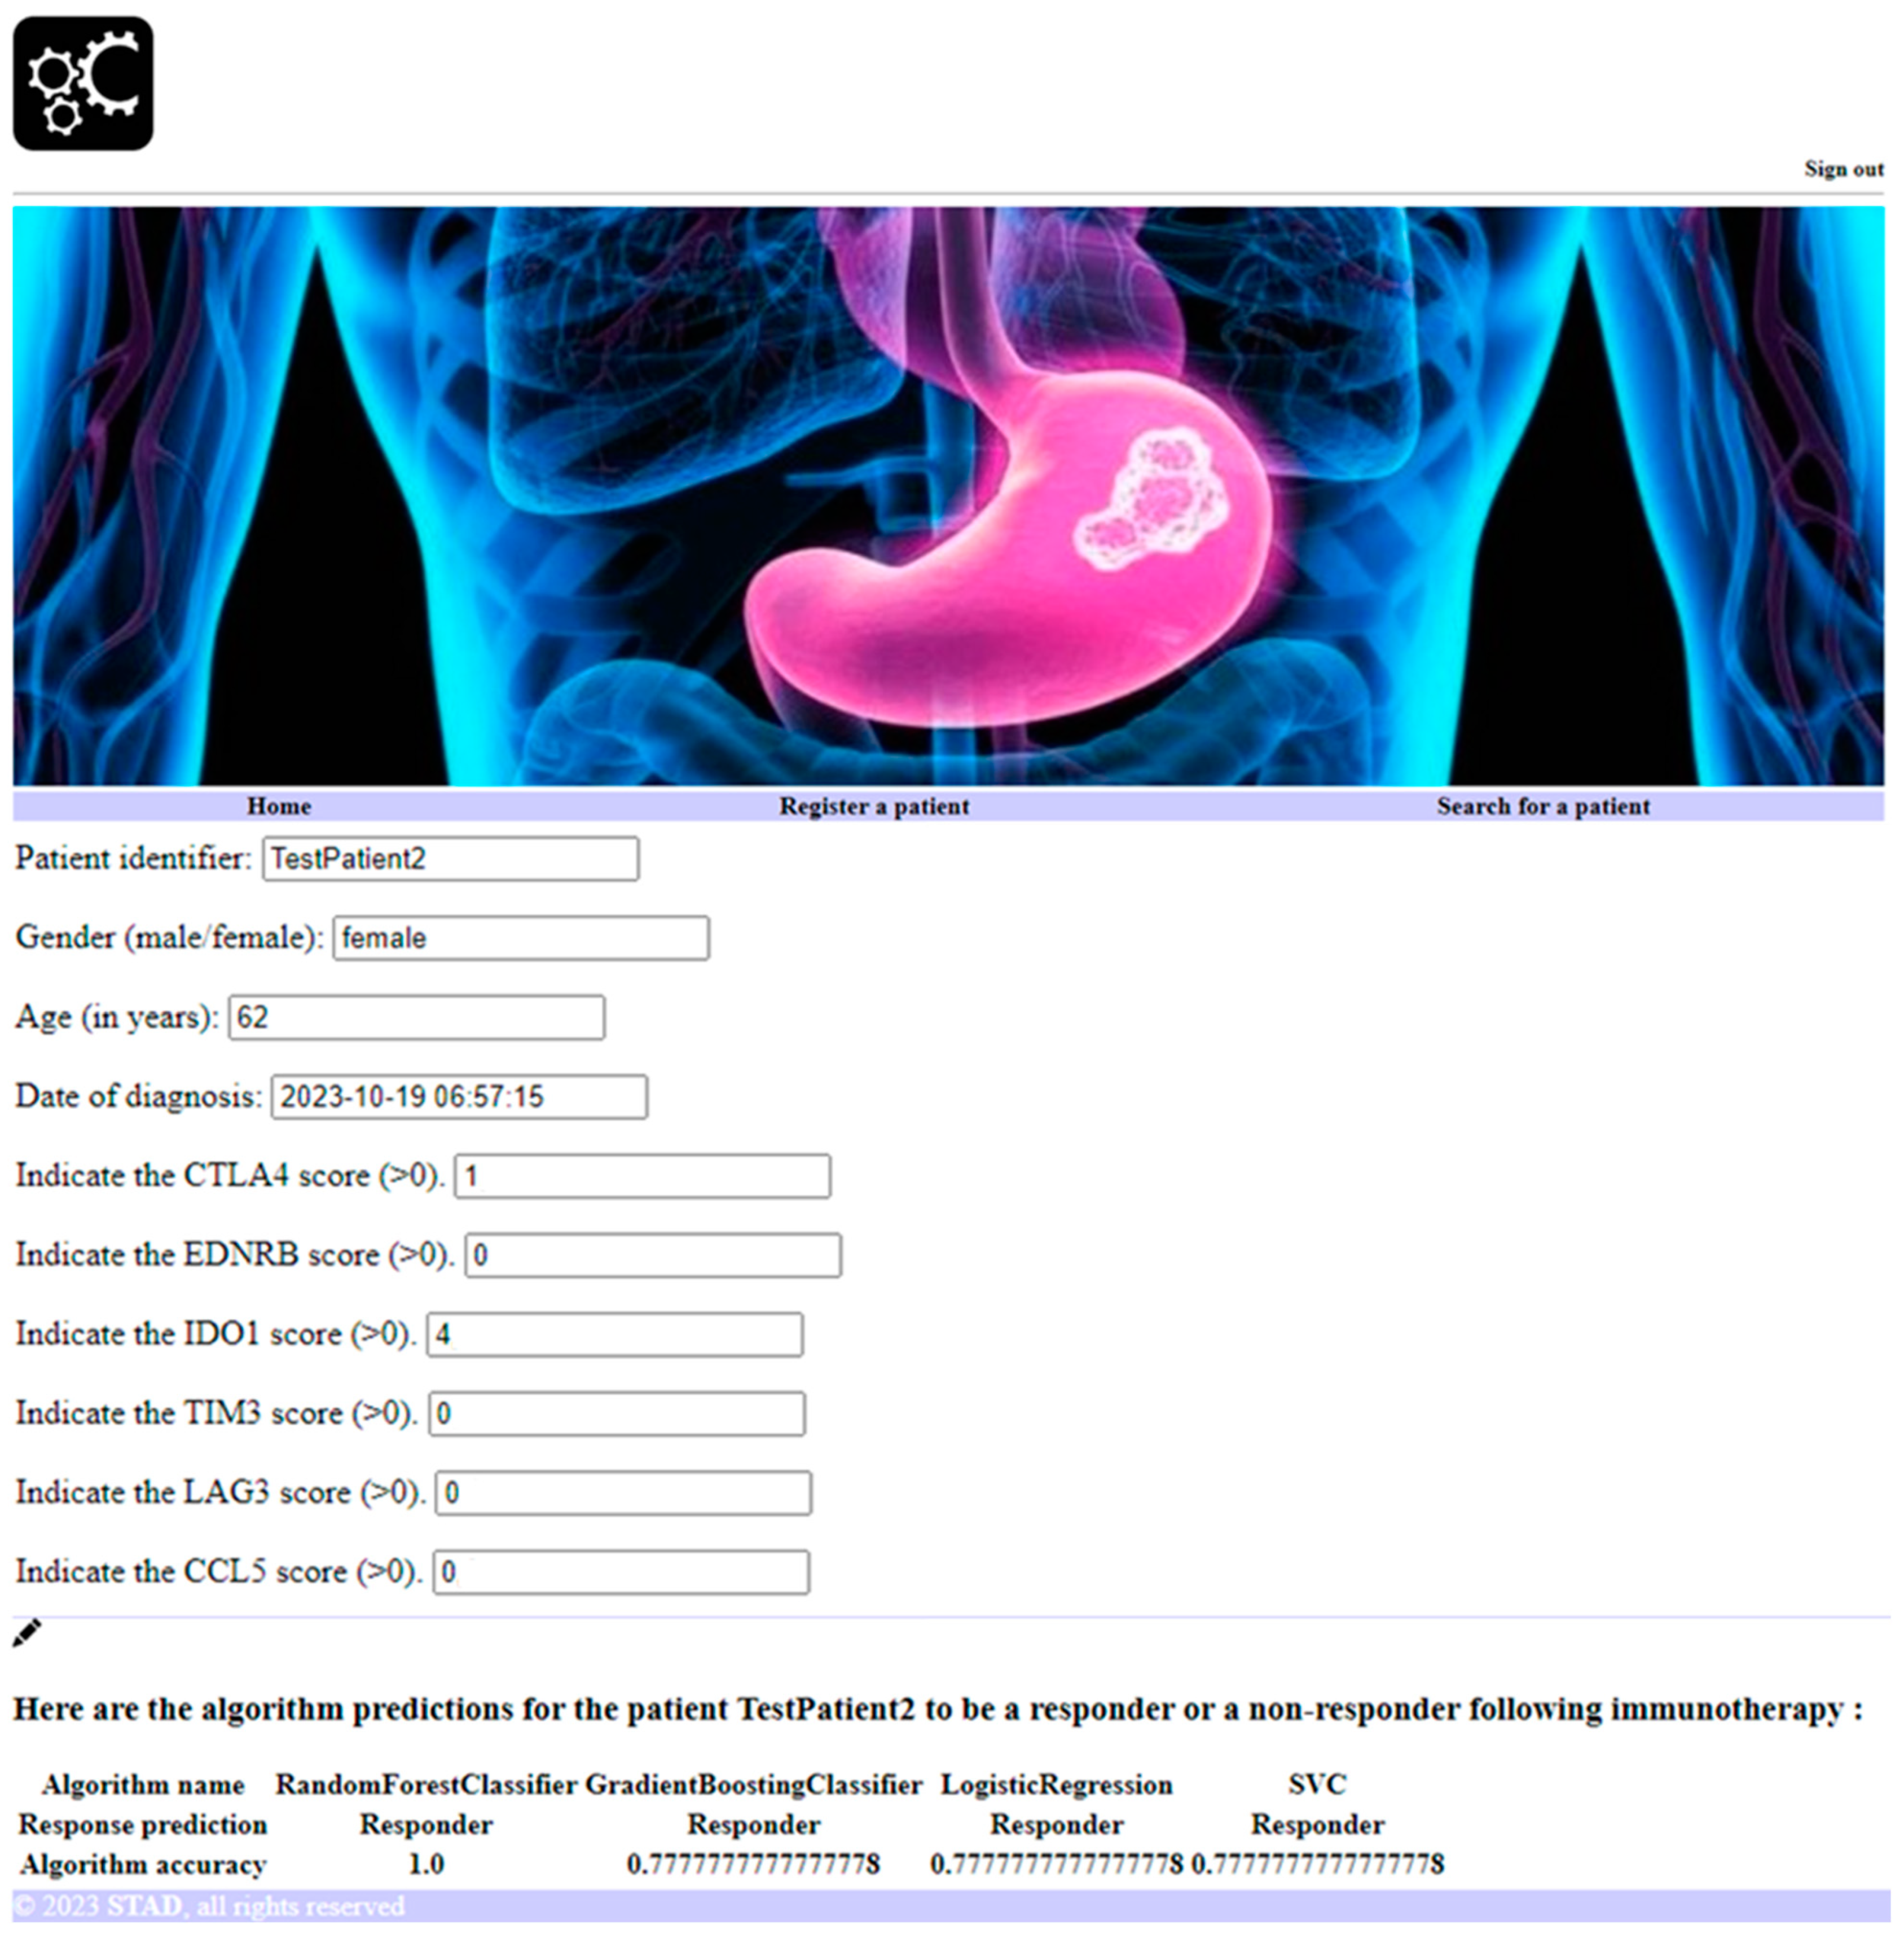
2.4. Software Development to Predict Personalized Response to Immune Checkpoint Blockade

Patients from multiple cohorts received immune checkpoint blockade following cancer. After pooling the cohorts, the response was calculated according to the drug used for therapy. There were 34 GBM patients treated with Pembrolizumab, 32 SKCM patients treated with Ipilimumab and Pembrolizumab, 45 STAD patients treated with Pembrolizumab, 298 BLCA patients treated with Atezolizumab, and 165 KIRC patients treated with Atezolizumab. The software, coded using python, html, css, mysql, and django, allows the registered clinician to diagnose a new patient or access the diagnosis of a registered patient by indicating their medical identifier in a form, as we previously described in other studies [35,36]. The software calculates the probability of patients to respond to immune checkpoint blockade, after form completion, according to cancer type and immune features.

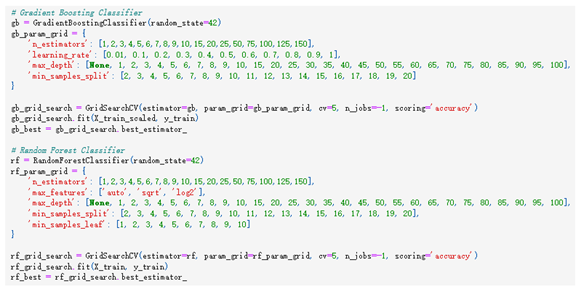
2.5. Machine Learning Approaches to Predict Personalized Response to Immune Checkpoint Blockade

To predict the cancer patient response to immune checkpoint blockade, we trained different machine-learning algorithms, including RandomForestClassifier, GradientBoosting, SupportVectorMachine, and LogisticRegression, on BLCA, STAD, KIRC, GBM, and SKCM immune features differentially expressed between responders and non-responders to immunotherapy. Each dataset was partitioned into 5 subsets and further categorized into training (80%) and testing (20%) groups. The accuracy of a model indicates the percentage of correctly predicted Response status in the test set. The classification report provides more detailed performance metrics, including precision, recall, and F1-score for each class (‘Non-responder’ and ‘Responder’). Precision measures the accuracy of positive predictions. Recall measures the ability of the model to identify all relevant instances of a class. The F1-score is the harmonic mean of precision and recall and provides a balance between the two. Support represents the number of samples in each class in the test set. Parameter optimization was performed independently for each model using methods such as grid search or random search. Hyperparameters were fine-tuned to enhance model performance based on appropriate evaluation metrics.
Onco 04 00014 i001

3. Results

We aim to identify immune features associated with either resistance or positive response to therapy.

3.1. Response and Overall Survival of Cancer Patients According to Immune Checkpoint Blockade

We calculated the response and overall survival of cancer patients who underwent immune checkpoint therapy. The response status was not available for GBM; the only status available for GBM was the progression in the CRI iAtlas dataset. Non-Progressors are defined as patients with mRECIST of Partial Response, Complete Response or Stable disease, whereas Progressors are those with Progressive Disease. Responders are defined as patients with mRECIST of Partial Response or Complete Response, whereas Non-Responders are those with Progressive Disease or Stable Disease. For GBM patients that received Pembrolizumab, targeting PD1, there were 15 (44%) non-progressors and 19 (56%) progressors (Table 1). Among SKCM patients who received Ipilimumab and Pembrolizumab, targeting PD1 and CTLA4, there were 12 (37.5%) non-responders and 20 (62.5%) responders (Table 1). Among KIRC patients who received Atezolizumab, targeting PDL1, there were 117 (71%) non-responders and 48 (29%) responders (Table 1). Among STAD patients who received Pembrolizumab, targeting PD1, there were 33 (73%) non-responders and 12 (27%) responders (Table 1). Among BLCA patients who received Atezolizumab, targeting PDL1, there were 230 (77%) non-responders and 68 (23%) responders (Table 1). For GBM patients receiving monotherapy, targeting PD1, with disease progression, the overall survival remained below 30% (Figure 1). Conversely, GBM non-progressors following Pembrolizumab exhibited an overall survival rate of around 60%. SKCM patients receiving combination therapy targeting PD1 and CTLA4 without response displayed an overall survival rate of around 50% (Figure 1). In contrast, SKCM patients responding to combination therapy demonstrated an overall survival rate of around 100%. KIRC patients receiving anti-PDL1 therapy without response displayed an overall survival rate of around 10% (Figure 1). In contrast, KIRC patients responding to immunotherapy demonstrated an overall survival rate of around 60%. STAD patients receiving anti-PD1 therapy without response displayed an overall survival rate of around 15% (Figure 1). In contrast, STAD patients responding to immunotherapy demonstrated an overall survival rate of around 90%. BLCA patients receiving anti-PDL1 therapy without response displayed an overall survival rate of around 10% (Figure 1). In contrast, BLCA patients responding to immunotherapy demonstrated an overall survival rate of around 90%. Overall, 60% of patients with GBM, 30% to 40% of SKCM patients, 70% of KIRC patients, 73% of STAD patients, and 77% of BLCA patients exhibited resistance to immune checkpoint combination therapy.

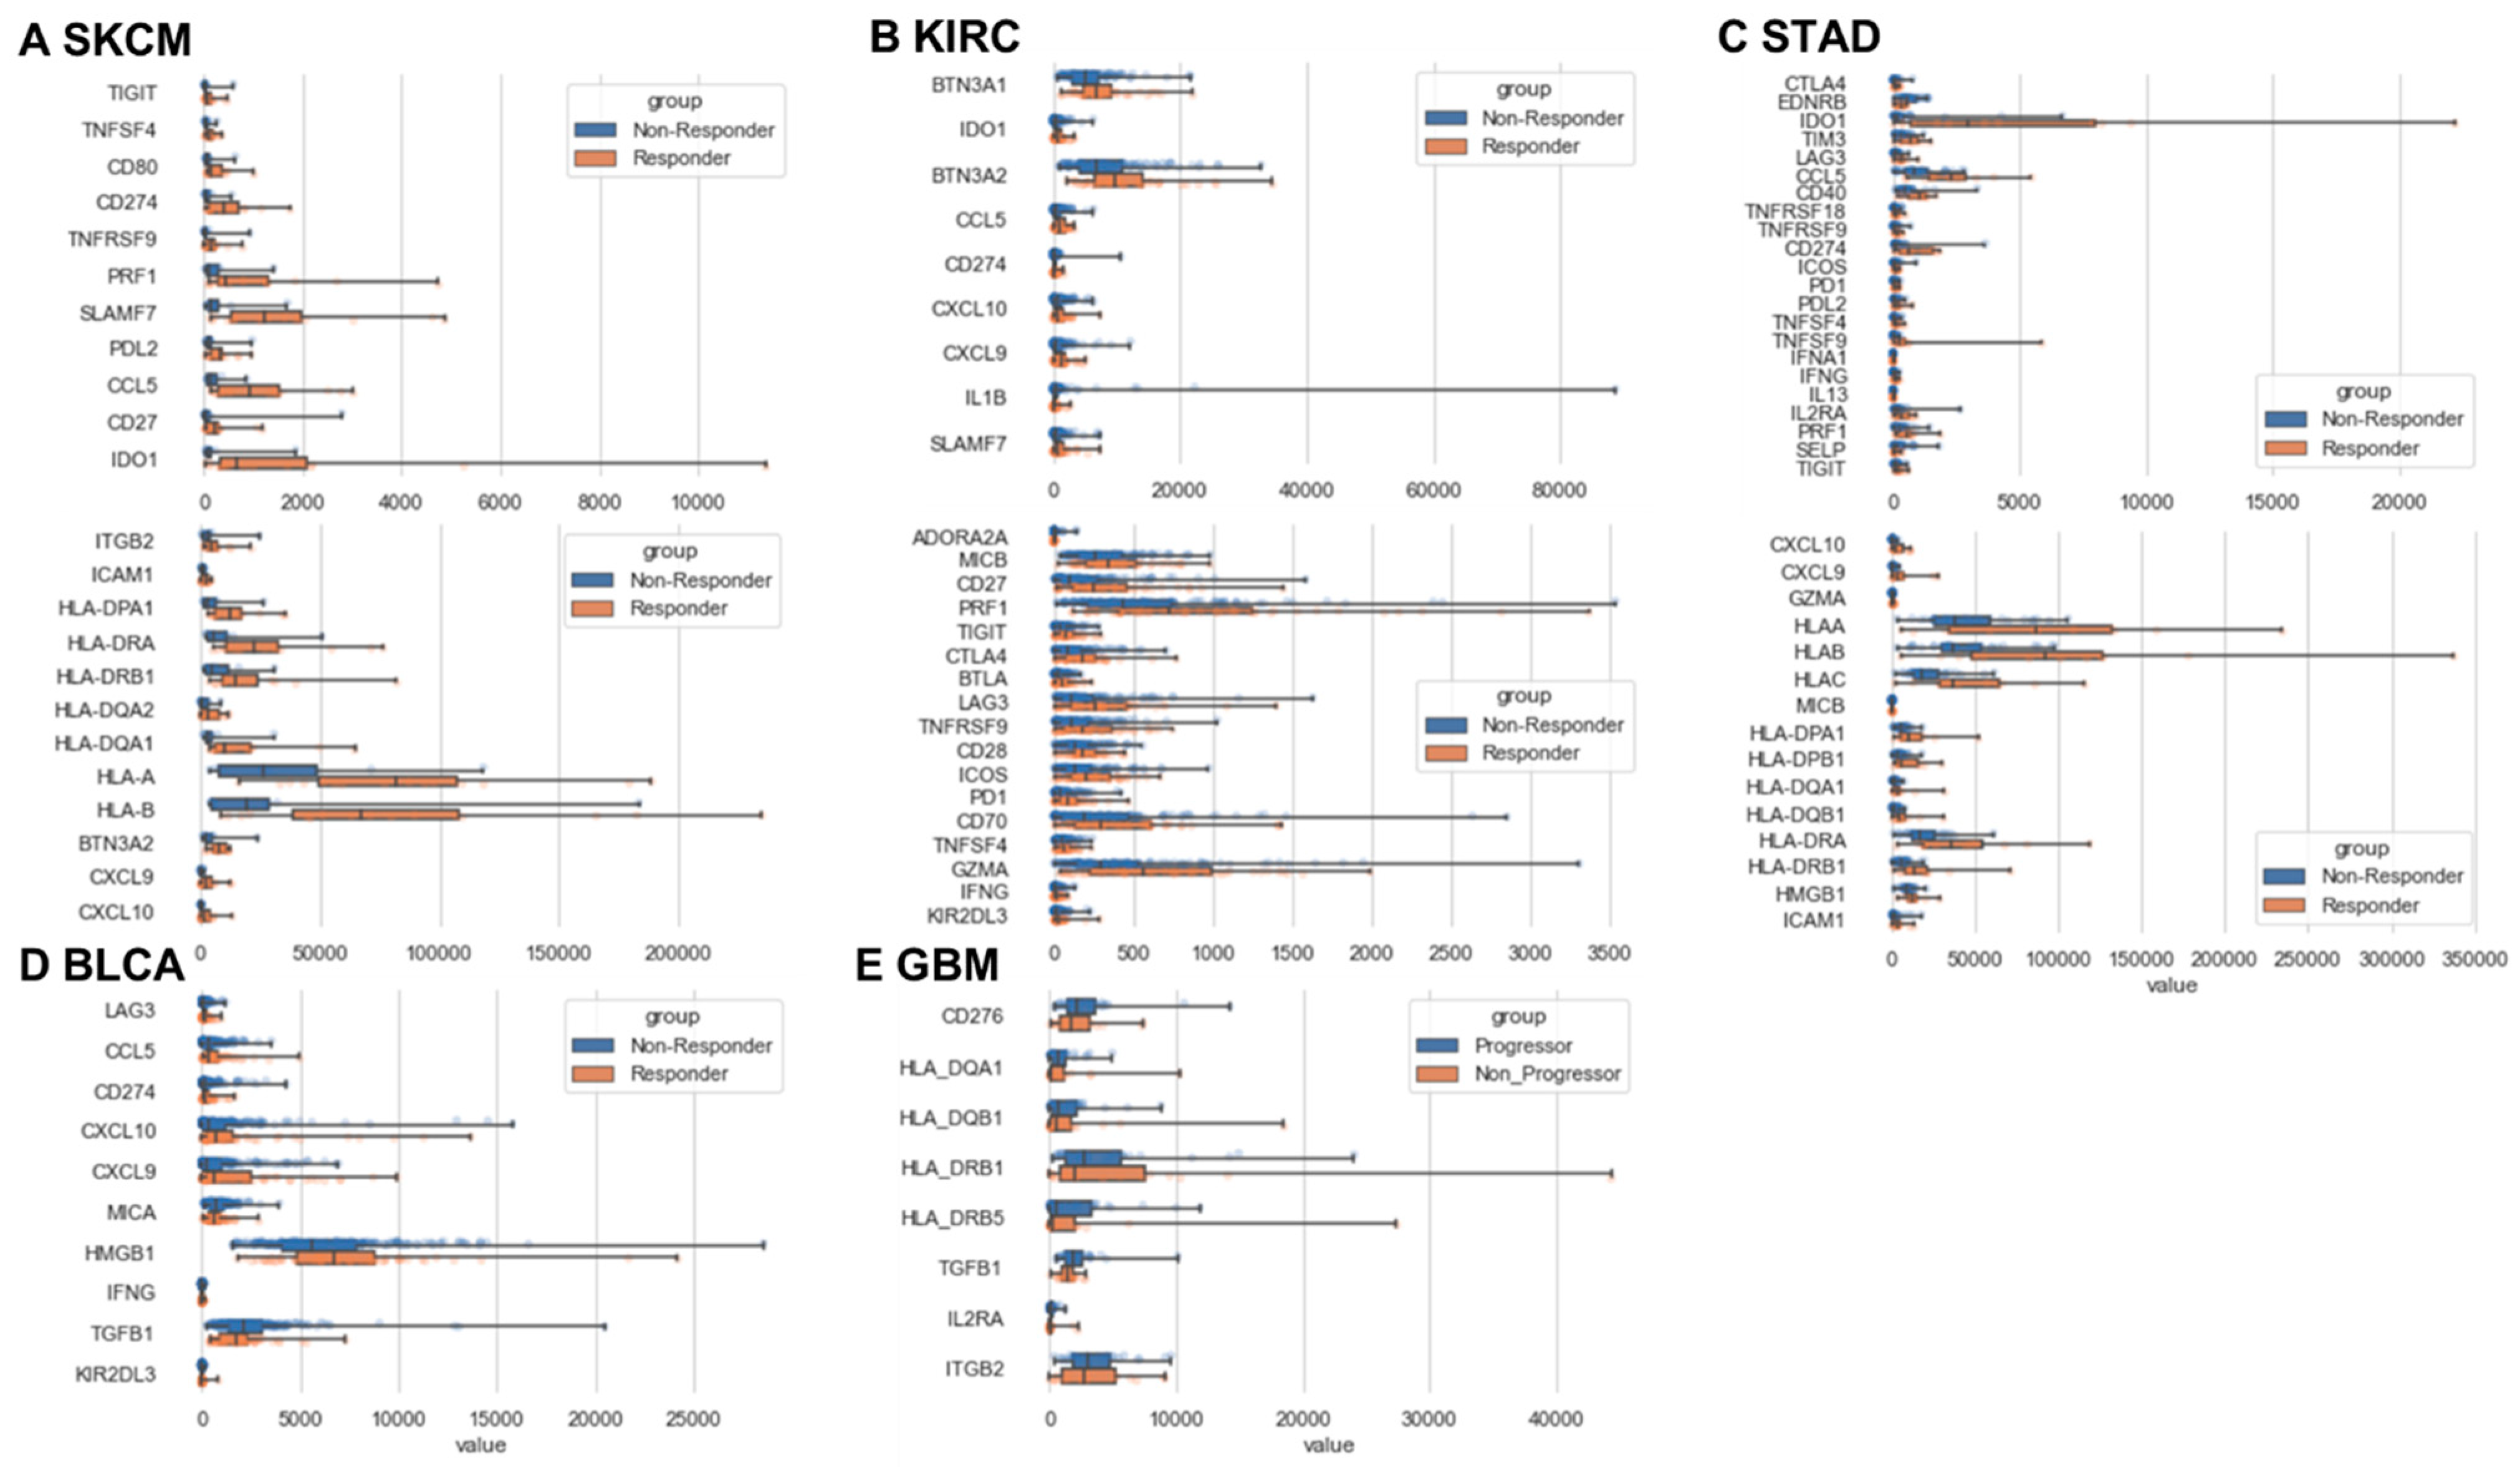
3.2. Immune Response and Resistance in Cancer Patients Following Immune Checkpoint Blockade

We investigated the immune features associated with response and resistance to immune checkpoint therapy in cancer patients. When analyzing immune response using the CRI iAtlas in patients who received immunotherapy, we observed that BLCA responders to Atezolizumab and STAD responders to Pembrolizumab had more CD8, M1, T cell follicular helpers, and CD4 Memory activated compared to non-responders (Figure 2). GBM non-progressors to Pembrolizumab had more monocytes and T follicular helpers, while progressors had more macrophages, especially M0, and Tregs. We also observed that SKCM responders had more M1 and Th1 response and less CD4 compared to non-responders to Ipilimumab and Pembrolizumab. KIRC responders to Atezolizumab had more CD8 and less macrophages compared to non-responders. No differences were observed for the other immune subsets.
When examining the expression of immunomodulatory molecules, we found that GBM progressors following Pembrolizumab expressed more MHC molecules (HLA-DRB1, HLA-DQA1, HLA-DRB5, and HLA-DQB1) compared to non-progressors (Figure 3). Surprisingly, we observed an upregulation of ITG2B, a gene related to T cell adhesion, in progressors following Pembrolizumab, suggesting that T cell responses are not sufficient to promote a response. Importantly, progressors following Pembrolizumab expressed more immunosuppressive molecules such as TGFB, IL2RA and CD276. No differences were observed in the expression of other immunoregulatory molecules and immune checkpoints (including PD1, TIGIT, TIM3, LAG3, EDNRB, TLR4, VSIR, CD40, TNFRSF, CD28, ICOS, VTCN1, CD70, CX3CL1, ENTPD1, GXMA, HMGB1, ICOSLG, VEGF, KIR, IFN genes, interleukins, MICA, and other HLA genes).
SKCM responders to Pembrolizumab expressed more MHC and costimulatory molecules (HLA-DRA, HLA-A, HLA-B, HLA-DRB1, HLA-DQA2, HLA-DQA1, HLA-DPA1, and CD80) compared to non-responders (Figure 3). This suggests that antigen presentation plays a crucial role in the anti-tumor immune response. Responders also exhibited a higher expression of PD1 and TIGIT, indicating a potential increase in T cell exhaustion. We observed upregulation of genes related to T cell activation (BTN3A2), adhesion (ITGB2 and ICAM1), cytotoxicity (PRF1), regulation (SLAMF7 and IDO1), and maintenance (CD27) in responders. Additionally, responders showed an increased expression of PD1 ligands PDL1 and PDL2, TNF signaling genes (TNFSF4 and TNFSF9), and cytokines attracting T cells and other immune cells (CCL5, CXCL9, and CXCL10). No differences were observed in the expression of other immunoregulatory molecules and immune checkpoints (including TIM3, LAG3, EDNRB, TLR4, ARG1, VSIR, CD40, TNFRSF, CD28, ICOS, VTCN1, CD70, CX3CL1, ENTPD1, GXMA, HMGB1, ICOSLG, VEGF, KIR, IFN/TGFB genes, interleukins, MICA, and other HLA genes).
BLCA responders to Atezolizumab expressed more cytokines attracting T cells and other immune cells (CCL5, CXCL9, and CXCL10) (Figure 3). They also expressed more KIR2DL3, IFNG, HMGB1, LAG3, and CD274 but less TGFB1 and MICA compared to non-responders. No differences were observed in the expression of other immunoregulatory molecules.
STAD responders to Pembrolizumab expressed more MHC and costimulatory molecules (HLA-DRA, HLA-A, HLA-B, HLA-C, MICB, HLA-DPA1, HLA-DPB1, HLA-DRB1, HLA-DQB1, and CD40) compared to non-responders (Figure 3). They expressed more cytokines attracting T cells and other immune cells (CCL5, CXCL9, and CXCL10). They also expressed more PD1, PDL2, TIGIT, PRF1, IL13, IL2RA, IFNA1, ICAM1, IFNG, HMGB1, LAG3, CTLA4, TNF genes, GZMA, ICOS, TIM3, and CD274 but less EDNRB and SELP compared to non-responders. No differences were observed in the expression of other immunoregulatory molecules.
KIRC responders to Atezolizumab expressed more cytokines attracting T cells and other immune cells (CCL5, CXCL9, and CXCL10) (Figure 3). They also expressed more BTN3A, IDO1, MICB, CD27, PRF1, TIGIT, CTLA4, BTLA, LAG3, TNF genes, CD28, ICOS, PD1, CD70, GZMA IFNG, KIR2DL3, CD274, and SLAMF7 but less IL1B and ADORA2A compared to non-responders. No differences were observed in the expression of other immunoregulatory molecules.
Overall, patients with response/non-progression to immunotherapy expressed more genes related to antigen presentation and the production of cytokines attracting immune cells. Patients with resistance/progression following immunotherapy were characterized by defects in macrophage, monocyte, and T cell responses, impaired antigen presentation, Tregs response, and immunosuppressive molecule and G protein-coupled receptor expression (TGFB1, IL2RA, IL1B, EDNRB, ADORA2A, SELP, and CD276).
All immune gene scores were statistically different between responders/non-progressors and non-responders/progressors to immunotherapy in multiple cancer cohorts. Immune gene scores were measured using CRI iAtlas; p < 0.05, Wilcoxon t-test; n = 34 for Pembrolizumab and GBM; n = 32 for Ipilimumab and Pembrolizumab and SKCM; n = 45 for Pembrolizumab and STAD; n = 298 for BLCA and Atezolizumab; and n = 165 for KIRC and Atezolizumab.

3.3. Personalized Prediction of Cancer Patient Response to Immune Checkpoint Blockade

To predict the personalized response of patients with cancer to immune checkpoint blockade, we trained several RandomForestClassifier, GradientBoosting, SupportVectorMachine, and LogisticRegression algorithms on BLCA, STAD, KIRC, GBM, and SKCM immune features differentially expressed between responders and non-responders to immunotherapy identified in Figure 3. The accuracy of a model indicates the percentage of correctly predicted Response statuses in the test set. The classification report provides more detailed performance metrics, including the precision, recall, and F1-score for each class (‘Non-responder’ and ‘Responder’). Precision measures the accuracy of positive predictions. Recall measures the ability of the model to identify all relevant instances of a class. The F1-score is the harmonic mean of precision and recall and provides a balance between the two. Support represents the number of samples in each class in the test set. Parameter optimization was performed independently for each model using methods such as grid search or random search. Hyperparameters were fine-tuned to enhance model performance based on appropriate evaluation metrics. Each dataset was partitioned into five subsets and further categorized into training (80%) and testing (20%) groups.
For KIRC, the best performance was obtained with the RandomForestClassifier and LogisticRegression algorithms. These algorithms had an overall accuracy of 79%, which means that they correctly predicted the response status for about 79% of the patients in the test set (Table 2). For ‘Non-responder’, the precision was around 79 and 81%, indicating that 80% of the positive predictions for this class were accurate. For ‘Responder’, the precision was between 67 and 75%. For ‘Non-responder’, the recall was between 92 and 96%, meaning that the vast majority of actual ‘Non-responder’ instances were correctly identified. For ‘Responder’, the recall was between 33 and 47%, indicating that only 40% of the actual ‘Responder’ instances were correctly identified. For ‘Non-responder’, the F1-score was between 0.87 and 0.92, and for ‘Responder’, it was between 0.46 and 0.53. For ‘Non-responder’, there were 24 samples, and for ‘Responder’, there were 9 samples in the test set. For GBM, the best performance was obtained with the RandomForestClassifier algorithm. This algorithm had an overall accuracy of 82%, which means that it correctly predicted the Progression status for about 82% of the patients in the test set (Table 2). For ‘Non-progressor’, the precision was 100%, indicating that 100% of the positive predictions for this class were accurate. For ‘Progressor’, the precision was 80%. For ‘Non-progressor’, the recall was 33%, meaning that only 33% of actual ‘Non-progressor’ instances were correctly identified. For ‘Progressor’, the recall was 100%, indicating all actual ‘Progressor’ instances were correctly identified. For ‘Non-progressor’, the F1-score was 0.50, and for ‘Progressor’, it was 0.89. For ‘Non-progressor’, there were three samples, and for ‘Progressor’, there were eight samples in the test set.
For STAD, the best performance was obtained with the RandomForestClassifier algorithm. This algorithm had an overall accuracy of 100%, which means that it correctly predicted the response status for 100% of the patients in the test set (Table 2). For ‘Non-responder’, the precision was 100%, indicating that 100% of the positive predictions for this class were accurate. For ‘Responder’, the precision was also 100%. For ‘Non-responder’, the recall was 100%, meaning that all actual ‘Non-responder’ instances were correctly identified. For ‘Responder’, the recall was also 100%, indicating that all the actual ‘Responder’ instances were correctly identified. For ‘Non-responder’, the F1-score was 1, and for ‘Responder’, it was also 1. For ‘Non-responder’, there were five samples, and for ‘Responder’, there were four samples in the test set.
For SKCM, the best performance was obtained with the RandomForestClassifier algorithm. This algorithm had an overall accuracy of 100%, which means that it correctly predicted the response status for 100% of the patients in the test set (Table 2). For ‘Non-responder’, the precision was 100%, indicating that 100% of the positive predictions for this class were accurate. For ‘Responder’, the precision was also 100%. For ‘Non-responder’, the recall was 100%, meaning that all actual ‘Non-responder’ instances were correctly identified. For ‘Responder’, the recall was also 100%, indicating that all the actual ‘Responder’ instances were correctly identified. For ‘Non-responder’, the F1-score was 1, and for ‘Responder’, it was also 1. For ‘Non-responder’, there were three samples, and for ‘Responder’, there were five samples in the test set.
For BLCA, the best performance was obtained with the RandomForestClassifier and LogisticRegression algorithms. These algorithms had an overall accuracy of 90%, which means that they correctly predicted the response status for about 90% of the patients in the test set (Table 2). For ‘Non-responder’, the precision was around 93 and 94%, indicating that 94% of the positive predictions for this class were accurate. For ‘Responder’, the precision was between 62 and 67%. For ‘Non-responder’, the recall was between 94 and 96%, meaning that the vast majority of actual ‘Non-responder’ instances were correctly identified. For ‘Responder’, the recall was between 50 and 62%, indicating that only 62% of the actual ‘Responder’ instances were correctly identified. For ‘Non-responder’, the F1-score was 0.94, and for ‘Responder’, it was between 0.57 and 0.62. For ‘Non-responder’, there were 52 samples, and for ‘Responder’, there were eight samples in the test set.
Overall, our models managed to successfully predict the response status of 79% of the KIRC patients to Atezolizumab, 82% of the GBM patients to Pembrolizumab, 100% of the STAD patients to Pembrolizumab, 100% of the SKCM patients to Ipilimumab and Pembrolizumab, and 90% of the BLCA patients to Atezolizumab.
In accordance with the methods outlined in the study, we conducted predictions regarding the response of a hypothetical STAD patient to Pembrolizumab (Figure 4). Based on her immune characteristics, the four algorithms predicted that the STAD patient will be a responder to Pembrolizumab. Thus, it may be beneficial to choose this therapy for this patient.
The STAD patient data collection form is shown in Figure 4: personalized predictions of the STAD patient response to Pembrolizumab based on her immune characteristics.

4. Discussion

By analyzing the response of patients following ICB in multiple cohorts, we observed that 38 to 77% of patients with BLCA, STAD, KIRC, GBM, and SKCM cancer exhibited resistance to immune checkpoint blockade therapy. Patients with cancer progression following immunotherapy were characterized by defects in macrophage, monocyte, and T follicular helper responses, impaired antigen presentation, Tregs response, and immunosuppressive molecule and G protein-coupled receptor expression (TGFB, IL2RA, IL1B, EDNRB, ADORA2A, SELP, and CD276). CD276 regulates cell proliferation, invasion, and migration in cancers [37]. A high expression of IL2RA, the alpha chain of the interleukin 2 receptor complex expressed on the surface of mature T cells, predicted worse survival outcomes in patients with pancreatic ductal adenocarcinoma [38]. IL1B was associated with resistance in KIRC and breast cancer models [39,40]. TGFB is a key mediator of many biological processes and was also associated with resistance to immunotherapy [41]. On the contrary, patients with response to immunotherapy expressed more genes related to antigen presentation (HLA genes) and the production of cytokines attracting immune cells (CCL5, CXCL9, and CXCL10). CXCL9 stimulates cytokine production by T cells and fosters the proliferation of Th1 cells [42]. CXCL10, an inflammatory chemokine, facilitates immune responses by activating and recruiting T cells, eosinophils, monocytes, and NK cells [43]. CCL5 plays a pivotal role in recruiting various leukocytes to inflammatory sites, including T cells, macrophages, eosinophils, and basophils [44].
To better predict the ICB response of patients with cancer, we developed machine learning approaches, as it has been performed in other cancer models [16,17,18]. We successfully trained RandomForestClassifier, GradientBoosting, SupportVectorMachine, and LogisticRegression algorithms on BLCA, STAD, KIRC, GBM, and SKCM CRI iAtlas datasets, based on the features that we identified as differentially expressed between responders and non-responders to immune checkpoint blockade. While previous work on glioblastoma with only one type of algorithm had an accuracy of 0.82, we managed to develop 20 models that predicted the response and resistance in five cancer types with accuracies between 0.79 and 1, meaning that our models managed to successfully predict the response status of 79 to 100% of the patients. These models appear to have good precision and recall for both ‘Responder’ and ‘Non-responder’ classes in most of the cohorts, suggesting that it can effectively identify ‘Responder’ and ‘Non-responder’ cases. However, there is room for improvement in identifying ‘Responder’ GBM and KIRC cases, as indicated by the lower recalls for these classes. Increasing the size of the training dataset would help to improve the predictions of the model. It may also be beneficial to use multiple algorithms to maximize the probability to correctly predict the response status of these patients. Other machine learning approaches have shown promising results for predicting patient outcomes in gliomas, lung, and gastric cancers [16,17,18,19,20] but not in melanoma and bladder and renal cancers, and none with immune features as we did in this study. The first machine learning approach for lung cancer was a risk prediction model combining Clinical + DeepRadiomics [16] and the second used nCounter RNA expression data [17]. Another on gastric cancer used bulk and single cell RNA seq [18]. Finally, we have also previously developed algorithms using the tumor mutational profile in glioma [20]. These approaches are very different compared to the one we used here with immune features.
Finally, we developed software to predict patient response to immune checkpoint blockade that incorporated our machine learning approach. This software computes the probability of being a responder or a non-responder to immune checkpoint blockade based on the patient’s specific immune characteristics. Developing such machine learning approaches based on patient characteristics may help provide more relevant treatment to each patient.
Overall, to unravel the intricacies of resistance, we scrutinized the immune profiles of cancer patients experiencing ongoing disease progression and resistance post-ICB therapy. These profiles delineated multifaceted defects, including compromised macrophage, monocyte, and T cell responses, impaired antigen presentation, aberrant regulatory T cell (Tregs) responses, and an elevated expression of immunosuppressive and G protein-coupled receptor molecules (TGFB1, IL2RA, IL1B, EDNRB, ADORA2A, SELP, and CD276). Building upon these insights into resistance profiles, we harnessed machine learning algorithms to construct models predicting the response and resistance to ICB and developed the accompanying software. While previous work on glioblastoma with only one type of algorithm had an accuracy of 0.82, we managed to develop 20 models that provided estimates of future events of resistance or response in five cancer types, with accuracies ranging between 0.79 and 1, based on their distinct immune characteristics. In conclusion, our approach advocates for the personalized application of immunotherapy in cancer patients based on patient-specific attributes and computational models.

5. Conclusions

Our approach advocates for the personalization of immunotherapy in cancer patients. By harnessing patient-specific immune attributes and computational predictions, we offer a promising avenue for the enhancement of clinical outcomes following immunotherapy.

Funding

This research received no external funding.

Institutional Review Board Statement

Not applicable.

Informed Consent Statement

Not applicable.

Data Availability Statement

Data are available on CRIiAtlas website https://isb-cgc.shinyapps.io/iatlas/ (accessed on 1 March 2024) and code is available on Github https://github.com/gmestrallet/Cancers_2024_16 (accessed on 1 March 2024).

Acknowledgments

The author thanks A. Pierga for the logo of the software.

Conflicts of Interest

The author declares no conflicts of interest.

References

  1. Siegel, R.L.; Miller, K.D.; Fuchs, H.E.; Jemal, A. Cancer statistics. CA Cancer J. Clin. 2022, 72, 7–33. [Google Scholar] [CrossRef]
  2. Mestrallet, G.; Brown, M.; Bozkus, C.C.; Bhardwaj, N. Immune escape and resistance to immunotherapy in mismatch repair deficient tumors. Front. Immunol. 2023, 14, 1210164. [Google Scholar] [CrossRef]
  3. Lugand, L.; Mestrallet, G.; Laboureur, R.; Dumont, C.; Bouhidel, F.; Djouadou, M.; Masson-Lecomte, A.; Desgrandchamps, F.; Culine, S.; Carosella, E.D.; et al. Methods for Establishing a Renal Cell Carcinoma Tumor Spheroid Model With Immune Infiltration for Immunotherapeutic Studies. Front. Oncol. 2022, 12, 898732. [Google Scholar] [CrossRef] [PubMed]
  4. Binnewies, M.; Roberts, E.W.; Kersten, K.; Chan, V.; Fearon, D.F.; Merad, M.; Coussens, L.M.; Gabrilovich, D.I.; Ostrand-Rosenberg, S.; Hedrick, C.C.; et al. Understanding the tumor immune microenvironment (TIME) for effective therapy. Nat. Med. 2018, 24, 541–550. [Google Scholar] [CrossRef]
  5. McGranahan, N.; Furness, A.J.S.; Rosenthal, R.; Ramskov, S.; Lyngaa, R.; Saini, S.K.; Jamal-Hanjani, M.; Wilson, G.A.; Birkbak, N.J.; Hiley, C.T.; et al. Clonal neoantigens elicit T cell immunoreactivity and sensitivity to immune checkpoint blockade. Science 2016, 351, 1463–1469. [Google Scholar] [CrossRef] [PubMed]
  6. Huang, A.C.; Postow, M.A.; Orlowski, R.J.; Mick, R.; Bengsch, B.; Manne, S.; Xu, W.; Harmon, S.; Giles, J.R.; Wenz, B.; et al. T-cell invigoration to tumour burden ratio associated with anti-PD-1 response. Nature 2017, 545, 60–65. [Google Scholar] [CrossRef]
  7. Mestrallet, G.; Sone, K.; Bhardwaj, N. Strategies to overcome DC dysregulation in the tumor microenvironment. Front. Immunol. 2022, 13, 980709. [Google Scholar] [CrossRef]
  8. Rizvi, N.A.; Hellmann, M.D.; Snyder, A.; Kvistborg, P.; Makarov, V.; Havel, J.J.; Lee, W.; Yuan, J.; Wong, P.; Ho, T.S.; et al. Cancer immunology. Mutational landscape determines sensitivity to PD-1 blockade in non–small cell lung cancer. Science 2015, 348, 124–128. [Google Scholar] [CrossRef]
  9. Woo, S.; Li, N.; Bruno, T.C.; Forbes, K.; Brown, S.; Workman, C.; Drake, C.G.; Vignali, D.A.A. Differential subcellular localization of the regulatory T-cell protein LAG-3 and the coreceptor CD4. Eur. J. Immunol. 2010, 40, 1768–1777. [Google Scholar] [CrossRef] [PubMed]
  10. Mariathasan, S.; Turley, S.J.; Nickles, D.; Castiglioni, A.; Yuen, K.; Wang, Y.; Kadel, E.E., III; Koeppen, H.; Astarita, J.L.; Cubas, R.; et al. TGFβ attenuates tumour response to PD-L1 blockade by contributing to exclusion of T cells. Nature 2018, 554, 544–548. [Google Scholar] [CrossRef]
  11. Gajewski, T.F.; Woo, S.-R.; Zha, Y.; Spaapen, R.; Zheng, Y.; Corrales, L.; Spranger, S. Cancer immunotherapy strategies based on overcoming barriers within the tumor microenvironment. Curr. Opin. Immunol. 2013, 25, 268–276. [Google Scholar] [CrossRef] [PubMed]
  12. Zaretsky, J.M.; Garcia-Diaz, A.; Shin, D.S.; Escuin-Ordinas, H.; Hugo, W.; Hu-Lieskovan, S.; Torrejon, D.Y.; Abril-Rodriguez, G.; Sandoval, S.; Barthly, L.; et al. Mutations Associated with Acquired Resistance to PD-1 Blockade in Melanoma. N. Engl. J. Med. 2016, 375, 819–829. [Google Scholar] [CrossRef] [PubMed]
  13. Chiappinelli, K.B.; Strissel, P.L.; Desrichard, A.; Li, H.; Henke, C.; Akman, B.; Hein, A.; Rote, N.S.; Cope, L.M.; Snyder, A.; et al. Inhibiting DNA Methylation Causes an Interferon Response in Cancer via dsRNA Including Endogenous Retroviruses. Cell 2015, 162, 974–986. [Google Scholar] [CrossRef] [PubMed]
  14. Gerlinger, M.; Rowan, A.J.; Horswell, S.; Math, M.; Larkin, J.; Endesfelder, D.; Gronroos, E.; Martinez, P.; Matthews, N.; Stewart, A.; et al. Intratumor heterogeneity and branched evolution revealed by multiregion sequencing. N. Engl. J. Med. 2012, 366, 883–892. [Google Scholar] [CrossRef] [PubMed]
  15. Chang, C.-H.; Qiu, J.; O’Sullivan, D.; Buck, M.D.; Noguchi, T.; Curtis, J.D.; Chen, Q.; Gindin, M.; Gubin, M.M.; van der Windt, G.J.W.; et al. Metabolic Competition in the Tumor Microenvironment Is a Driver of Cancer Progression. Cell 2015, 162, 1229–1241. [Google Scholar] [CrossRef]
  16. Tonneau, M.; Phan, K.; Manem, V.S.K.; Low-Kam, C.; Dutil, F.; Kazandjian, S.; Vanderweyen, D.; Panasci, J.; Malo, J.; Coulombe, F.; et al. Generalization optimizing machine learning to improve CT scan radiomics and assess immune checkpoint inhibitors’ response in non-small cell lung cancer: A multicenter cohort study. Front. Oncol. 2023, 13, 1196414. [Google Scholar] [CrossRef]
  17. Wiesweg, M.; Mairinger, F.; Reis, H.; Goetz, M.; Walter, R.; Hager, T.; Metzenmacher, M.; Eberhardt, W.; McCutcheon, A.; Köster, J.; et al. Machine learning-based predictors for immune checkpoint inhibitor therapy of non-small-cell lung cancer. Ann. Oncol. 2019, 30, 655–657. [Google Scholar] [CrossRef] [PubMed]
  18. Sung, J.-Y.; Cheong, J.-H. Machine Learning Predictor of Immune Checkpoint Blockade Response in Gastric Cancer. Cancers 2022, 14, 3191. [Google Scholar] [CrossRef] [PubMed]
  19. Mestrallet, G. Predicting Immunotherapy Outcomes in Glioblastoma Patients through Machine Learning. Cancers 2024, 16, 408. [Google Scholar] [CrossRef] [PubMed]
  20. Mestrallet, G. Prediction of Glioma Resistance to Immune Checkpoint Inhibitors Based on Mutation Profile. Neuroglia 2024, 5, 145–154. [Google Scholar] [CrossRef]
  21. Eddy, J.A.; Thorsson, V.; Lamb, A.E.; Gibbs, D.L.; Heimann, C.; Yu, J.X.; Chung, V.; Chae, Y.; Dang, K.; Vincent, B.G.; et al. CRI iAtlas: An interactive portal for immuno-oncology research. F1000Research 2020, 9, 1028. [Google Scholar] [CrossRef]
  22. Zhao, J.; Chen, A.X.; Gartrell, R.D.; Silverman, A.M.; Aparicio, L.; Chu, T.; Bordbar, D.; Shan, D.; Samanamud, J.; Mahajan, A.; et al. Immune and genomic correlates of response to anti-PD-1 immunotherapy in glioblastoma. Nat. Med. 2019, 25, 462–469. [Google Scholar] [CrossRef] [PubMed]
  23. Gide, T.N.; Quek, C.; Menzies, A.M.; Tasker, A.T.; Shang, P.; Holst, J.; Madore, J.; Lim, S.Y.; Velickovic, R.; Wongchenko, M.; et al. Distinct Immune Cell Populations Define Response to Anti-PD-1 Monotherapy and Anti-PD-1/Anti-CTLA-4 Combined Therapy. Cancer Cell 2019, 35, 238–255.e6. [Google Scholar] [CrossRef]
  24. Hugo, W.; Zaretsky, J.M.; Sun, L.; Song, C.; Moreno, B.H.; Hu-Lieskovan, S.; Berent-Maoz, B.; Pang, J.; Chmielowski, B.; Cherry, G.; et al. Genomic and Transcriptomic Features of Response to Anti-PD-1 Therapy in Metastatic Melanoma. Cell 2016, 165, 35–44. [Google Scholar] [CrossRef] [PubMed]
  25. Liu, D.; Schilling, B.; Liu, D.; Sucker, A.; Livingstone, E.; Jerby-Arnon, L.; Zimmer, L.; Gutzmer, R.; Satzger, I.; Loquai, C.; et al. Integrative molecular and clinical modeling of clinical outcomes to PD1 blockade in patients with metastatic melanoma. Nat. Med. 2019, 25, 1916–1927. [Google Scholar] [CrossRef]
  26. Riaz, N.; Havel, J.J.; Makarov, V.; Desrichard, A.; Urba, W.J.; Sims, J.S.; Hodi, F.S.; Martín-Algarra, S.; Mandal, R.; Sharfman, W.H.; et al. Tumor and Microenvironment Evolution during Immunotherapy with Nivolumab. Cell 2017, 171, 934–949.e16. [Google Scholar] [CrossRef]
  27. Van Allen, E.M.; Miao, D.; Schilling, B.; Shukla, S.A.; Blank, C.; Zimmer, L.; Sucker, A.; Hillen, U.; Foppen, M.H.G.; Goldinger, S.M.; et al. Genomic correlates of response to CTLA-4 blockade in metastatic melanoma. Science 2015, 350, 207–211. [Google Scholar] [CrossRef] [PubMed]
  28. Chen, P.-L.; Roh, W.; Reuben, A.; Cooper, Z.A.; Spencer, C.N.; Prieto, P.A.; Miller, J.P.; Bassett, R.L.; Gopalakrishnan, V.; Wani, K.; et al. Analysis of Immune Signatures in Longitudinal Tumor Samples Yields Insight into Biomarkers of Response and Mechanisms of Resistance to Immune Checkpoint Blockade. Cancer Discov. 2016, 6, 827–837. [Google Scholar] [CrossRef]
  29. Prat, A.; Navarro, A.; Paré, L.; Reguart, N.; Galván, P.; Pascual, T.; Martínez, A.; Nuciforo, P.; Comerma, L.; Alos, L.; et al. Immune-Related Gene Expression Profiling After PD-1 Blockade in Non–Small Cell Lung Carcinoma, Head and Neck Squamous Cell Carcinoma, and Melanoma. Cancer Res. 2017, 77, 3540–3550. [Google Scholar] [CrossRef]
  30. Choueiri, T.K.; Fishman, M.N.; Escudier, B.; McDermott, D.F.; Drake, C.G.; Kluger, H.; Stadler, W.M.; Perez-Gracia, J.L.; McNeel, D.G.; Curti, B.; et al. Immunomodulatory Activity of Nivolumab in Metastatic Renal Cell Carcinoma. Clin. Cancer Res. 2016, 22, 5461–5471. [Google Scholar] [CrossRef]
  31. Miao, D.; Margolis, C.A.; Gao, W.; Voss, M.H.; Li, W.; Martini, D.J.; Norton, C.; Bossé, D.; Wankowicz, S.M.; Cullen, D.; et al. Genomic correlates of response to immune checkpoint therapies in clear cell renal cell carcinoma. Science 2018, 359, 801–806. [Google Scholar] [CrossRef] [PubMed]
  32. McDermott, D.F.; Huseni, M.A.; Atkins, M.B.; Motzer, R.J.; Rini, B.I.; Escudier, B.; Fong, L.; Joseph, R.W.; Pal, S.K.; Reeves, J.A.; et al. Clinical activity and molecular correlates of response to atezolizumab alone or in combination with bevacizumab versus sunitinib in renal cell carcinoma. Nat. Med. 2018, 24, 749–757. [Google Scholar] [CrossRef]
  33. Kim, S.T.; Cristescu, R.; Bass, A.J.; Kim, K.-M.; Odegaard, J.I.; Kim, K.; Liu, X.Q.; Sher, X.; Jung, H.; Lee, M.; et al. Comprehensive molecular characterization of clinical responses to PD-1 inhibition in metastatic gastric cancer. Nat. Med. 2018, 24, 1449–1458. [Google Scholar] [CrossRef] [PubMed]
  34. Balar, A.V.; Galsky, M.D.; Rosenberg, J.E.; Powles, T.; Petrylak, D.P.; Bellmunt, J.; Loriot, Y.; Necchi, A.; Hoffman-Censits, J.; Perez-Gracia, J.L.; et al. Atezolizumab as first-line treatment in cisplatin-ineligible patients with locally advanced and metastatic urothelial carcinoma: A single-arm, multicentre, phase 2 trial. Lancet 2017, 389, 67–76, Erratum in Lancet 2017, 390, 848. [Google Scholar] [CrossRef]
  35. Mestrallet, G. Software development for severe burn diagnosis and autologous skin substitute production. Comput. Methods Programs Biomed. Update 2022, 2, 100069. [Google Scholar] [CrossRef]
  36. Mestrallet, G. Software development to estimate herd profitability according to nutrition parameters. agriRxiv 2023, 2023, 20230009899. [Google Scholar] [CrossRef]
  37. Liu, S.; Liang, J.; Liu, Z.; Zhang, C.; Wang, Y.; Watson, A.H.; Zhou, C.; Zhang, F.; Wu, K.; Zhang, F.; et al. The Role of CD276 in Cancers. Front. Oncol. 2021, 11, 654684. [Google Scholar] [CrossRef] [PubMed]
  38. Fan, L.; Wang, X.; Chang, Q.; Wang, Y.; Yang, W.; Liu, L. IL2RA is a prognostic indicator and correlated with immune characteristics of pancreatic ductal adenocarcinoma. Medicine 2022, 101, e30966. [Google Scholar] [CrossRef]
  39. Kaplanov, I.; Carmi, Y.; Kornetsky, R.; Shemesh, A.; Shurin, G.V.; Shurin, M.R.; Dinarello, C.A.; Voronov, E.; Apte, R.N. Blocking IL-1β reverses the immunosuppression in mouse breast cancer and synergizes with anti–PD-1 for tumor abrogation. Proc. Natl. Acad. Sci. USA 2019, 116, 1361–1369. [Google Scholar] [CrossRef]
  40. Aggen, D.H.; Ager, C.R.; Obradovic, A.Z.; Chowdhury, N.; Ghasemzadeh, A.; Mao, W.; Chaimowitz, M.G.; Lopez-Bujanda, Z.A.; Spina, C.S.; Hawley, J.E.; et al. Blocking IL1 Beta Promotes Tumor Regression and Remodeling of the Myeloid Compartment in a Renal Cell Carcinoma Model: Multidimensional Analyses. Clin. Cancer Res. 2021, 27, 608–621. [Google Scholar] [CrossRef]
  41. de Streel, G.; Lucas, S. Targeting immunosuppression by TGF-β1 for cancer immunotherapy. Biochem. Pharmacol. 2021, 192, 114697. [Google Scholar] [CrossRef] [PubMed]
  42. Chen, J.; Ye, X.; Pitmon, E.; Lu, M.; Wan, J.; Jellison, E.R.; Adler, A.J.; Vella, A.T.; Wang, K. IL-17 inhibits CXCL9/10-mediated recruitment of CD8+ cytotoxic T cells and regulatory T cells to colorectal tumors. J. Immunother. Cancer 2019, 7, 324. [Google Scholar] [CrossRef] [PubMed]
  43. Vazirinejad, R.; Ahmadi, Z.; Kazemi Arababadi, M.; Hassanshahi, G.; Kennedy, D. The Biological Functions, Structure and Sources of CXCL10 and Its Outstanding Part in the Pathophysiology of Multiple Sclerosis. Neuroimmunomodulation 2014, 21, 322–330. [Google Scholar] [CrossRef]
  44. Marques, R.E.; Guabiraba, R.; Russo, R.C.; Teixeira, M.M. Targeting CCL5 in inflammation. Expert Opin. Ther. Targets 2013, 17, 1439–1460. [Google Scholar] [CrossRef] [PubMed]
Figure 1. Overall survival of cancer patients according to immune checkpoint blockade. Overall survival was calculated in all cohorts. There were 298 BLCA patients treated with Atezolizumab (A), 165 KIRC patients treated with Atezolizumab (B), 32 SKCM patients treated with Ipilimumab and Pembrolizumab (C), 34 GBM patients treated with Pembrolizumab (D) and 45 STAD patients treated with Pembrolizumab (E).
Onco 04 00014 g001
Figure 2. Immune response in cancer patients according to response following immune checkpoint blockade. All immune cell scores were statistically different between responders/non-progressors and non-responders/progressors to immunotherapy in multiple cancer cohorts. Immune cell scores were measured using CRI iAtlas; p < 0.05, Wilcoxon t-test; (A) n = 298 for BLCA and Atezolizumab; (B) n = 165 for KIRC and Atezolizumab; (C) n = 34 for Pembrolizumab and GBM; (D) n = 32 for Ipilimumab and Pembrolizumab and SKCM; and (E) n = 45 for Pembrolizumab and STAD.
Onco 04 00014 g002
Figure 3. Immunomodulatory molecule expression in cancer patients according to response following immune checkpoint blockade. Immunoregulatory gene expression in cancer patients according to response following immune checkpoint blockade. All immune gene scores were statistically different between responders/non-progressors and non-responders/progressors to immunotherapy in multiple cancer cohorts. Immune gene scores were measured using CRI iAtlas; p < 0.05, Wilcoxon t-test; (A) n = 298 for BLCA and Atezolizumab; (B) n = 165 for KIRC and Atezolizumab; (C) n = 34 for Pembrolizumab and GBM; (D) n = 32 for Ipilimumab and Pembrolizumab and SKCM; and (E) n = 45 for Pembrolizumab and STAD.
Onco 04 00014 g003
Figure 4. Software-assisted personalized prediction of cancer patient response to immune checkpoint blockade.
Onco 04 00014 g004
Table 1. Responses of patients with cancer to immune checkpoint blockade.
DrugIpilimumab and PembrolizumabPembrolizumabPembrolizumabAtezolizumabAtezolizumab
Cancer typeSKCMGBMSTADBLCAKIRC
TargetCTLA4 and PD1PD1PD1PDL1PDL1
Responders (number)2015
(Non-progressors)
126848
Non-responders (number)1219
(Progressors)
33230117
Responders (%)62.54427 2329
Non-responders (%)37.556737771
Table 2. Performance of the algorithms predicting cancer patient response to immune checkpoint blockade.
Cancer TypeRandom Forest AccuracyGradient Boosting AccuracyLogistic Regression AccuracySupport Vector Machine Accuracy
Melanoma (SKCM)10.880.630.88
Stomach cancer (STAD)10.890.780.78
Glioblastoma (GBM)0.820.730.730.55
Renal cancer (KIRC)0.790.760.790.67
Bladder cancer (BLCA)0.90.850.90.87
Disclaimer/Publisher’s Note: The statements, opinions and data contained in all publications are solely those of the individual author(s) and contributor(s) and not of MDPI and/or the editor(s). MDPI and/or the editor(s) disclaim responsibility for any injury to people or property resulting from any ideas, methods, instructions or products referred to in the content.

