Abstract
Phosphorus is a major essential element in plants, and the absorption and transport of P are related to crop growth and productivity. Phosphate (Pi) is absorbed in the roots and transported to the shoot. Plants store surplus Pi in the vacuoles. The characteristics of Pi storage and turnover in various parts of the nodulated soybeans might be related to plant growth and P-use efficiency. This research focused on the changes in the Pi concentrations and Pi contents in each part of young soybean plants grown in Pi-sufficient (50 μM Pi) or Pi-deficient (0 μM Pi) conditions. Also, the Pi flux rate in xylem sap from roots to shoot was determined. The growth of the plants was the same after 7 days of Pi-sufficient and Pi-deficient treatments. During the Pi-deficient period, the Pi concentrations in the roots, leaves, and stems decreased significantly but did not deplete. The decrease in Pi concentration in nodules was much slower than the other parts. After the re-supply of 50 μM Pi in the solution, the Pi concentration increased only a little in each part of the Pi-deficient plants. The Pi concentration and Pi flux in the xylem sap quickly responded to the changes in the Pi concentration in the culture solution.
1. Introduction
Phosphorus (P) is the second-most limiting macronutrient in crop production after nitrogen (N). P is an essential component of nucleic acids, lipids, proteins, sugars, energy molecules (ATP and ADP), and NADPH, implying that P has a central role in the structural component of cellular molecules [1,2]. In addition, P plays essential roles in photosynthesis, respiration, and energy transformation, and the regulatory role through the phosphorylation and dephosphorylation of enzymes, which is vital in plants. P is sometimes a limiting factor in the growth and productivity of crops because the available P levels in soils are generally low, and the P mobility in soil is slow [2,3]. Soybeans require a relatively large amount of P, especially during pod set [4]. P is essential for the N2 fixation by the root nodules associated with rhizobia, and it has been reported that the P deficiency represses nodule formation and nitrogen fixation in soybean plants [5,6,7,8,9]. The main P-deficiency symptom is retarded plant growth. The leaf blade may curl up and turn dark green, and flowering and maturity are delayed [4]. Contrarily, the excess symptoms are not generally observed in the plants grown in soils because Pi is readily fixed by the soil minerals or absorbed by soil microorganisms. However, plants show excess symptoms when grown in solution culture under a high concentration of Pi and show inferior root and shoot growth and leaf burn [10]. Therefore, it is necessary to understand the P absorption, P accumulation, and P transport processes to obtain optimum growth and a high yield of soybean plants with the efficient use of P fertilizers.
Plant roots absorb P from soil solutions mainly in the form of H2PO4− in natural pH conditions [3], and plants can not directly absorb the organic P forms relatively abundant in soil [1]. Plant roots depend on high-affinity phosphate transporters (PHTs) to absorb Pi, and the uptake of Pi is an energy-mediated process driven by a proton-motive force [1].
Because the Pi concentration in soil is generally low and changes extensively, plants have evolved various Pi acquisition mechanisms and complex Pi starvation responses involving biochemical and developmental adaptation [11,12]. Under Pi starvation, the root/shoot ratio generally increases to support root growth and Pi absorption [13]. In addition, the lateral root growth increases, despite restricting the tap root growth. P-deficiency increases the length and density of root hair, and the exudation of carboxylate and phosphatase from the roots to solubilize Pi in the soil [14,15,16]. Mycorrhizal symbiosis extends the Pi absorption space and increases the soil volume available for Pi acquisition [3].
The Pi starvation responses have been revealed, involving the sensing mechanisms of the external and internal Pi concentrations coordinated with local and long-distance signaling pathways. The downstream actions governed by these signaling pathways include local responses for remodeling the root system architecture and systemic responses for modulating the activities of Pi uptake, remobilization, and recycling [12]. Pi is a primary signal that directly regulates Pi starvation responses and generates the subsequent signals, such as hormones, sugars, P-containing metabolites, peptides, and mobile RNAs [12].
Some part of the absorbed Pi in the roots is transported radially from the epidermis and cortex to the stele; then, it is unloaded to the xylem vessels and transported to the shoot via transpiration and root pressure. In addition, surplus Pi absorbed in the roots is tentatively stored in the roots, especially in the vacuoles of the cells [17]. The stored Pi in the vacuole will provide Pi to the growing parts when the external Pi supply is low. Either currently absorbed Pi or stored Pi in the vacuole is transported via xylem vessels from the roots to the leaf blades through stems and petioles. The Pi transported to the leaves may be re-transported to the roots and buds via the phloem. Regarding Pi transport pathways in the nodules, two pathways are possible; one is the transport pathway from leaves through phloem vessels, and the other is directly through absorption from the nodule surface.
In the vacuolated cells of higher plants, the vacuole acts as a storage pool or a “non-metabolic pool” of Pi, and with adequate Pi supply, 85–95% of the total Pi is localized in the vacuoles [18]. In contrast, in the leaves of Pi-deficient plants, virtually all Pi is localized to the cytosol and chloroplasts, the “metabolic pool” of Pi in the plant [1,18]. Therefore, vacuolar Pi can buffer the cytoplasmic Pi level against fluctuations caused by a variable external Pi supply or through metabolic activities in the cells. Up to now, only a few reports have been published investigating Pi transport across the tonoplast [5]. When the plants are grown with a limited P supply, they dramatically decrease their tissue P concentration, especially the Pi concentration [19], and they cannot maintain Pi homeostasis. Under Pi deprivation, a depletion of the vacuolar Pi pool occurs first, followed by a large reduction in cytosolic Pi and organic P levels [19]. Lauer et al. [20] reported that for soybean at the full-flowering stage, the vacuolar Pi concentration decreased from 8.0 to <0.05 mM as the Pi supply declined, whereas the cytosolic Pi concentration declined considerably less markedly, from 8.3 to 0.23 mM.
So far, the storage and release of Pi (Pi turnover) in various organs of soybean plants is not well known. In the previous paper [19], after 15 days of Pi deprivation in the culture solution, the plant growth and the transpiration rates tended to decrease compared with Pi-sufficient conditions. During 15 days under Pi-deficient conditions, the Pi concentration in the xylem sap decreased from 2 mM to 0.3 mM. A small amount of Pi in the xylem sap after 15 days of Pi deprivation must come from the Pi storage pool in the roots. In another experiment in the same paper [19], the nodulated soybean plants were treated with 7 levels of Pi from 0 to 500 μM in the culture solution for 3 days. The surplus P under excess Pi conditions was stored in the inorganic Pi form in the roots and leaves, and the concentrations of the organic P fractions were not significantly affected by Pi concentration in the culture solution and accounted for a small portion compared with Pi. Therefore, Pi is a principal storage form of P in each organ of the soybean plants. It is also true in plant leaves that, under Pi-deficient conditions, the organic P fractions including nucleic acids, lipid-P, and ester P were dominant, but under P-sufficient conditions Pi was a major fraction compared with the organic P fractions [21]. So, we investigated the changes in the growth characteristics and the Pi concentration and Pi content in each part of soybean plants treated with Pi-sufficient and Pi-deficient treatments for 7 days. After Pi-deficient treatment, the plants were re-supplied with Pi for the following 7 days. In addition, we investigated the responses of the Pi concentration in xylem sap to the changing Pi conditions related to the diagnosis of the P nutrition using xylem sap [22].
2. Materials and Methods
2.1. Plant Cultivation
Soybean plants can use both the symbiotic N2 fixed in the nodules and the absorbed N from the roots. In this experiment, we used soybean plants depending on N2 fixation using an N-free culture solution, because the addition of N restricts nodule growth and N2 fixation [23], and soybean plants grown in the fields primarily depend on N2 fixation supplemented with small fractions of N fertilizer and soil-derived N [24]. About 80 soybean (Glycine max (L.) Merr.) seeds were inoculated with a suspension of Bradyrhizobium diazoefficience (strain USDA110, 108 cells/mL) and planted in a vermiculite bed, and cultivated in a biophotochamber (LH-350S; Nippon Medical & Chemical instruments Co., Ltd., Osaka, Japan) under 28 °C-day/18 °C-night temperatures, and 55% relative humidity. The photon flux density was 228 μmol m−2 s−1 with a 16-h photoperiod and an 8-h dark period, the same as in the previous papers [19,22]. A total of 42 of the 7-day-old seedlings were transferred to hydroponics, in which each plant was cultivated with an 800 mL N-free culture solution in a 900 mL glass bottle. The composition of the culture solution was as follows [10]: K2HPO4 50 μM, K2SO4 625 μM, KCl 12.6 μM, CaCl2 1250 μM, MgSO4 500 μM, Fe-EDTA 50 μM, H3BO3 5.94 μM, CuSO4 0.13 μM, MnSO4 0.772 μM, ZnSO4 0.5 μM, CoCl2 0.181 μM, (NH4)6Mo7O24 0.0032 μM, and NiCl2 0.013 μM. Pi concentration in the culture solution was adjusted at 50 μM. The pH of the culture solution was adjusted at 6.0 ± 0.2 either by 0.1 M HCl or by 0.1M NaOH. The culture solution was continuously aerated by an air pump at 0.5 L/min and changed every 2 or 3 days.
2.2. P Treatments
Two P treatments were conducted with a one-factor experiment with two levels; one was Pi-sufficient treatment, in which the plants were grown in a standard solution containing 50 μM K2HPO4 for 14 days during 23–37 days after planting (DAP); another was Pi-deficient treatment, where the plants were grown in a culture solution without Pi, in which 50 μM K2HPO4 replaced by 50 μM K2SO4 for an initial 7 days from 23 DAP to 30 DAP. A group of soybean plants grown under Pi-deficient conditions for 7 days were re-supplied with 50 μM Pi for the successive 7 days from 30 DAP to 37 DAP. Three plants, with each plant used for one replication (n = 3), were sampled at the start of treatment at day 0 (23 DAP), day 1 (24 DAP), day 3 (26 DAP), day 7 (30 DAP), day 8 (31 DAP), day 10 (33 DAP), and day 14 (37 DAP) during P treatments. The shoot of the plants was decapitated at 1 cm below the cotyledonary node by a razor blade, and the xylem sap exudated from the decapitated stump was collected in quartz wool in a plastic tube for 1 h [25] from 10 AM to 12 AM. The transpiration rate was determined by weighing the culture solution in a glass bottle every day before and after cultivation. The plant’s shoot and roots were separately packed in a paper envelope and dried in a ventilation oven at 80 °C for a few days until a constant weight was reached. The leaf blade, stems and petioles, and buds and young leaves were separated from the shoot, and the dry weight of each part was measured. The roots and nodules were separated and weighed. Each part was ground into a fine powder by a grinder.
2.3. Analysis of Pi Concentration and Pi Content
The extraction of Pi from the plant powder was as follows. A total of 20 mg of plant powder was put into a 5 mL plastic tube, and 1 mL pure water was added and mixed. The mixture in the tube was heated in a boiling water bath for 15 min. Next, it was ultrasonicated for 5 min, and the supernatant was separated with a centrifuge at 10,000 rpm for 5 min. The residue was re-extracted twice with 1 mL of water, and the three supernatants were combined and filled up to 3 mL. The Pi concentrations in the plant extract and the xylem sap were analyzed by a modified ascorbic acid–molybdenum blue method [19].
2.4. Statistics
The experiment was conducted with three biological replications. The plants were cultivated using a random arrangement in a growth chamber. Statistical significance using Student’s T-test and Tukey’s test was determined using the statistical analysis program of Biomedical Statistics, Graduate School of Medicine, Osaka University [26].
3. Results
3.1. Comparison of the Growth and the P Status between Pi-Sufficient and Pi-Deficient Treatments
Comparison of the Dry Weight of Each Part
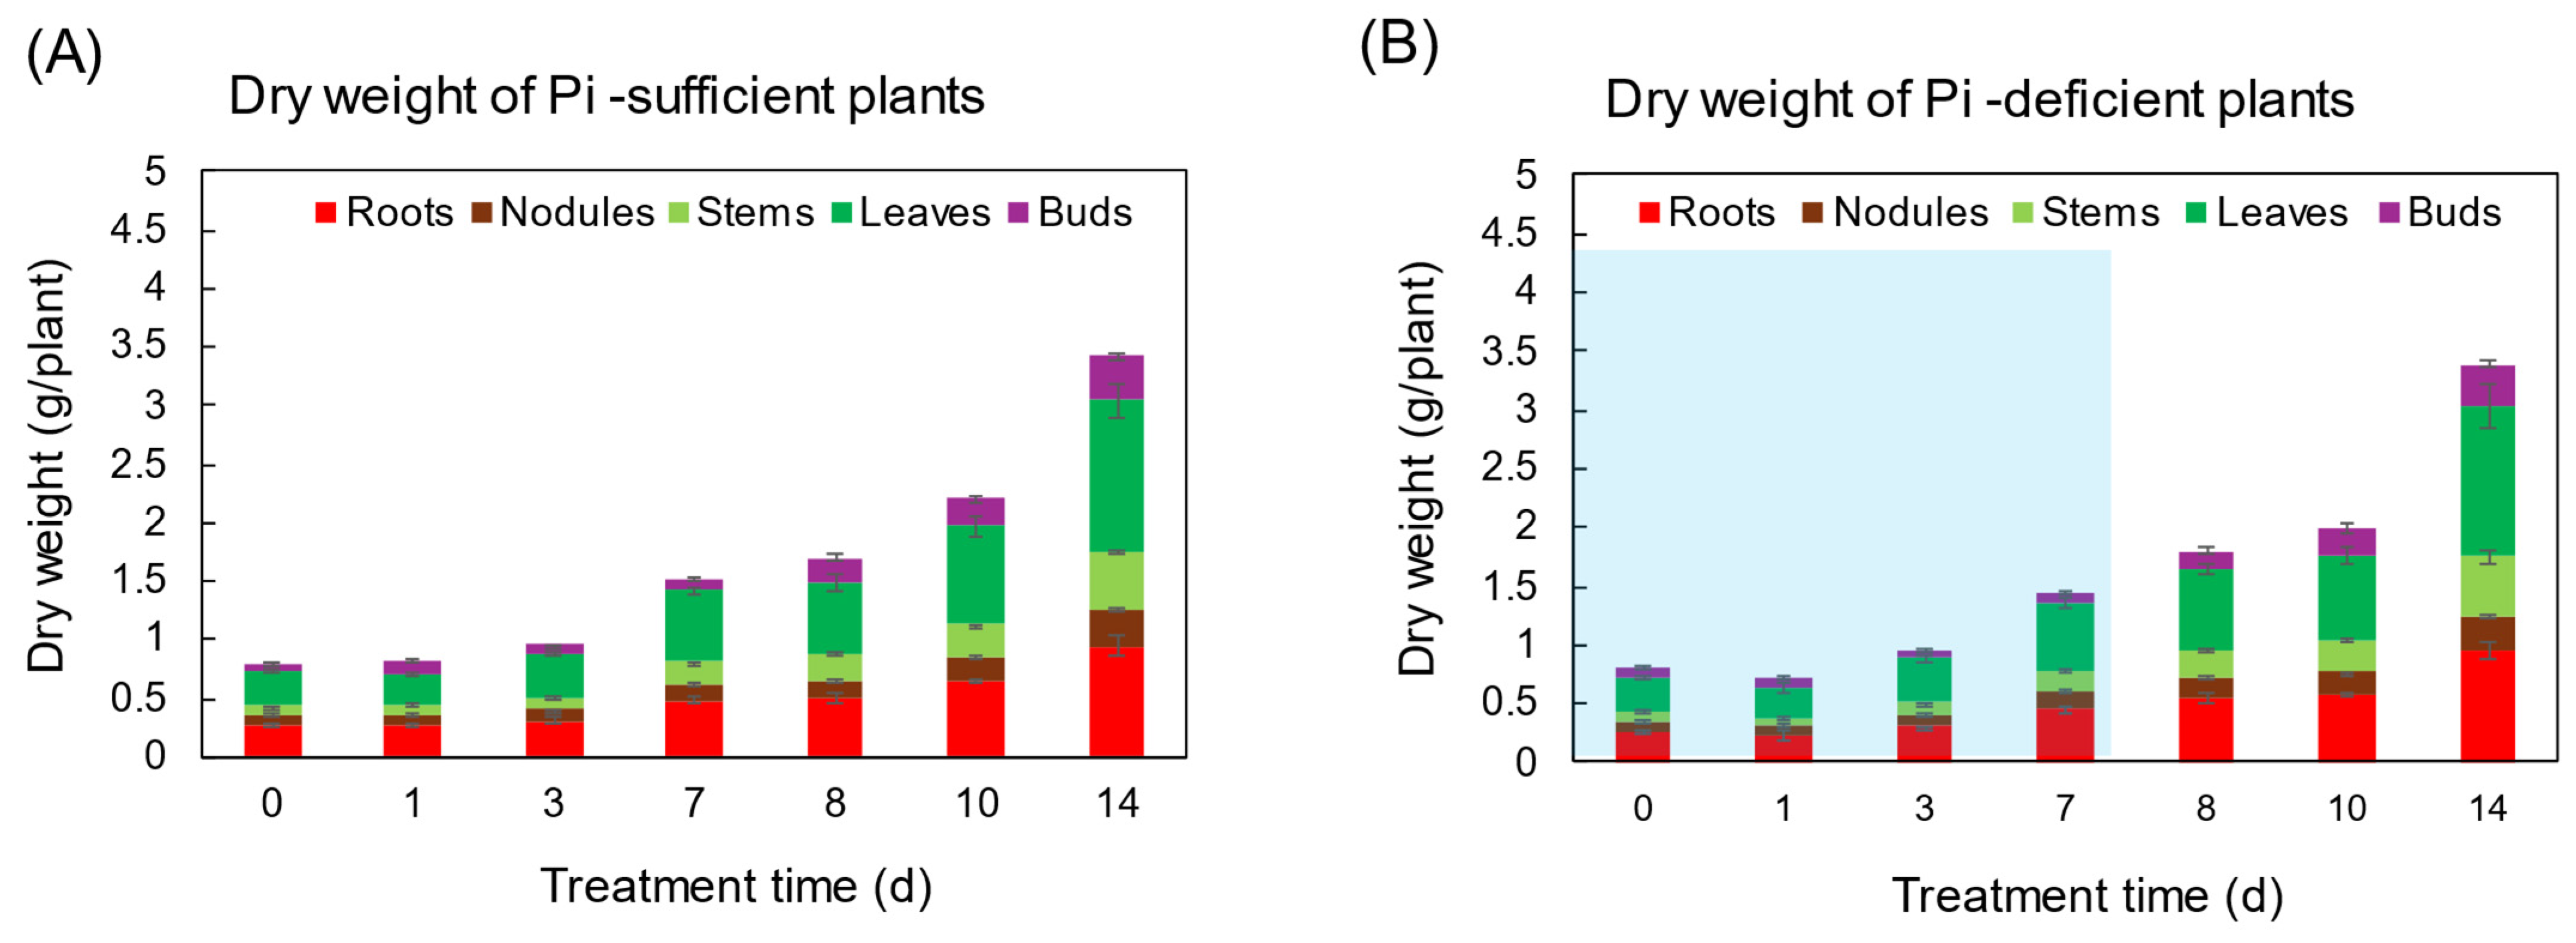
The changes in the total dry weight (DW) and the DW of various parts were not significantly different between Pi-sufficient and Pi-deficient treatments after 7 days (Figure 1). At the beginning of the treatments on day 0 (23 DAP), the total DW of the shoot was 0.80 gDW, and that increased to 1.51 gDW in Pi-sufficient conditions and 1.43 gDW in Pi-deficient conditions on day 7 after P treatments. Pi was re-supplied to the Pi-deficient plants from day 7 to day 14, and the total DW of the plant on day 14 was the same between Pi-sufficient (3.42 gDW) and Pi-deficient (3.39 gDW) conditions. These results suggest that the lack of P for 7 days did not restrict the soybean growth.
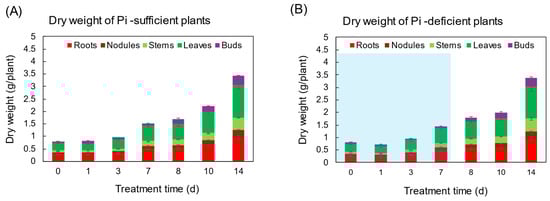
Figure 1.
The effect of Pi-sufficient (A) and Pi-deficient (B) treatments on the dry weight of each part. Pi-deficient treatment was carried out from day 0 to day 7. The blue background in (B) indicates the period of Pi-deficient conditions. Average ± standard error. There was no significant difference in the dry weight of each part between Pi-sufficient and Pi-deficient treatments using Student’s T-test (p < 0.05). n = 3.
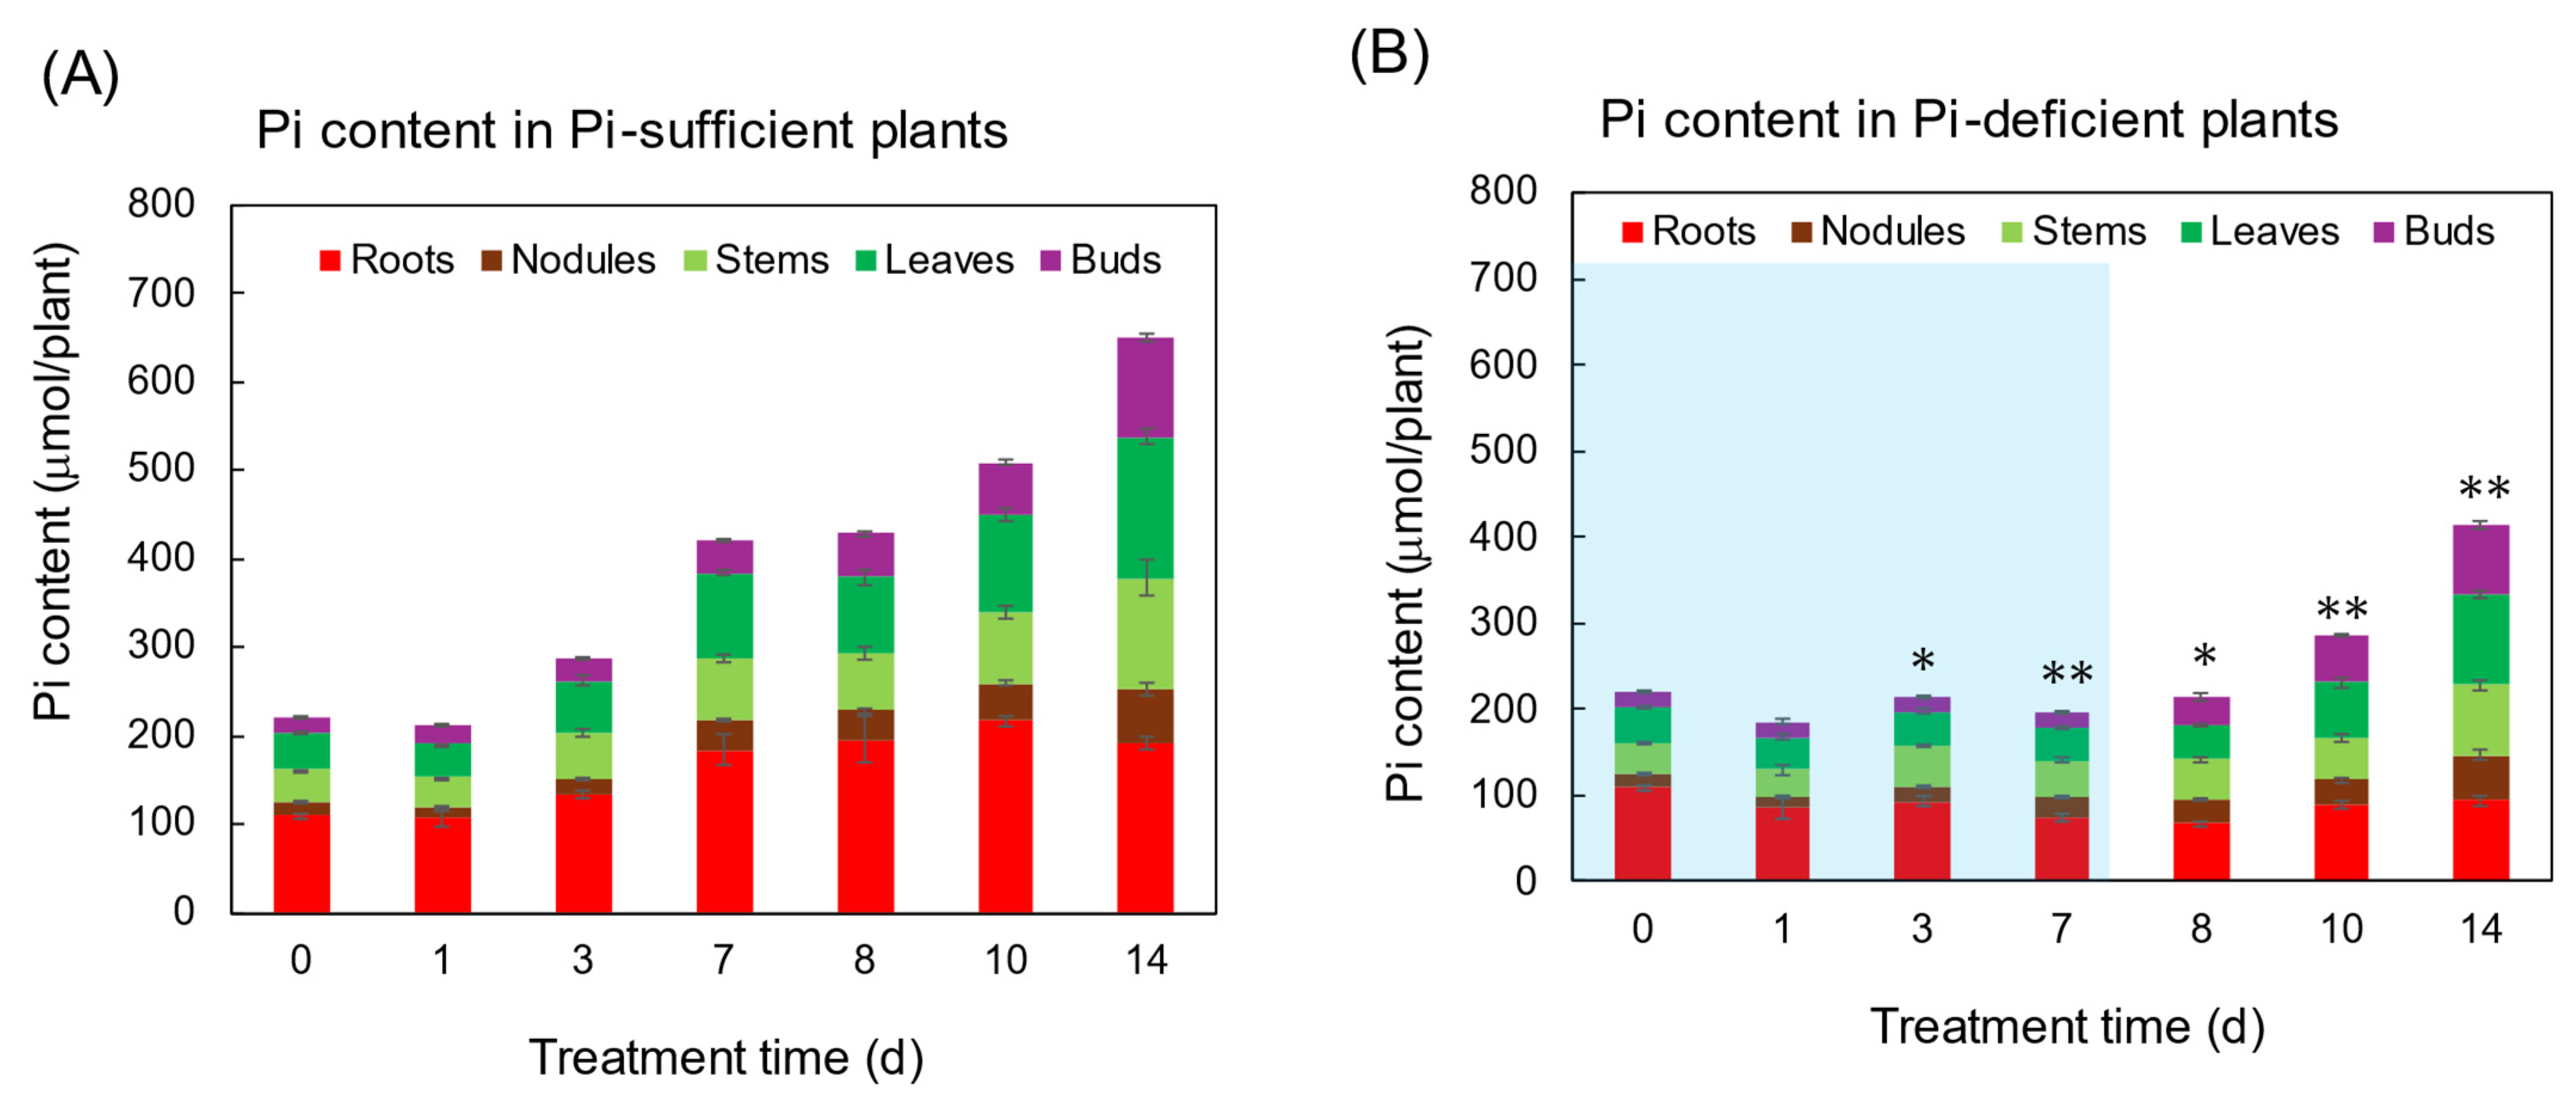
Figure 2 shows the Pi content in each part of the plants grown with Pi-sufficient (A) and Pi-deficient (B) conditions. Total Pi content in Pi-sufficient plants increased from day 0 (222 μmol Pi) until day 7 (421 μmol Pi), and day 14 (650 μmol Pi). On the other hand, the total Pi content in the Pi-deficient plant after 7 days of P deficiency slightly decreased but retained 198 μmol Pi on day 7. After Pi was re-supplied to the Pi-deficient plants on day 7, the Pi-deficient plants accumulated 414 μmol Pi on day 14, in which the balance of 216 μmol Pi was equivalent to the accumulation of Pi-sufficient plants from day 7 to day 14 (229 μmol Pi).
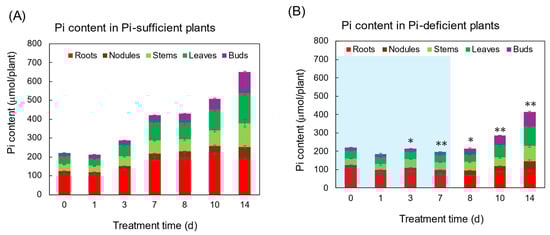
Figure 2.
The effect of Pi-sufficient (A) and Pi-deficient (B) treatments on the Pi content in each part. Average ± standard error. * and ** indicate the significant difference in the total values at 0.01 < p < 0.05 and p < 0.01 between Pi-sufficient and Pi-deficient treatments by Student’s T-test. The blue background in (B) indicates the period of Pi-deficient conditions. n = 3.
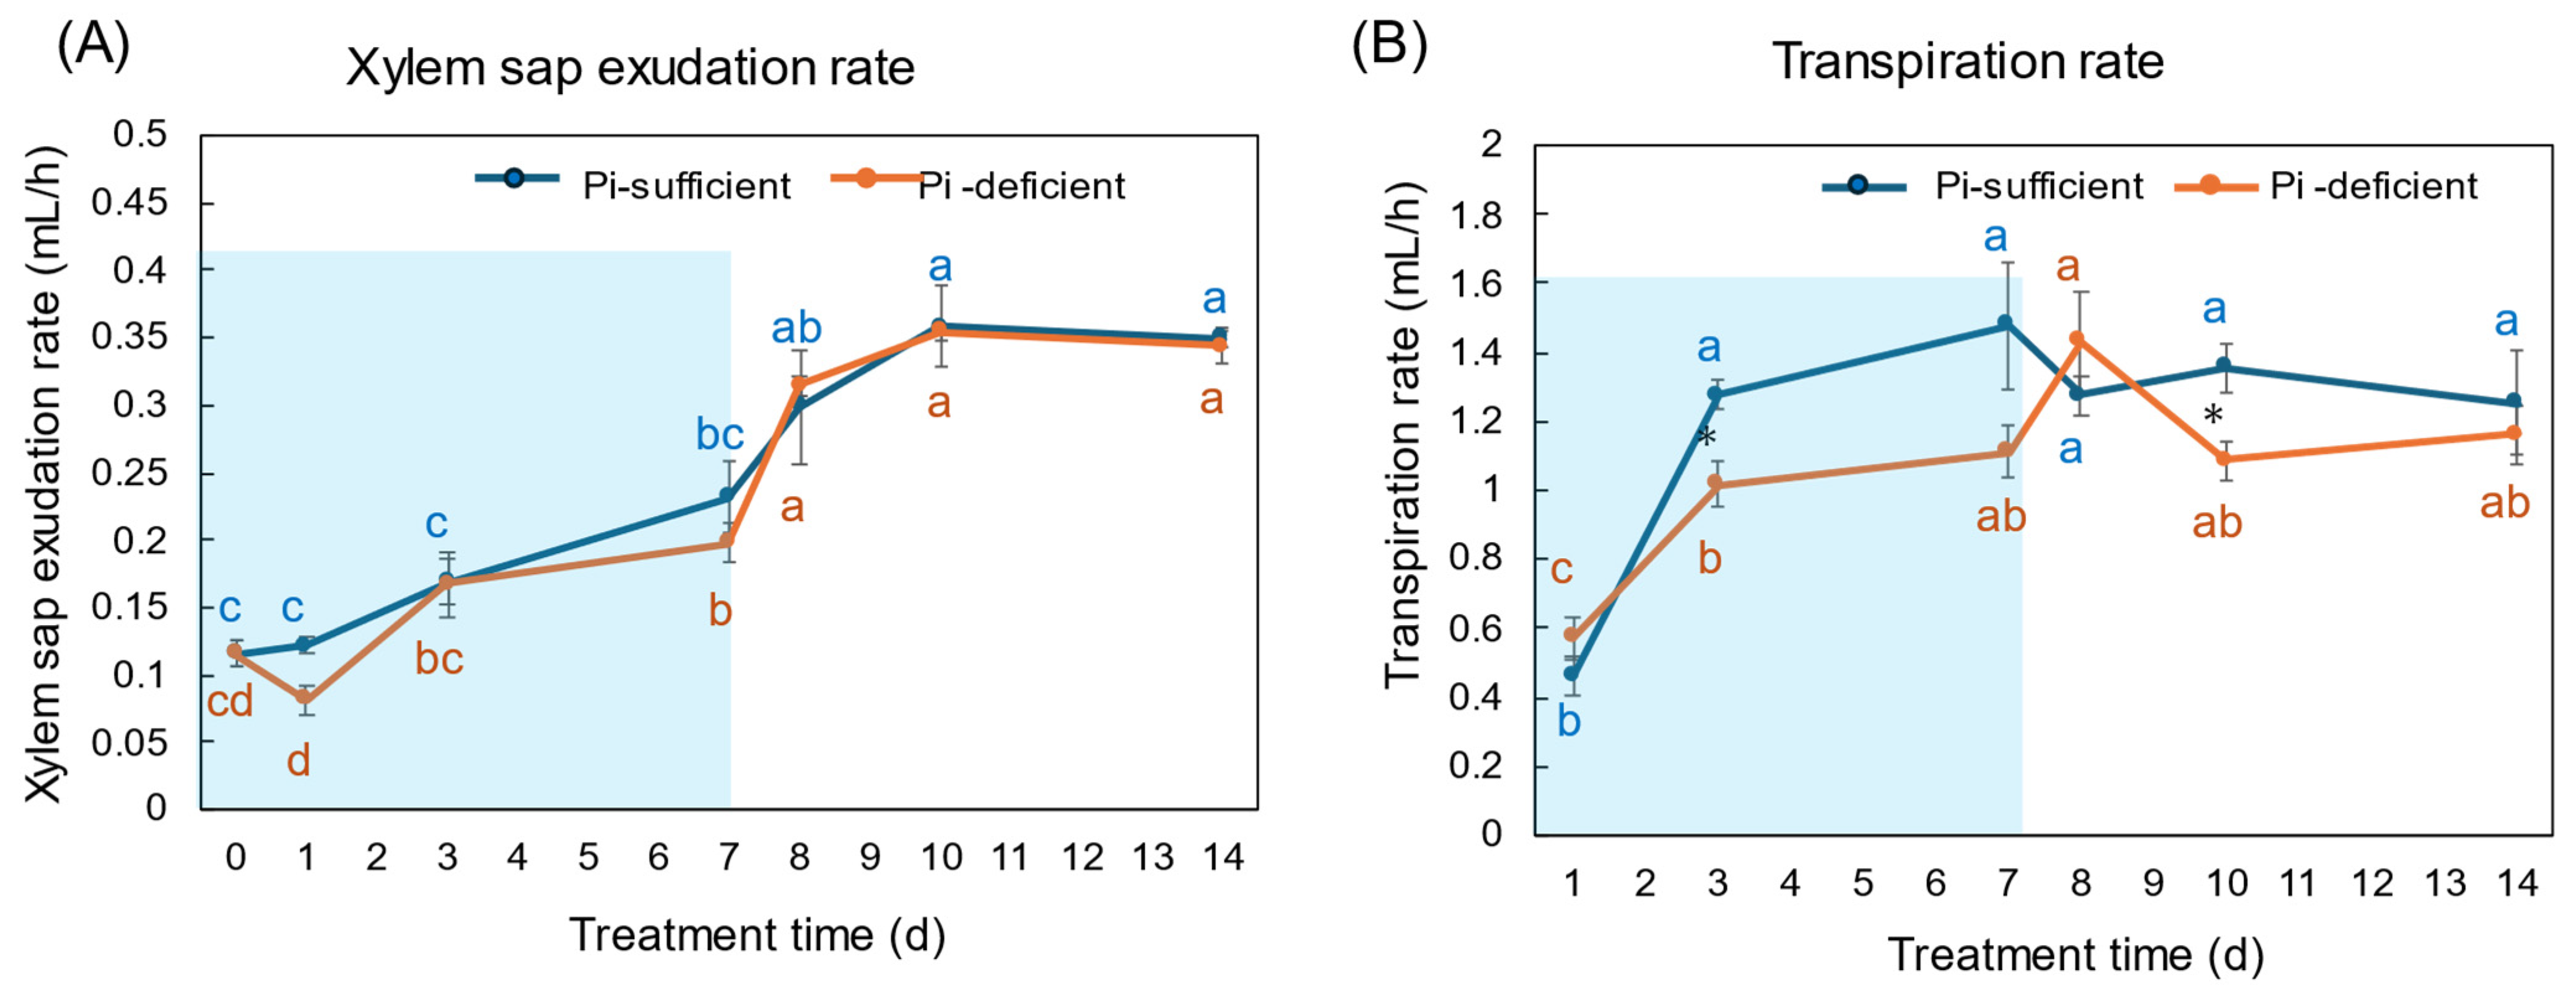
The xylem exudation rates for 1 h were almost the same between Pi-sufficient and Pi-deficient plants (Figure 3A). The xylem exudation rates increased along with plant growth until day 10, but became constant thereafter. On the other hand, the transpiration rates per 1 h tended to be lower in Pi-deficient plants than in Pi-sufficient plants, and those were relatively constant from day 3 to day 14.
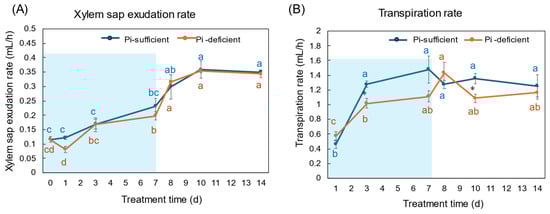
Figure 3.
Effect of Pi-sufficient and Pi-deficient treatments on the xylem sap exudation rate (A) and the transpiration rate (B). The xylem sap was collected for 1 h after the decapitation of the shoot. The transpiration rate was measured by the decrease in the weight of the culture solution for one day just before sampling and divided by a 16 h light period per day. Average ± standard error. Different alphabet indicates the significant difference in the values among treatments times in Pi-sufficient (blue) and Pi-deficient (red) by Tukey’s Test. * indicates the significant difference at p < 0.05 in the values between Pi-sufficient and Pi-deficient treatments by Student’s T-test. The blue background in (B) indicates the period of Pi-deficient conditions. n = 3.
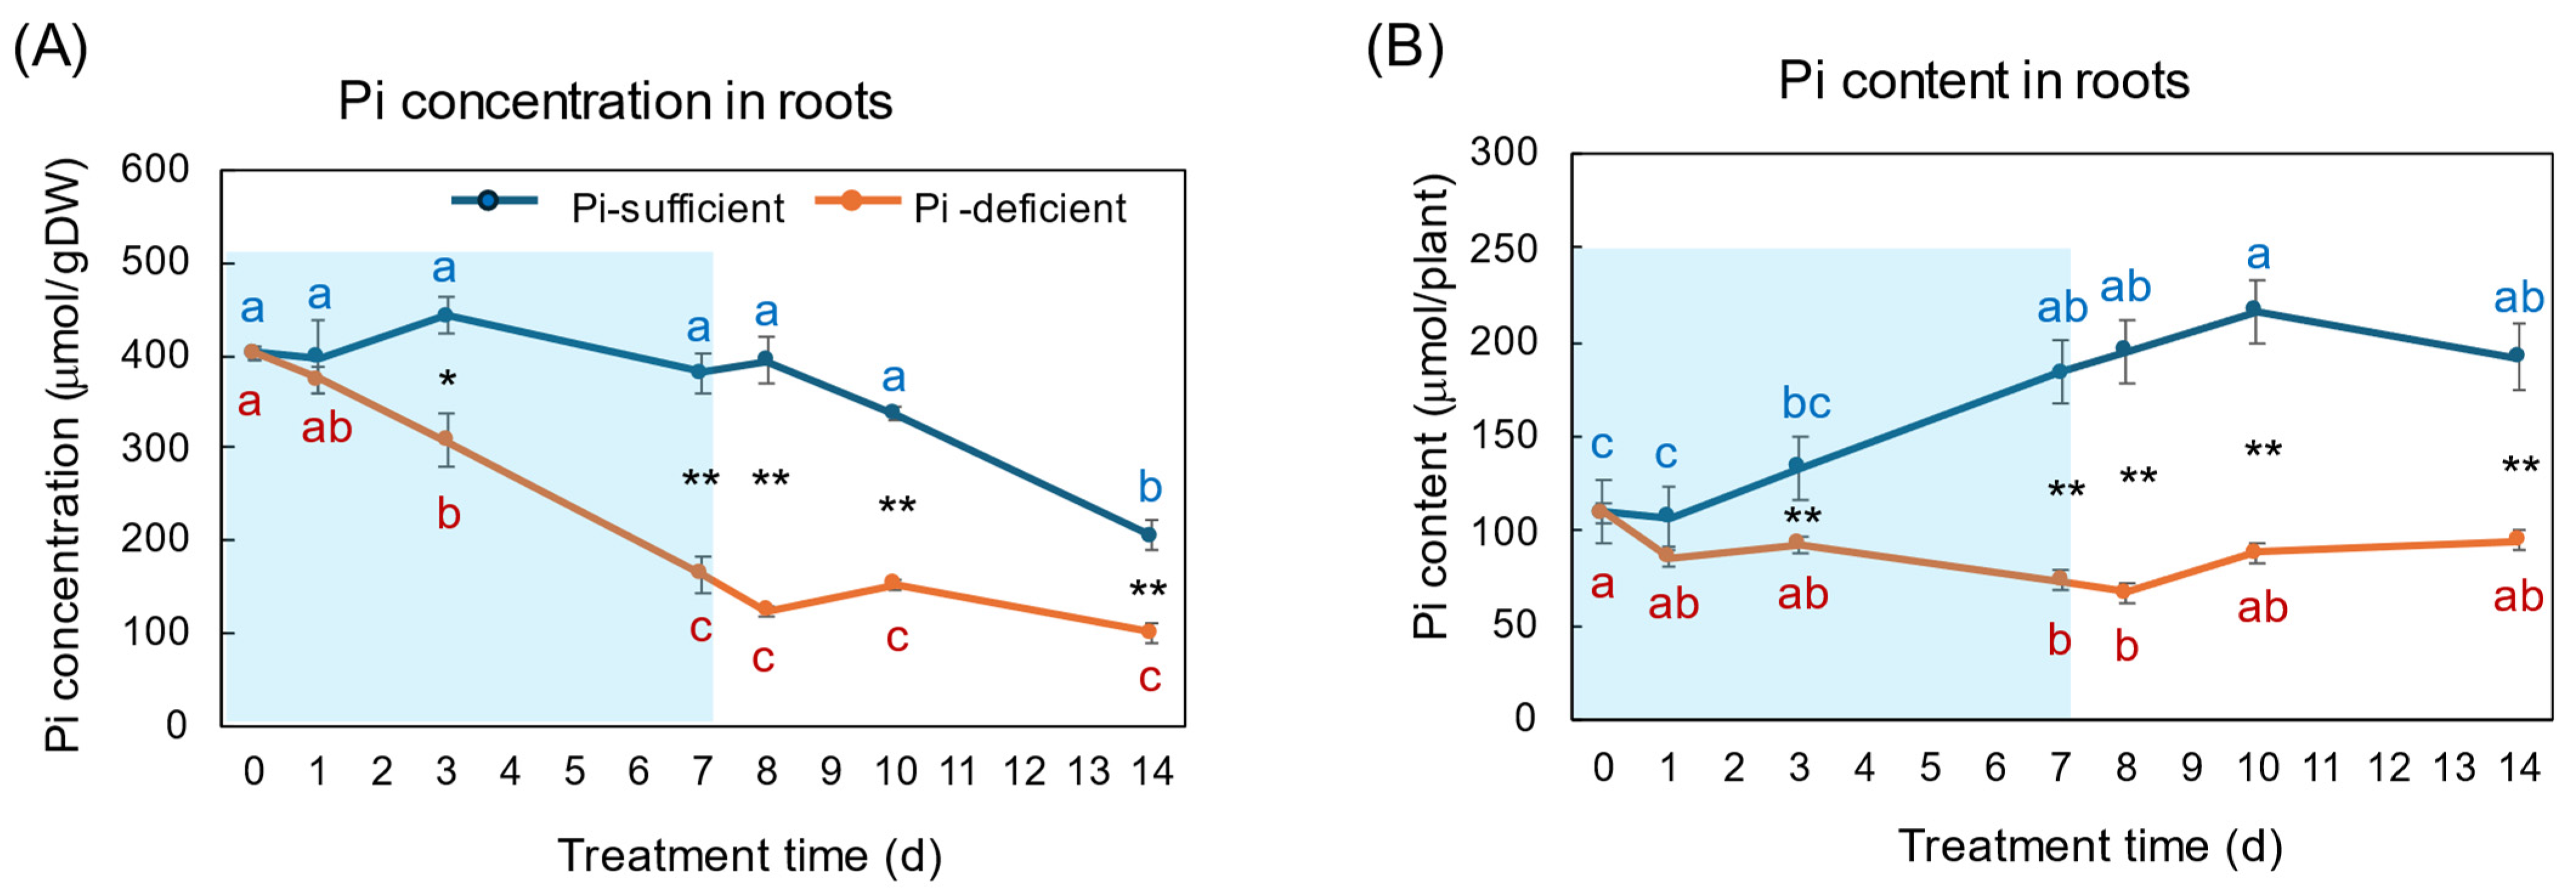
Figure 4A,B show the changes in Pi concentration and Pi content in the roots with Pi-sufficient and Pi-deficient treatments. The Pi concentrations in the roots with Pi-sufficient treatment were constant from day 0 to day 10 around 400 μmol/gDW but decreased on day 14 (A), whereas the Pi content in the roots with Pi-sufficient treatment increased from 110 μmol/plant on day 0 (23 DAP) to 184 μmol on day 7 (30 DAP), and was constant thereafter. The Pi concentration in the roots with Pi-deficient conditions decreased linearly from day 0 (404 μmol/gDW) to day 7 (163 μmol/gDW) during a lack of Pi supply. The Pi concentrations were constant and did not increase after the re-supply of P from day 7 to day 14. The Pi content in the Pi deficient roots was significantly lower (p < 0.01) than the Pi-sufficient ones after day 3 and decreased from day 0 (110 μmol/plant) to day 7 (74 μmol/plant), but Pi remained in the Pi-deficient roots and was not completely depleted. After the re-supply of Pi, the Pi content in the roots tended to increase to 95 μmol/plant on day 14, but was not statistically significant.
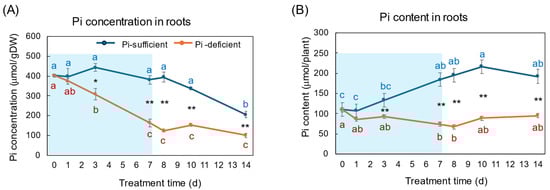
Figure 4.
Comparison of Pi-sufficient and Pi-deficient treatments on Pi concentration (A) and Pi content (B) in the roots. Average ± standard error. Different letters indicate the significant difference in the values among treatments times in Pi-sufficient (blue) and Pi-deficient (red) by Tukey’s Test. * and ** indicate the significant difference in the values at 0.01 < p < 0.05 and p < 0.01 between Pi-sufficient and Pi-deficient treatments by Student’s T-test. The blue background in (B) indicates the period of Pi-deficient conditions. n = 3.
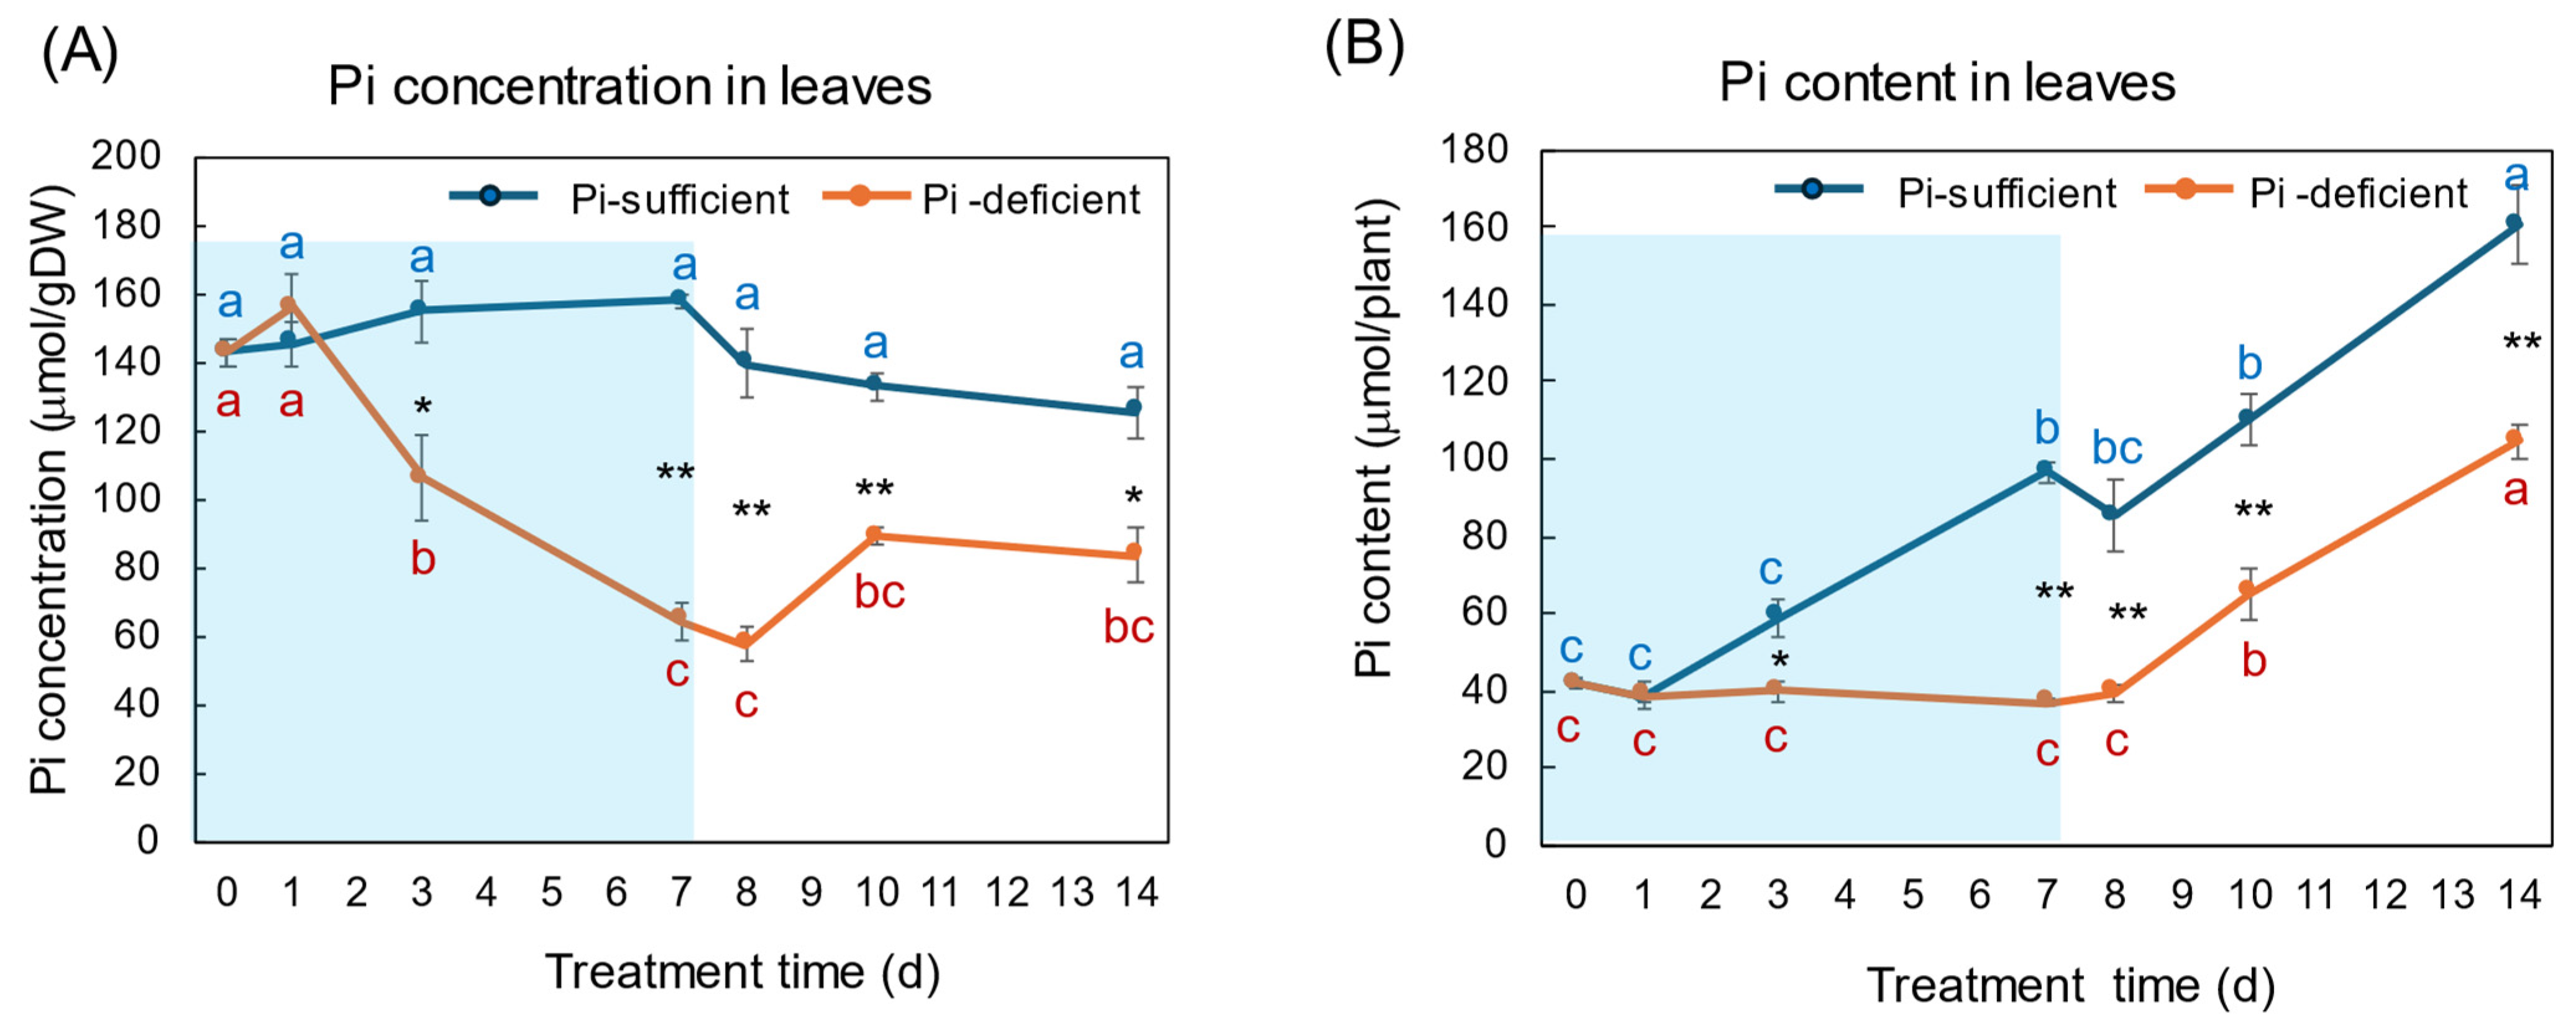
The changes in the Pi concentration and Pi content in the leaves with Pi-sufficient and Pi-deficient treatments are shown in Figure 5A,B, respectively. The Pi concentrations in the leaves with Pi-sufficient treatment were constant from day 0 to day 14 around 120–160 μmol/gDW (A). The Pi content in the leaves with Pi-sufficient treatment increased from 42 μmol/plant on day 0 (23 DAP) to 97 μmol on day 7 (30 DAP), and increased to 161 μmol on day 14, which was due to the increase in the DW. The Pi concentration in the leaves with Pi-deficient conditions decreased linearly from 143 μmol/gDW at day 0 to day 7 (64 μmol/gDW) during a lack of P supply. The Pi concentrations slightly increased after the re-supply of P from day 7 to day 10, but were not statistically significant. The Pi content in the leaves with a Pi-deficient period slightly decreased from day 0 (42 μmol/plant) to day 7 (37 μmol/plant). After the re-supply of Pi, the Pi content in the leaves increased to 105 μmol/plant on day 14.
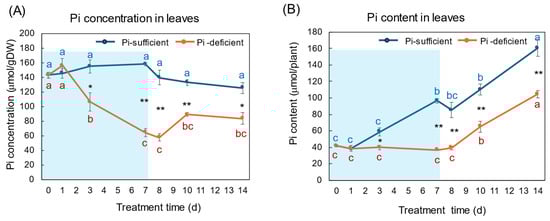
Figure 5.
Comparison of Pi-sufficient and Pi-deficient treatments on Pi concentration (A) and Pi content (B) in the leaves. Average ± standard error. Different letters indicate the significant difference in the values among treatments times in Pi-sufficient (blue) and Pi-deficient (red) by Tukey’s Test. * and ** indicate the significant difference in the values at 0.01 < p < 0.05 and p < 0.01 between Pi-sufficient and Pi-deficient treatments by Student’s T-test. The blue background indicates the period of P-deficient treatment. n = 3.
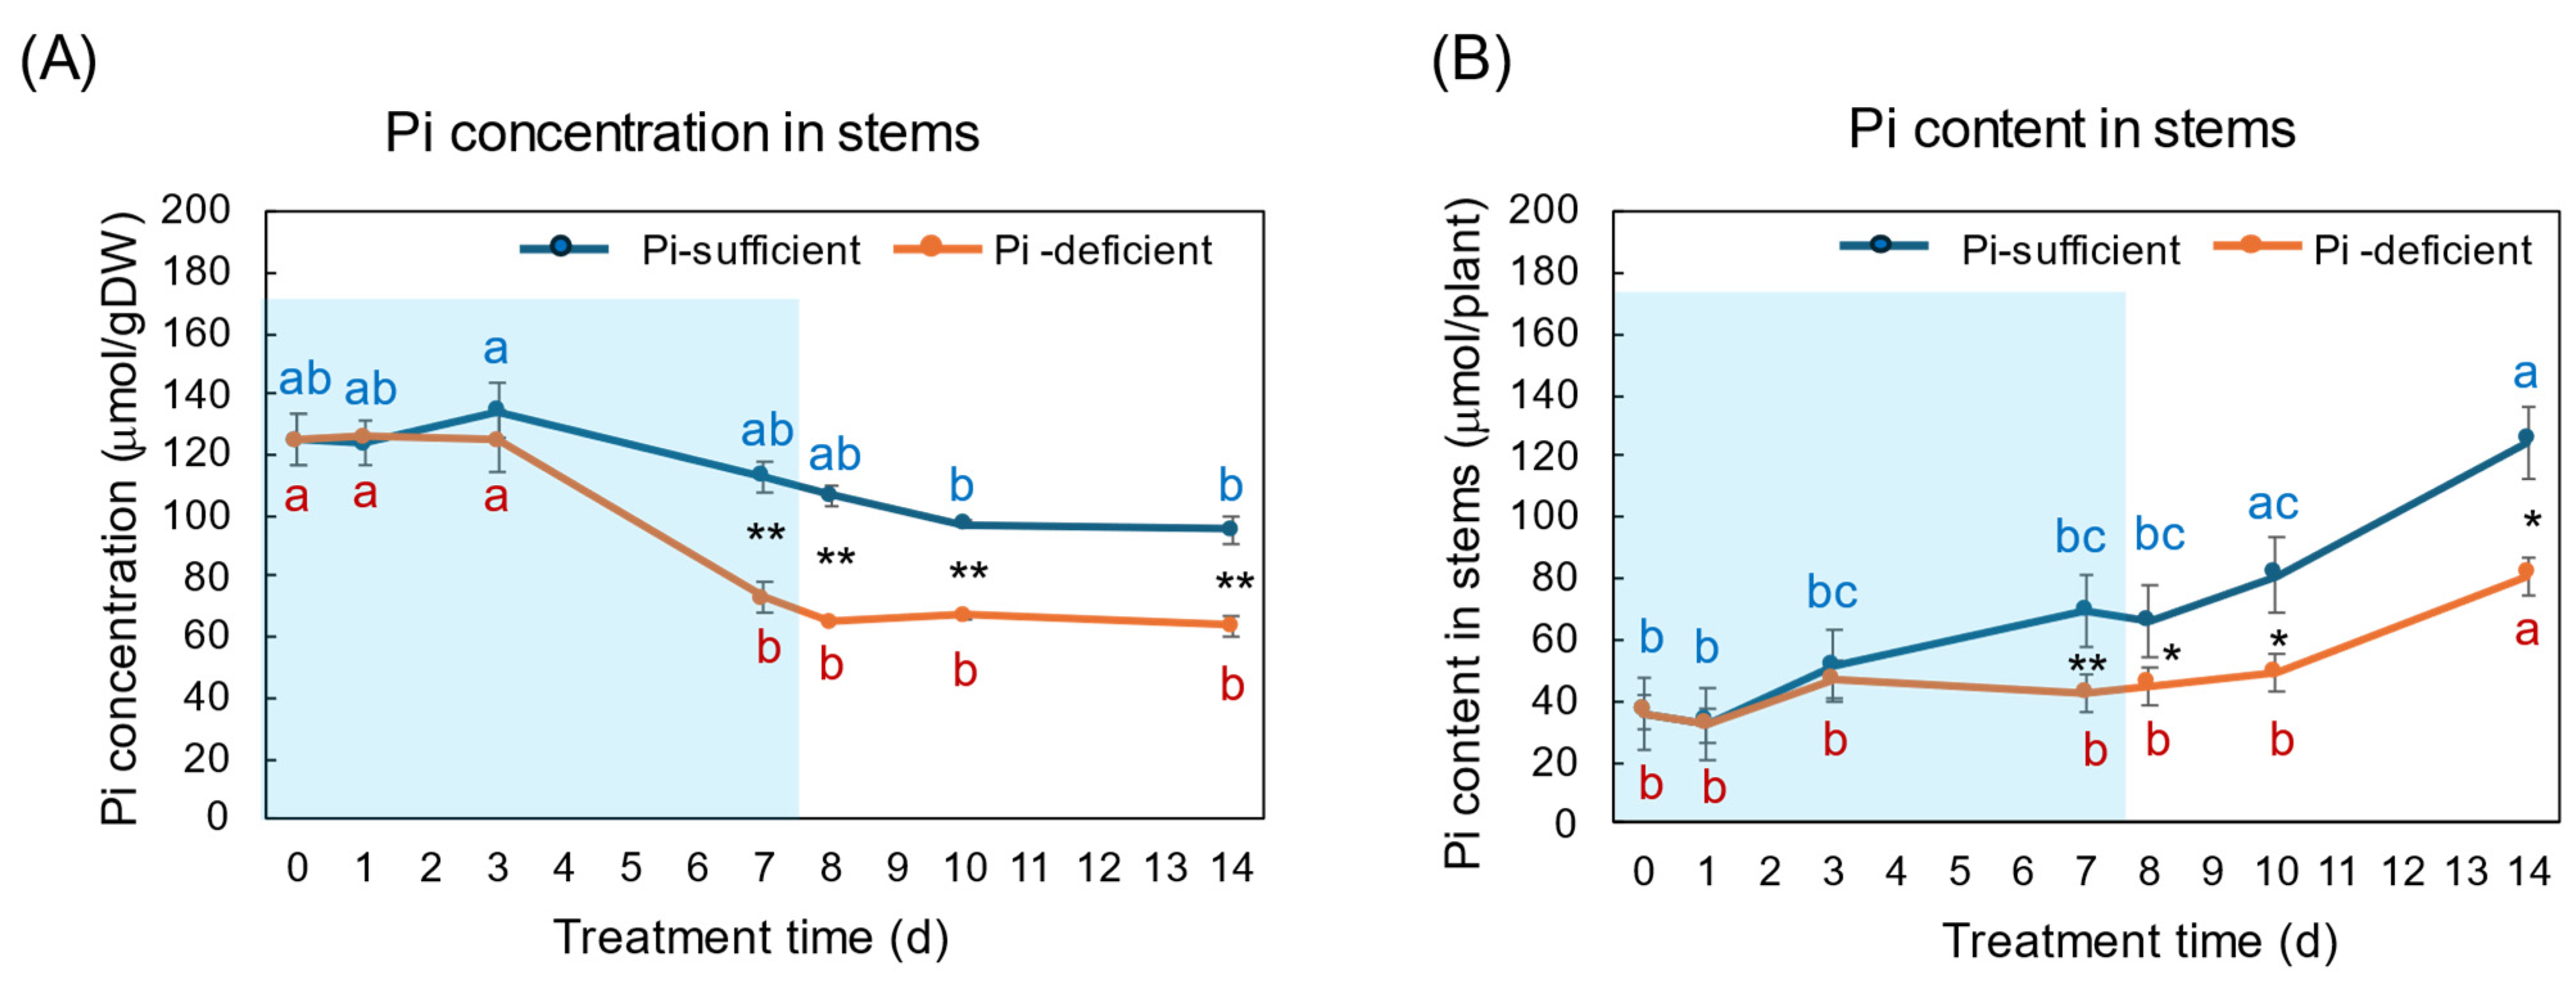
The effects of Pi-sufficient and Pi-deficient treatments on the Pi concentration and Pi content in the stems are shown in Figure 6A,B. The Pi concentrations in the stems with Pi-sufficient treatment decreased from day 3 (135 μmol/gDW) to day 14 (95 μmol/gDW) (Figure 6A), whereas the Pi content in the stems with a Pi-sufficient treatment increased from 36 μmol/plant on day 0 (23 DAP) to 69 μmol on day 7 (30 DAP), and further increased to 125 μmol on day 14 (Figure 6B). The Pi concentration in the stems with Pi-deficient treatment significantly decreased from 125 μmol/gDW at day 0 to day 7 (73 μmol/gDW) during a lack of P supply. The Pi concentrations in the stems were constant after the re-supply of Pi from day 7 to day 14. The Pi contents in the stems with a Pi-deficient period were constant from day 0 to day 7 (42 μmol/plant). After the re-supply of Pi, the Pi content in the stems significantly increased to 81 μmol/plant on day 14.
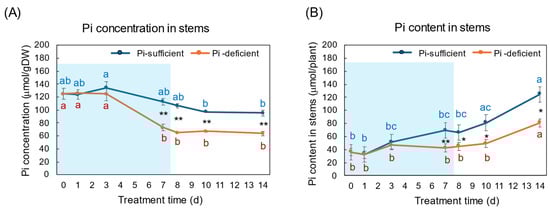
Figure 6.
Comparison of Pi-sufficient and Pi-deficient treatments on Pi concentration (A) and Pi content (B) in the stems and petioles. Average ± standard error. Different letters indicate the significant difference in the values among treatment times in Pi-sufficient (blue) and Pi-deficient (red) by Tukey’s Test. * and ** indicate the significant difference in the values at 0.01 < p < 0.05 and p < 0.01 between Pi-sufficient and Pi-deficient treatments by Student’s T-test. The blue background indicates the period of Pi-deficient treatment. n = 3.
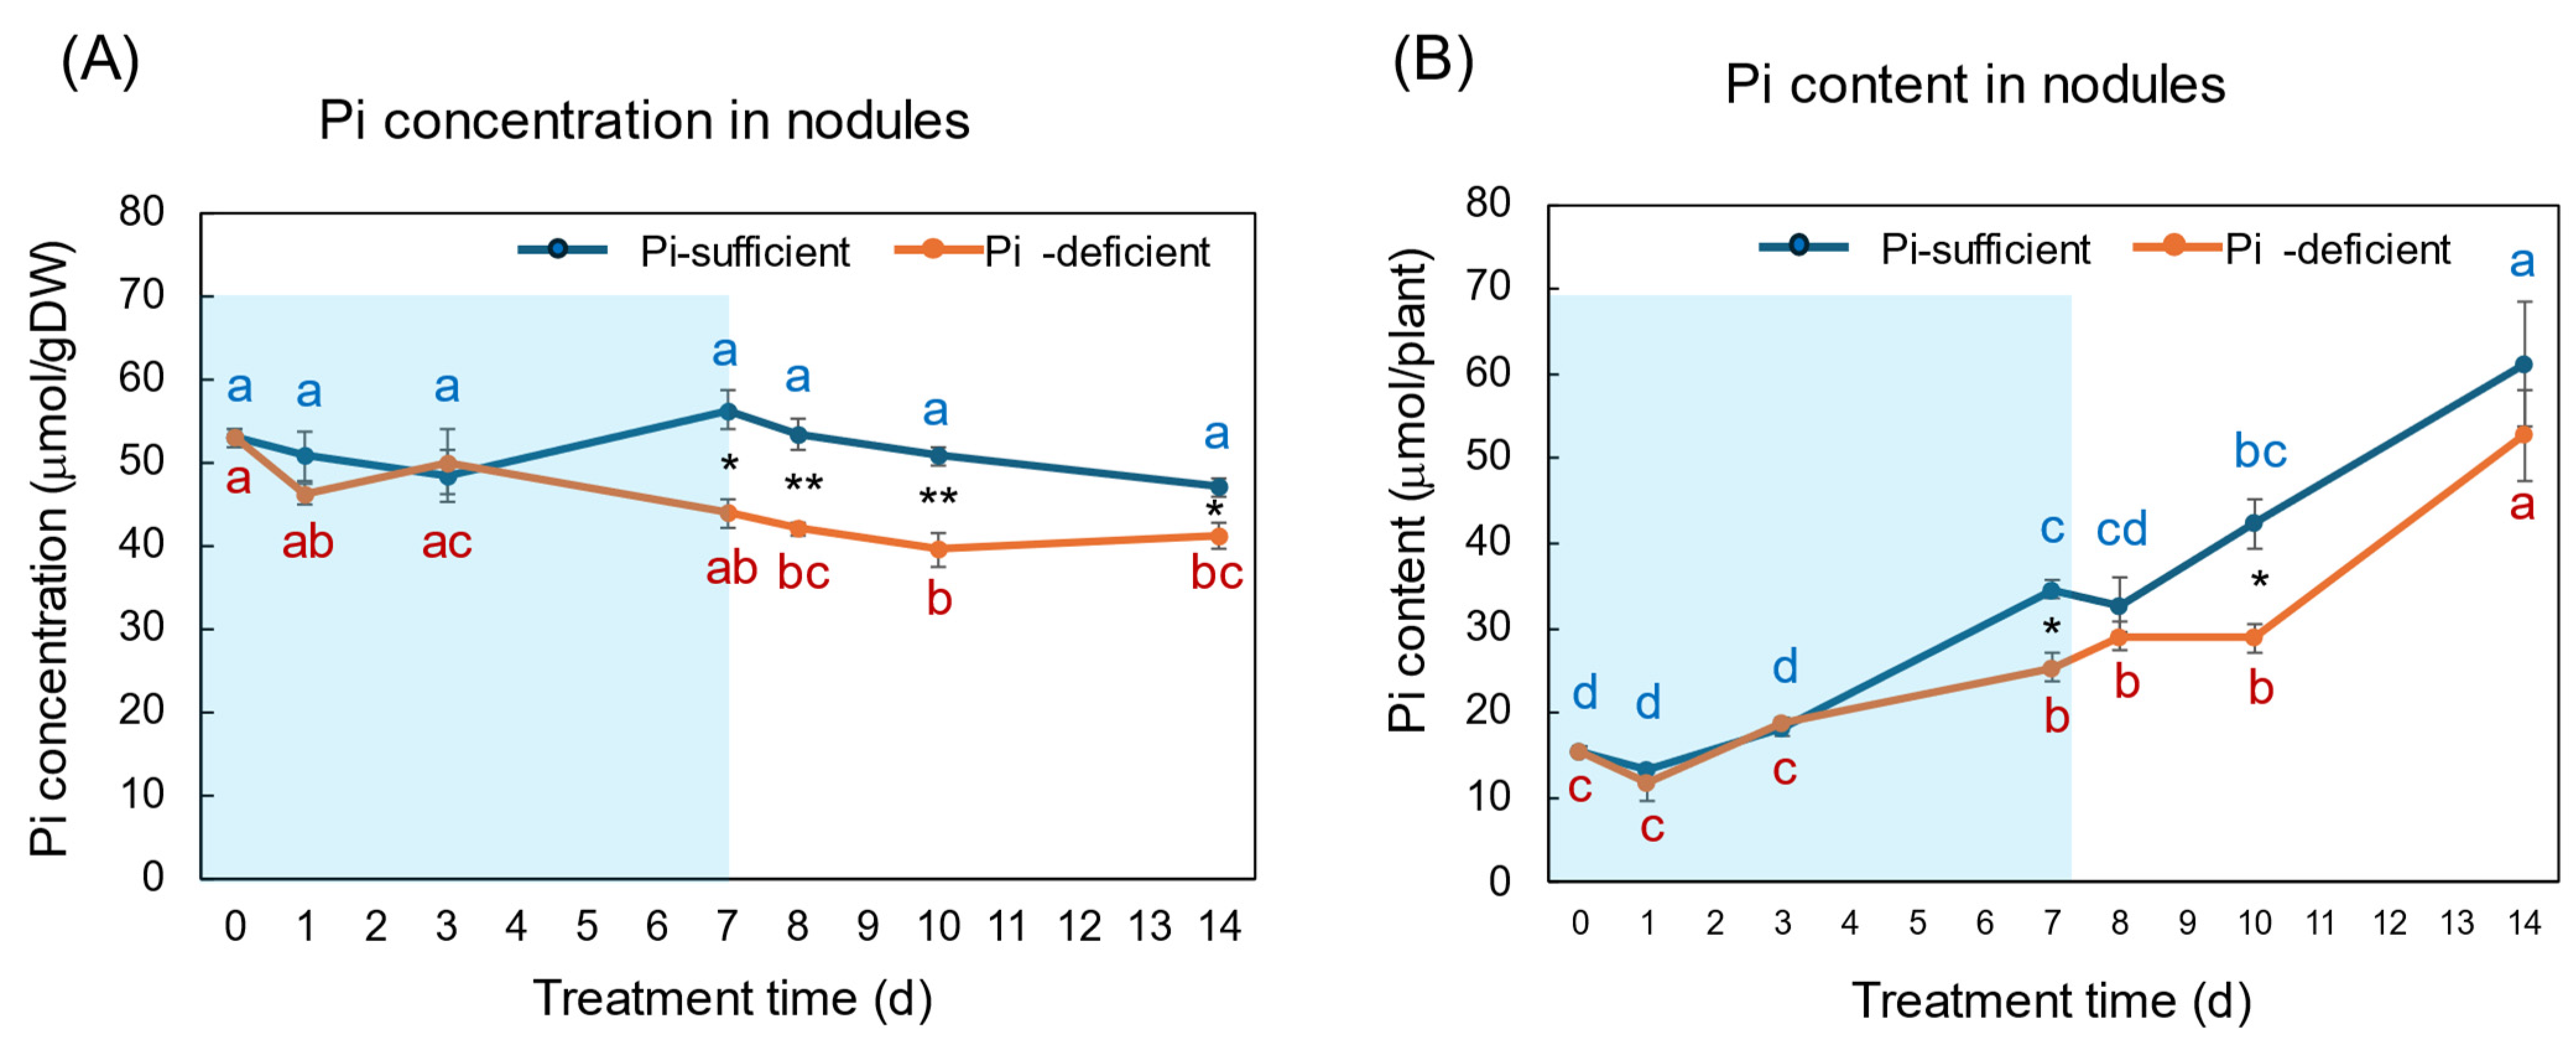
The Pi concentration and Pi content in the nodules with Pi-sufficient and Pi-deficient treatments are compared in Figure 7A,B. The Pi concentrations in the nodules with Pi-sufficient treatment were constant from day 0 to day 14, with about 50 μmol/gDW (A). The Pi concentrations in the nodules were lower than those in roots, leaves, and stems. The Pi content in the nodules with Pi-sufficient conditions increased from 15 μmol/plant on day 0 (23 DAP) to 34 μmol on day 7 (30 DAP), and increased to 61 μmol on day 14 (37 DAP). The Pi concentrations in the nodules with Pi-deficient treatment tended to decrease from 53 μmol/gDW at day 0 to day 7 (44 μmol/gDW) during a period without Pi supply. The Pi concentrations were constant after the re-supply of Pi from day 7 to day 14. The Pi contents in the nodules with a Pi-deficient period increased from day 0 (15 μmol/plant) to day 7 (25 μmol/plant). After the re-supply of Pi, the Pi content in the nodules further increased to 53 μmol/plant on day 14 at the same rate with Pi-sufficient plants.
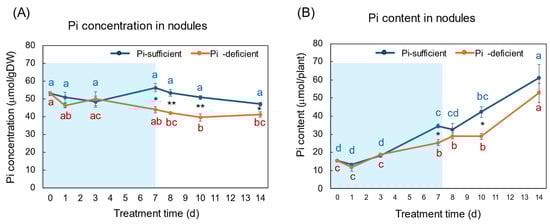
Figure 7.
Comparison of Pi-sufficient and Pi-deficient treatments on Pi concentration (A) and Pi content (B) in the nodules. Average ± standard error. Different letters indicate the significant difference in the values among treatment times in Pi-sufficient (blue) and Pi-deficient (red) by Tukey’s Test. * and ** indicate the significant difference in the values at 0.01 < p < 0.05 and p < 0.01 between Pi-sufficient and Pi-deficient treatments by Student’s T-test. The blue background indicates the period of Pi-deficient treatment. n = 3.
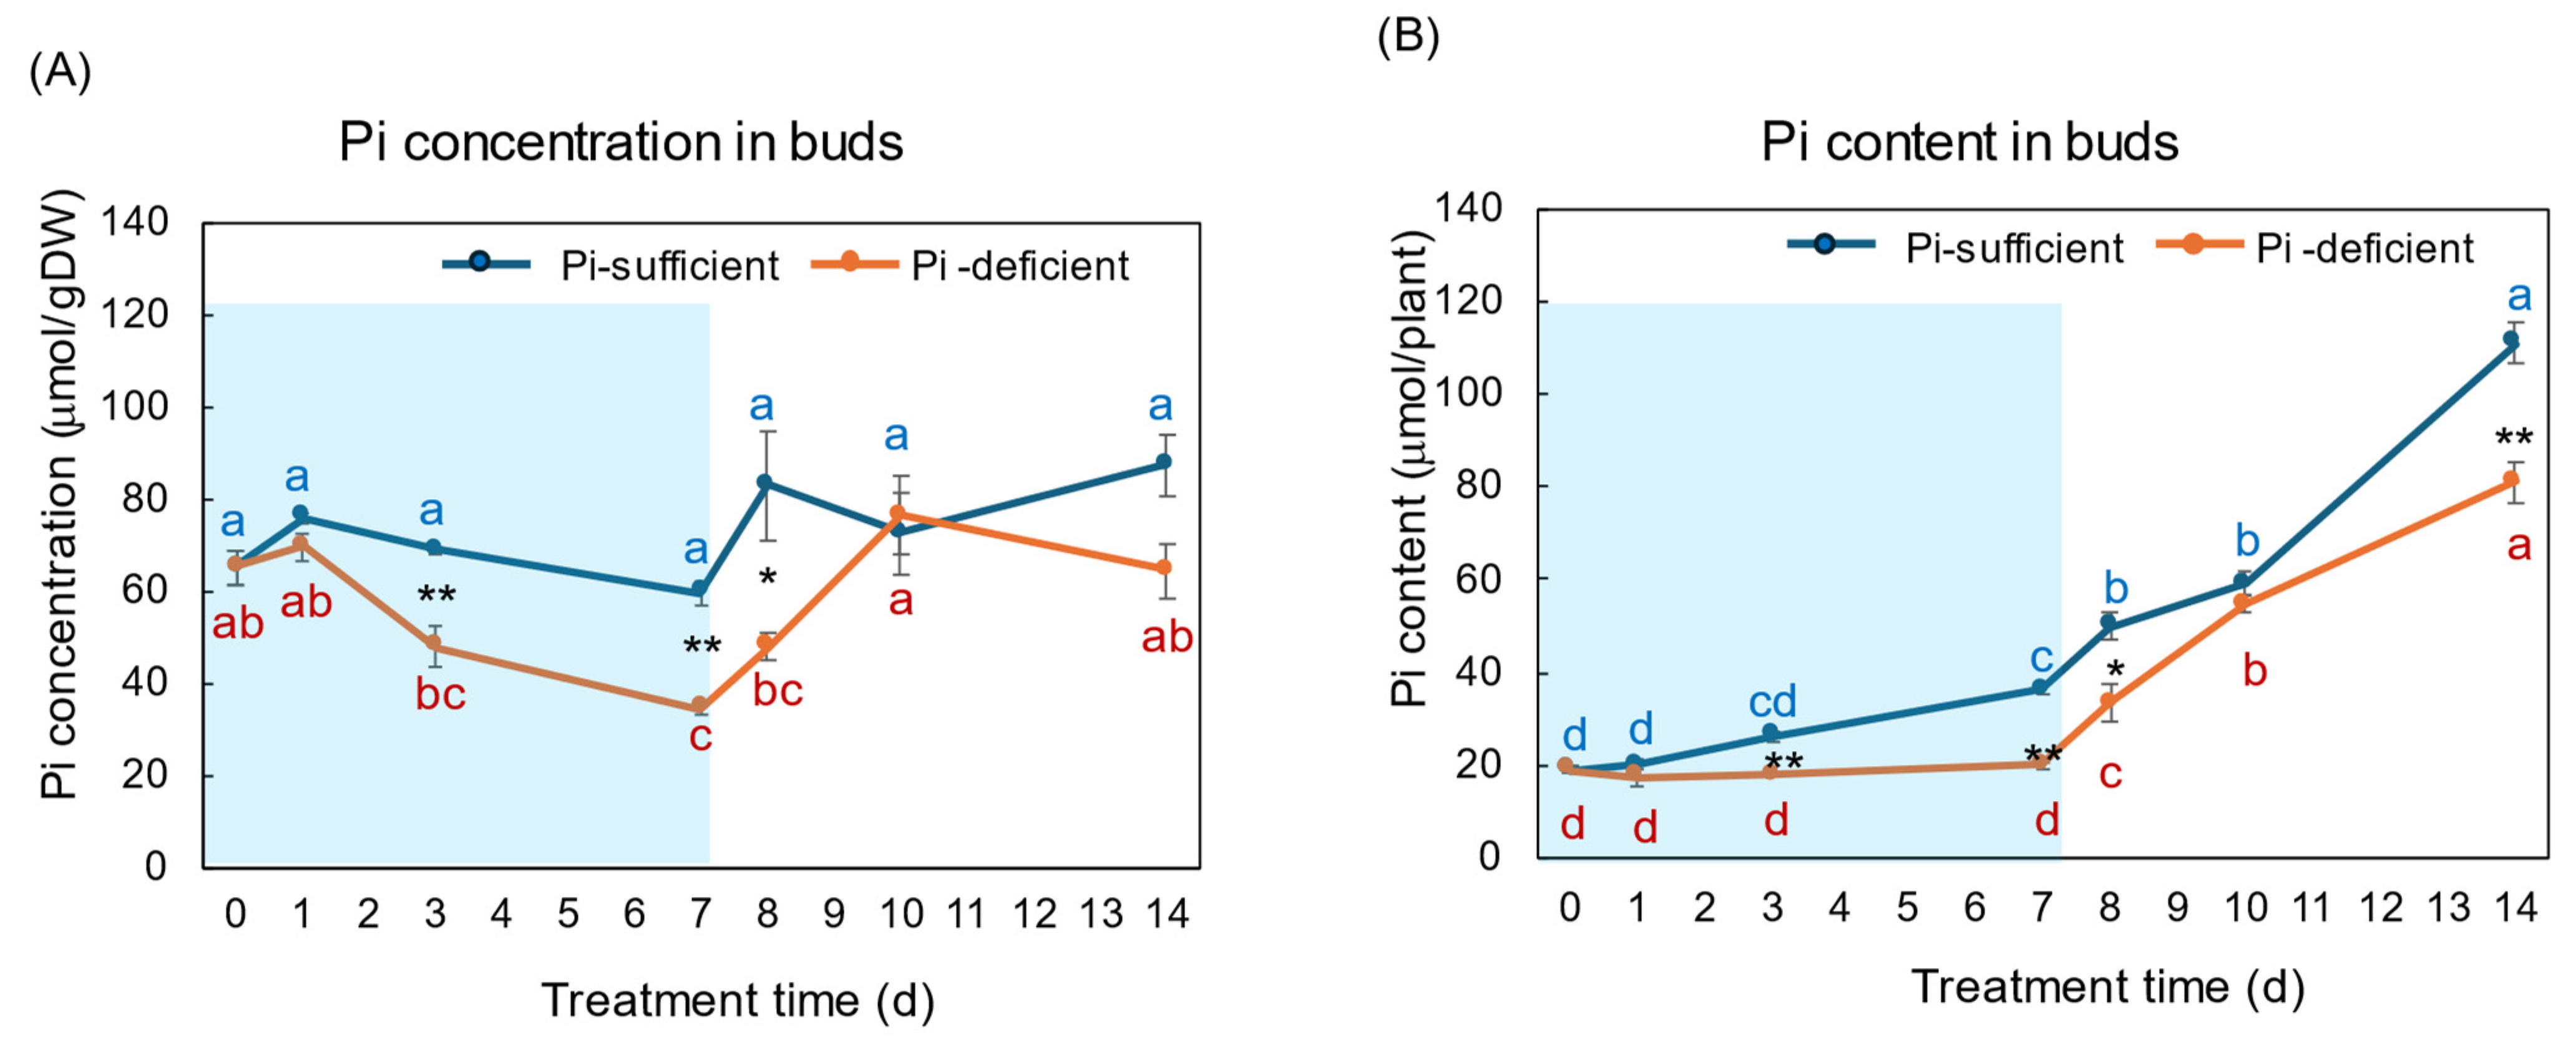
Figure 8A,B show the Pi concentration and Pi content in the buds and young developing leaves with Pi-sufficient and Pi-deficient treatments, respectively. The Pi concentrations in the buds with Pi-sufficient treatment were relatively constant from day 0 to day 14, with about 60–90 μmol/gDW (A). The Pi concentrations in the buds were lower than those in roots, leaves, and stems. The Pi content in the buds with Pi-sufficient treatment increased from 19 μmol/plant on day 0 (23 DAP) to 36 μmol on day 7 (30 DAP), and increased to 111 μmol on day 14 (37 DAP). The concentrations of Pi in the buds with a Pi-deficient treatment decreased from 65 μmol/gDW at day 0 to day 7 (34 μmol/gDW) during a lack of P supply. The Pi concentrations in buds rapidly increased after the re-supply of P from day 7 to day 10. The Pi contents in the buds with the Pi-deficient period were constant from day 0 to day 7 (20 μmol/plant). After the re-supply of Pi, the Pi content in the buds with Pi-deficient treatment increased to 81 μmol/plant on day 14, at the same rate of the plants with Pi-sufficient treatment.
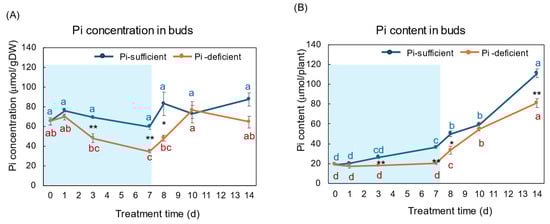
Figure 8.
Comparison of Pi-sufficient and Pi-deficient treatments on Pi concentration (A) and Pi content (B) in the buds and young developing leaves. Average ± standard error. Different letters indicate the significant difference in the values among treatment times in Pi-sufficient (blue) and Pi-deficient (red) by Tukey’s Test. * and ** indicate the significant difference in the values at 0.01 < p < 0.05 and p < 0.01 between Pi-sufficient and Pi-deficient treatments by Student’s T-test. The blue background indicates the period of P-deficient treatment. n = 3.
The Pi concentrations in the xylem sap in the Pi-sufficient plants tended to decrease from 3.10 mM Pi on day 0 to 2.17 mM Pi on day 14 (Figure 9A). The xylem sap Pi concentrations in the Pi-deficient plants decreased gradually from day 0 to day 7 (1.29 mM Pi), and the Pi concentrations on day 3 and day 7 were significantly lower than those in Pi-sufficient plants. After the culture solution changed to a Pi-sufficient solution on day 7, the Pi concentrations in the xylem sap of Pi-deficient plants promptly increased from 1.29 mM Pi on day 7 to 2.83 mM Pi on day 8. The Pi concentrations of the P-deficient treatment on day 8, day 10, and day 14 were not different from the Pi-sufficient treatment.
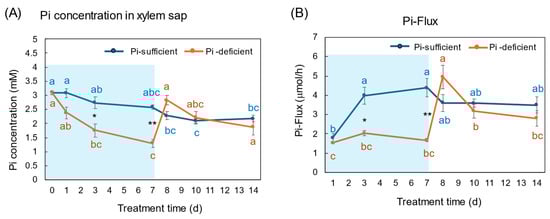
Figure 9.
Comparison of Pi-sufficient and Pi-deficient treatments on Pi concentration (A) in the xylem sap and Pi flux (B). Average ± standard error. Different letters indicate the significant difference in the values among treatment times in Pi-sufficient (blue) and Pi-deficient (red) by Tukey’s Test. * and ** indicate the significant difference in the values at 0.01 < p < 0.05 and p < 0.01 between Pi-sufficient and Pi-deficient treatments by Student’s T-test. The blue background indicates the period of Pi-deficient treatment. n = 3.
The Pi flux was calculated by multiplying the concentration of Pi and the transpiration rate [21]. The Pi flux in the Pi-sufficient plants increased from day 1 (1.80 μmol/h) to day 3 (3.98 μmol/h), and was constant thereafter. On the other hand, the Pi flux in the Pi-deficient plants was constant on day 1, day 3, and day 7 about 2 μmol/h. However, after changing the culture solution from a Pi-deficient solution to a Pi-sufficient solution on day 7, the Pi flux increased rapidly to 4.96 μmol/h on day 8.
4. Discussion
4.1. Changes in the Pi Concentration and Pi Content during Pi-Sufficient and Pi-Deficient Treatments
In this experiment, the total dry weight and the dry weight of each part were not different after 7 days of treatment in Pi-sufficient and Pi-deficient conditions (Figure 1). In addition, the xylem sap exudation rate (Figure 3A) and the transpiration rate (Figure 3B) were not different between Pi-sufficient and Pi-deficient treatments. The xylem exudation rate was used as the index of the root activity in rice [27]. The present data indicated that the 7-day interruption of P-supply did not affect plant growth and plant vigor. These results may be attributed to the fact that the Pi reserved at 23 DAP was enough to support soybean growth and development for one week. It was reported that when plants were subjected to P deprivation, the shoot growth was rapidly inhibited before plant P status was reduced [20,28,29]. Our results in this experiment were controversial compared to the previous results. The reason for this might be that plants in this experiment reserved surplus Pi in each part before starting the Pi-deficient treatment because the plants were grown in hydroponics, and the roots were stuffed with Pi from the culture solution.
Although the acceleration of Pi absorption after Pi deprivation has been reported, the Pi absorption rate from day 7 to day 14 after the Pi-deficient and Pi-sufficient treatments was the same (Figure 2). This may be attributed to the sufficient Pi storage at the beginning of Pi treatments on day 0, and the fact that the plants did not suffer from severe P deprivation. Chaudhary et al. [30] compared the effect of phosphorus deficiency on growth, nutrition uptake, nitrogen fixation, and photosynthetic rate in mash bean, mung bean, and soybean after 20 days of treatment under P-sufficient and P-deficient conditions. Irrespective of our results, the P-deprivation treatment reduced the biomass in soybean, mung bean, and mash bean. Their results suggest that the Pi storage was not enough to support the growth during 20 days of P-deficient treatment. Similar results were reported by Fredeen et al. [31].
4.2. Comparison of the Pi Concentration and Pi Content in Each Part during Pi-Sufficient and Pi-Deficient Treatments
On 23 DAP at the beginning of the P treatments, the Pi concentration of the plants grown with Pi-sufficient solution was the highest in the roots (404 μmol/gDW), followed by the leaves (143 μmol/gDW), the stems (125 μmol/gDW), buds (65 μmol/gDW), and the nodules (53 μmol/gDW). The roots are the primary site of Pi absorption from the soil solution, and they accumulate the surplus Pi in the roots, especially in the vacuoles of the cortex [1,2,3]. In Figure 4, the Pi concentrations in the roots were constant in Pi-sufficient treatment, but those decreased consistently in Pi-deficient conditions until day 7. This indicates that the Pi stored in the roots was transported to support the other organs and to support root growth. After 7 days of a lack of Pi, appreciable amounts of Pi remained in the roots, suggesting that the release of Pi from roots is relatively slow. The Pi concentration in the roots did not increase rapidly after the re-supply of Pi in the culture solution from day 7 to day 14. Under one week of Pi starvation, the plant may prioritize the transport of Pi to the other parts rather than storing the Pi in the roots, although the plant growth has not been affected.
The changes in Pi concentration in the leaves (Figure 5) were similar to those in the roots. During the initial 7 days of the Pi-deficient conditions, Pi concentrations in the leaves and roots decreased to about 1/3 of the initial concentrations at day 0. However, the Pi content in the leaves increased after the re-supply of Pi from day 7 to 14, although it was relatively constant in the roots. In this stage, the Pi transported from the roots was accumulated in the leaves, and the stored Pi in the leaves might support the P requirement of the sink organs, buds and nodules, possibly transported through the phloem.
During the Pi-deprived period, the Pi concentrations in the stems decreased the same as in the roots and leaves, but the decrease was slower than in the roots and leaves (Figure 6). The Pi concentrations in the stems after the re-supply of Pi did not increase, but the Pi content increased in the stems, the same as in the roots and leaves. The stems and petioles play an essential role in transporting nutrients among organs. Also, the stem parenchyma cells may accumulate and store Pi.
The Pi concentration changes in the nodules during the Pi-deprived period were only minor compared with the roots and leaves, although the difference between treatments on day 7 was statistically significant using Student’s T-test (Figure 7). The Pi in the nodules might derive from the leaves via phloem or be directly absorbed from the nodule surface, although the transport routes are not determined in this experiment.
Buds and young leaves are sink organs receiving nutrients, and photoassimilate from the mature leaves via the phloem. The change in the Pi concentrations in the buds decreased, like the roots and leaves during the initial 7 days of the Pi starvation period (Figure 8). However, they increased during the Pi re-supply period from day 7 to day 14. The recovery of Pi concentration may be due to the vigorous growth of the buds and young leaves in this stage.
4.3. Changes in the Pi Concentration in Xylem Sap and Estimation of Pi Flux
The Pi concentration in the xylem sap in the Pi-deficient treatment decreased consistently from day 0 to day 7 (Figure 9A) in the same way as the trends in the roots (Figure 4). At day 7, the Pi concentration in the xylem sap was almost half of that in the Pi-sufficient plants, suggesting that about half of Pi in the control plants derived from the storage P pool in the roots and the half derived from currently absorbed Pi. After re-supplying Pi to the culture solution, the Pi concentration in the xylem sap rapidly increased to the same level as the Pi-sufficient conditions, although the recovery of Pi concentration in the roots has not been observed. These results suggest that the Pi concentration in the xylem sap reflects the current status of Pi in the culture solution. Yamamura et al. [19] reported that the Pi concentration in xylem sap decreased rapidly after changing to Pi-deficient conditions. After 15 days of treatment under Pi-deficient conditions, the Pi concentration in xylem sap decreased from 3.7 mM to 0.3 mM, which accounted for 8%. These results suggested that young soybean plants absorb surplus Pi from the medium and they store Pi mainly in the roots and leaves, and the storage Pi could support soybean growth for one week. In the experiment shown in Figure 9, the prompt response of Pi concentration in the xylem sap was observed not only changing from 50 μM to 0 μM on day 1, but was also evident after changing from 0 μM to 50 μM conditions on day 8, indicating that the Pi concentration in xylem sap more sensitively responds to the external Pi concentration than that in the roots or leaves. In a previous report [19], after soybean plants were grown in 0–500 μM Pi solution for 3 days, the Pi absorption rate increased consistently in conjunction with the increase in the Pi concentration; however, the Pi concentrations in the xylem sap increased from 0 to 50 μM Pi but were constant thereafter. This result indicated that the absorption and transport of Pi were controlled under different mechanisms.
The radioisotope 33P was used to trace the absorption and transport of Pi in young soybean plants [21], and the experiment revealed that the absorption of Pi from roots was almost the same under light and dark conditions, but the transport rate from roots to the shoots was significantly higher under light than that under dark conditions. Under dark conditions, root pressure is the sole motive force for lifting water and nutrients from the roots to the shoot. On the other hand, under light conditions, root pressure and transpiration are the driving forces to transport water and nutrients.
The 33Pi flow rate estimated by the Pi concentration multiplied by the transpiration rate exhibited the same pattern as the Pi transport rate in the intact plant [21]. Therefore, we proposed this value for estimating the Pi flux of the soybean plants grown in the field; see Figure 1 in [21]. For analyzing a field-grown plant, the transpiration rate cannot be measured by weighing the culture solution as in this experiment, so we used the detached shoot to estimate the transpiration rate. This estimation depends on the hypothesis that the concentration of Pi did not alter in the xylem sap collected and in the intact plant, and that the transpiration rate by the cut shoot and xylem sap exudation rates from excised roots are similar to the intact plant. From our obtained results [21], it was proven correct, when the sampling of xylem sap and transpiration rate is completed within a short time, after 1 h after decapitation. The adaptation of this estimation for other crops needs further experiments.
5. Conclusions
After 7 days of Pi-deficient treatment for young soybean plants, the plant growth was not different from the Pi-sufficient plants, and an appreciable amount of Pi remained in all parts in the roots, leaves, stems, nodules, and buds. These results indicated that the soybean plants have reserved surplus Pi to support the plant growth for 7 days without Pi supply. The decreases in the Pi concentrations in roots and leaves were significant compared with the nodules, buds, and stems. The Pi concentration in the xylem sap quickly responded to the changes in the Pi concentration of the culture solution during the Pi starvation period and after the re-supplying of Pi. One day after re-supplying Pi to the P-deficient plants, the Pi concentration in the xylem sap recovered to the levels of the P-sufficient plants. This result supported the notion that the Pi concentration in xylem sap is a good indicator of the Pi concentrations in the medium. The Pi flux, indicating the transport rate of Pi from roots to the shoot, can be calculated by multiplying the Pi concentration in xylem sap and the transpiration rate plus the xylem sap exudation rate. The estimation may be a useful tool for Pi diagnosis in soybean cultivation.
Author Contributions
Conceptualization, Y.Y. and T.O.; methodology, Y.Y. and T.O.; software, Y.Y.; validation, Y.Y., K.H., A.S. and T.O.; formal analysis, Y.Y.; investigation, Y.Y.; resources, K.H. and A.S.; data curation, Y.Y.; writing—original draft preparation, Y.Y. and T.O.; writing—review and editing, K.H. and A.S.; visualization, Y.Y. All authors have read and agreed to the published version of the manuscript.
Funding
This research received no external funding.
Data Availability Statement
The data presented in this study are available on request from the corresponding author.
Conflicts of Interest
The authors declare no conflicts of interest.
References
- Marschner, H. Functions of mineral nutrients: Macronutrients. In Mineral Nutrition of Higher Plants, 2nd ed.; Academic Press: London, UK, 1986; pp. 229–312. [Google Scholar]
- Lambers, H. Phosphorus acquisition and utilization in plants. Annu. Rev. Plant Biol. 2022, 73, 17–42. [Google Scholar] [CrossRef]
- Lambers, H.; Plaxton, W.C. Phosphorus: Back to the roots. Annu. Plant Rev. 2015, 48, 3–22. [Google Scholar] [CrossRef]
- Sinclair, J.B. Soybeans. In Nutrient Deficiencies & Toxicities in Crop Plants; Bennett, W.F., Ed.; APS Press: St. Paul, MN, USA, 1993; pp. 99–103. [Google Scholar]
- Poirier, Y.; Bucher, M. Phosphate transport and homeostasis in Arabidopsis. Arab. Book 2002, 2002, e0024. [Google Scholar] [CrossRef] [PubMed]
- López-Arredondo, D.L.; Leyva-González, M.A.; González-Morales, S.I.; López-Bucio, J.; Herrera-Estrella, L. Phosphate nutrition: Improving low-phosphate tolerance in crops. Annu. Rev. Plant Biol. 2014, 65, 95–123. [Google Scholar] [CrossRef]
- Khan, F.; Siddique, A.B.; Shabala, S.; Zhou, M.; Zhao, C. Phosphorus plays key roles in regulating plants’ physiological responses to abiotic stresses. Plants 2023, 12, 2861. [Google Scholar] [CrossRef]
- Cassman, K.G.; Whitney, A.S.; Stockinger, K.R. Root growth and dry matter distribution of soybean as affected by phosphorus stress, nodulation, and nitrogen source. Crop Sci. 1980, 20, 239–244. [Google Scholar] [CrossRef]
- Israel, D.W. Investigation of the role of phosphorus in symbiotic dinitrogen fixation. Plant Physiol. 1987, 84, 835–840. [Google Scholar] [CrossRef]
- Ohyama, T.; Takayama, K.; Akagi, A.; Saito, A.; Higuchi, K.; Sato, T. Development of an N-free culture solution for cultivation of nodulated soybean with less pH fluctuation by the addition of potassium bicarbonate. Agriculture 2023, 13, 739. [Google Scholar] [CrossRef]
- Puga, M.I.; Rojas-Triana, M.; de Lorenzo, L.; Leyva, A.; Ruvio, V.; Paz-Ares, J. Novel signals in the regulation of Pi starvation responses in plants: Facts and promises. Curr. Opin. Plant Biol. 2017, 39, 40–49. [Google Scholar] [CrossRef]
- Chien, P.-S.; Chiang, C.-P.; Leong, S.J.; Chiou, T.-J. Sensing and signaling of phosphate starvation: From local to long distance. Plant Cell Physiol. 2018, 59, 1714–1722. [Google Scholar] [CrossRef]
- Goldstein, A.; Danon, A.; Baertlein, D.; McDaniel, R. Phosphate starvation inducible metabolism in Lycopersicon esculentum II. characterization of the phosphate starvation inducible excreted acid phosphatase. Plant Physiol. 1988, 87, 716–720. [Google Scholar] [CrossRef] [PubMed]
- Lambers, H.; Shane, M.W.; Cramer, M.D.; Pearse, S.J.; Veneklaas, E.J. Root structure and functioning for efficient acquisition of phosphorus: Matching morphological and physiological traits. Ann. Bot. 2006, 98, 693–713. [Google Scholar] [CrossRef]
- Bates, T.R.; Lynch, J.P. Stimulation of root hair elongation in Arabidopsis thaliana by low phosphorus availability. Plant Cell Environ. 1996, 19, 529–538. [Google Scholar] [CrossRef]
- Mo, X.; Liu, G.; Zhang, Z.; Liang, C.; Tian, J. Mechanisms underlying soybean response to phosphorus deficiency through integration of omics analysis. Int. J. Mol. Sci. 2022, 23, 4592. [Google Scholar] [CrossRef] [PubMed]
- Yang, S.-Y.; Huang, T.-K.; Kuo, H.-F.; Chiou, T.-J. Role of vacuoles in phosphorus storage and remobilization. J. Exper. Bot. 2017, 68, 3045–3055. [Google Scholar] [CrossRef]
- Bieleski, R.L. Effect of phosphorus deficiency on levels of phosphorus compounds in Spirodela. Plant Physiol. 1968, 43, 1309–1316. [Google Scholar] [CrossRef]
- Yamamura, Y.; Higuchi, K.; Saito, A.; Ohyama, T. Absorption and transport of phosphorus in nodulated soybean plants and diagnosis of phosphorus status using xylem sap analysis. Agriculture 2024, 14, 403. [Google Scholar] [CrossRef]
- Lauer, M.J.; Blevins, D.G.; Sierzputowska-Gracz, H. 31P-Nuclear Magnetic Resonance determination of phosphate compartmentation in leaves of reproductive soybeans (Glycine max L.) as affected by phosphate nutrition. Plant Physiol. 1989, 89, 1331–1336. [Google Scholar] [CrossRef]
- Veneklaas, E.J.; Lambers, H.; Bragg, J.; Finnegan, P.M.; Lovelock, C.E.; Plaxton, W.C.; Price, C.A.; Scheible, W.-R.; Michael, W.; Shane, M.W.; et al. Opportunities for improving phosphorus-use efficiency in crop plants. New Phytol. 2012, 195, 306–320. [Google Scholar] [CrossRef] [PubMed]
- Yamamura, Y.; Nara, S.; Higuchi, K.; Saito, A.; Ohyama, T. Absorption and Xylem Transport of 33P-Labeled Phosphorus in Nodulated Soybean Plants. Agriculture 2024, 14, 1104. [Google Scholar] [CrossRef]
- Fujikake, H.; Yamazaki, A.; Ohtake, N.; Sueyoshi, K.; Matsuhashi, S.; Ito, T.; Mizuniwa, C.; Kume, T.; Hashimoto, S.; Ishioka, N.-S.; et al. Quick and reversible inhibition of soybean root nodule growth by nitrate involves a decrease in sucrose supply to nodules. J. Exper. Bot. 2003, 54, 1379–1388. [Google Scholar] [CrossRef] [PubMed]
- Ohyama, T.; Minagawa, R.; Ishikawa, S.; Yamamoto, M.; Hung, N.V.P.; Ohtake, N.; Sueyoshi, K.; Sato, T.; Nagumo, Y.; Takahashi, Y. Soybean seed production and nitrogen nutrition. In A Comprehensive Survey of International Soybean Research-Genetics, Physiology, Agronomy and Nitrogen Relationships; Board, J.E., Ed.; IntechOpen: Rijeka, Croatia, 2013. [Google Scholar]
- Sakazume, T.; Tanaka, K.; Aida, H.; Ishikawa, S.; Nagumo, Y.; Takahashi, Y.; Ohtake, N.; Sueyoshi, K.; Ohyama, T. Estimation of nitrogen fixation rate of soybean (Glycine max L.) Merr.) by micro-scale relative ureide analysis using root bleeding xylem sap and apoplast fuid in stem. Bull. Facul. Agric. Niigata Univ. 2014, 67, 27–41. [Google Scholar]
- MEdical and PHarmaceutical Statistics (MEPHAS). Available online: www.gen-info.osaka-u.ac.jp/MEPHAS/mokuji1-e.html (accessed on 24 May 2002).
- Morita, S.; Abe, J. Diurnal and phenological changes of bleeding rate in lowland rice plants. Jpn. J. Crop Sci. 2002, 71, 383–388. [Google Scholar] [CrossRef]
- Li, H.; Wang, X.; Liang, Q.; Lyu, X.; Li, S.; Gong, Z.; Dong, S.; Yan, C.; Ma, C. Regulation of phosphorus supply on nodulation and nitrogen fixation in soybean plants with dual-root systems. Agronomy 2021, 11, 2354. [Google Scholar] [CrossRef]
- Qin, L.; Guo, Y.; Chen, L.; Liang, R.; Gu, M.; Xu, G.; Zhao, J.; Walk, T.; Liao, H. Functional characterization of 14 Pht1 family genes in yeast and their expressions in response to nutrient starvation in soybean. PLoS ONE 2012, 7, e47726. [Google Scholar] [CrossRef] [PubMed]
- Chaudhary, M.I.; Adu-Gyamfi, J.J.; Saneoka, H.; Nguyen, N.T.; Suwa, R.; Kanai, S.; El-Shemy, H.A.; Lightfoot, D.A.; Fujita, K. The effect of phosphorus deficiency on nutrient uptake, nitrogen fixation and photosynthetic rate in mashbean, mungbean, and soybean. Acta Physiol. Plant 2008, 30, 537–544. [Google Scholar] [CrossRef]
- Fredeen, A.L.; Rao, I.M.; Terry, N. Influence of phosphorus nutrition on growth and carbon partitioning in Glycine max. Plant Physiol. 1989, 89, 225–230. [Google Scholar] [CrossRef] [PubMed]

Disclaimer/Publisher’s Note: The statements, opinions and data contained in all publications are solely those of the individual author(s) and contributor(s) and not of MDPI and/or the editor(s). MDPI and/or the editor(s) disclaim responsibility for any injury to people or property resulting from any ideas, methods, instructions or products referred to in the content. |
© 2024 by the authors. Licensee MDPI, Basel, Switzerland. This article is an open access article distributed under the terms and conditions of the Creative Commons Attribution (CC BY) license (https://creativecommons.org/licenses/by/4.0/).