Article

Cambisol Mycobiome in a Long-Term Field Experiment with Korean Pine as a Sole Edificator: A Case Study

1
Institute of Soil Science and Agrochemistry, Siberian Branch of the Russian Academy of Sciences, Lavrentieva 8/2, Novosibirsk 630090, Russia
2
Sukachev Forest Institute of the Krasnoyarsk Scientific Centre, Siberian Branch of the Russian Academy of Sciences, Akademgorodok 52/28, Krasnoyarsk 660036, Russia
3
Institute of Chemical Biology and Fundamental Medicine, Siberian Branch of the Russian Academy of Sciences, Lavrentieva 8, Novosibirsk 630090, Russia
*
Author to whom correspondence should be addressed.
Appl. Microbiol. 2022, 2(3), 470-480; https://doi.org/10.3390/applmicrobiol2030036
Submission received: 30 June 2022 / Revised: 10 July 2022 / Accepted: 11 July 2022 / Published: 13 July 2022
(This article belongs to the Special Issue Microbiome in Ecosystem)

Abstract

:
A culture-independent mycobiome survey in Haplic Cambisol under Korean pine in a long-term field experiment in the Russian Far East was conducted using sequence analysis of the ITS region amplified with ITS3/ITS4 primers using the metagenomic DNA as a matrix. Overall 758 fungal OTUs were identified, representing 15 phyla, 47 classes, 104 orders, 183 families, and 258 genera. More OTUs represented the Ascomycota phylum (513) than Basidiomycota (113), with both phyla together comprising 95% of the relative abundance. The Leotiomycetes class was ultimately prevailing; apparently contributing significantly to the organic matter decomposition and microbial biomass in soil, as shown by a PCA. Only two dominant OTUs (Pseudogymnoascus sp. and Hyaloscyphaceae, both Ascomycota) were common in the studied samples. The presented high mycobiome diversity in soil under the monospecies artificial forest, where Korean pine had been the sole edificator for forty years, allows concluding that plant chemistry diversity is the main factor shaping the soil mycobiome in such an environment. The obtained data provide a reference for further studies of soil mycobiota, especially under Korean pine with its aesthetic, as well as nut-producing, potential. The results can be helpful in the targeted creating of a soil mycobiome beneficial for pines in afforestation and remediation contexts.

1. Introduction

A soil microbiome census, conducted using state-of-the-art metagenomic techniques, is an indispensable initial stage for further well-integrated and more focused ecological research [1]. However, little is known about the soil mycobiome in forest ecosystems in Russia. Forests dominated by Korean pine (Pinus koraiensis Siebold et Zucc.), a magnificent ornamental tree, producing high quality nuts and timber [2], form large ecosystems in forest biomes, occupying vast areas in north-eastern China, the Russian Far East, Japan, and Korea [3,4,5]. Owing to overexploitation, the species’ natural stands are fragile and diminishing, and its plantations are being extended: for instance, Korean pine is the most important plantation tree species in northeast China [3]. Breeding, selection, and seedling production, as well as pine tree growth and development, have been receiving marked research attention [2,4,6,7,8] due to its high productivity and aesthetics, with the main aim of introducing it into other areas, different from their natural habitats.
Soil microbial diversity in forest ecosystems is primarily determined by the dominant forest-forming tree species [9,10]. In the 1970–1980s a nationwide network of field experiments with the major forest-forming conifers was set up throughout Russia, with the main purpose of studying the adaptation of trees to a somewhat changed or totally new environment. Currently, mature monospecies artificial pine stands provide a unique opportunity to study soil microbiome developed under the influence of sole species plant material input into soil, both via surface and root litter, as well as root exudates.
Diverse and complex soil fungal communities are extremely important for sustaining forests, as they decompose plant material, cycle nutrients, etc. Reciprocally, trees stabilize the composition of root-associated microbial communities, and not only exert selective effects on those communities, but also mitigate changes in the environment that can directly influence community composition.
The aim of this study was to reveal (a) the predominant members of fungal mycobiome in Haplic Cambisol under Korean pine as a sole edificator in a long-term field experiment in the Khabarovsk region, Russia, using ITS region DNA diversity, (b) the relationship between fungal diversity and soil basic chemical and microbiological properties.

2. Materials and Methods

2.1. The Study Site

The field experiment with Korean pine Pinus koraiensis was set up in the Khekhtsirsk Forestry (48°16′ N, 135°02′ E, 224 m a.s.l.) in the Khabarovsk region, Russia, in 1974. Prior to the start of the experiment, the soil was cleared of trees and ploughed, and hence nominally can be classified as anthropogenically transformed Burozem eluviated, according to the Russian classification, or Haplic Cambisol, according to the WRB classification [11]. Pine seedlings were planted out at 10,000 plants per hectare with 0.7 m between trees in a row and 1.5 m between rows in plots 30 m wide and 180 m long. After 40 years of growth and development, the trees were 9.8 ± 1.6 m high, with the yearly growth rate of 22 ± 2 cm and trunk and crown diameters averaging 13.7 ± 2.7 cm and 3.2 ± 0.8 m, respectively.

2.2. Soil Sampling and Properties

Soil was collected from two replicated experimental plots from the 0–20 cm layer (immediately below the litter layer and with maximal root density) at 60 cm from the tree row within the crone zone. Two composite samples, mixed from six individual soil cores taken randomly along the central part across a plot, were collected from each plot, and the four collected samples were brought to the laboratory. Visible roots and large particles were removed carefully by hand, and the samples were sieved through a 2-mm mesh sieve, thoroughly mixed, and divided into two subsamples for chemical analyses and DNA extraction.

2.3. Chemical Analyses

Soil carbon content was estimated by the loss of soil aliquot mass during stepwise ignition: the loss on ignition during 12 h at 500 °C was used to estimate soil organic carbon content (SOC) by multiplying the loss by 0.58. Soil organic nitrogen content (SON) was determined by the Kjeldahl method. The content of soil labile nutrients (NO3, NH4+, and P2O5) and pH (H2O) were measured using standard techniques [12]. Soil microbial biomass carbon (SMBC) and nitrogen (SMBN) contents were estimated by fumigation–extraction methods [13,14]. Basal respiration (CO2) was estimated by measuring the CO2 evolved by soil, without any amendments [15]; its ratio to SMBC gave the metabolic quotient (Qm, [16]). Glucose-induced CO2 evolution was measured from soil amended with glucose or histidine at the rate of 800 μgC∙g−1 soil. The ratio of glucose or histidine-induced respiration to the basal one are referred to as QRg and QRh, respectively. All analyses were performed in triplicates. All soil variables (Table 1) were calculated on a soil dry mass basis.

2.4. Extraction of Total Nucleic Acid from Soil

Total DNA was extracted using a DNA isolation Kit (DNA Spin Kit for Soil™, MO Bio laboratories, Inc., Carlsbad, CA, USA) as per the manufacturer’s instructions. Bead-beating was performed using a mini bead-beater (Stanford, CA, USA), for 45 s at 5000 rpm. No further purification of the DNA was needed. The quality of the DNA was assessed using agarose gel electrophoresis.

2.5. ITS Fragment and 16S rRNA Gene Amplification and Sequencing

The 16S rRNA gene and ITS2 regions were amplified with the primer pairs V3/V4 ITS3_KYO2/ITS4, respectively, combined with Illumina adapter sequences [17].
PCR amplification was performed as described earlier [18]. A total of 200 ng PCR product from each sample was pooled together and purified using a MinElute Gel Extraction Kit (Qiagen, Hilden, Germany). The obtained amplicon libraries were sequenced with 2 × 300 bp paired-ends reagents on MiSeq (Illumina, San Diego, CA, USA) in SB RAS Genomics Core Facility (ICBFM SB RAS, Novosibirsk, Russia). The read data reported in this study were submitted to the GenBank under the SRA accession number SRP152492 (https://www.ncbi.nlm.nih.gov/sra/?term=SRP152492; accessed on 12 July 2022).

2.6. Bioinformatic and Statistical Analyses

Raw sequences were analyzed with UPARSE pipeline [19] using Usearch v.11.0.667. The UPARSE pipeline included merging of paired reads; read quality filtering (-fastq_maxee_rate 0.005); length trimming (remove less 350 nt); merging of identical reads (dereplication); discarding singleton reads; and removing chimeras and OTU clustering using the UPARSE-OTU algorithm. The OTU sequences were assigned a taxonomy using the SINTAX [20], and as references for fungi ITS UNITE v.8.2 [21] and ITS RDP Warcup, training set v.2 [22]. Statistical analyses (descriptive statistics, principal component analysis) were performed using Statistica v.13.3, and α-biodiversity indices were calculated using PAST software v.3.17 [23].

3. Results

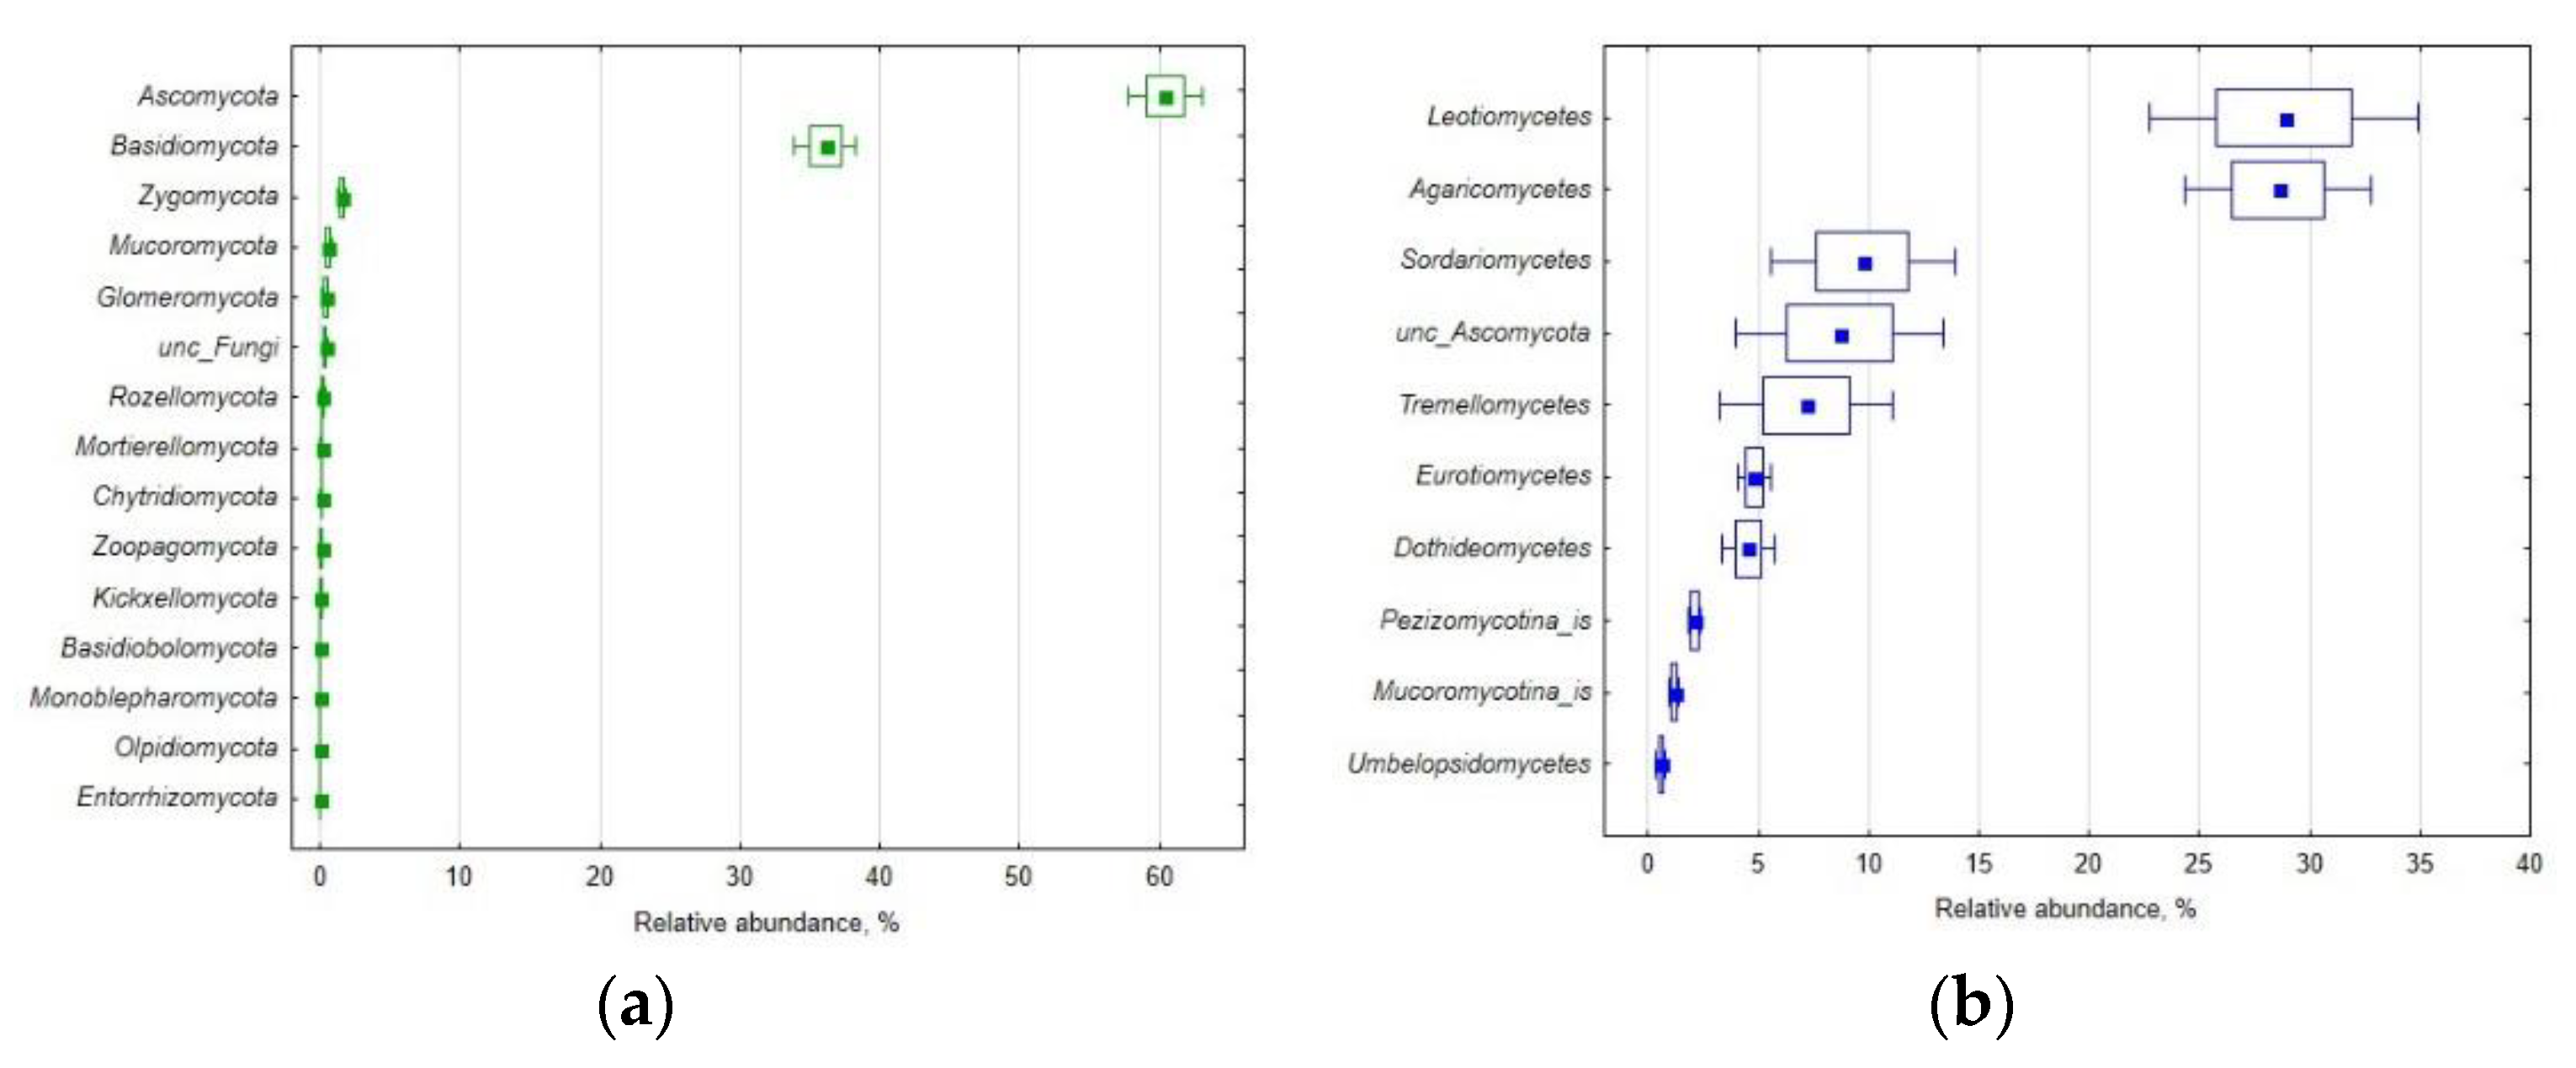
3.1. Mycobiome Diversity

After quality filtering, and chimera and non-fungal sequences removal, a total of 756 different operational taxonomic units (OTUs) were identified as fungal at a 97% sequence identity level, of which 610 were identified at least to a phylum level, whereas just 34 OTUs, or 4.5% of the total OTU number in the study, could not be assigned taxonomy below phylum level. Overall, the ITS sequence reads were clustered into 14 explicitly classified phyla, 47 classes, 104 orders, 183 families, and 258 genera. Of all OTUs, 193 were classified to the species level. The individual rarefaction showed (Figure S1) that the sampling effort was close to saturation for all samples.
Overall, there were 21 genus level dominant clusters, i.e., clusters contributing ≥1% of the total number of sequence reads obtained for a sample (Table 2), altogether totaling ca. 70% of the relative abundance.
The dominant OTUs amounted to 47 for all four soil samples and ranged from 15 to 18 OTUs in a sample. The relative abundance of the dominant OTUs after averaging all samples is shown in Table 3. The overwhelming majority (ca.95%) of the identified OTUs were minor or rare species.
The main dominant phyla, i.e., Ascomycota and Basidiomycota (Figure 1a), accounted for 31 and 16 of the dominant OTUs, despite their more pronounced disparity in the total number of OTUs (513 and 113 OTUs, respectively). Several of the dominant OTUs were classified to a species level, namely Suillus americanus, Saitozyma podzolica, Cortinarius casimiri, Hebeloma bruchetii, Inocybe_lilacina, Tomentella atramentaria, Laccaria_pumila of Basidiomycota, and Lecanicillium primulinum, Phialocephala fortinii, Leptodontidium orchidicola, Trichoglossum hirsutum, Chalara hyalocuspica, Oidiodendron scytaloides, Herpotrichia juniperi of Ascomycota, and only two OTUs, namely Pseudogymnoascus sp. and a representative of Hyaloscyphaceae, both belonging to Ascomycota, were common to all four samples.
Among the identified classes Agaricomycetes, Tremellomycetes (both Basidiomycota phylum), as well as Sordariomycetes, Eurotiomycetes, and Leotiomycetes (Ascomycota phylum) predominated in the studied soil (Figure 1b).
Alpha-biodiversity indices, calculated on the basis of the number of reads in each examined sample, showed that the mycobiome was quite diverse (Table 4). Judging by the Chao-1 index, the number of expected OTUs was only slightly (about 5% on average) in exceedance of the number of the observed OTUs, indicating a low occurrence of singletons and doubletons [24].

3.2. Mycobiome Diversity and Soil Properties

The relationship between mycobiome diversity and basic soil properties, as revealed by PCA, is shown in Figure 2. The positive pole of PC 1 was defined by two dominant classes (one from Ascomycota and another one from Basidiomycota), whereas the negative pole was also associated with two classes (Figure 2a) from the dominant phyla. Two Ascomycota classes, namely Leotiomycetes, ultimately dominant in the study, and Eurotiomycetes, a minor dominant, were markedly separated along PC2, determining its poles.
The relationship of fungal classes relative abundance with α-biodiversity indices, calculated using the number of the OTU reads, revealed an association of the prevailing Leotiomycetes with the dominance indices, whereas richness indices were located closely to the second-ranked in abundance Agaricomycetes (Figure 2b).

4. Discussion

Mycobiome patterns in different forest soils revealed a high diversity some time ago [25], and since then, they have often been studied; in many cases there are more than one forest-forming tree species, and often there is a diverse and productive understory and surface vegetation. The long-term field experiment from which we collected soil samples represents an unique case, providing an opportunity to profile soil microbiome diversity under a mono-species (Korean pine) stand grown in its native environment without any surface and understory vegetation Thus, the phytomass input into soil, both above- and belowground, has been from the pine as the sole edificator, ultimately shaping the soil microbiome over more than 40 years.
In the studied soil samples we found a diverse mycobiome; this finding strongly implies that, in the studied case, the soil mycobiome diversity is shaped primarily by the plant matter chemistry diversity. We believe the latter, i.e., plant matter quantity and quality, is the main mechanism, underlining conclusions about plant community diversity affecting soil microbiome diversity.
As compared with the soil mycobiome under Korean red pine [26], our samples had a comparable number of different taxa, except for phyla, as only Ascomycota and Basidiomycota were found under the red pine. A similar predominance of Basidiomycota and Ascomycota, with other phyla being scarce, was reported for other forest soils [27,28,29,30,31].
Fungi in soil are known to vary by at least four orders of magnitude in size, from single cells to gigantic single mycelial individuals [32]. Biodiversity concepts and indices were developed for a number of specimens, i.e., individual organisms of a certain species in a given location. Obviously, an individual organism of a soil fungus is extremely difficult, if at all possible, to determine and count. Thus, we cannot help but emphasize the truism that one cannot overestimate the metagenomic approach to assessing soil mycobiome by classifying diversity into taxa defined by a specific sequence similarity and obtaining inventories of the species inhabiting an ecosystem.
However, amplicon sequencing of partial regions (often ITS) of the ribosomal RNA loci, which is widely used to profile microbiomes by calculating the relative abundance of taxa-specific sequence reads in the total number of reads, is not so straightforward [33], as the rDNA copy number can vary considerably across fungi, ranging from an estimated 14 to 1442 copies [34], and can be associated with environment variation, species, and life cycle stages, i.e., between dikaryotic and monokaryotic mycelia [35]. Therefore, apparent abundance changes in a microbiome may be driven by a genomic response to the environment. This might be the case in this study as well, where variation in plant matter input may stimulate fungal decomposition and increase the rDNA copy number. This could explain the rather high variation in the relative abundance of the dominant fungal taxa among the replicated soil samples in the case of this study.
The fungal α-diversity indices in our study were rather close to the ones reported for the dark-brown soil under the tree-species rich mixed coniferous forests with Korean pine in China [30], and for Cambisols and Podzols under mixed or coniferous forests in the Italian Alps [29], where, for instance, the Shannon’s index was 3.84 and 3.13–3.92, respectively, as compared with the value of our study of 3.95.
The finding of the major, i.e., with at least 5% of the relative abundance, dominant genera, such as Amphinema, Sebacina, Cryptococcus, unclassified Hyaloscyphaceae, and Helotiales, all known as mycorrhizal fungi or deadwood decomposers, agrees with the ecosystem studied (undisturbed pine stand with plenty of deadwood, needle, and root litter). The notable presence of Suillus americanus was no surprise, a well-known ectomycorrhizal fungus with a preference for pines [36], in the studied samples. The finding that Pseudogymnoascus sp. (Pseudogymnoascus/Pseudeurotiaceae/Dothideomycetes/Ascomycota) was one of the two dominant OTUs, common to the mycobiomes of all samples, is more interesting, as not many species of the genus have been isolated from different environments in the Northern Hemisphere. The genus can be found in different cold environments, being isolated from wood, root, and soil samples, and is known as the most widespread decomposer fungus in maritime Antarctic soils [37]. Another common dominant OTU, belonging to Hyaloscyphaceae, Helotiales/Leotimycetes/Ascomycota, includes various saprobes, decomposing plant matter, usually wood, and can be root symbionts as well [38].
Our finding that few OTUs dominated in each soil sample, the vast majority being minor or rare mycobiome members, suggests that the ecosystem processes performed by soil fungi rely on a very limited taxonomic diversity, at least in soil under a mono-species tree stand. This insight may be helpful in reconstructing soil microbial communities during land reclamation by forest planting or tree phytoremediation. However, some rare soil fungi might play unique ecological roles, which may be difficult to elucidate, but should be included in the agenda for further research on the forest soil mycobiome and its role in forest sustainability and restoration.
We found only two dominant OTUs (with 2–7% relative abundance) of Ascomycota were common to all four soil replicates. This was somewhat surprising, as careful bulking, mixing, sieving, and aliquoting were performed during soil sampling and subsequent handling, in order to homogenize soil, hence eliminating patchiness on a smaller scale. Fungal hypha are binding agents for soil microaggregates (<250 μm), which are rather stable [39]; hyphae also occupy voids in macroaggregates, i.e., particles sized 250 μm−1 mm and more. Both fractions are not affected by soil sieving with the commonly used mesh size 1–2 mm. Thus, even a minor variation in soil aliquots, taken for DNA extraction, may slightly change aggregate composition and bring some variation in fungal diversity, as with DNA extraction kits 0.1–0.5 g of soil is taken for extraction. Indeed, strong variations in fungal diversity were observed between replicates of the small samples (<1 g) as compared to the larger (4 g) ones [40]. Greater microbiome diversity was found in soil microaggregates [41]. Besides, some hyphae occurring on the surfaces or in voids between bigger particles could have been removed with roots and plant debris and/or disrupted by sieving. Therefore, the fact that very few dominant OTUs were common to all four individual soil samples may be attributed, at least in part, to the soil aliquot size, aggregate heterogeneity, vulnerability to coarse particles/roots removal, and sieving. These factors can also explain why the meta-analysis did not find any globally distributed OTUs in soil fungal communities [42]; why soil fungal communities responded weakly to abiotic and biotic factors [43]; and why there was no positive correlation between plant and fungal diversity [31]. One should also bear in mind that differences in rDNA copy numbers [34] may also contributed to all of the above mentioned facts, thus making estimating mycobiome structure more challenging.
Soil pH was shown to significantly affect mycobiome composition in a broad-leaved Korean pine mixed forest [44], and our study found an association of the ultimately prevailing Leotiomycetes with soil pH, even within the very narrow range of just 0.07 between our soil samples. This suggests a high sensitivity of this major dominant class to this important soil property. The location of the class in the same semiplane with soil organic matter and microbial biomass characteristics (Figure 2a) strongly suggests (a) the class has a leading role in organic matter transformation in soil, and (b) its predominant contribution to the soil microbial biomass. The latter, as measured by the chloroform-fumigation extraction method, includes all microscopic soil organisms; however, microscopic fungi can account for ¾ of soil microbial biomass carbon [45]. The close association of Leotiomycetes relative abundance with those α-biodiversity indices (based on OTUs, Figure 2b) that relate to taxa predominance agrees with the previous finding, as pulses of plant material input into soil most likely benefit the certain OTUs of the most abundant decomposer class. Interestingly, the Agaricomyctes and Dothideomycetes classes, the most closely associated with the observed and potential OTU richness and Shannon’s indices, did not reveal a close relationship with most soil properties, which may imply these fungi have a lower biomass due to partially inactive mycelium and/or spores. The close association of Tremellomycetes with histidine respiration quotient implies the taxon has a preference for N-enriched substrates/microhabitats, most likely close to pine roots.

5. Conclusions

The presented data provide an inventory of soil mycobiome diversity, as specifically shaped by the soil environment developed under a monospecies pine stand, i.e., by the long-term intimate relationship between soil microorganisms and the sole plant edificator, e.g., its diverse phytomass chemistry. The variation of chemical and microbial characteristics, even between a small number of individual soil replicate samples, apparently results in a soil environment dynamic enough to have very few fungal OTUs common to all replicates.
The described soil mycobiome provides a reference for further studies of soil microbial ecology, especially under Korean pine, with its aesthetic as well as nut-producing qualities. The results of our pilot profiling of the soil mycobiome specific to the Korean pine will be helpful in the targeted creation of a soil mycobiome beneficial for pines in afforestation and remediation contexts.

Supplementary Materials

The following supporting information can be downloaded at: https://www.mdpi.com/article/10.3390/applmicrobiol2030036/s1, Figure S1: The number of fungal OTUs as dependent on the number of sequences reads in 4 individual soil samples (shown in different colours) collected from Cambisol under Korean pine stand: solid line—interpolated, dashed line—extrapolated.

Author Contributions

Conceptualization, G.K. and N.N.; methodology, N.N.; validation, G.K. and M.K.; formal analysis, T.A.; investigation, T.A.; resources, M.K.; data curation, N.N.; writing—original draft preparation, N.N.; writing—review and editing, M.K.; visualization, T.A.; supervision, M.K.; project administration, N.N.; funding acquisition, G.K. and M.K. All authors have read and agreed to the published version of the manuscript.

Funding

This research was funded by the MINISTRY OF SCIENCE AND HIGHER EDUCATION OF THE RUSSIAN FEDERATION, projects number 121031700309-1.

Institutional Review Board Statement

Not applicable.

Informed Consent Statement

Not applicable.

Data Availability Statement

The read data reported in this study were submitted to the GenBank under the SRA accession number SRP152492 (https://www.ncbi.nlm.nih.gov/sra/?term=SRP152492, accessed on 12 July 2022).

Conflicts of Interest

The authors declare no conflict of interest. The funders had no role in the design of the study; in the collection, analyses, or interpretation of data; in the writing of the manuscript, or in the decision to publish the results.

References

  1. Baldrian, P. Forest microbiome: Diversity, complexity and dynamics. FEMS Microbiol. Rev. 2017, 41, 109–130. [Google Scholar] [CrossRef] [Green Version]
  2. Jin, X.; Li, F.; Pukkala, T.; Dong, L. Modelling the cone yields of Korean pine. For. Ecol. Manag. 2020, 464, 118086. [Google Scholar] [CrossRef]
  3. Xu, D.; Yan, H. A study of the impacts of climate change on the geographic distribution of Pinus koraiensis in China. Environ. Int. 2001, 27, 201–205. [Google Scholar] [CrossRef]
  4. Gao, H.; Liu, Q.; Song, Y.; Jiang, M.; Yin, Y. Modeling Primary Branch Diameter and Length for Planted Pinus koraiensis by Incorporating Neighbor Competition in Northeast China. Forests 2022, 13, 912. [Google Scholar] [CrossRef]
  5. Vyvodtsev, N.V.; Somov, E.V.; Tutrin, S.A.; Koboyashi, R. Bioecological and morphometric characteristics of the pine forests in Khabarovsk region. For. Tax. Manag. 2012, 40, 27–34. (In Russian) [Google Scholar]
  6. Liang, Y.; Bai, X.; Xu, X.; Xu, H.; Wang, J.; Pan, P. Direct in vitro organogenesis from sprouted seeds of a highly economical and ecological valued tree, Korean pine. Plant Cell Tissue Organ Cult. 2022, 148, 197–207. [Google Scholar] [CrossRef]
  7. Qi, D.; Feng, F.; Fu, Y.; Ji, X.; Liu, X. Effects of Soil Microbes on Forest Recovery to Climax Community through theRegulation of Nitrogen Cycling. Forests 2020, 11, 1027. [Google Scholar] [CrossRef]
  8. Lee, D.; Choi, J. Stocking Diagrams for Silvicultural Guideline in Korean Pines and Japanese Larch. Forests 2020, 11, 833. [Google Scholar] [CrossRef]
  9. Urbanová, M.; Šnajdr, J.; Baldrian, P. Composition of fungal and bacterial communities in forest litter and soil is largely determined by dominant trees. Soil Biol. Biochem. 2015, 84, 53–64. [Google Scholar] [CrossRef]
  10. Shi, L.L.; Wen, Y.; Yang, Z.J.; Zang, H.D.; Gui, H.; Zou, X.M.; Mortimer, P. Dominant tree species identity effects on soil fungi are context dependent. Mycosphere 2018, 9, 790–802. [Google Scholar] [CrossRef]
  11. IUSS Working Group. WRB, World Reference Base for Soil Resources 2015. In International Soil Classification System for Naming Soils and Creating Legends for Soil Maps; FAO: Rome, Italy, 2015. [Google Scholar]
  12. Carter, M.R.; Gregorich, E.G. (Eds.) Soil Sampling and Methods of Analysis; CRC Press: Boca Raton, FL, USA, 2008. [Google Scholar]
  13. Vance, E.D.; Brookes, P.C.; Jenkinson, D.S. An extraction method for measuring soil microbial biomass-C. Soil Biol. Biochem. 1987, 19, 703–707. [Google Scholar] [CrossRef]
  14. Brookes, P.C.; Landman, A.; Pruden, G.; Jenkinson, D.S. Chloroform fumigation and the release of soil-nitrogena rapid direct extraction method to measure microbial biomass nitrogen in soil. Soil Biol. Biochem. 1985, 17, 837–842. [Google Scholar] [CrossRef]
  15. Pell, M.; Stenstrom, L.; Granhall, U. Soil respiration. In Microbiological Methods for Assessing Soil Quality; Bloem, J., Hopkins, D.W., Benedetti, A., Eds.; CABI International: Wallingford, UK, 2005; pp. 117–126. [Google Scholar] [CrossRef]
  16. Insam, H.; Haselwandter, K. Metabolic quotient of the soil microflora in relation to plant succession. Oecologia 1989, 79, 174–178. [Google Scholar] [CrossRef] [PubMed]
  17. Fadrosh, D.W.; Ma, B.; Gajer, P.; Sengamalay, N.; Ott, S.; Brotman, R.M.; Ravel, J. An improved dual-indexing approach for multiplexed 16S rRNA gene sequencing on the Illumina MiSeq platform. Microbiome 2014, 2, 6. [Google Scholar] [CrossRef] [Green Version]
  18. Igolkina, A.A.; Grekhov, G.A.; Pershina, E.V.; Samosorova, G.G.; Leunova, V.M.; Semenov, A.A.; Baturina, O.A.; Kabilov, M.R.; Andronov, E.E. Identifying components of mixed and contaminated soil samples by detecting specific signatures of control 16S rRNA libraries. Ecol. Ind. 2018, 94, 446–453. [Google Scholar] [CrossRef]
  19. Edgar, R.C. UPARSE: Highly accurate OTU sequences from microbial amplicon reads. Nat. Methods 2013, 10, 996–998. [Google Scholar] [CrossRef]
  20. Edgar, R.C. SINTAX, a Simple Non-Bayesian Taxonomy Classifier for 16S and ITS Sequences. 2016. Available online: http://biorxiv.org/content/early/2016/09/09/074161 (accessed on 12 July 2022).
  21. Abarenkov, K.; Zirk, A.; Piirmann, T.; Pöhönen, R.; Ivanov, F.; Nilsson, R.H.; Kõljalg, U. UNITE USEARCH/UTAX Release for Fungi; Version 04.02.2020; UNITE Community: Melbourne, Australia, 2020. [Google Scholar] [CrossRef]
  22. Deshpande, V.; Wang, Q.; Greenfield, P.; Charleston, M.; Porras-Alfaro, A.; Kuske, C.R.; Cole, J.R.; Midgley, D.J.; Tran-Dinh, N. Fungal identification using a Bayesian classifier and the Warcup training set of internal transcribed spacer sequences. Mycologia 2016, 108, 1–5. [Google Scholar] [CrossRef]
  23. Hammer, O.; Harper, D.A.T.; Ryan, P.D. PAST: Paleontological Statistics Software Package for Education and Data Analysis. Palaeontol. Electron. 2001, 4, 9. [Google Scholar]
  24. Bo-Ra, K.; Shin, J.; Guevarra, R.B.; Lee, J.H.; Kim, D.W.; Seol, K.-H.; Lee, J.-H.; Kim, H.B.; Isaacson, R.E. Deciphering Diversity Indices for a Better Understanding of Microbial Communities. J. Microbiol. Biotechnol. 2017, 27, 2089–2093. [Google Scholar] [CrossRef] [Green Version]
  25. Buee, M.; Reich, M.; Murat, C.; Morin, E.; Nilsson, R.H.; Uroz, S.; Martin, F. 454 Pyrosequencing analyses of forest soils reveal an unexpectedly high fungal diversity. New Phytologist 2009, 1842, 449–456. [Google Scholar] [CrossRef]
  26. Kim, C.S.; Han, S.-K.; Nam, J.W.; Jo, J.W.; Kwag, Y.-N.; Han, J.-G.; Sung, G.-H.; Lim, Y.W.; Oh, S. Fungal communities in a Korean red pine stand, Gwangneung Forest, Korea. J. Asia-Pac. Biodivers. 2017, 10, 559–572. [Google Scholar] [CrossRef]
  27. Goldmann, K.; Schöning, I.; Buscot, F.; Wubet, T. Forest Management Type Influences Diversity and Community Composition of Soil Fungi across Temperate Forest Ecosystems. Front. Microbiol. 2015, 6, 1300. [Google Scholar] [CrossRef] [PubMed] [Green Version]
  28. Sun, H.; Santalahti, M.; Pumpanen, J.; Koster, K.; Berninger, F.; Raffaello, T.; Jampponen, A.; Asiegbu, F.O.; Heinonsalo, J. Fungal Community Shifts in Structure and Function across a Boreal Forest Fire Chronosequence. Appl. Environ. Microbiol. 2015, 81, 7869–7880. [Google Scholar] [CrossRef] [PubMed] [Green Version]
  29. Siles, J.A.; Margesin, R. Abundance and Diversity of Bacterial, Archaeal, and Fungal Communities Along an Altitudinal Gradient in Alpine Forest Soils, What Are the Driving Factors? Microb. Ecol. 2016, 72, 207–220. [Google Scholar] [CrossRef] [Green Version]
  30. Ping, Y.; Han, D.; Wang, N.; Hu, Y.; Mu, L.; Feng, F. Vertical zonation of soil fungal community structure in a Korean pine forest on Changbai Mountain, China. World J. Microbiol. Biotechnol. 2017, 33, 1. [Google Scholar] [CrossRef]
  31. Amma, S.; Toju, H.; Wachrinrat, C.; Sato, H.; Tanabe, A.S.; Artchawakom, T.; Kanzaki, M. Composition and Diversity of Soil Fungi in Dipterocarpaceae-Dominated Seasonal Tropical Forests in Thailand. Microbes Environ. 2018, 33, 135–143. [Google Scholar] [CrossRef]
  32. Smith, M.L.; Bruhn, J.N.; Anderson, J.B. The fungus Armillaria bulbosa is among the largest and oldest living organisms. Nature 1992, 356, 428–431. [Google Scholar] [CrossRef]
  33. Lavrinienko, A.; Jernfors, T.; Koskimaki, J.J.; Pirtilla, A.M.; Watts, P.C. Does Intraspecific Variation in rDNA Copy Number Affect Analysis of Microbial Communities? Trends Microbiol. 2020, 29, 19–27. [Google Scholar] [CrossRef]
  34. Lofgren, L.A.; Uehling, J.K.; Branco, S.; Bruns, T.D.; Martin, F.; Kennedy, P.G. Genome-based estimates of fungal rDNA copy number variation across phylogenetic scales and ecological lifestyles. Mol. Ecol. 2019, 28, 721–730. [Google Scholar] [CrossRef]
  35. Baldrian, P.; Větrovský, T.; Cajthaml, T.; Dobiášová, P.; Petránková, M.; Šnajdr, J.; Eichlerová, I. Estimation of fungal biomass in forest litter and soil. Fungal Ecol. 2013, 6, 1–11. [Google Scholar] [CrossRef]
  36. Liao, H.L.; Chen, Y.; Vilgalys, R. Metatranscriptomic Study of Common and Host-Specific Patterns of Gene Expression between Pines and Their Symbiotic Ectomycorrhizal Fungi in the Genus Suillus. PLoS Genet. 2016, 12, e1006348. [Google Scholar] [CrossRef] [PubMed]
  37. Misiak, M.; Goodall-Copestake, W.P.; Sparks, T.H.; Worland, M.R.; Boddy, L.; Magan, N.; Convey, P.; Hopkins, D.W.; Newsham, K.K. Inhibitory effects of climate change on the growth and extracellular enzyme activities of a widespread Antarctic soil fungus. Glob. Chang. Biol. 2020, 27, 1111–1125. [Google Scholar] [CrossRef]
  38. Vohník, M.; Figura, T.; Réblová, M. Hyaloscypha gabretae and Hyaloscypha gryndleri spp. nov. (Hyaloscyphaceae, Helotiales), two new mycobionts colonizing conifer, ericaceous and orchid roots. Mycorrhiza 2022, 32, 105–122. [Google Scholar] [CrossRef]
  39. Six, J.; Bossuyt, H.; Degryze, S.; Denef, K. A history of research on the link between (micro) aggregates, soil biota, and soil organic matter dynamics. Soil Tillage Res. 2004, 79, 7–31. [Google Scholar] [CrossRef]
  40. Ranjard, L.; Lejon, D.P.; Mougel, C.; Schehrer, L.; Merdinoglu, D.; Chaussod, R. Sampling strategy in molecular microbial ecology, influence of soil sample size on DNA fingerprinting analysis of fungal and bacterial communities. Environ. Microbiol. 2003, 5, 1111–1120. [Google Scholar] [CrossRef] [PubMed]
  41. Bach, E.M.; Williams, R.J.; Hargreaves, S.K.; Yang, F.; Hofmockel, K.S. Greatest soil microbial diversity found in micro-habitats. Soil Biol. Biochem. 2018, 118, 217–226. [Google Scholar] [CrossRef]
  42. Meiser, A.; Bálint, M.; Schmitt, I. Meta-analysis of deep-sequenced fungal communities indicates limited taxon sharing between studies and the presence of biogeographic patterns. New Phytol. 2014, 201, 623–635. [Google Scholar] [CrossRef] [PubMed]
  43. Adamczyk, M.; Hagedorn, F.; Wipf, S.; Donhauser, J.; Vittoz, P.; Rixen, C.; Frossard, A.; Theurillat, J.P.; Frey, B. The Soil Microbiome of GLORIA Mountain Summits in the Swiss Alps. Front. Microbiol. 2019, 10, 1080. [Google Scholar] [CrossRef]
  44. Wang, N.N.; Yang, X.; Li, S.L.; Sui, X.; Han, S.J.; Feng, F.J. Effects of precipitation variation on the distribution pattern of soil fungal diversity in broad-leaved Korean pine mixed forest. Ying Yong Sheng Tai Xue Bao 2013, 24, 1985–1990. (In Chinese) [Google Scholar]
  45. He, L.; Rodrigues, J.L.M.; Soudzilovskaia, N.A.; Barceló, M.; Olsson, P.A.; Song, C.; Tedersoo, L.; Yuan, F.; Yuan, F.; Lipson, D.A.; et al. Global biogeography of fungal and bacterial biomass carbon in topsoil. Soil Biol. Biochem. 2020, 151, 108024. [Google Scholar] [CrossRef]
Figure 1. Relative abundance (%) of fungal phyla (a), classes (b), orders (c), and families (d) in the 0–20 cm layer of Haplic Cambisol under a Korean pine stand. The marker shows the mean (n = 4), the box shows the standard error of the mean, and the whiskers indicate the standard deviation. Abbreviations in the names of some taxa: “unc_ means” “unclassified”, and “_is” denotes “incertae sedis”. “unc_Fungi” stands for the relative abundance of sequences that could not be assigned to any taxa below the Fungi level and that do not represent “a phylum” in a strict sense.
Applmicrobiol 02 00036 g001aApplmicrobiol 02 00036 g001b
Figure 2. Principal components analysis of the data matrix with fungal classes’ relative abundance as variables for analysis (blue circles) and soil properties (a) or α-biodiversity indices (b) as supplementary variables (in red): location of the variables in the plane of the first two principal components. Abbreviations: EC—electric conductivity; SOC—soil organic carbon, SON—soil organic nitrogen; SMBC—soil microbial biomass carbon, SMBN—soil microbial biomass nitrogen, Pw—water-extractable phosphorus, CO2—soil basal respiration, Glu, His—glucose- and histidine-induced respiration, QRg, QRh—respiratory quotients with glucose and histidine, Qm—metabolic quotient of the soil microbial biomass.
Applmicrobiol 02 00036 g002
Table 1. Some chemical and microbiological properties of Haplic Cambisol top 0−20 cm, from under Korean pine.
PropertyMeanS.E.M.C.V.
pH6.080.051
EC, dS∙m−10.060.020
SOC,%8.92.730
SIC,%0.330.0926
SMBC, mg/g soil2.00.839
SMBC/SOC,%2.10.315
SMBN, mg/g soil0.20.157
DOC, mg/kg soil303079
Pw, mg/kg soil0.50.247
NO3, mg N/kg soil6.92.740
NH4, mg N/kg soil2.01.259
SON, %0.450.123
SO(C/N)19.64.523
CO2, µgC-CO2/g soil·h5.01.631
Glu, µgC-CO2/g soil·h14.60.64
His, µgC-CO2/g soil·h6.11.322
QRg0.340.1233
QRh0.830.2935
Qm, µgC-CO2/mg SMBC2.81.55.2
Abbreviations used: EC—electric conductivity; SOC—soil organic carbon, SON—soil organic nitrogen; SMBC—soil microbial biomass carbon, SMBN—soil microbial biomass nitrogen, DOC—dissolved organic carbon, Pw—water-extractable phosphorus, SO(C/N)—ratio in soil organic matter, Glu, His—glucose- and histidine-induced respiration, QRg, QRh—respiratory quotients with glucose and histidine, Qm—metabolic quotient of soil microbial biomass.
Table 2. Relative abundance of the dominant fungal genera in the top 0−20 cm of Haplic Cambisol under Korean pine.
TaxonMeanS.E.M.C.V.
Amphinema10.09.494
Sebacina8.19.8120
un.1 Hyaloscyphaceae7.92.936
un. Helotiales6.95.884
Cryptococcus4.95.5113
Tomentella4.73.165
un. Hypocreales3.13.4109
Pseudogymnoascus3.10.515
Oidiodendron2.72.592
Penicillium2.31.357
Chalara2.30.520
un. Leotiomycetes2.21.045
Saitozyma1.81.796
Inocybe1.41.284
un. Dothideomycetes1.40.751
Lecanicillium1.32.2176
Umbelopsis1.20.648
Phialocephala1.20.865
Trichoglossum1.11.5142
Tetracladium1.01.0104
Mortierella1.00.332
1 un. stands for unclassified.
Table 3. Relative abundance of the dominant fungal OTUs in the top 0−20 cm of Haplic Cambisol under Korean pine.
OTU’s No.TaxonMeanS.E.M.C.V.
4un.1 Amphinema8.29.5116
3un. Sebacina7.69.4123
5 2un. Hyaloscyphaceae7.02.130
7un. Cryptococcus4.95.5113
6un. Helotiales3.65.9162
8un. Pseudogymnoascus3.10.515
17un. Hypocreales3.03.4111
10un. Ascomycota2.94.1141
14un. Ascomycota2.13.5163
32un. Tomentella1.83.0166
16Saitozyma podzolica1.81.796
26un. Penicillium1.61.7110
47un. Tomentella1.41.178
24Lecanicillium primulinum1.22.2179
38un. Amphinema1.21.8152
19un. Chalara1.11.3116
27Phialocephala fortinii1.10.871
617un. Oidiodendron1.11.1106
23un. Leotiomycetes1.00.331
1 un. stands for unclassified. 2 denotes the dominant OTUs that were common for all four samples studied.
Table 4. Fungal OTU diversity indices in the top 0–20 cm of Haplic Cambisol under Korean pine.
IndexMeanS.E.M.C.V.
Richness 41910926
Chao-14379923
Simpson (1-D)0.950.012
Shannon4.00.49
Evenness0.140.0318
Equitability0.670.046
Berger-Parker0.160.0322
Dominance (D)0.050.0128
Publisher’s Note: MDPI stays neutral with regard to jurisdictional claims in published maps and institutional affiliations.

