Article

Truth or Lie: Does the DNA Extraction Procedure Really Affect the Insight in Composition and Diversity of Microbial Communities in Saffron Cultivated Soils?

by
Samuele Voyron
1,2,
Íris Marisa Maxaieie Victorino
1,2,3,
Matteo Caser
4,
Sonia Demasi
4,
Valentina Scariot
1,4,
Valeria Bianciotto
1,
Stefano Ghignone
1,* and
Erica Lumini
1,*
1
Institute for Sustainable Plant Protection, National Research Council (CNR), Viale Mattioli 25, 10125 Torino, Italy
2
Department of Life Sciences and Systems Biology, University of Turin, Viale Mattioli 25, 10125 Torino, Italy
3
Biological Science Department, Science Faculty, Eduardo Mondlane University (UEM), Av. Julius Nyerere nr 3453 Campus Principal, Maputo P.O. Box 257, Mozambique
4
Department of Agricultural, Forest and Food Sciences, University of Torino, Largo Paolo Braccini 2, 10095 Grugliasco, Italy
*
Authors to whom correspondence should be addressed.
Appl. Microbiol. 2022, 2(3), 492-501; https://doi.org/10.3390/applmicrobiol2030038
Submission received: 4 June 2022 / Revised: 15 July 2022 / Accepted: 18 July 2022 / Published: 19 July 2022

Abstract

:
The aim of this study was to evaluate the performance of two of the most commonly used commercial kits for soil DNA extraction regarding the values of the taxonomic diversity of prokaryotes and community composition of saffron (Crocus sativus) cultivated fields. The impact of the QIAGEN-DNeasy PowerSoil Kit (MO) and Macherey-Nagel™ NucleoSpin™ Soil (MN) kit was tested on the soil of an Italian western alpine experimental site located in Saint Christophe (Aosta Valley, AO). Nine biological replicas of bulk soil were collected and analyzed independently with the two kits. 16S rRNA metabarcoding was applied to characterize soil microbial communities. We first noticed that both DNA extraction kits yielded nearly the same number of OTUs: 1284 and 1268 for MN and MO, respectively. Both kits did not differ in the alpha diversity of the samples, while they had an influence on the beta diversity. The comparative analysis of the microbial community composition displayed differences in microbial community structure depending on which kit was used. These differences were especially highlighted at Phylum and Class levels. On the other hand, the fact that, from a functional point of view, our approach did not highlight any differences allows us to state that the results obtained with the two extraction kits are comparable and interchangeable. Based on these results and those in the literature, we could undoubtedly recommend both commercial kits, especially if the soil target microorganisms are prokaryotes and the study focuses on agricultural sites.

Graphical Abstract

1. Introduction

Environmental DNA analysis (eDNA) has been recognized as an efficient method for the description and characterization of microbial diversity, hampered for a long time by traditional microbiology methods, based on culture isolation methods [1]. Moreover, during the last decades, thanks to technological advances in DNA sequencing (high throughput sequencing) and data analysis, the detection of taxa present in an eDNA sample was successfully applied in many different environmental samples collected from terrestrial and aquatic ecosystems (e.g., soil compartments, marine, freshwater, ice) [2]. Indeed, DNA metabarcoding [3] provides a useful, cheaper, faster, more sensitive, and easily scalable for routine monitoring program approach to characterizing biodiversity of whole communities by using DNA traces of organisms for their taxonomic identification from a single sample [4]. However, together with soil sampling and DNA analyses, soil DNA extraction remains a critical issue, especially in environmental microbiology studies where soil biodiversity is very often reported as one of the most challenging to be investigated, despite its importance in regulating multiple ecosystem services such as nutrient cycling, organic matter decomposition, plant productivity and pathogen control [5]. Studies related to soil biodiversity have continuously gained importance due to its significant interlinkages with many other areas, such as agriculture and climate change in order to understand how land management and agricultural practices could affect or preserve soil biodiversity and functioning [6]. Regarding this field of investigation, over the last decade, a growing number of articles have focused on testing the metabarcoding effectiveness, and in particular its ability to quantify biodiversity and detect species present in agroecosystems [7,8]. However, while some studies compared, in the same environment, the diversity of organisms assessed with traditional methods versus DNA metabarcoding [9], not many others compared and documented for the same site/soil, the performance and results obtained after using different soil DNA extraction kits [10,11]. Such comparisons are needed to inform the scientific communities about the specificities and limitations of each approach and to allow us to define the best strategies for current and future biomonitoring programs such as, for example, those adopted by Long Term Observatories (LTOs) sites, sampled for soil biodiversity indicators (known as the indicator LTOs) [6]. Understanding the identity, ecology, and physiology of those microbial taxa, which partially exhibit hidden talent to overcome environmental-related problems like pollution and soil degradation, could be crucial to sustain plant healthy growth and soil fertility and to develop novel less impacting agriculture strategies. For these reasons an accurate selection of the optimal method is of high importance, and it can influence the results and the interpretation of the following analyses [12]. According to previous studies related to this important issue, the aim of this technical study was to evaluate the ability of two of the most commonly used commercial kits for soil DNA extraction to analyze the taxonomic diversity and community composition of prokaryotes in one saffron (Crocus sativus) cultivated field. The impact of the QIAGEN-DNeasy PowerSoil Kit (MO) and Macherey-Nagel™ NucleoSpin™ Soil (MN) kit was tested on the soil of an Italian western alpine experimental site located in Saint Christophe (Aosta Valley, AO, Italy) in order to establish if 16S rDNA Next Generation Sequencing (NGS) libraries, created on DNA isolated with the two kits, will produce reads representing the same or diverse prokaryotes communities. The diversity and community composition of soil bacteria and archaea were measured via amplicon sequencing using the Illumina MiSeq platform, following protocols endorsed by the Earth Microbiome Project (EMP) (http://earthmicrobiome.org/ accessed on 3 June 2022), in order to match our data to previous and future EU initiatives (i.e., EcoFINDERS; EUdaphobase; JRC/LUCAS; Soil BON; EJP_SOIL), devoted to mapping current and future status and trends in soil biodiversity across EU agroecosystems.

2. Materials and Methods
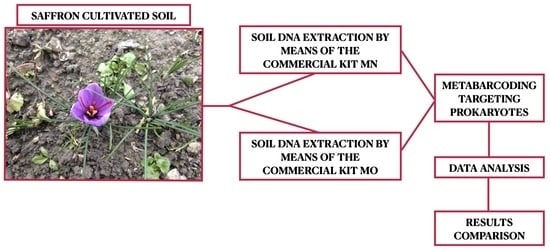
2.1. Sampling Site

One Italian western alpine experimental site, located in the municipality of Saint Christophe (45°45′06.9″ N; 7°20′37.0″ E; 700 m a.s.l.) (Aosta Valley, Italy) and cultivated with saffron (Crocus sativus) for at least the previous three years, was selected for our analyses [13,14]. Nine soil samples were collected at 10 cm depth, 1 m away from each other, and kept in zip lock bags at 4 °C before being processed. Soil samples were then sieved by means of a 2 mm stainless steel sieve mesh split into two 2 mL eppendorf tubes and then frozen at −20 °C.

2.2. Soil DNA Extraction, PCR Amplification, and Sequencing

All the steps described below were carried out by the same researcher in order to avoid additional variation in the DNA extraction, PCR products amplification, purification, and quantification. Total soil DNA has been extracted in double, from the 9 samples using two different commercial kits: DNeasy PowerSoil Kit, (formerly sold by MOBIO as PowerSoil DNA Isolation Kit) (Qiagen, Hilden, Germany), and Macherey-Nagel™ NucleoSpin™ Soil (MN) (Düren, Germany). Extractions were carried from 250 mg of soil samples, following the manufacturer’s protocols. The obtained DNA were then quantified by means of Qubit Fluorometer 2.0 (Thermo Fisher Scientific, Invitrogen) following manufacturer’s protocol, and then 20 ng per sample of bacterial 16S rDNA were then amplified using the primer set 515fB (GTGYCAGCMGCCGCGGTAA) [15] and 806rB (GGACTACNVGGGTWTCTAAT) [16] with the addition of the following Illumina overhang adapter sequences: forward overhang: 5′-TCGTCGGCAGCGTCAGATGTGTATAAGAGACAG-[locus specific target primer], reverse overhang: 5′-GTCTCGTGGGCTCGGAGATGTGTATAAGAGACAG-[locus specific target primer] in order to target 291 bp of the V3–V4 hypervariable region and have only a few biases against any bacterial taxa [17,18,19]. PCR reaction mixes were made using Invitrogen Platinum HotStart PCR Master Mix (Thermo Fisher Scientific) with the following PCR conditions: an initial step at 94 °C for 3 min, 30 cycles at 94 °C for 45 s, 57 °C for 45 s, 72 °C for 60 s and a final extension step of 72 °C for 10 min. DNA extracted was amplified in triplicate and pooled prior to the purification using the Wizard® SV Gel and PCR Clean-Up System (Promega). A final number of 18 PCR purified products were quantified with Qubit dsDNA BR Assay kit and Qubit Fluorometer 2.0 following manufacturer’s protocol and sent for Illumina MiSeq sequencing (2 × 250 bp) to IGA technologies (Udine, Italy).

2.3. Bioinformatic and Data Analysis
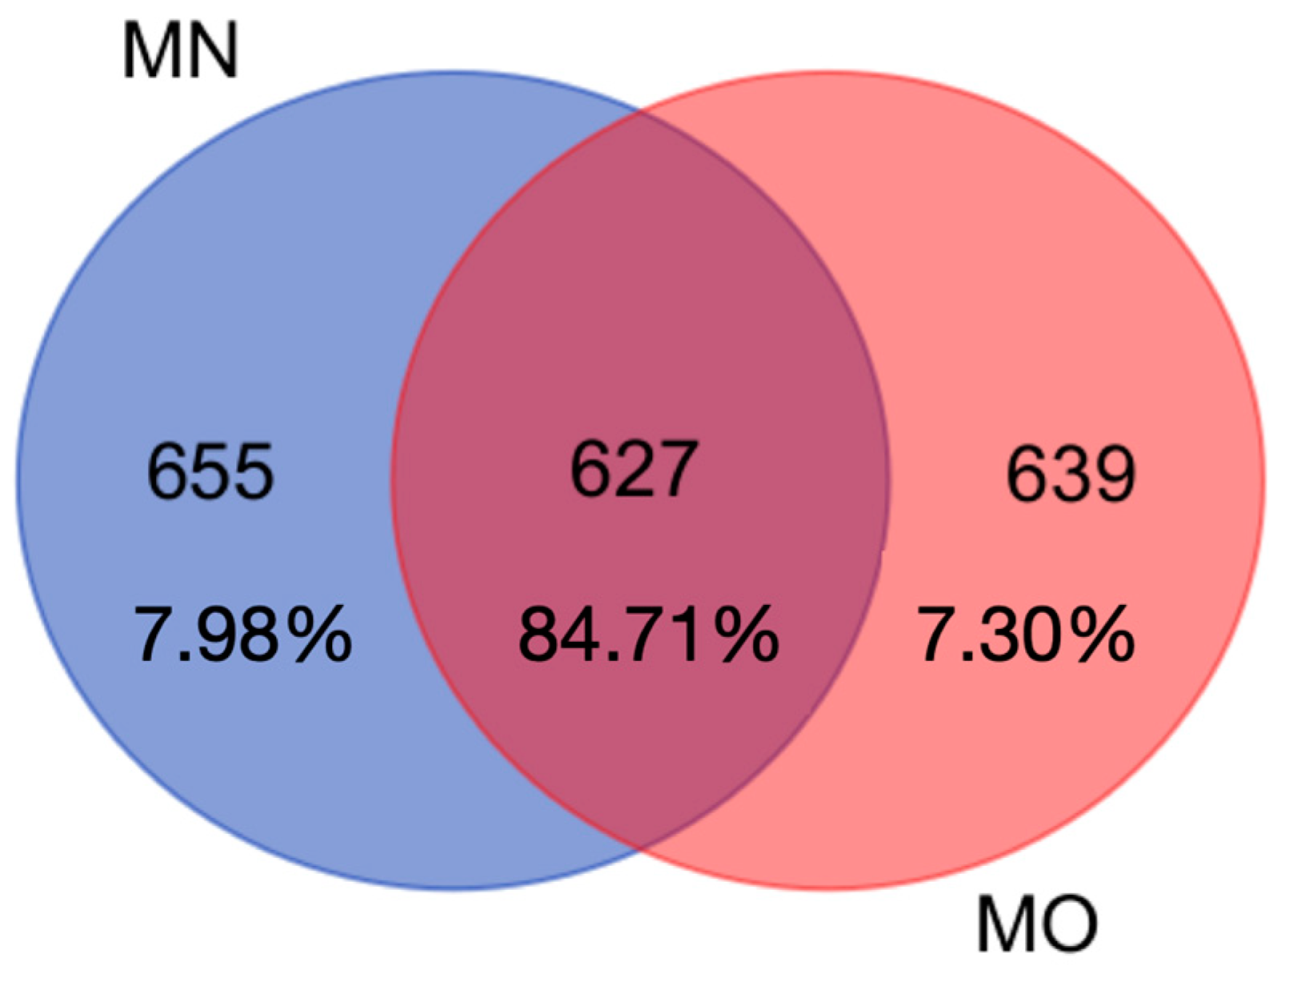
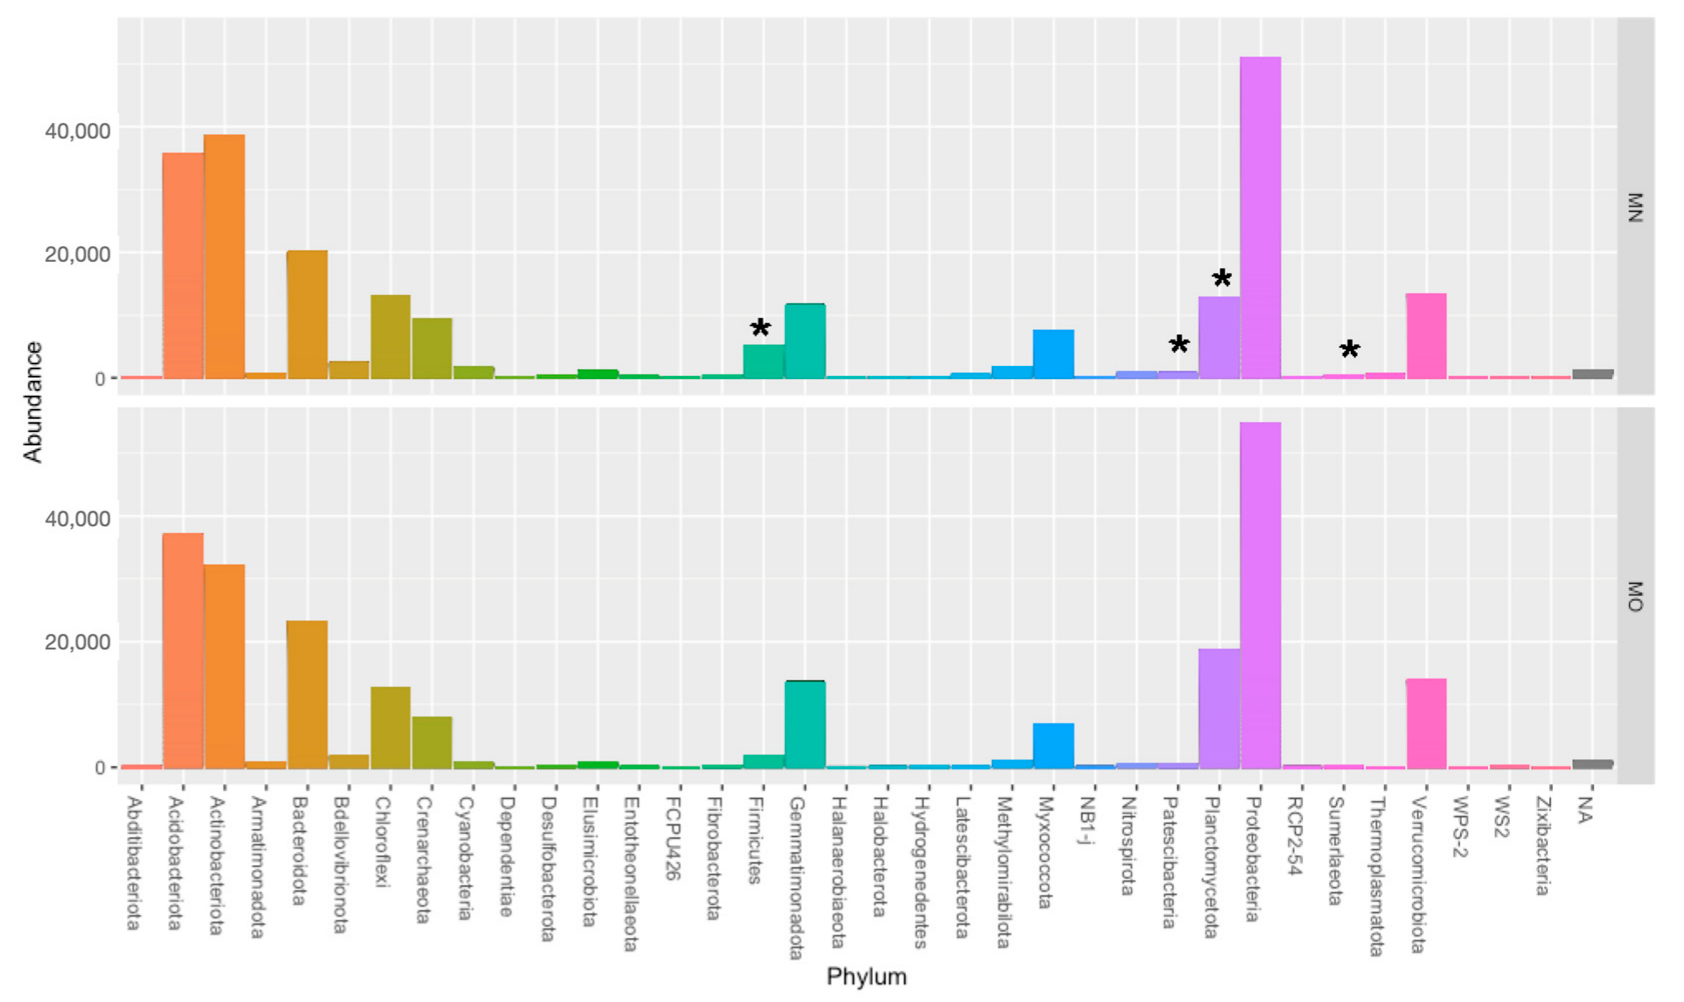
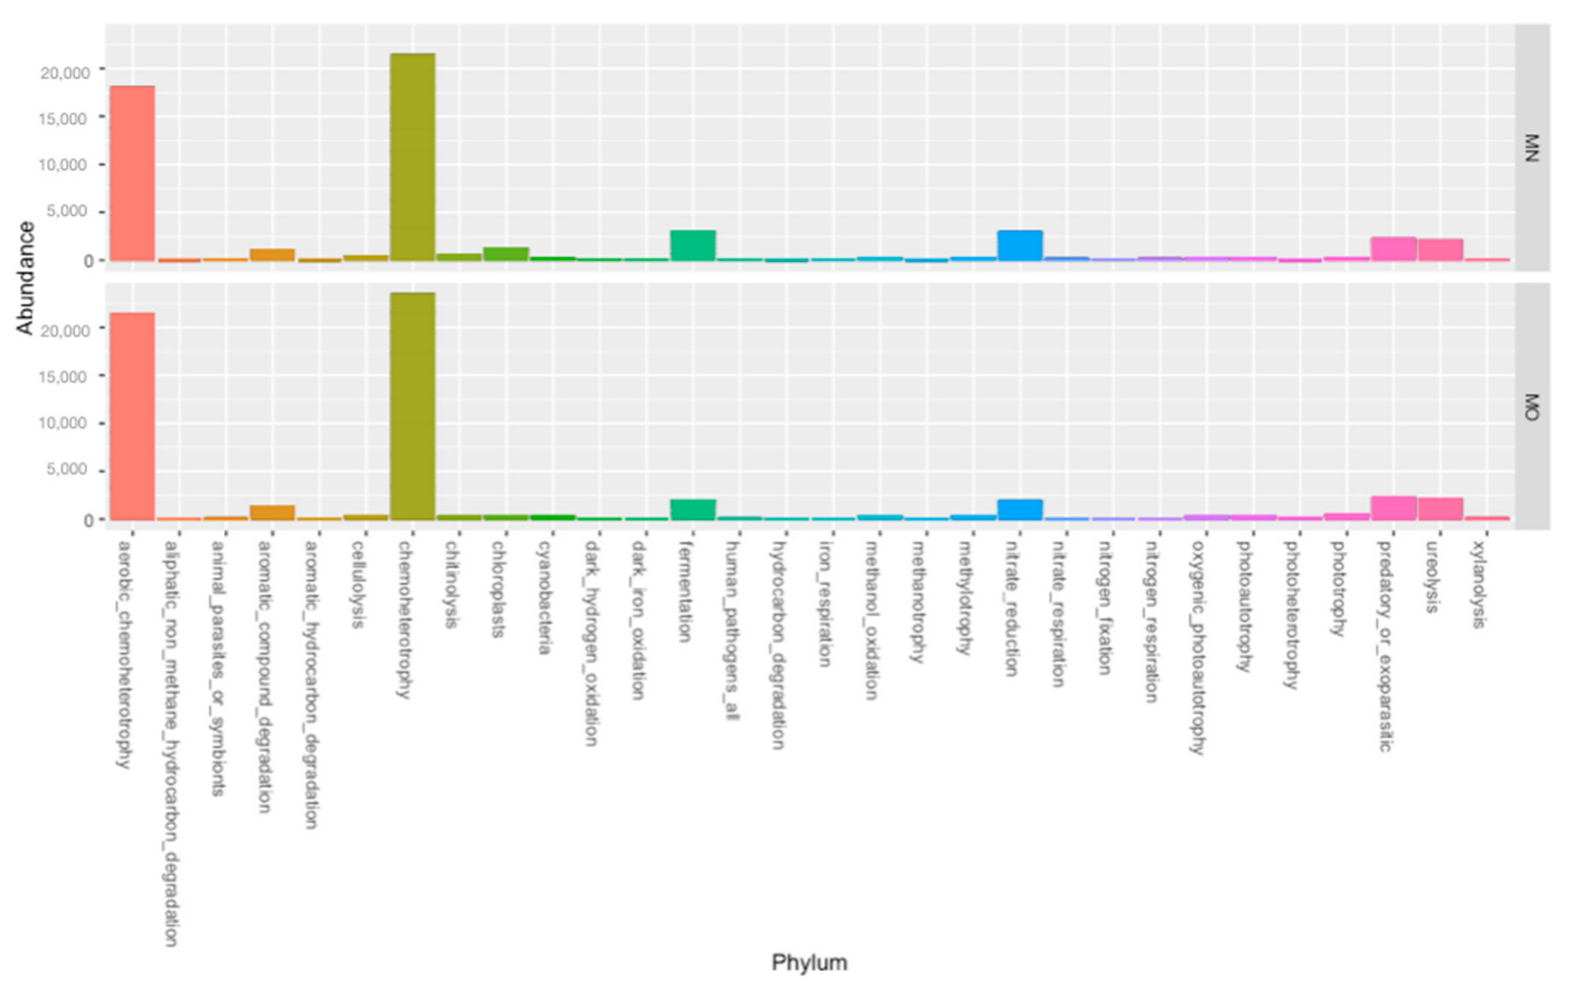
Due to the low quality of reverse sequences, only forward sequences were analyzed by means of the microbiome bioinformatics platform QIIME2 (Quantitative Insights Into Microbial Ecology 2, version 2021.2 [20]).
Denoising and quality control, including removal of chimeras, were achieved by means of the DADA2 plugin [21]. To avoid low-quality sequences, reads were truncated at 290 bp. The OTU table was generated by means of qiime vsearch cluster-features-de-novo plugin using 97% as the identity threshold.
The resulting OTU table was filtered and only sequences with a frequency ≥10 were retained. The taxonomic assignment was achieved using, as reference database, the SILVA Release 138.1 [22].
The generated dataset, including OTU table, taxonomy table, phylogenetic tree from Qiime2, and metadata, was then imported into Rstudio [23] and was used to create a phyloseq object by means of the R package qiime2R [24]. The R packages phyloseq version 1.36.0 [25], ggplot2 version 3.1.0 [26] and vegan version 2.5-4 [27] were employed for all the following analyses. The OTU table was rarefied at 25,338 sequences per sample, by means of the rarefy_even_depth function of the R package phyloseq. Rarefaction curves were obtained by means of the function rarecurve of the R package vegan. The dataset generated for this study can be found in the NCBI Sequence Read Archive (SRA-NCBI; https://submit.ncbi.nlm.nih.gov/subs/sra/SUB11366953, accessed on 3 July 2022) under project accession number PRJNA830672.
Biodiversity analyses were carried out by comparing the richness (number of species) and evenness (richness taking into account relative abundances) of bacterial communities. Within-sample (alpha) diversity was assessed by three estimators: “observed fungal species,” “Chao1,” and “Shannon”. Alpha diversity indexes were then plotted using the R package phyloseq, bar plots and ordination plot (NMDS) were obtained using the R packages phyloseq, ggplot2.
To evaluate the presence of significant differences (p < 0.05) between alpha diversity indexes, the adonis function from R package vegan was used to perform PERMANOVA tests using dissimilarity index of Bray-Curtis. Permutation test for homogeneity of multivariate dispersions was also run in order to check the validity of the previous tests by means of the function betadisper of the R package vegan. Moreover, to investigate if DNA Extraction kits influence the composition of the bacterial communities, the presence of significant differences between the taxonomic distribution and trophic level were evaluated by means of the software Past 4 [28], using the test Anova, Mann–Whitney pairwise comparison; Bonferroni corrected (p < 0.05). The evaluation of significant differences in terms of the number of retrieved OTUs was evaluated by means of a Chi-square test. Venn diagram was obtained by means of Venny2.1.0 software [29].
Trophic behavior was evaluated by means of FAPROTAX: Functional Annotation of Prokaryotic Taxa Version: 1.0 [30].
When possible, we have classified the sequences obtained at the Family level, because this is the taxonomic rank required for the use of FAPROTAX, all the other analyses were conducted at Kingdom, Phylum, and Class levels.

3. Results

After the bioinformatic analysis, 718,848 high-quality sequences (out of a total of 1,517,997 raw sequences) were obtained, and following subsampling, at even sequencing depth, 25,338 sequences for each sample were retained. Sequences were then clustered in 1925 OTUs. The rarefaction effects on the OTU table have been rendered by means of the rarefaction curves, in order to graphically estimate species richness. This analysis highlighted that all samples are well described, as a matter of fact, the curve ascribed to each sample reaches its plateau (Figure S1).
Our results showed that the two adopted DNA extraction kits yielded nearly the same number of OTUs, 1284 and 1268 for MN and MO, respectively (Chi-square test p > 0.05), 657 OTUs were exclusively retrieved using MN, 641 using MO, and 627 were shared between the two kits (Figure 1). In more detail, the 627 shared OTUs account for 84.7% of retrieved sequences (on average 617 sequences per OTU) while the 7.98% (on average 51 sequences per OTU), and the 7.30% (on average 58 sequences per OTU) were exclusively retrieved with MO and MN DNA extraction kits, respectively.
Our findings reveal also that the two DNA extraction kits did not affect the alpha diversity of the samples (Figure 2A, anova p > 0.05), while they had an influence on the beta diversity (PERMANOVA; p ≤ 0.025, Bray-Curtis) (Figure 2B). PERMANOVA analysis was supported by a non-significant result in permutest tests that have revealed an homogeneity of multivariate dispersions.
At the Kingdom-level (Figure S2) we didn’t observe any statistically significant difference between the two kits (Archea 4% MN; 3.5% MO; Bacteria 96% MN; 96.5% MO), while at the Phylum-level, the taxonomic analysis showed that not the same Phyla were found with both kits (Figure 3; Table S1), as a matter of fact with MO, we didn’t detect Dependentiae, FCPU426, Thermoplasmatota, and Zixibacteria, that were instead retrieved in samples extracted with MN even if with a really low abundance.
The most represented Phyla are Proteobacteria (22% MN; 24% MO), Actinobacteriota (17% MN; 14% MO), Acidobacteriota (16%MN; 16%MO), Bacteroidota (8.8% MN; 10% MO), Verrucomicrobiota (5.8% MN; 6% MO), Planctomycetota (5.5% MN; 8% MO, Chloroflexi (5.5% MN; 5.4% MO), Gemmatimonadota (5% MN; 5.9% MO), Crenarchaeota (4% MN; 3.4% MO), Myxococcota (3% MN; 3% MO), and Firmicutes (2.29% MN; 0.78% MO).
Significant differences in the abundance of taxonomic groups between the two kits were observed for four Phyla out of thirty-six (Figure 3; Table S1), and in more detail, Firmicutes, Patescibacteria, Sumerlaeota, and Thermoplasmatota were statistically more abundant in the samples extracted with MN (Anova, Mann–Whitney pairwise comparison; Bonferroni corrected (p < 0.05).
At Class-level, the most represented Classes are Alphaproteobacteria (11.6% MN; 12.7% MKO), Gammaproteobacteria (10.7% MN, 11.2% MO), Vicinamibacteria (9.1% MN, 7.7% MO), Bacteroidia (8.5% MN, 9.9% MO), Thermoleophilia (8.3% M;N, 5.6% MO), Actinobacteria (5.9% MN, 7.2 % MO), Verrucomicrobiae (5.8% MN, 6% MO), Nitrososphaeria (4.1% MN, 3.4% MO), Blastocatellia (3.9% MN, 6.3% MO), Gemmatimonadetes (3.3% MN, 3.8% MO), Planctomycetes (2.9% MN, 4.8% MO), KD4-96 (2.7% MN, 1.6% MO), Phycisphaerae (2.4% MN, 3.2% MO), and Bacilli (2% MN, 0.8% MO) (Supplementary Figure S3, Supplementary Table S2). Our result highlighted that the two adopted kits have had an influence on the retrieved bacterial communities at this taxonomic rank. In more detail, Bacilli, Chlostridia, Desulfuromonadia Gracilibacteria JG30-KF-CM66, and MB-A2-108 were statistically more abundant in samples extracted with MN (3.3% of total abundance) while Blastocatellia, Hydrogenedentia, Longimicrobia, OLB14, Phycisphaerae, and Planctomycetes were statistically more abundant in samples extracted with MO (15.39% of total abundance). Furthermore, eleven Classes out of the ninety-one retrieved were not detected using the MO kit (Zixibacteria, Babeliae, FCPU426, AT-s3-28, Microgenomatia, Thermacetogenia, Latescibacteria Limnochordia Subgroup_11, Subgroup_18, and Thermoplasmata) while only one was not detected using MN kit (Lineage IIc). Finally, concerning the taxonomic assignment, it is noteworthy that only a small percentage of sequences were not assigned either to Phylum (0.5% MN; 0.3% MO) or Class (0.6% MN; 0.4% MO) independently of the extraction kit (Tables S1 and S2). Regarding the trophic assignment of the two recovered bacterial communities, we did not find any statistical differences between those obtained from MN and MO (Figure 4).

4. Discussion

In this work, we have evaluated the influence of two of the most commonly used commercial kits for soil DNA extraction on the taxonomic diversity of prokaryotes and community composition of saffron (Crocus sativus) cultivated fields. We have investigated prokaryotic communities by means of an Illumina metabarcoding approach targeting 16S rDNA. In this study, we observed a high number of good quality reads, 718,848 which were clustered in 1925 OTUs. Concerning the number of OTUs, we have obtained roughly the same number of OTUs with the two extraction kits, but interestingly, only about a third of OTUs were retrieved with both. However, it is important to note that the variability introduced by the two adopted kits has an influence mainly on the recovery of sporadic/rare species, as a matter of fact, this third of OTUs in common represents the majority of the sequences found, i.e., 84.7%.
Only a small percentage of sequences were not assigned to Phylum or Class independently of the extraction kit. These findings allowed us to obtain an exhaustive picture of the microbial community structure with both extraction kits. Moreover, the alpha diversity analysis confirmed a similar diversity in the obtained populations. Our findings are partially in agreement with those obtained by Zielińska and coworkers [11], who demonstrated, by means of a metabarcoding approach, the existence of differences in microbial community structure depending on which kit was used. As a matter of fact, our results have highlighted that the abundance of different Phyla or Class in the microbial structure is significantly different. In our case, however, these differences are seen mostly among the less abundant Phyla or Class and thus had no influence on the core microbiome.
As stated by Changey and coworkers [31], during a long-term experiment, microbial DNA extraction, in conjunction with soil sampling and DNA data analysis, is one of the crucial issues in soil microbial community evaluation. These authors conclude that the DNA extraction methods substantially modify the concentration and quality of eDNA, and the abundance and structure of microbial communities, and this is particularly true for archeal and fungal communities while having less impact on bacterial communities. A precise comparison of our results with those obtained by Changey and coworkers [31], is impeded due to the fact that to evaluate bacterial communities, we have used an Illumina metabarcoding approach, while the aforementioned authors used qPCR and molecular fingerprint. Taking into account this discrepancy, we can, however, conclude that our results are in agreement with those mentioned above.
Another important question, reported by Soliman et al. [12], is represented by the handling bias inherent in the entire sample handling procedure. To minimize these biases, our work was entirely conducted by a single researcher. However, as demonstrated by our results, even though we can avoid or minimize handling bias, the effect of DNA extraction kits is not always predictable as it is sometimes influenced by particular soil management, which modifies some soil properties and reduces the efficiency of DNA extraction. For example, the addition of Biochar, which heavily modifies the structure and composition of organic C amounts, has been demonstrated to affect DNA extraction efficiency from soil [32]. On the other hand, we agree with Soliman et. al. [12], who reported that it is unrealistic to expect research groups all over the world to accept a strict standard that does not allow using commercial extraction kits of their own choice.

5. Conclusions

Finally, in our opinion, classification at the taxonomic level alone is not sufficient to throw full light on the effects of extraction kits on the composition of prokaryotic communities. As a matter of fact, even if we have seen some taxonomic differences between the two kits, the use of FAPROTAX (Predictive software, for the Functional Annotation of Prokaryotic Taxa) has demonstrated that the trophic assignment of the two recovered bacterial communities did not display any statistical differences, allowing us to show that the results obtained with the two extraction kits are comparable and interchangeable.

Supplementary Materials

The following supporting information can be downloaded at: https://www.mdpi.com/article/10.3390/applmicrobiol2030038/s1, Figure S1: Rarefaction curves with estimation of species richness per sample. Figure S2: Taxonomic distribution, at Kingdom level (MN=Machery Nagel DNA extraction kit; MO= Mobio DNA extraction kit). Figure S3: Taxonomic distribution, at Class level (MN=Machery Nagel DNA extraction kit; MO= Mobio DNA extraction kit). Table S1: Taxonomic distribution, at phylum level, of OTUs retrieved. Data are expressed as percentage (mean ± SE). (* Phylum that display statistically significant differences Mann-Whitney pairwise comparison; Bonferroni corrected; MN=Machery Nagel DNA extraction kit; MO= Mobio DNA extraction kit). Table S2: Taxonomic distribution, at Class level, of OTUs retrieved. Data are expressed as percentage (mean ± SE). (* Class that display statistically significant differences, Mann-Whitney pairwise comparison; Bonferroni corrected; MN=Machery Nagel DNA extraction kit; MO= Mobio DNA extraction kit).

Author Contributions

Conceptualization, S.V. and E.L.; Data curation, S.V., S.G. and E.L.; Formal analysis, S.V.; Investigation, Í.M.M.V., M.C., S.D., V.S., V.B. and E.L.; Methodology, S.V. and E.L.; Software, S.V. and S.G.; Writing—original draft, S.V.and E.L.; Writing–review and editing, S.V. and E.L. All authors have read and agreed to the published version of the manuscript.

Funding

This research was funded by the project titled “SaffronALP—Lo zafferano di montagna: tecniche sostenibili per una produzione di qualitaà”—Fondazione Cassa di Risparmio di Torino (RF = 2017.1966).

Institutional Review Board Statement

Not applicable.

Informed Consent Statement

Not applicable.

Data Availability Statement

The dataset generated for this study can be found in the NCBI Sequence Read Archive (SRA-NCBI; https://submit.ncbi.nlm.nih.gov/subs/sra/SUB11366953, accessed on 3 July 2022) under project accession number PRJNA830672.

Acknowledgments

The authors acknowledge L. Allione (IPSP-CNR) for administrative support.

Conflicts of Interest

The authors declare no conflict of interest.

References

  1. Pédron, J.; Guyon, L.; Lecomte, A.; Blottière, L.; Chandeysson, C.; Rochelle-Newall, E.; Raynaud, X.; Berge, O.; Barny, M.A. Comparison of Environmental and Culture-Derived Bacterial Communities through 16S Metabarcoding: A Powerful Tool to Assess Media Selectivity and Detect Rare Taxa. Microorganisms 2020, 8, 1129. [Google Scholar] [CrossRef] [PubMed]
  2. Foucher, A.; Evrard, O.; Ficetola, G.F.; Gielly, L.; Poulain, J.; Giguet-Covex, C.; Laceby, J.P.; Salvadores-Blanes, S.; Cerdan, O.; Poulenard, J. Persistence of environmental DNA in cultivated soils: Implication of this memory effect for reconstructing the dynamics of land use and cover changes. Sci. Rep. 2020, 10, 10502. [Google Scholar] [CrossRef] [PubMed]
  3. Taberlet, P.; Coissac, E.; Pompanon, F.; Brochmann, C.; Willerslev, E. Towards next-generation biodiversity assessment using DNA metabarcoding. Mol. Ecol. 2012, 21, 2045–2050. [Google Scholar] [CrossRef] [PubMed]
  4. Ruppert, K.M.; Kline, R.J.; Rahman, M.S. Past, present, and future perspectives of environmental DNA (eDNA) metabarcoding: A systematic review in methods, monitoring, and applications of global eDNA. Glob. Ecol. Conserv. 2019, 17, e00547. [Google Scholar] [CrossRef]
  5. Bardgett, R.D.; van der Putten, W.H. Belowground biodiversity and ecosystem functioning. Nature 2014, 515, 505–511. [Google Scholar] [CrossRef]
  6. Orgiazzi, A.; Dunbar, M.B.; Panagos, P.; de Groot, A.G.; Lemanceau, P. Soil biodiversity and DNA barcodes: Opportunities and challenges. Soil Biol. Biochem. 2015, 80, 244–250. [Google Scholar] [CrossRef]
  7. Bloor, J.M.G.; Si-Moussi, S.; Taberlet, P.; Carrère, P.; Hedde, M. Analysis of complex trophic networks reveals the signature of land-use intensification on soil communities in agroecosystems. Sci. Rep. 2021, 11, 18260. [Google Scholar] [CrossRef]
  8. Banerjee, S.; Walder, F.; Büchi, L.; Marcel Meyer, M.; Held, A.Y.; Gattinger, A.; Keller, T.; Charles, R.; van der Heijden, M.G.A. Agricultural intensification reduces microbial network complexity and the abundance of keystone taxa in roots. ISME J. 2019, 13, 1722–1736. [Google Scholar] [CrossRef] [Green Version]
  9. Keck, F.; Blackman, R.C.; Bossart, R.; Brantschen, J.; Couton, M.; Hürlemann, S.; Kirschner, D.; Locher, N.; Zhang, H.; Altermatt, F. Meta-analysis shows both congruence and complementarity of DNA and eDNA metabarcoding to traditional methods for biological community assessment. Mol. Ecol. 2022, 31, 1820–1835. [Google Scholar] [CrossRef]
  10. Terrat, S.; Plassart, P.; Bourgeois, E.; Ferreira, S.; Dequiedt, S.; Adele-Dit-De-Renseville, N.; Lemanceau, P.; Bispo, A.; Chabbi, A.; Maron, P.A.; et al. Meta-barcoded evaluation of the ISO standard 11063 DNA extraction procedure to characterize soil bacterial and fungal community diversity and composition. Microb. Biotechnol. 2015, 8, 131–142. [Google Scholar] [CrossRef] [Green Version]
  11. Zielińska, S.; Radkowski, P.; Blendowska, A.; Ludwig-Gałęzowska, A.; Łoś, J.M.; Łoś, M. The choice of the DNA extraction method may influence the outcome of the soil microbial community structure analysis. MicrobiologyOpen 2017, 6, e00453. [Google Scholar] [CrossRef] [PubMed]
  12. Soliman, T.; Yang, S.-Y.; Yamazaki, T.; Jenke-Kodama, H. Profiling soil microbial communities with next-generation sequencing: The influence of DNA kit selection and technician technical expertise. PeerJ 2017, 5, e4178. [Google Scholar] [CrossRef] [PubMed] [Green Version]
  13. Caser, M.; Victorino, Í.M.M.; Demasi, S.; Berruti, A.; Donno, D.; Lumini, E.; Bianciotto, V.; Scariot, V. Saffron Cultivation in Marginal Alpine Environments: How AMF Inoculation Modulates Yield and Bioactive Compounds. Agronomy 2019, 9, 12. [Google Scholar] [CrossRef] [Green Version]
  14. Victorino, Í.; Voyron, S.; Caser, M.; Orgiazzi, A.; Demasi, S.; Berruti, A.; Scariot, V.; Bianciotto, V.; Lumini, E. Metabarcoding of Soil Fungal Communities Associated with Alpine Field-Grown Saffron (Crocus sativus L.) Inoculated with AM Fungi. J. Fungi 2021, 7, 45. [Google Scholar] [CrossRef] [PubMed]
  15. Parada, A.E.; Needham, D.M.; Fuhrman, J.A. Every base matters: Assessing small subunit rRNA primers for marine microbiomes with mock communities, time series and global field samples. Environ. Microbiol. 2015, 18, 1403–1414. [Google Scholar] [CrossRef]
  16. Apprill, A.; McNally, S.; Parsons, R.; Weber, L. Minor revision to V4 region SSU rRNA 806R gene primer greatly increases detection of SAR11 bacterioplankton. Aquat. Microb. Ecol. 2015, 75, 129–137. [Google Scholar] [CrossRef] [Green Version]
  17. Bates, S.T.; Cropsey, G.W.G.; Caporaso, J.G.; Knight, R.; Fierer, N. Bacterial communities associated with the lichen symbiosis. Appl. Environ. Microbiol. 2011, 77, 1309–1314. [Google Scholar] [CrossRef] [Green Version]
  18. Bergmann, G.T.; Bates, S.T.; Eilers, K.G.; Lauber, C.L.; Caporaso, J.G.; Walters, W.A.; Knight, R.; Fierer, N. The under-recognized dominance of Verrucomicrobia in soil bacterial communities. Soil Biol. Biochem. 2011, 43, 1450–1455. [Google Scholar] [CrossRef] [Green Version]
  19. Zhu, D.; Tanabe, S.H.; Yang, C.; Zhang, W.; Sun, J. Bacterial Community Composition of South China Sea Sediments through Pyrosequencing-Based Analysis of 16S rRNA Genes. PLoS ONE 2013, 8, e78501. [Google Scholar] [CrossRef]
  20. Bolyen, E.; Rideout, J.R.; Dillon, M.R.; Bokulich, N.A.; Abnet, C.C.; Al-Ghalith, G.A.; Alexander, H.; Alm, E.J.; Arumugam, M.; Asnicar, F.; et al. Reproducible, interactive, scalable and extensible microbiome data science using QIIME 2. Nat. Biotechnol. 2019, 37, 852–857. [Google Scholar] [CrossRef]
  21. Callahan, B.J.; McMurdie, P.J.; Rosen, M.J.; Han, A.W.; Johnson, A.J.A.; Holmes, S.P. DADA2: High-resolution sample inference from Illumina amplicon data. Nat. Methods 2016, 13, 581–583. [Google Scholar] [CrossRef] [PubMed] [Green Version]
  22. Michael, S.; Robeson, M.S., II; O’Rourke, D.R.; Kaehler, B.D.; Ziemski, M.; Dillon, M.R.; Foster, J.T.; Bokulich, N.A. RESCRIPt: Reproducible sequence taxonomy reference database management. PLoS Comput. Biol. 2021, 17, e1009581. [Google Scholar] [CrossRef]
  23. RStudio Team. RStudio: Integrated Development for R. RStudio, PBC, Boston, MA. 10/01/2020. Available online: http://www.rstudio.com/ (accessed on 3 June 2022).
  24. Bisanz, J.E. qiime2R: Importing QIIME2 Artifacts and Associated Data into R Sessions. 2018. Available online: https://github.com/jbisanz/qiime2R (accessed on 3 June 2022).
  25. McMurdie, P.J.; Holmes, S. phyloseq: An R Package for Reproducible Interactive Analysis and Graphics of Microbiome Census Data. PLoS ONE 2013, 8, e61217. [Google Scholar] [CrossRef] [PubMed] [Green Version]
  26. Wickham, H. ggplot2: Elegant Graphics for Data Analysis; Springer: New York, NY, USA, 2016. [Google Scholar]
  27. Oksanen, J.; Blanchet, F.G.; Friendly, M.; Kindt, R.; Legendre, P.; McGlinn, D.; Minchin, P.R.; O’Hara, R.B.; Simpson, G.L.; Solymos, P.; et al. Vegan: Community Ecology Package. R Package Version 2.5-4. 2019. Available online: https://CRAN.R-project.org/package=vegan (accessed on 3 June 2022).
  28. Hammer, Ø.; Harper, D.A.T.; Ryan, P.D. PAST: Paleontological Statistics Software Package for Education and Data Analysis. Palaeontol. Electron. 2001, 4, 9. [Google Scholar]
  29. Oliveros, J.C. Venny. An interactive Tool for Comparing Lists with Venn’s Diagrams 2007–2015. Available online: https://bioinfogp.cnb.csic.es/tools/venny/index.html (accessed on 3 June 2022).
  30. Louca, S.; Parfrey, L.W.; Doebeli, M. Decoupling function and taxonomy in the global ocean microbiome. Science 2016, 353, 1272–1277. [Google Scholar] [CrossRef]
  31. Changey, F.; Blaud, A.; Pando, A.; Herrmann, A.M.; Lerch, T.Z. Monitoring soil microbial communities using molecular tools: DNA extraction methods may offset long-term management effects. Eur. J. Soil Sci. 2021, 72, 1026–1041. [Google Scholar] [CrossRef]
  32. Dai, Z.; Webster, T.M.; Enders, A.; Hanley, K.L.; Xu, J.; Thies, J.E.; Lehmann, J. DNA extraction efficiency from soil as affected by pyrolysis temperature and extractable organic carbon of high-ash biochar. Soil Biol. Biochem. 2017, 115, 129–136. [Google Scholar] [CrossRef]
Figure 1. Venn diagram showing the number of shared OTUs between the two DNA extraction kits (MN = Machery Nagel DNA extraction kit; MO= Mobio DNA extraction kit). Shared OTUs account for 84.7% of retrieved sequences while 7.98% and 7.30% were exclusively retrieved with MO and MN DNA extraction kits, respectively.
Applmicrobiol 02 00038 g001
Figure 2. (a) Bacterial alpha diversity. Alpha diversity of the bacterial communities retrieved using the two different extraction kits (MN = Machery Nagel DNA extraction kit; MO= Mobio DNA extraction kit) by means of observed Operational Taxonomic Units (OTUs), and Chao1, ACE, Shannon, Simpson, and InvSimpson indexes. (b) Ordination plots (NMDS, Stress: 0.2012013) showing beta diversity of bacterial communities. The two bacterial communities are significantly affected by the DNA Extraction kits (p ≤ 0.025, Permanova; Bray–Curtis).
Applmicrobiol 02 00038 g002
Figure 3. Taxonomic distribution, at phylum-level (* Phylum that display statistically significant differences, Mann–Whitney pairwise comparison; Bonferroni corrected; MN = Machery Nagel DNA extraction kit; MO = Mobio DNA extraction kit).
Applmicrobiol 02 00038 g003
Figure 4. Taxonomic distribution, at phylum-level (MN = Machery Nagel DNA extraction kit; MO = Mobio DNA extraction kit).
Applmicrobiol 02 00038 g004
Publisher’s Note: MDPI stays neutral with regard to jurisdictional claims in published maps and institutional affiliations.

