Article

SARS-CoV-2 Viroporins: A Multi-Omics Insight from Nucleotides to Amino Acids

1
MedInsights, 6 rue de l’église, 02810 Veuilly la Poterie, France
2
Université de Paris, 85 boulevard Saint-Germain, 75006 Paris, France
*
Author to whom correspondence should be addressed.
These authors contributed equally to this work.
Appl. Microbiol. 2022, 2(3), 572-593; https://doi.org/10.3390/applmicrobiol2030045
Submission received: 8 July 2022 / Revised: 4 August 2022 / Accepted: 9 August 2022 / Published: 12 August 2022

Abstract

:
COVID-19 is caused by SARS-CoV-2 which has so far affected more than 500 million people worldwide and killed over 6 million as of 1 May 2022. The approved emergency-use vaccines were lifesaving in such a devastating pandemic. Inflammation-related pathways have been well documented to be upregulated in the case of SARS-CoV-2 in rodents, non-human primates and human samples. We reanalysed a previously published dataset to understand if certain molecular components of inflammation could be higher in infected samples. Mechanistically, viroporins are important players in the life cycle of SARS-CoV-2 and are primary to its pathogenesis. We studied the two prominent viroporins of SARS-CoV-2 (i) Orf3a and (ii) envelope (E) protein from a sequence and structural point of view. Orf3a is a cation-selective viral ion channel which has been shown to disrupt the endosomal pathways. E protein is one of the most conserved proteins among the SARS-CoV proteome which affects the ERGIC-related pathways. The aqueous medium through the viroporins mediates the non-selective translocation of cations, affecting ionic homeostasis in the host cellular compartments. We hypothesize a possible mechanistic approach whereby the ionic imbalance caused by viroporin action could potentially be one of the major pathogenic drivers leading to the increased inflammatory response in the host cell. Our results shed light into the transcriptomic, genomic and structural proteomics aspects of widely studied SARS-CoV-2 viroporins, which can be potentially leveraged for the development of antiviral therapeutics.

1. Introduction

COVID-19 (Coronavirus Disease 2019) is a severe acute respiratory syndrome (SARS) caused by a novel pathogenic β-coronaviral strain, SARS-CoV-2 which has affected millions all over the world. Vaccines have been developed using various technologies which have been approved by the FDA such as ChAdOx1 nCoV-19 (AstraZeneca) [1], mRNA-1273 (Moderna) [2], BNT162b2 (Pfizer) [3,4], Janssen Ad26.COV2.S (Janssen–Cilag International NV) [5], inactivated vaccines (Vero Cell) (Sinopharm and Sinovac Life Sciences) [6,7] along with several other lead candidates in line. These vaccines are either whole inactivated viruses or have overlapping targets and origins which have been quite effective in mitigating the pandemic. SARS-CoV-2 has a genome encoding 28 proteins which play important roles in different stages of viral pathogenesis [8,9,10,11]. The mRNA (Pfizer, Moderna), adenoviral vector-based (AstraZeneca, Janssen) and inactivated (Sinovac, Sinopharm) vaccines use epitopes from the spike protein to generate an immunogenic response in the body, thus creating an immunogenic memory. However, since spike protein is very much prone to acquiring new mutations [12,13,14], these vaccines could lose their efficacies with the evolving viral genome (Center for Disease Control and Prevention). The emergence of numerous variants along with their sub-lineages of SARS-CoV-2 has been observed and is continuously being monitored (GISAID, W.H.O.). All of these variants have a heavy mutational load on the spike protein [15,16,17], followed by the nucleocapsid (N) protein [15,18,19] and the RdRp [15,20,21,22]. As a result, the cellular events involved in the viral pathogenesis, which are more conserved phylogenetically, become important. Ion channelling activity is one such feature which encompasses viroporins. These viroporins’ counterbalance host cellular responses range from opposite directional ion flow to downstream disruptions of the host cell signalling pathways [23,24,25]. The ion channelling activity of SARS-CoV-2 is prominently maintained by two proteins: (i) E protein [13,25] and (ii) Orf3a protein [26,27]. The structure of the pentameric E protein from SARS-CoV-2 has been elucidated by solid-state NMR (PDB id: 7K3G) [26] and homology modelling [13] which gives insights into its structure-function relationship and selectivity towards cations [28]. Cryo-EM microscopy has given us insights into the dimeric structure of Orf3a (PDB id: 7KJR) which has two well-defined aqueous channels fit for cation-selective channelling [29]. The ion channelling mechanism of SARS-CoV-2 viroporins potentially leads to ionic imbalance and pH change in subcellular compartments of the infected host cells causing membrane disruption and intracellular malfunction. The E protein localises in the ERGIC membrane [27,30] while Orf3a localises primarily in the endosomal-lysosomal membranes of the human cellular host [31,32]. Disruption of the ERGIC membrane affects protein translocation and processing of the host cell, causing ER stress [33] while endosomal-lysosomal membrane rupture leads to a total breakdown of host trafficking machinery [23,32]. Ionic imbalance and pH change [34] by the viroporins are important for the release of the virion particles as well. Inflammatory responses in the host cell leading to ARDS could also be attributed to ionic imbalances [35]. The viroporins of SARS-CoV-2 have been shown to induce inflammatory responses via the TLR pathway for E protein [36] and NLRP3 inflammasome activation for Orf3a [37,38].
SARS-CoV-2 infection led to a wide spectrum of inflammatory events and responses which are as follows: (i) severe pneumonia, (ii) eosinopenia, (iii) severe lymphopenia, (iv) lung tissue damage, (v) cytokine storm leading to acute respiratory distress syndrome (ARDS), and ultimately multiorgan failure [39]. Pro-inflammatory cytokines have been widely analysed from COVID-19 infected patients which have been identified as the precursor to this unforeseen severity and pathogenicity of SARS-CoV-2 [40,41,42]. We found significant upregulation in immunomodulatory genes such as CD40, IFNL1, IFNL2, IFNL3, IL12A, IL33, IL6 and NFkB1 after analysing the RNA sequencing dataset from Katsura et al., 2020 [43], through our pipeline. Cellular functions such as the defence response to the virus, regulation of cytokine production, response to IFN-γ and regulation of NFκB signalling were implicated in ontology analysis. Mutations in pore-forming regions of the viroporins might lead to loss or gain in the function of the ion channel partially or totally along the course of the evolution of the viruses. However, the E protein and Orf3a exhibit a high degree of sequence identity between SARS-CoV-2 and its variants. We calculated the position-specific frequency of all the residues of Orf3a and E protein using big data analysis to comment on the conservation of the sequences across the SARS-CoV-2 variants. The amino acid changes were identified and aligned and their homology models were structurally superimposed on each other. We inserted the viroporins (E and Orf3a) in organelle-specific membrane mimics which allow solute and solvent movement and performed molecular dynamics simulation studies to understand their mechanism of action. Indeed, these cellular functions could be directly or indirectly affected by ionic imbalances in the cell, mediated by the viroporins Orf3a and E protein.

2. Materials and Methods

2.1. Transcriptomic Analysis

Transcriptomic data were reanalysed from the following source: Katsura et al., 2020 Cell Stem Cell [43]. The data are derived from whole genome RNA sequencing from a modular alveolo-sphere culture system of human alveolar type 2 cells/pneumocytes derived from primary lung tissue [43]. Data were downloaded from Gene Expression Omnibus library (ID: GSE152586) and pre-processing of the fastq files was performed. Details of data extraction and experimental procedures are available in the original publication: Katsura et al., 2020 Cell Stem Cell [43]. The DESeq2 package in R BioConductor (http://www.bioconductor.org/packages/release/bioc/html/DESeq2.html, accessed on 3 May 2022) was used to analyse the data. The normalised data were used for visualisation and differential analysis of the count data [44]. The DESeq2 data class consists of a count matrix with rows corresponding to genes and columns denoting experimental samples (control and COVID-19). For dimensional reduction and outlier identification, we performed a principal component analysis (PCA) on the DESeq2 data class of count reads. The details of the DESeq2 pipeline are discussed in detail in Love et al., 2014 Genome Biology [44]. Briefly, DESeq2 package models the data counts on the count matrix using a Gamma–Poisson distribution with mean (normalised concentration of cDNA fragments from the gene in a sample). The size factors are determined by the median-of-ratios method. For each gene, a generalised linear model (GLM), which returns overall expression strength of the gene, log2 of the fold change (LFC) between the two groups compared. The p values of comparison between control and infected samples are adjusted for multiple testing using the Benjamini and Hochberg procedure.
To identify the processes encoded by the upregulated genes, we used the publicly available protocol in Metascape (www.metascape.org/; accessed on 3 May 2022 [45]). We annotated the functions encoded by the genes using the following gene ontology enrichment: biological processes, cellular components, molecular components, KEGG pathway and Reactome pathways. Metascape combines functional enrichment, interactome analysis, gene annotation, and membership search to leverage over 40 independent knowledge bases. The minimum overlap was kept at 3, the p-value cut-off at 0.01 and the minimum enrichment was kept at 1.5. The network type was set at full network, network edges defined by confidence of the highest threshold (90%).

2.2. Position-Specific Amino Acid Residue Frequency Calculation

Complete protein sequences were retrieved from NIH source data openly available (NCBI SARS-CoV-2 variant data packages; SARS-CoV-2 Resources—NCBI (https://www.ncbi.nlm.nih.gov/, accessed on 3 May 2022) and NCBI Virus; NCBI Virus (https://www.ncbi.nlm.nih.gov/, accessed on 3 May 2022) in the fasta format for different SARS-CoV-2 variants. Sequences for the whole proteome from each of the variants were extracted, followed by separating the reading frames into Orf3a and E protein. Once the respective protein sequences for each variant were identified, we used the median length of the sequences as a selection filter. Any reported sequence lesser and greater than the median of the length of all proteins were discarded (incomplete or truncated sequences were hence excluded from the analysis). Indeed, for the proteins in each variant, we computed the following metric:
freq(Length protein < Median) × freq(Length protein > Median), and the results were always less than 10−5.
This cut-off resulted in lower probability of having truncated and deleted sequences in our analysis. Using the refined list of amino acid sequences, we built a count matrix for each amino acid at each position for Orf3a and E protein for each variant. Using the count matrix, the positional frequency of each amino acid was computed and the amino acid with the highest frequency at each position was considered as the consensus sequence for the variant. The mutational frequency was calculated from the positional amino acid frequency using the following:
Mutational frequency = 1 − positional frequency
The frequency in this calculation refers to the intra-variant frequency for each protein. All calculations were performed using custom-made programs in Python. The data are represented as a heatmap across the different variants of SARS-CoV-2 for the positional intra-variant frequency and as a stacked bar plot for the calculated mutational frequency for each amino acid position.

2.3. Multiple Sequence Alignment

Consensus amino acid sequences of Orf3a and E protein were computed across the variants Q lineage of Alpha (Q.3), Beta (B.1.351), Gamma (P.1), Delta (B.1.617.2), AY lineage (AY.103) and Omicron (B.1.1.529). We aligned the variant-specific mutation-containing sequences with their references (Orf3a: NCBI Reference Sequence: YP_009724391.1; E protein: NCBI Reference Sequence: YP_009724392.1) in the online alignment tool Clustal Omega (62) and was visualised with Jalview (www.jalview.org, accessed on 3 May 2022).

2.4. Homology Modelling of the Orf3a Protein and E Protein

The structure of the Orf3a protein of SARS-CoV-2 has been elucidated using cryo-EM microscopy and determined as a dimeric protein (PDB id: 7KJR) [29]. This structure has been used as a template for structure-based homology modelling of variant-specific Orf3a structures. Pentameric E protein structure has been elucidated using solid-state NMR from SARS-CoV-2 (PDB-id: 7K3G) [26] which has been templated to generate refined structural models for further analysis.
All the homology modelling procedures have been performed using MODELLER [46] and SWISS-MODEL [47]. Model refinement and further structural fine-tuning of unreliable structural regions were performed using the GalaxyWeB server [48]. The structures obtained were validated by scores obtained from the MolProbity [49,50]. The structures were chosen by comparing predominantly the different parameters such as percentage of Ramachandran favoured and unfavoured residues, percentage of favoured and unfavoured rotamers, Mol-Probity score, and Clash Score, validating the quality of the modelled structures.

2.5. Generation of the Protein–Membrane System

The transmembrane region of the proteins: Orf3a and envelope (E) protein, was extracted and used for insertion in respective membrane mimics depending on their cellular localization. Orf3a from SARS-CoV-2 was inserted into an endosome mimicking membrane. The E protein was inserted into a membrane similar to the ERGIC. Asymmetric lipid compositions were maintained in the endosome and ERGIC mimicking systems. All the membrane insertion processes were performed in the CHARMM-GUI web server [51,52] similar to our previous study [13]. The pore water of each of these channel proteins was removed while preparing the protein–membrane systems in CHARMM-GUI. The lipid compositions of each system corresponding to their inserted proteins are listed as follows in Table 1:

2.6. Molecular Dynamics Simulations Using NAMD and VMD

The protein membrane systems were solvated using a 12 Å thick patch of TIP3P [53] waters at both sides of the protein bilayer complex along the z-axis, and a uniform hexagonal area was maintained in the xy plane. The K+ ion was added to the solvated system as required to mimic 0.15 M KCl which is similar to our physiological concentration of K+ ion. The structural models of proteins and lipids were presented using the CHARMM36 force field parameters [54,55] and NAMD 2.12 [56,57] was used to run the molecular dynamics (MD) simulations. Firstly, the energy of each system was minimised and then equilibrated using the NVT ensemble for 40 ps. The integration time step was kept at 1 fs with harmonic restraints of 10 kcal mol−1 Å−2 on the protein atoms and 5 kcal mol−1 Å−2 on the lipid headgroups. These are the first two steps of minimization and initial equilibration of the simulation system. Several cycles of NPT equilibration (four or more) were carried out after the first two steps with reducing force constants in each cycle to relax the restraints on the protein–membrane simulation system. The entire energy minimization and equilibration steps add up to around 2.25 ns for each simulation run. The minimised and equilibrated protein–membrane system was then simulated for 5 ns using an integrating time step of 2 fs, constraining all H-containing bonds by the SHAKE algorithm [58]. The total sampling time of the trajectories altogether added to ~20 ns. Langevin dynamics was used in all the simulations to keep the temperature constant at 303 K with a damping coefficient of 1 ps−1, and the Langevin piston method was used in NPT ensembles to keep the pressure constant at 1 atm with a coupling constant of τP = 0.5 ps [59]. In all these simulations, short-range nonbonded interactions were switched off between 10 and 12 Å. The Particle Mesh Ewald method [60] was employed with a grid size of 1 Å for the estimation of long-range electrostatic interactions. The total energy of the simulation system, number of H-bonds, RMSD, RMSF and solvent accessible surface area (SASA) of specific pore-forming residues were analysed with respect to time steps as obtained from the results of the NAMD simulation in VMD [61] interface and snapshots of the timesteps were represented and visualised using Chimera 1.10 [62].

2.7. Effect of Point Mutations Using ProtParam and SDM2

The physicochemical properties of the proteins such as theoretical pI and the overall average hydrophobicity were calculated using the ProtParam tool of the ExPasy server (https://web.expasy.org/docs/expasy_tools05.pdf, accessed on 3 May 2022) using the amino acid sequence as the input. Point mutations were introduced at five positions for the envelope protein and forty-one positions for the Orf3a, which are putatively important for the protein functionality. The positions of the amino acids in the E protein were selected as part of the channel forming region and the lipid anchoring region. For the Orf3a, we selected mutations in the constricted neck region, upper tunnel forming region, lower tunnel forming region and the lipid interacting region. We used the Side Directed Mutator (SDM2) online server [63] to assess the effects of the point mutations on the stability of the proteins. SDM2 predicts protein stability change upon incorporation of mutations in the protein sequence and estimates the ΔΔG value between the wild type and the mutant proteins’ free energy. The lower the difference in the free energy between the two states (ΔΔG), the less the stability of the mutant protein.

2.8. Statistical Analysis

For statistical comparisons, we have used Kolmogorov–Smirnov (KS) test for comparing the cumulative distributions and unpaired students’ t-test for comparison between different conditions. The p-values reported in this paper consider p < 0.05 to be statistically significant.

3. Results

3.1. Upregulated Genes in COVID Condition Reflect Cellular Processes Impacted by Ion Channelling Activity

We used whole genome RNA sequencing data [43] to explore genes upregulated in SARS-CoV-2 infection, and whether they could be impacted by changes in cellular ionic homeostasis. PCA analysis (Figure 1A) suggested that uninfected controls and SARS-CoV-2 infected samples were mutually orthogonal to each other, suggesting that gene expression levels were indeed due to the infection. The first component explained 53% of the observed variance in the expression patterns. We further looked into the proportion of upregulated and downregulated genes (Figure 1B,C) and found 563 significantly upregulated genes and 75 significantly downregulated genes. The log of fold change (LFC) after the DESEQ2 pipeline was set at a minimum of 2, and the adjusted p-value was set at 0.01. The top 50 upregulated and downregulated genes are shown in Supplementary Figure S1. PRKAA1 was upregulated in the infected samples, albeit it did not clear the threshold of LFC > 2 (Figure 1D) and interestingly, had been shown to regulate ion channelling activity of the host cell [64]. We also observed significant upregulation in immunomodulatory genes such as CD40, IFNL1, IFNL2, IFNL3, IL12A, IL33, IL6 and NFkB1 (Figure 1E). Among the downregulated genes were HSP90AB1, HSP90AA1 and HSP90B1 (Figure 1F). In our analysis, we focused on those genes only that could be impacted by or otherwise could impact cellular ion channelling and ionic concentration. In our analysis, 88% of the genes were upregulated while 12% were downregulated with our parameters (Figure 1G). In order to understand what cellular and molecular functions could be impacted by the upregulated genes, we constructed a gene network using Metascape (Figure 1H). The major functions implicated are defence response to the virus, immune response regulating signalling pathway, response to IFN-β, regulation of cytokine production, response to IFN-γ, lymphocyte activation, SARS-CoV-2 innate immunity evasion, and regulation of I-κB-kinase/NFκB signalling (Figure 1H). All these processes imply the active participation and activation of the host defence system in case of a viral infection. We also evaluated the functional significance of protein–protein interactions of the upregulated genes and found that the following functions were enriched: defence response to the virus, IFN-α/β signalling, cytokine signalling, post-translational protein phosphorylation, calcium signalling pathway-Gα(q) signalling, PI3K-Akt-mTOR signalling, exocytosis and complement cascades (Figure 1I). Indeed, a lot of these functionalities could be directly or indirectly affected by ionic imbalances in the cell. These observations provide strength to our hypothesis that ion channelling activity by viroporins is responsible for viral pathogenesis and host cell responses in SARS-CoV-2.

3.2. Intra-Variant Sequence Analysis of SARS-CoV-2 Viroporins, Orf3a and Envelope (E) Protein

We have developed a new analytical program to identify invariant sequences conserved among the currently sequenced genomes of SARS-CoV-2 in light of Orf3a and E protein (Figure 2A). We extracted the sequences of Orf3a and E proteins from the following variants, respectively: Alpha (B.1.1.7; Figure 2B; N = 105,187 and 105,169), Q lineage of Alpha (Q.3; Figure 2B; N = 5300 and 5293) Beta (B.1.351; Figure 2B; N = 3814 and 3209), Gamma (P.1; Figure 2B; N = 13,593 and 13,558), Delta (B.1.617.2; Figure 2B; N = 50,397 and 50,198), AY lineage of Delta (AY.103; Figure 2B; N = 48,918 in both the proteins), Omicron (B.1.1.529; Figure 2B; N = 468 in both the proteins) and BA lineage of Omicron (BA.1.1; Figure 2B; N = 167,839 in both the proteins). Sequences greater than or equal to the median length were used for creating the count matrix (Figure 2B). The count matrix generated for Orf3a intra-variant position-specific frequency for each amino acid showed certain positions to have lower frequencies compared to a stable score of 1 (Figure 2C). This fluctuation in position-specific frequencies was very low (range: 0–0.148), and hence could not be assigned as a stable mutation (Figure 2D). In order to ascertain the stability of mutations observed, we calculated the consensus sequences for Orf3a and E protein for each variant. Additionally, a similar count matrix generated for E protein intra-variant position-specific frequency also showed lower frequencies in certain positions compared to a stable score of 1 (Figure 2E). The fluctuation in position-specific frequencies was quite low (range: 0–0.064), much lower than its Orf3a counterpart (Figure 2F). The relative probability of observing a mutational event in the specific positions is highlighted by their frequencies. This estimation is performed on a large number of sequence datasets and provides a framework of statistical estimates of the mutations observed in a position-specific manner.
We computed the position-specific residue frequency and observed the position S26L of Orf3a in B.1.617.2 (Delta) and T9I of E protein in B.1.1.529 (Omicron) and BA.1.1 (BA lineage of Omicron), to have relatively higher scores (Figure 2D,F).

3.3. Structural Modelling and Analysis of Representative Mutations in Orf3a across SARS-CoV-2 Variants

In correlation to previous results, we have identified representative mutations across the Orf3a sequence specific for different SARS-CoV-2 variants (Figure 3A). All the variants except the Alpha have one or more random mutations. The structure of Orf3a dimer has been elucidated using Cryo-EM at 2.1 angstrom, which spans from 40th to 236th amino acid, in complex with human apolipoprotein A (PDB id: 7KJR). The dimeric structure of Orf3a was extracted from the pdb file which was used as the reference (Figure 3B) for homology modelling of the representative Orf3a structures across SARS-CoV-2 variants (Supplementary Figure S2). The refined Orf3a structures of the variants with the best parameters, i.e., Clash score, Molprobity score, Ramachandran outliers, and Rotamer outliers, were chosen for further analysis of structural overlap. The Orf3a reference structure was superimposed on modelled structures from Alpha (B.1.1.7; Supplementary Figure S2A; RMSD = 0.89; TM score = 0.953), Q lineage of Alpha (Q.3; Supplementary Figure S2B; RMSD = 1.14; TM score = 0.945) Beta (B.1.351; Supplementary Figure S2C; RMSD = 1.19; TM score = 0.942), Gamma (P.1; Supplementary Figure S2D; RMSD = 0.84; TM score = 0.954), Delta (B.1.617.2; Supplementary Figure S2E; RMSD = 0; TM score = 1), AY lineage of Delta (AY.103; Supplementary Figure S2F; RMSD = 1.10; TM score = 0.945), Omicron (B.1.1.529; Supplementary Figure S2G; RMSD = 0.90; TM score = 0.952) and BA lineage of Omicron (BA.1.1; Supplementary Figure S2H; RMSD = 0.96; TM score = 0.951). The reference structures are shown in orange and the variants are shown in cyan (Supplementary Figure S2). According to our previous result, the Alpha and BA sub-lineage of Omicron does not have any significant mutations. In other variants, the following representative mutations were analysed in the Orf3a dimer overlap across variants: Beta-Q57H (Figure 3C(i); RMSD = 1.19; TM score = 0.942), S171L (Figure 3C(ii); RMSD = 1.19; TM score = 0.942); AY lineage of Delta-P104S (Figure 3C(iii); RMSD = 1.10; TM score = 0.945); Omicron-L106F (Figure 3C(iv); RMSD = 0.90; TM score = 0.952), S165F (Figure 3C(v); RMSD = 0.90; TM score = 0.952). However, the mutations present in the Gamma (S253P) and Delta variant (S26L) of Orf3a are in positions not included in the cryo-EM reference structure (40–236) and thus could not be mapped. The TM–score matrix indicates that there is no major structural variability in Orf3a protein among the variants (Figure 3D).

3.4. Molecular Dynamics Simulation of the TM Region of Orf3a (40-125) from SARS-CoV-2 in Endosomal Membrane Mimicking System

The SARS-CoV-2 Orf3a dimeric protein structure has been determined using cryo-EM at 2.0 angstroms resolution (PDB id: 7KJR) [29]. The transmembrane region of the protein ranges from 40 to 125th residue of the protein. We performed membrane insertion of the truncated structure of Orf3a (40–125) using CHARMM-GUI. It comprises lipid components mimicking the human endosomal membrane (Table 1). Then a molecular dynamics simulation of 5 ns was performed using NAMD to understand the channelling activity of the upper and lower channels of the protein (Supplementary Movie S1). We observed the presence of the upper channel in the protein–membrane system (Figure 4A black dotted circle). The water dynamics were observed at regular intervals of 0.5 ns for 2 ns from the initial timestep starting at 0 ns (Figure 4B(i)), 0.5 ns (Figure 4B(ii)), 1 ns (Figure 4B(iii)), 1.5 ns (Figure 4B(iv)), and 2 ns (Figure 4B(v)). Similarly, the lower channel (Figure 4C-black dotted circle) was also observed at similar timesteps (Figure 4D(i–v)). We calculated the number of H-bonds (Figure 4E), RMSD (Figure 4F), total energy (Figure 4G), and RMSF (Figure 4H) for 5 ns of the simulation. The RMSD remained below 2.5 angstroms ((Figure 4F), indicating that the protein–membrane system has low structural variability. In addition, the total energy of the system remains largely unchanged at −5.7 × 10⁴ kcal/mol (Figure 4G) throughout the time period of the simulation.

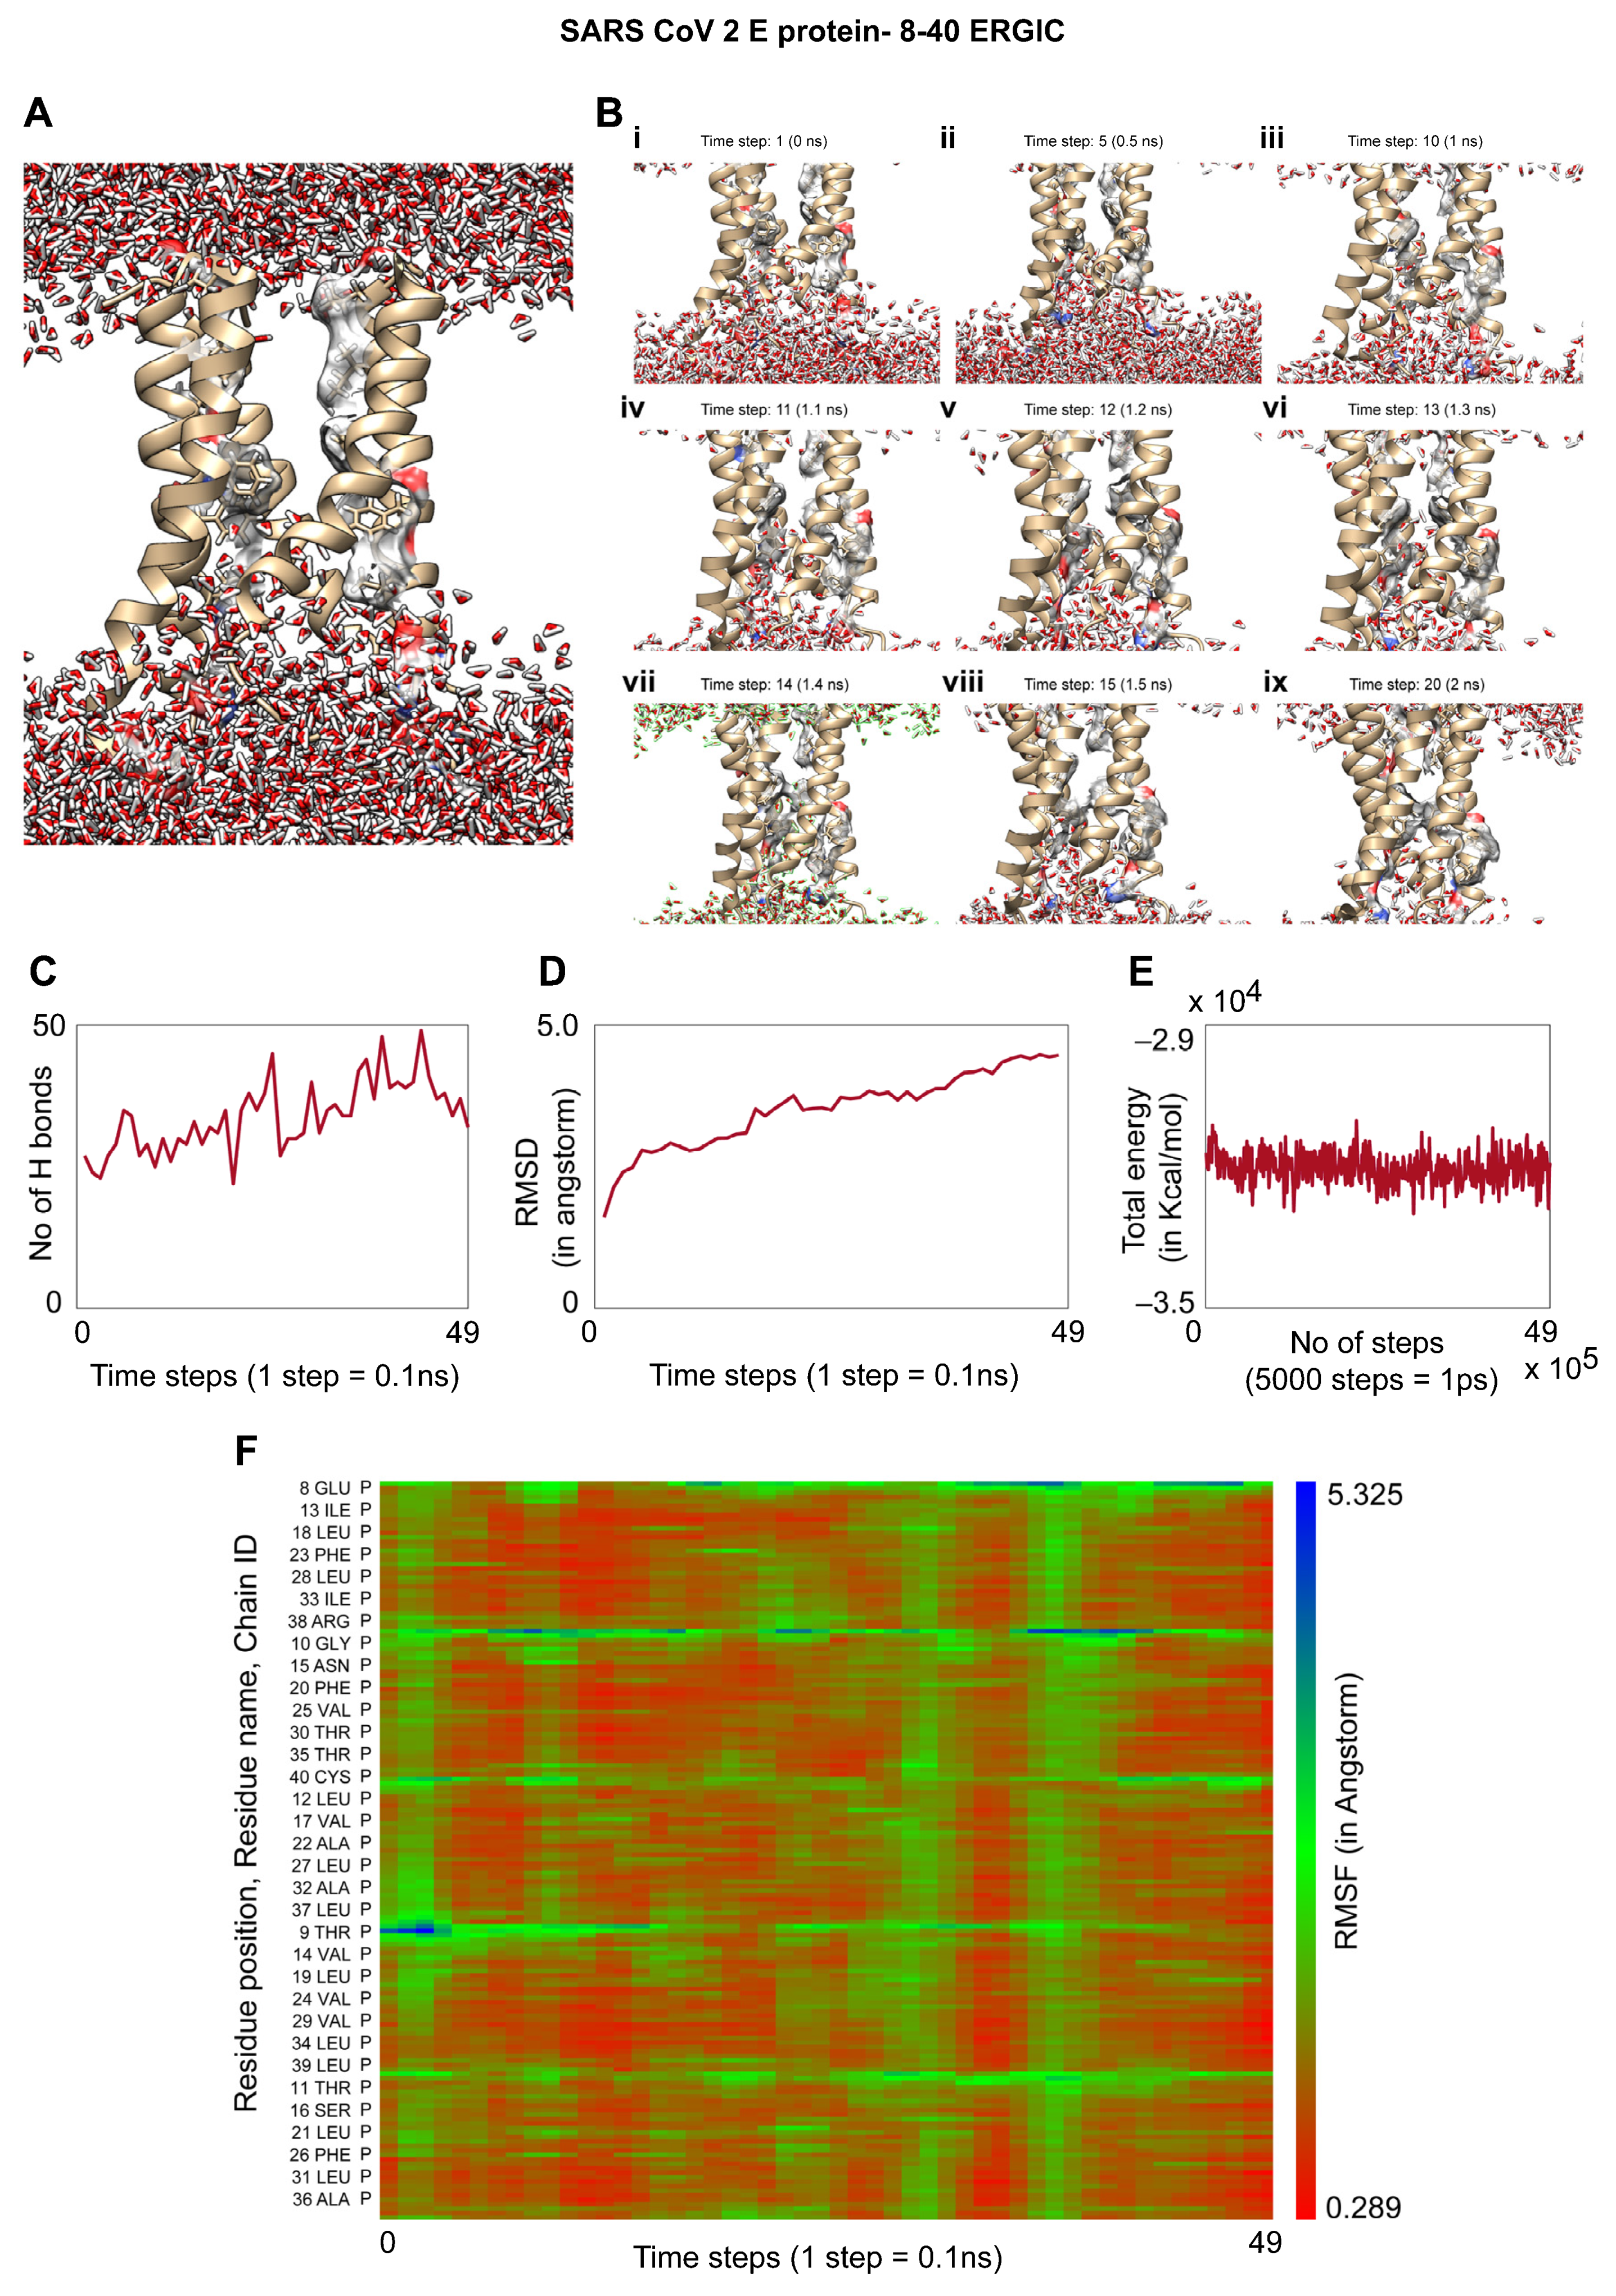
3.5. Molecular Dynamics of the TM Region of SARS-CoV-2 E Protein in an ERGIC Membrane Mimic Shows Water Movement

The pentameric E protein from the SARS-CoV-2 has been modelled taking its solid-state NMR structure as the template (PDB id: 7K3G) [26], whose viroporin activity through the single channel formed by its TM region (8–40) has been analysed in a previous study [13] (Figure 5A). The protein–membrane complex was equilibrated energetically followed by 5 ns of MD simulation to analyse the continuous water channel formation through the proposed pore (Supplementary Movie S2). The water dynamics was observed at several intervals for 2 ns from the initial timestep starting at 0 ns (Figure 5B(i)), 0.5 ns (Figure 5B(ii)), 1 ns (Figure 5B(iii)), 1.1 ns (Figure 5B(iv)), 1.2 ns (Figure 5B(v)), 1.3 ns (Figure 5B(vi)), 1.4 ns (Figure 5B(vii)), 1.5 ns (Figure 5B(viii)), and 2 ns (Figure 5B(ix)). We observed that from 1 ns to 1.5 ns, the water molecules reach the proposed F26 bottleneck region [13] inside the pore of the E protein (Figure 5B(iii–viii)). We calculated the number of H-bonds (Figure 5C), RMSD (Figure 5D), total energy (Figure 5E), and RMSF (Figure 5F) for 5 ns of the simulation. The RMSD remained well below 5 angstroms (Figure 5D), indicating that the protein–membrane system has high structural stability. In addition, the total energy of the system remains relatively unfluctuating around −3.2 × 10⁴ kcal/mol (Figure 5E) throughout the time period of the simulation.

3.6. Effects of Mutations on Different Regions of the E Protein and Orf3a

In order to predict the incorporation of specific mutations that might destabilize these structural interactions in E protein and Orf3a, and serve as potential targets for antiviral therapeutics, we analysed different point mutations in these proteins using the SDM2 server. The mutations incorporated are shown in Table 2. The mutations in E protein were introduced in (i) the channel forming region of the protein and (ii) the lipid anchoring part of the protein which might render loss of its function. On the other hand, mutations in Orf3a were introduced in the (i) constricted neck region, (ii) upper tunnel, (iii) lower tunnel, and (iv) lipid anchoring region, which could disrupt its functionality. A negative ΔΔG value indicates a destabilizing mutation which is expected to compromise the protein structurally and functionally. For the E protein, we observed that the L37A mutant has a ΔΔG of −0.36. On the other hand, for the Orf3a, several such positions were found. For instance, ΔΔG values for the mutants are: C81A, −0.78; L95A, −2.68; Y109A, −1.07; D142A, −0.21; L65A, −0.4; L71A, −3.22; Y141A, −0.51; Y189A, −0.94; R126A, −1.71, and D142A, −0.21. We replaced the amino acids with alanine (A) since we did not intend to impact the theoretical pI and average hydrophobic score drastically (Table 2). These putative change-in-function mutations might pave the way toward the development of antiviral therapeutics.

4. Discussion

We performed a systematic study on COVID-19 pathogenesis, using transcriptomic, genomic and structural bioinformatics approaches where we hypothesize that the viroporins of SARS-CoV-2 might induce inflammatory responses during diseased conditions via multiple signalling pathways (Figure 6—TLR pathway, pro-inflammatory cytokine pathway, NFкB regulatory pathway, NLRP3 inflammasome activation and others). Reanalysis of transcriptomic data from SARS-CoV-2 infected samples showed an upregulation in inflammatory response mediated by several interleukins and interferons [65] which are probably regulated by NFкB [66]. The increase in CD40 [67], IL-6 [68], IL-12 [42] and IL-33 [69] transcripts strongly correlate with similar expression patterns of differentially expressed genes in acute lung injury, ARDS and pulmonary fibrosis. NF-kB signalling has also been shown to be activated and induces inflammatory cytokines and chemokines, including IL-1b, IL-18, and IL-8 [70,71,72]. AMPK is a master regulator of a wide spectrum of ion channels, carrier proteins and symporter pumps [64], differential expression of which can impact their stimulatory and inhibitory effects [73]. Downregulation of ion channels is also known to be impacted by their interactions with Hsp proteins such as Kv7.4, a voltage-gated potassium channel [74]. Indeed, Hsp90, being a part of the protein folding machinery showed lower expression levels, probably due to disruption of the ERGIC and endosomal compartment. Ionic imbalance in cells can promote the build-up of reactive oxygen species (ROS) in the mitochondria, leading to activation of NLRP3 [75].
Ion channelling activity is an important cellular event taking place in all organisms, from unicellular prokaryotes to multicellular eukaryotes such as humans. Human cellular organisation and mechanisms of varied physiological events are directly or indirectly influenced by ion channels, which are mostly specific for the type of ion it transports. Almost all families of viruses encode one or more ion channel proteins which integrate with the host membrane and regulate key viral life cycle events such as virion maturation, assembly and release. Viroporins oligomerize in the host membranes, leading to the formation of permeable hydrophilic pores [23,76], which alters cellular ionic homeostasis in hosts. It leads to membrane depolarization and disruption of organelle architecture via membrane remodelling events, alteration of Ca2+ homeostasis [77] and protein trafficking.
SARS-CoV-2 has acquired several mutation hotspots in the spike (S) protein across all its variants [78,79] which contributes to the increased pathogenicity of the variants [17]. However, there are several other important viral proteins that play decisive roles in the viral life cycle and have remained conserved across the variants. We performed large-scale sequence data analysis for the ion channelling viral proteins of SARS-CoV-2: Orf3a and envelope protein, where we calculated the position-specific frequency of each amino acid from sequences reported in the NCBI datasets for these two proteins. The positions harbouring the mutations reported from the analysis were either identical to the residue in the corresponding position of the reference sequence with lower frequency, or different residue with higher frequency. These changes are random mutations and cannot be concluded as significant, as the sample space of the number of sequences was quite low in some of the variants. The variants with the highest number of sequences (Alpha and BA lineage of Omicron—Figure 1B) did not show any major mutations in the proteins. Nevertheless, we aligned the sequences of the variants and specified the random mutations in the ion channel forming region of the proteins. All the mutant structures were structurally aligned with the reference structure (PDB id: 7KJR) which showed no significant structural variability in the channel-forming region. Afterwards, we looked into the membrane permeation and channel-forming mechanism of the Orf3a and E protein from SARS-CoV-2.
One of the most studied viroporins is the M2 channel of the influenza virus, which is essential for viral replication and homeostasis. The M2 channel allows K+ ion influx and disrupts Na+/K+ ionic homeostasis in the late endosomes. It also acts as a proton channel in the TGN (pH~6) which affects downstream protein trafficking machinery [80]. The NS4A channel of HCV localises on the mitochondrial membrane and disrupts mitochondrial architecture by causing an ionic imbalance in the organelle lumen [81]. Viroporins activate apoptosis through the mitochondrial pathway via the formation of apoptosome with pro-caspase 9 and apoptosis protease-activating factor-1 [82]. P7 viroporin of HCV is a gated proton channel which causes H+ efflux, resulting in IL-1β production [83]. The E protein of SARS-CoV-2 has been reported to rescue the growth of K+-uptake deficient bacteria thus supporting its K+ conductivity. Additionally, it acts as a proton channel and causes bacterial cell death due to increased membrane permeabilization [28].
However, the exact molecular mechanism of these ion channelling events needs further exploration from a structural point of view. Our results demonstrate salient structural features which might determine how the viroporin functions. Hydrophilic pore formation is one of the fundamental features of a viroporin [23]. We show the formation of hydrophilic pore via water channel formation which could imply the formation of ionic transfer mediums across the membranes. Such a passage medium through the upper and lower channels of dimeric Orf3a of SARS-CoV-2 is observed in human endosomal mimicking membranes. The endosome is an important structural organelle involved in a wide range of cellular functions. Water chain formation through the central pentameric pore of the envelope (E) protein up to the proposed bottleneck region defined the hydrophilic pathways through this viroporin of SARS-CoV-2 and is mimicked in human ERGIC membranes.
The E protein and Orf3a contain transmembrane domains and can be targeted for site-directed mutagenesis. For antiviral therapeutics, we have speculated one or more mutations in specific regions of the protein which might result in the loss of their activity. Site-directed mutagenesis of the residues such as LEU 37 in E protein could eliminate its membrane anchoring property, as observed from the ΔΔG values. In addition, mutations in the neck constriction (CYS 81, LEU 95, TYR 109) of Orf3a could potentially disrupt the initiation of water channel formation [29]. In the tunnel regions of the Orf3a (GLU 142, LEU 65, LEU 71, TYR 189), mutations can impact the ion channelling activity [29]. Additionally, in the lipid-bound part (ARG 126, GLU 142), mutations could disrupt membrane interactions. This information and understanding of SARS-CoV-2 viroporins from a systemic viewpoint could open new avenues in the development of therapeutic strategies.
The question remains, what impact do these viroporins impart at a physiological level? Indeed, our studies are in silico and have limitations of being non-experimental from an in vitro and in vivo standpoint. However, the impact of ionic imbalances in the cellular micro-environment as a result of viral infections and viroporins has been studied in great detail earlier. One immediate observation comes from the previous SARS strain, the SARS-CoV-1, which showed that E protein localised in the ERGIC membrane and facilitated the movement of Ca2+ ions into the cytosol [24]. On the other hand, the Orf3a localised at the endosome, Golgi apparatus and the plasma membrane transport K+ ions [75]. Tight regulation of cationic and anionic ion channels controls the ionic homeostasis in the airways, which can be correlated to complex pathological features in lung diseases [84]. Viroporins localised in the subcellular membranes of these lung airway epithelial cells are the primary cause of ionic imbalance and thus can be potential therapeutic targets against ARDS [85,86]. E protein-mediated Ca2+ and K+ leakage, and Orf3-mediated K+ efflux could be vital factors causing cellular ionic imbalance activating the NLRP3 inflammasome, since the activation of NLRP3 inflammasome directly correlates with the observed viroporin activity [75,87]. Our study on SARS-CoV-2 viroporins gives valuable information pertaining to their genomic similarities, their potential functions and cellular processes they could be impacting. We have shed light on the role of Orf3a and E proteins in SARS-CoV-2 pathogenesis. Further investigation along these lines can reveal potential therapeutic strategies against SARS-CoV-2.

Supplementary Materials

The following supporting information can be downloaded at: https://www.mdpi.com/article/10.3390/applmicrobiol2030045/s1, Figure S1: Top 50 significantly upregulated (dark green) and downregulated (dark red) which have adjusted p-value of <0.01 and LFC > 2; Figure S2: Superimposition of experimentally determined Orf3a structure (7KJR, in orange) with the corresponding homology model structures of Orf3a (in blue) for the variants: (A) Alpha, (B) Q lineage, (C) Beta, (D) Gamma, € Delta, (F) AY lineage, (G) Omicron and (H) BA lineage. Supplementary Movie S1: Molecular dynamics of TM region (40–125) of Orf3a from SARS-CoV-2 inserted into a late endosomal-lysosomal membrane mimic. Supplementary Movie S2: Molecular dynamics of TM region (8–40) of E protein from SARS-CoV-2 inserted into an ERGIC membrane mimic. The template of the modelled E protein is its NMR structure from SARS-CoV-2 (PDB id:7K3G).

Author Contributions

Conceptualization, S.S. and M.S.; methodology, S.S., M.S., V.H. and P.E.; software, M.S., V.H. and P.E.; validation, S.S., M.S. and V.H.; formal analysis, M.S., V.H. and P.E.; investigation, S.S., M.S., V.H. and P.E.; resources, S.S. and V.H.; data curation, S.S., M.S. and V.H.; writing—original draft preparation, S.S. and M.S.; writing—review and editing, S.S., M.S. and V.H.; visualization, S.S., M.S., V.H. and P.E.; supervision, S.S.; project administration, S.S., M.S. and V.H. All authors have read and agreed to the published version of the manuscript.

Funding

M.S., V.H. and S.S. are members of MedInsights. This research received no external funding. External agencies had no role in the idea and experimental design, model execution and evaluation, and drafting of figures and manuscripts.

Institutional Review Board Statement

Not applicable.

Informed Consent Statement

Not applicable.

Acknowledgments

We thank Léo Janin for help with the prediction of the ΔΔG values from the site-directed mutagenesis results.

Conflicts of Interest

Authors declare no competing interest. Only publicly available libraries, servers, and resources were employed for the entire study. All data in the main text or the Supplementary Materials are unconditionally available upon request. Any codes/pipelines designed are proprietary to Medinsights.

References

  1. Voysey, M.; Clemens, S.A.C.; Madhi, S.A.; Weckx, L.Y.; Folegatti, P.M.; Aley, P.K.; Angus, B.; Ballie, V.L.; Barnabas, S.L.; Bhorat, Q.E.; et al. Safety and efficacy of the ChAdOx1 nCoV-19 vaccine (AZD1222) against SARS-CoV-2: An interim analysis of four randomised controlled trials in Brazil, South Africa, and the UK. Lancet 2021, 397, 99–111. [Google Scholar] [CrossRef]
  2. Baden, L.R.; El Sahly, H.M.; Essink, B.; Kotloff, K.; Frey, S.; Novak, R.; Diemert, D.; Spector, S.A.; Rouphael, N.; Creech, C.B.; et al. Efficacy and Safety of the mRNA-1273 SARS-CoV-2 Vaccine. N. Engl. J. Med. 2021, 384, 403–416. [Google Scholar] [CrossRef] [PubMed]
  3. Polack, F.P.; Thomas, S.J.; Kitchin, N.; Absalon, J.; Gurtman, A.; Lockhart, S.; Perez, J.L.; Marc, G.P.; Moreira, E.D.; Zerbini, C.; et al. Safety and Efficacy of the BNT162b2 mRNA COVID-19 Vaccine. N. Engl. J. Med. 2020, 383, 2603–2615. [Google Scholar] [CrossRef] [PubMed]
  4. Haas, E.J.; Angulo, F.J.; McLaughlin, J.M.; Anis, E.; Singer, S.R.; Khan, F.; Brooks, N.; Smaja, M.; Mircus, G.; Pan, K.; et al. Impact and effectiveness of mRNA BNT162b2 vaccine against SARS-CoV-2 infections and COVID-19 cases, hospitalisations, and deaths following a nationwide vaccination campaign in Israel: An observational study using national surveillance data. Lancet 2021, 397, 1819–1829. [Google Scholar] [CrossRef]
  5. Sadoff, J.; Gray, G.; Vandebosch, A.; Cárdenas, V.; Shukarev, G.; Grinsztejn, B.; Goepfert, P.A.; Truyers, C.; Fennema, H.; Spiessens, B.; et al. Safety and Efficacy of Single-Dose Ad26.COV2.S Vaccine against COVID-19. N. Engl. J. Med. 2021, 384, 2187–2201. [Google Scholar] [CrossRef]
  6. Xia, S.; Duan, K.; Zhang, Y.; Zhao, D.; Zhang, H.; Xie, Z.; Li, X.; Peng, C.; Zhang, Y.; Zhang, W.; et al. Effect of an Inactivated Vaccine Against SARS-CoV-2 on Safety and Immunogenicity Outcomes: Interim Analysis of 2 Randomized Clinical Trials. JAMA 2020, 324, 951. [Google Scholar] [CrossRef] [PubMed]
  7. Zhang, Y.; Zeng, G.; Pan, H.; Li, C.; Hu, Y.; Chu, K.; Han, W.; Chen, Z.; Tang, R.; Yin, W.; et al. Safety, tolerability, and immunogenicity of an inactivated SARS-CoV-2 vaccine in healthy adults aged 18–59 years: A randomised, double-blind, placebo-controlled, phase 1/2 clinical trial. Lancet Infect. Dis. 2021, 21, 181–192. [Google Scholar] [CrossRef]
  8. Asghari, A.; Naseri, M.; Safari, H.; Saboory, E.; Parsamanesh, N. The Novel Insight of SARS-CoV-2 Molecular Biology and Pathogenesis and Therapeutic Options. DNA Cell Biol. 2020, 39, 1741–1753. [Google Scholar] [CrossRef] [PubMed]
  9. Cevik, M.; Kuppalli, K.; Kindrachuk, J.; Peiris, M. Virology, transmission, and pathogenesis of SARS-CoV-2. BMJ 2020, 371, m3862. [Google Scholar] [CrossRef]
  10. Redondo, N.; Zaldívar-López, S.; Garrido, J.J.; Montoya, M. SARS-CoV-2 Accessory Proteins in Viral Pathogenesis: Knowns and Unknowns. Front Immunol. 2021, 12, 708264. [Google Scholar] [CrossRef] [PubMed]
  11. Silvas, J.A.; Vasquez, D.M.; Park, J.G.; Chiem, K.; Allué-Guardia, A.; Garcia-Vilanova, A.; Platt, R.N.; Miorin, L.; Kehrer, T.; Cupic, A.; et al. Contribution of SARS-CoV-2 Accessory Proteins to Viral Pathogenicity in K18 Human ACE2 Transgenic Mice. J. Virol. 2021, 95, e0040221. [Google Scholar] [CrossRef] [PubMed]
  12. Koyama, T.; Platt, D.; Parida, L. Variant analysis of SARS-CoV-2 genomes. Bull. World Health Organ. 2020, 98, 495–504. [Google Scholar] [CrossRef]
  13. Sarkar, M.; Saha, S. Structural insight into the role of novel SARS-CoV-2 E protein: A potential target for vaccine development and other therapeutic strategies. PLoS ONE 2020, 15, e0237300. [Google Scholar] [CrossRef]
  14. Guruprasad, L. Human SARS CoV-2 spike protein mutations. Proteins 2021, 89, 569–576. [Google Scholar] [CrossRef] [PubMed]
  15. Thakur, S.; Sasi, S.; Pillai, S.G.; Nag, A.; Shukla, D.; Singhal, R.; Phalke, S.; Velu, G.S.K. SARS-CoV-2 Mutations and Their Impact on Diagnostics, Therapeutics and Vaccines. Front. Med. 2022, 9, 815389. [Google Scholar] [CrossRef]
  16. Jackson, C.B.; Zhang, L.; Farzan, M.; Choe, H. Functional importance of the D614G mutation in the SARS-CoV-2 spike protein. Biochem. Biophys. Res. Commun. 2021, 538, 108–115. [Google Scholar] [CrossRef] [PubMed]
  17. Harvey, W.T.; Carabelli, A.M.; Jackson, B.; Gupta, R.K.; Thomson, E.C.; Harrison, E.M.; Ludden, C.; Reeve, R.; Rambaut, A.; Peacock, S.J.; et al. SARS-CoV-2 variants, spike mutations and immune escape. Nat. Rev. Microbiol. 2021, 19, 409–424. [Google Scholar] [CrossRef] [PubMed]
  18. Wu, H.; Xing, N.; Meng, K.; Fu, B.; Xue, W.; Dong, P.; Tang, W.; Xiao, Y.; Liu, G.; Luo, H.; et al. Nucleocapsid mutations R203K/G204R increase the infectivity, fitness, and virulence of SARS-CoV-2. Cell Host Microbe 2021, 29, 1788–1801.e6. [Google Scholar] [CrossRef] [PubMed]
  19. Johnson, B.A.; Zhou, Y.; Lokugamage, K.G.; Vu, M.N.; Bopp, N.; Crocquet-Valdes, P.A.; Kalveram, B.; Schindewolf, C.; Liu, Y.; Scharton, D.; et al. Nucleocapsid Mutations in SARS-CoV-2 Augment Replication and Pathogenesis. Microbiology. 2021. Available online: http://biorxiv.org/lookup/doi/10.1101/2021.10.14.464390 (accessed on 3 May 2022).
  20. Ilmjärv, S.; Abdul, F.; Acosta-Gutiérrez, S.; Estarellas, C.; Galdadas, I.; Casimir, M.; Alessandrini, M.; Gervasio, F.L.; Krause, K.H. Concurrent mutations in RNA-dependent RNA polymerase and spike protein emerged as the epidemiologically most successful SARS-CoV-2 variant. Sci. Rep. 2021, 11, 13705. [Google Scholar] [CrossRef] [PubMed]
  21. Eskier, D.; Karakülah, G.; Suner, A.; Oktay, Y. RdRp mutations are associated with SARS-CoV-2 genome evolution. PeerJ 2020, 8, e9587. [Google Scholar] [CrossRef] [PubMed]
  22. Pachetti, M.; Marini, B.; Benedetti, F.; Giudici, F.; Mauro, E.; Storici, P.; Masciovecchio, C.; Angeletti, S.; Ciccozzi, M.; Gallo, R.C.; et al. Emerging SARS-CoV-2 mutation hot spots include a novel RNA-dependent-RNA polymerase variant. J. Transl. Med. 2020, 18, 179. [Google Scholar] [CrossRef] [PubMed]
  23. Nieva, J.L.; Madan, V.; Carrasco, L. Viroporins: Structure and biological functions. Nat. Rev. Microbiol. 2012, 10, 563–574. [Google Scholar] [CrossRef] [PubMed]
  24. Nieto-Torres, J.; Verdiá-Báguena, C.; Castaño-Rodriguez, C.; Aguilella, V.; Enjuanes, L. Relevance of Viroporin Ion Channel Activity on Viral Replication and Pathogenesis. Viruses 2015, 7, 3552–3573. [Google Scholar] [CrossRef]
  25. Li, J.Y.; Liao, C.H.; Wang, Q.; Tan, Y.J.; Luo, R.; Qiu, Y.; Ge, X.Y. The ORF6, ORF8 and nucleocapsid proteins of SARS-CoV-2 inhibit type I interferon signaling pathway. Virus Res. 2020, 286, 198074. [Google Scholar] [CrossRef] [PubMed]
  26. Mandala, V.S.; McKay, M.J.; Shcherbakov, A.A.; Dregni, A.J.; Kolocouris, A.; Hong, M. Structure and drug binding of the SARS-CoV-2 envelope protein transmembrane domain in lipid bilayers. Nat. Struct. Mol. Biol. 2020, 27, 1202–1208. [Google Scholar] [CrossRef]
  27. Mariano, G.; Farthing, R.J.; Lale-Farjat, S.L.M.; Bergeron, J.R.C. Structural Characterization of SARS-CoV-2: Where We Are, and Where We Need to Be. Front. Mol. Biosci. 2020, 7, 605236. [Google Scholar] [CrossRef] [PubMed]
  28. Singh Tomar, P.P.; Arkin, I.T. SARS-CoV-2 E protein is a potential ion channel that can be inhibited by Gliclazide and Memantine. Biochem. Biophys. Res. Commun. 2020, 530, 10–14. [Google Scholar] [CrossRef] [PubMed]
  29. Kern, D.M.; Sorum, B.; Mali, S.S.; Hoel, C.M.; Sridharan, S.; Remis, J.P.; Toso, D.B.; Kotecha, A.; Bautista, D.M.; Brohawn, S.G. Cryo-EM structure of SARS-CoV-2 ORF3a in lipid nanodiscs. Nat. Struct. Mol. Biol. 2021, 28, 573–582. [Google Scholar] [CrossRef] [PubMed]
  30. Fong, P. SARS-CoV-2: Pushing the E(nvelope). J. Physiol. 2021, 599, 2785–2786. [Google Scholar] [CrossRef] [PubMed]
  31. Zhang, J.; Cruz-cosme, R.; Zhuang, M.W.; Liu, D.; Liu, Y.; Teng, S.; Wang, P.H.; Tang, Q. A systemic and molecular study of subcellular localization of SARS-CoV-2 proteins. Signal Transduct. Target. Ther. 2020, 5, 269. [Google Scholar] [CrossRef] [PubMed]
  32. Miao, G.; Zhao, H.; Li, Y.; Ji, M.; Chen, Y.; Shi, Y.; Bi, Y.; Wang, P.; Zhang, H. ORF3a of the COVID-19 virus SARS-CoV-2 blocks HOPS complex-mediated assembly of the SNARE complex required for autolysosome formation. Dev. Cell 2021, 56, 427–442.e5. [Google Scholar] [CrossRef] [PubMed]
  33. Lim, Y.; Ng, Y.; Tam, J.; Liu, D. Human Coronaviruses: A Review of Virus–Host Interactions. Diseases 2016, 4, 26. [Google Scholar] [CrossRef] [PubMed]
  34. Cabrera-Garcia, D.; Bekdash, R.; Abbott, G.W.; Yazawa, M.; Harrison, N.L. The envelope protein of SARS-CoV-2 increases intra-Golgi pH and forms a cation channel that is regulated by pH. J. Physiol. 2021, 599, 2851–2868. [Google Scholar] [CrossRef]
  35. Fan, E.; Beitler, J.R.; Brochard, L.; Calfee, C.S.; Ferguson, N.D.; Slutsky, A.S.; Brodie, D. COVID-19-associated acute respiratory distress syndrome: Is a different approach to management warranted? Lancet Respir. Med. 2020, 8, 816–821. [Google Scholar] [CrossRef]
  36. Zheng, M.; Karki, R.; Williams, E.P.; Yang, D.; Fitzpatrick, E.; Vogel, P.; Jonsson, C.B.; Kanneganti, T.D. TLR2 senses the SARS-CoV-2 envelope protein to produce inflammatory cytokines. Nat. Immunol. 2021, 22, 829–838. [Google Scholar] [CrossRef] [PubMed]
  37. Xu, H.; Akinyemi, I.A.; Chitre, S.A.; Loeb, J.C.; Lednicky, J.A.; McIntosh, M.T.; Bhaduri-McIntosh, S. SARS-CoV-2 viroporin encoded by ORF3a triggers the NLRP3 inflammatory pathway. Virology 2022, 568, 13–22. [Google Scholar] [CrossRef] [PubMed]
  38. Shah, A. Novel Coronavirus-Induced NLRP3 Inflammasome Activation: A Potential Drug Target in the Treatment of COVID-19. Front. Immunol. 2020, 11, 1021. [Google Scholar] [CrossRef] [PubMed]
  39. Azkur, A.K.; Akdis, M.; Azkur, D.; Sokolowska, M.; Veen, W.; Brüggen, M.; O’Mahony, L.; Gao, Y.; Nadeau, K.; Akdis, C.A. Immune response to SARS-CoV-2 and mechanisms of immunopathological changes in COVID-19. Allergy 2020, 75, 1564–1581. [Google Scholar] [CrossRef]
  40. Shah, V.K.; Firmal, P.; Alam, A.; Ganguly, D.; Chattopadhyay, S. Overview of Immune Response During SARS-CoV-2 Infection: Lessons From the Past. Front. Immunol. 2020, 11, 1949. [Google Scholar] [CrossRef]
  41. García, L.F. Immune Response, Inflammation, and the Clinical Spectrum of COVID-19. Front. Immunol. 2020, 11, 1441. [Google Scholar] [CrossRef]
  42. Costela-Ruiz, V.J.; Illescas-Montes, R.; Puerta-Puerta, J.M.; Ruiz, C.; Melguizo-Rodríguez, L. SARS-CoV-2 infection: The role of cytokines in COVID-19 disease. Cytokine Growth Factor Rev. 2020, 54, 62–75. [Google Scholar] [CrossRef] [PubMed]
  43. Katsura, H.; Sontake, V.; Tata, A.; Kobayashi, Y.; Edwards, C.E.; Heaton, B.E.; Konkimalla, A.; Asakura, T.; Mikami, Y.; Fritch, E.J.; et al. Human Lung Stem Cell-Based Alveolospheres Provide Insights into SARS-CoV-2-Mediated Interferon Responses and Pneumocyte Dysfunction. Cell Stem. Cell 2020, 27, 890–904.e8. [Google Scholar] [CrossRef]
  44. Love, M.I.; Huber, W.; Anders, S. Moderated estimation of fold change and dispersion for RNA-seq data with DESeq2. Genome Biol. 2014, 15, 550. [Google Scholar] [CrossRef] [PubMed]
  45. Zhou, Y.; Zhou, B.; Pache, L.; Chang, M.; Khodabakhshi, A.H.; Tanaseichuk, O.; Benner, C.; Chanda, S.K. Metascape provides a biologist-oriented resource for the analysis of systems-level datasets. Nat. Commun. 2019, 10, 1523. [Google Scholar] [CrossRef] [PubMed]
  46. Baxevanis, A.D. Current Protocols in Bioinformatics; John Wiley and Sons: New York, NY, USA, 2004; Available online: http://onlinelibrary.wiley.com/book/10.1002/0471250953 (accessed on 26 September 2021).
  47. Waterhouse, A.; Bertoni, M.; Bienert, S.; Studer, G.; Tauriello, G.; Gumienny, R.; Heer, F.T.; de Beer, T.A.P.; Rempfer, C.; Bordoli, L.; et al. SWISS-MODEL: Homology modelling of protein structures and complexes. Nucleic Acids Res. 2018, 46, W296–W303. [Google Scholar] [CrossRef]
  48. Ko, J.; Park, H.; Heo, L.; Seok, C. GalaxyWEB server for protein structure prediction and refinement. Nucleic Acids Res. 2012, 40, W294–W297. [Google Scholar] [CrossRef]
  49. Davis, I.W.; Leaver-Fay, A.; Chen, V.B.; Block, J.N.; Kapral, G.J.; Wang, X.; Murray, L.W.; Arendall, W.B., III; Snoeyink, J.; Richardson, J.S.; et al. MolProbity: All-atom contacts and structure validation for proteins and nucleic acids. Nucleic Acids Res. 2007, 35, W375–W383. [Google Scholar] [CrossRef]
  50. Williams, C.J.; Headd, J.J.; Moriarty, N.W.; Prisant, M.G.; Videau, L.L.; Deis, L.N.; Verma, V.; Keedy, D.A.; Hintze, B.J.; Chen, V.B.; et al. MolProbity: More and better reference data for improved all-atom structure validation. Protein Sci. 2018, 27, 293–315. [Google Scholar] [CrossRef]
  51. Jo, S.; Kim, T.; Im, W. Automated Builder and Database of Protein/Membrane Complexes for Molecular Dynamics Simulations. PLoS ONE 2007, 2, e880. [Google Scholar] [CrossRef]
  52. Wu, E.L.; Cheng, X.; Jo, S.; Rui, H.; Song, K.C.; Dávila-Contreras, E.M.; Qi, Y.; Lee, J.; Monje-Galvan, V.; Venable, R.M.; et al. CHARMM-GUI Membrane Builder toward realistic biological membrane simulations. J. Comput. Chem. 2014, 35, 1997–2004. [Google Scholar] [CrossRef]
  53. Jorgensen, W.L.; Chandrasekhar, J.; Madura, J.D.; Impey, R.W.; Klein, M.L. Comparison of simple potential functions for simulating liquid water. J. Chem. Phys. 1983, 79, 926–935. [Google Scholar] [CrossRef]
  54. Klauda, J.B.; Venable, R.M.; Freites, J.A.; O’Connor, J.W.; Tobias, D.J.; Mondragon-Ramirez, C.; Vorobyov, I.; MacKerell, A.D., Jr.; Pastor, R.W. Update of the CHARMM all-atom additive force field for lipids: Validation on six lipid types. J. Phys. Chem. B 2010, 114, 7830–7843. [Google Scholar] [CrossRef]
  55. Best, R.B.; Zhu, X.; Shim, J.; Lopes, P.E.M.; Mittal, J.; Feig, M.; MacKerell, A.D., Jr. Optimization of the additive CHARMM all-atom protein force field targeting improved sampling of the backbone φ, ψ and side-chain χ(1) and χ(2) dihedral angles. J. Chem. Theory Comput. 2012, 8, 3257–3273. [Google Scholar] [CrossRef] [PubMed]
  56. Phillips, J.C.; Braun, R.; Wang, W.; Gumbart, J.; Tajkhorshid, E.; Villa, E.; Chipot, C.; Skeel, R.D.; Kale, L.; Schulten, K. Scalable molecular dynamics with NAMD. J. Comput. Chem. 2005, 26, 1781–1802. [Google Scholar] [CrossRef] [PubMed]
  57. Silva, J.R.; Pan, H.; Wu, D.; Nekouzadeh, A.; Decker, K.F.; Cui, J.; Baker, N.A.; Sept, D.; Rudy, Y. A multiscale model linking ion-channel molecular dynamics and electrostatics to the cardiac action potential. Proc. Natl. Acad. Sci. USA 2009, 106, 11102–11106. [Google Scholar] [CrossRef]
  58. Ryckaert, J.P.; Ciccotti, G.; Berendsen, H.J.C. Numerical integration of the cartesian equations of motion of a system with constraints: Molecular dynamics of n-alkanes. J. Comput. Phys. 1977, 23, 327–341. [Google Scholar] [CrossRef]
  59. Feller, S.E.; Zhang, Y.; Pastor, R.W.; Brooks, B.R. Constant pressure molecular dynamics simulation: The Langevin piston method. J. Chem. Phys. 1995, 103, 4613–4621. [Google Scholar] [CrossRef]
  60. Darden, T.; York, D.; Pedersen, L. Particle mesh Ewald: An N log(N) method for Ewald sums in large systems. J. Chem. Phys. 1993, 98, 10089–10092. [Google Scholar] [CrossRef]
  61. Humphrey, W.; Dalke, A.; Schulten, K. VMD: Visual molecular dynamics. J. Mol. Graph. 1996, 14, 33–38. [Google Scholar] [CrossRef]
  62. Pettersen, E.F.; Goddard, T.D.; Huang, C.C.; Couch, G.S.; Greenblatt, D.M.; Meng, E.C.; Ferrin, T.E. UCSF Chimera—A visualization system for exploratory research and analysis. J. Comput. Chem. 2004, 25, 1605–1612. [Google Scholar] [CrossRef]
  63. Pandurangan, A.P.; Ochoa-Montaño, B.; Ascher, D.B.; Blundell, T.L. SDM: A server for predicting effects of mutations on protein stability. Nucleic Acids Res. 2017, 45, W229–W235. [Google Scholar] [CrossRef] [PubMed]
  64. Lang, F.; Föller, M. Regulation of ion channels and transporters by AMP-activated kinase (AMPK). Channels 2014, 8, 20–28. [Google Scholar] [CrossRef] [PubMed]
  65. Shahbazi, M.; Amri Maleh, P.; Bagherzadeh, M.; Moulana, Z.; Sepidarkish, M.; Rezanejad, M.; Mirzakhani, M.; Ebrahimpour, S.; Ghorbani, H.; Ahmadnia, Z.; et al. Linkage of Lambda Interferons in Protection Against Severe COVID-19. J. Interferon Cytokine Res. 2021, 41, 149–152. [Google Scholar] [CrossRef]
  66. Hariharan, A.; Hakeem, A.R.; Radhakrishnan, S.; Reddy, M.S.; Rela, M. The Role and Therapeutic Potential of NF-kappa-B Pathway in Severe COVID-19 Patients. Inflammopharmacology 2021, 29, 91–100. [Google Scholar] [CrossRef] [PubMed]
  67. Wilfong, E.M.; Croze, R.; Fang, X.; Schwede, M.; Niemi, E.; López, G.Y.; Lee, J.W.; Nakamura, M.C.; Matthay, M.A. Proinflammatory cytokines and ARDS pulmonary edema fluid induce CD40 on human mesenchymal stromal cells—A potential mechanism for immune modulation. PLoS ONE 2020, 15, e0240319. [Google Scholar]
  68. Notz, Q.; Schmalzing, M.; Wedekink, F.; Schlesinger, T.; Gernert, M.; Herrmann, J.; Sorger, L.; Weismann, D.; Schmid, B.; Sitter, M.; et al. Pro- and Anti-Inflammatory Responses in Severe COVID-19-Induced Acute Respiratory Distress Syndrome—An Observational Pilot Study. Front. Immunol. 2020, 11, 581338. [Google Scholar] [CrossRef]
  69. Lin, S.; Wu, H.; Wang, C.; Xiao, Z.; Xu, F. Regulatory T Cells and Acute Lung Injury: Cytokines, Uncontrolled Inflammation, and Therapeutic Implications. Front. Immunol. 2018, 9, 1545. [Google Scholar] [CrossRef]
  70. Kanzawa, N.; Nishigaki, K.; Hayashi, T.; Ishii, Y.; Furukawa, S.; Niiro, A.; Yasui, F.; Kohara, M.; Morita, K.; Matsushima, K.; et al. Augmentation of chemokine production by severe acute respiratory syndrome coronavirus 3a/X1 and 7a/X4 proteins through NF-κB activation. FEBS Lett. 2006, 580, 6807–6812. [Google Scholar] [CrossRef]
  71. DeDiego, M.L.; Nieto-Torres, J.L.; Regla-Nava, J.A.; Jimenez-Guardeño, J.M.; Fernandez-Delgado, R.; Fett, C.; Castaño-Rodriguez, C.; Perlman, S.; Enjuanes, L. Inhibition of NF-κB-mediated inflammation in severe acute respiratory syndrome coronavirus-infected mice increases survival. J. Virol. 2014, 88, 913–924. [Google Scholar] [CrossRef]
  72. Kelley, N.; Jeltema, D.; Duan, Y.; He, Y. The NLRP3 Inflammasome: An Overview of Mechanisms of Activation and Regulation. Int. J. Mol. Sci. 2019, 20, 3328. [Google Scholar] [CrossRef]
  73. Andersen, M.N.; Rasmussen, H.B. AMPK: A regulator of ion channels. Commun. Integr. Biol. 2012, 5, 480–484. [Google Scholar] [CrossRef] [PubMed]
  74. Barrese, V.; Stott, J.B.; Figueiredo, H.B.; Aubdool, A.A.; Hobbs, A.J.; Jepps, T.A.; McNeish, A.J.; Greenwood, I.A. Angiotensin II Promotes K V 7.4 Channels Degradation Through Reduced Interaction With HSP90 (Heat Shock Protein 90). Hypertension 2018, 71, 1091–1100. [Google Scholar] [CrossRef] [PubMed]
  75. Chen, I.Y.; Moriyama, M.; Chang, M.F.; Ichinohe, T. Severe Acute Respiratory Syndrome Coronavirus Viroporin 3a Activates the NLRP3 Inflammasome. Front. Microbiol. 2019, 10, 50. [Google Scholar] [CrossRef]
  76. Gonzalez, M.E.; Carrasco, L. Viroporins. FEBS Lett. 2003, 552, 28–34. [Google Scholar] [CrossRef]
  77. McClenaghan, C.; Hanson, A.; Lee, S.J.; Nichols, C.G. Coronavirus Proteins as Ion Channels: Current and Potential Research. Front. Immunol. 2020, 11, 573339. [Google Scholar] [CrossRef]
  78. Rahbar, M.R.; Jahangiri, A.; Khalili, S.; Zarei, M.; Mehrabani-Zeinabad, K.; Khalesi, B.; Pourzardosht, N.; Hessami, A.; Nezafat, N.; Sadraei, S.; et al. Hotspots for mutations in the SARS-CoV-2 spike glycoprotein: A correspondence analysis. Sci. Rep. 2021, 11, 23622. [Google Scholar] [CrossRef] [PubMed]
  79. Schrörs, B.; Riesgo-Ferreiro, P.; Sorn, P.; Gudimella, R.; Bukur, T.; Rösler, T.; Löwer, M.; Sahin, U. Large-scale analysis of SARS-CoV-2 spike-glycoprotein mutants demonstrates the need for continuous screening of virus isolates. PLoS ONE 2021, 16, e0249254. [Google Scholar]
  80. Manzoor, R.; Igarashi, M.; Takada, A. Influenza A Virus M2 Protein: Roles from Ingress to Egress. Ijms 2017, 18, 2649. [Google Scholar] [CrossRef]
  81. Jones, S. Death by viroporin. Nat. Rev. Microbiol. 2007, 5, 907. [Google Scholar] [CrossRef]
  82. Zamzami, N.; Kroemer, G. The mitochondrion in apoptosis: How Pandora’s box opens. Nat. Rev. Mol. Cell Biol. 2001, 2, 67–71. [Google Scholar] [CrossRef] [PubMed]
  83. Farag, N.S.; Breitinger, U.; El-Azizi, M.; Breitinger, H.G. The p7 viroporin of the hepatitis C virus contributes to liver inflammation by stimulating production of Interleukin-1β. Biochim. Biophys. Acta (BBA) Mol. Basis Dis. 2017, 1863, 712–720. [Google Scholar] [CrossRef] [PubMed]
  84. Bartoszewski, R.; Matalon, S.; Collawn, J.F. Ion channels of the lung and their role in disease pathogenesis. Am. J. Physiol. Lung Cell. Mol. Physiol. 2017, 313, L859–L872. [Google Scholar] [CrossRef] [PubMed]
  85. Li, X.; Ma, X. Acute respiratory failure in COVID-19: Is it “typical” ARDS? Crit. Care 2020, 24, 198. [Google Scholar] [CrossRef] [PubMed]
  86. Torres Acosta, M.A.; Singer, B.D. Pathogenesis of COVID-19-induced ARDS: Implications for an ageing population. Eur. Respir. J. 2020, 56, 2002049. [Google Scholar] [CrossRef]
  87. Murakami, T.; Ockinger, J.; Yu, J.; Byles, V.; McColl, A.; Hofer, A.M.; Horng, T. Critical role for calcium mobilization in activation of the NLRP3 inflammasome. Proc. Natl. Acad. Sci. USA 2012, 109, 11282–11287. [Google Scholar] [CrossRef] [PubMed]
Figure 1. (A) Principal component analysis (PCA) scatter plot representation of the variability in the dataset along the first two PC axes (PC1—53% variability; PC2—29% variability). Control and infected samples are orthogonal to each other. (B) MA plot (M-log ratio of fold change; A-mean of normalized counts) for differentially significant gene expression in infected samples compared to Controls. (C) Volcano plot showing significantly upregulated genes (in orange), significantly downregulated genes (in blue) and non-significantly expressed genes (in black) between infected cells and controls. (D) Bar plot showing gene counts of PRKAA1 gene between infected cells and controls. Error bars indicate standard deviation. (E) Example bar plots of differentially upregulated genes between infected cells and controls. The values plotted are gene counts with the error bars indicating standard deviation. Genes plotted: CD40, IFNL1, IFNL2, IFNL3, IL12A, IL33, IL6 and NFκB1. (F) Same as E, but for differentially downregulated genes. Genes plotted: HSP90AB1, HSP90AA1 and HSP90B1. (G) Distribution showing the percentage of genes significantly upregulated (p < 0.01) and with LFC > 2.88% of the genes were upregulated while 12% of the genes were downregulated. (H) Gene enrichment analysis and gene ontology network obtained from upregulated genes in infected samples vs controls showing enrichment for immune functions and its associated signalling pathways. Metascape was used for this analysis. Different coloured dots indicate different genes encoding the same function. (I) Protein–protein interaction (PPI) enrichment analysis showing cellular functions determined by the upregulated genes in infected samples vs. controls. Metascape was used for this analysis. Different coloured dots indicate different genes encoding similar protein–protein interactions.
Applmicrobiol 02 00045 g001
Figure 2. (A) Analytical pipeline for determining the consensus sequences for Orf3a and E protein for the SARS-CoV-2 variants. The pipeline describes the steps from extraction of protein sequences for each protein to the determination of the position-specific residue frequency. (B) Tables showing the number of sequences excluded and included in the analysis using a median length threshold. (C) Heatmap showing the position-specific residue intra-variant frequency of Orf3q protein for each SARS-CoV-2 variant used in the analysis. Heatmap scale: −0.05 to 0.25. (D) A stacked bar plot showing the position-specific residue change frequency of Orf3q protein for each SARS-CoV-2 variant used in the analysis. (E) Heatmap showing the position-specific residue intra-variant frequency of E protein for each SARS-CoV-2 variant used in the analysis. Heatmap scale: −0.05 to 0.25. (F) A stacked bar plot showing the position-specific residue change frequency of E protein for each SARS-CoV-2 variant used in the analysis.
Applmicrobiol 02 00045 g002
Figure 3. (A) Multiple sequence alignment of representative mutations containing consensus sequences across all variants (except Alpha) of Orf3a protein. The residue colors follow the clustalx color scheme: red, residue R, K; blue, residues A, I, L, M, F, W, V; green, residues N, Q, S, T; pink, residue C; magenta, residues E, D; cyan, residues H, Y; yellow, residue P; orange, residue G. Keys: “*” (asterix) indicates positions with complete conservation, “:” (colon) indicates conservation of residues with highly similar physico-chemical properties and “.” (period) indicates conservation with weak similarities among the residues. (B) Reference structure: Cryo-EM structure of Orf3a protein dimer (PDB id: 7KJR). (C) Structural superposition of variant-specific mutations of Orf3a in SARS-CoV-2 variants with the reference structure: (i) Beta-Q57H (ii) Beta-S171L (iii) AY lineage of Delta-P104S (iv) Omicron-L106F (v) Omicron-S165F. (D) TM–score matrix of Orf3a protein across SARS-CoV-2 variants. Color scale: dark red: 1, dark green: 0.990.
Applmicrobiol 02 00045 g003
Figure 4. (A) Insertion and equilibration of truncated Orf3a (40–125) from SARS-CoV-2 in a membrane system mimicking the endosomal compartment of a generalized human cell. The membrane is not shown in the figure to ease the visualization of the molecular machine. The upper channel has been pointed out using a dotted circle. (B) Movement of water molecules through the upper channel at different time points (i) 0 ns (ii) 0.5 ns (iii) 1 ns (iv) 1.5 ns (v) 2 ns (Supplementary Movie S1). (C) Insertion and equilibration of truncated Orf3a (40–125) from SARS-CoV-2 in a membrane system mimicking the endosomal compartment of a generalized human cell. The membrane is not shown in the figure to ease the visualization of the molecular machine. The lower channel has been pointed out using a dotted circle. (D) Movement of water molecules through the inner subunit channel at different time points (i) 0 ns (ii) 0.5 ns (iii) 1 ns (iv) 1.5 ns (v) 2 ns (Supplementary Movie S1). (E) Line plot showing the dynamics in the number of hydrogen bonds in the protein–membrane system as a function of time steps for 5 ns where each time step is 0.1 ns. (F) Line plot showing the RMSD of the protein–membrane complex and its change over a course of 5 ns where each time step is 0.1 ns. (G) Line plot showing the total energy (kcal/mol) of the system in 5 ns of simulation with every 5000 steps = 1 ps. (H) Matrix representation showing the RMSF of individual residues of the protein over the time span of 5 ns where each time step is 0.1 ns.
Applmicrobiol 02 00045 g004
Figure 5. (A) Insertion and equilibration of E protein (8-40) of SARS-CoV-2 in a membrane system mimicking the ERGIC of human cells. The membrane is not shown in the figure to ease the visualisation of the molecular machine. (B) Movement of water molecules through the central pentameric channel of the TM region of the E protein at different time points (i) 0 ns (ii) 0.5 ns (iii) 1 ns (iv) 1.1 ns (v) 1.2 ns (vi) 1.3 ns (vii) 1.4 ns (viii)1.5 ns (ix) 2 ns (Supplementary Movie S1. (C) Line plot showing the dynamics in the number of hydrogen bonds in the protein–membrane system as a function of time steps for 5 ns where each time step is 0.1 ns. (D) Line plot showing the RMSD of the protein–membrane complex and its change over a course of 5 ns where each time step is 0.1 ns. (E) Line plot showing the total energy (kcal/mol) of the system in 5 ns of simulation with each 5000 steps = 1 ps. (F) Matrix representation showing the RMSF of individual residues of the protein over the time span of 5 ns where each time step is 0.1 ns.
Applmicrobiol 02 00045 g005
Figure 6. A schematic demonstrating intra and intercellular inflammatory pathways in SARS-CoV-2 mediated COVID-19.
Applmicrobiol 02 00045 g006
Table 1. Lipid composition of different membrane components of intracellular compartments (endosome and ERGIC).
Orf3aE protein
LipidsIntracellular compartments
EndosomeERGIC
POPC12094
POPE4442
PSM60Not present
Cholesterol12028
bGMP28Not present
POPC: 1-palmitoyl-2-oleoyl-sn-glycero-3-phosphocholine; POPE: palmitoyloleoyl phosphatidylethanolamine; PSM: palmitoylsphingomyelin; bGMP: bovine glycomacropeptide; ERGIC: endoplasmic reticulum–Golgi apparatus inter compartment.
Table 2. Single site-directed mutations on the E protein and Orf3a with the predicted values of theoretical pI, ΔΔG and average hydrophobic score.
WT8.5701.128
Channel forming
E8A8.9901.199
N15A8.571.741.199
F26A8.570.971.115
Membrane anchoring part
L37A8.57−0.361.101
R38A7.6901.212
WT5.5500.275
Initial neck constriction
F43A5.55−0.020.271
L46A5.550.150.267
I47A5.550.50.265
V50A5.550.840.266
Q57A5.550.390.294
S58A5.551.490.284
C81A5.55−0.780.272
N82A5.551.490.294
L85A5.550.150.267
L95A5.55−2.680.267
L96A5.550.150.267
F105A5.55−0.020.271
Y109A5.55−1.070.286
Q116A5.550.390.294
Upper tunnel
K61A5.40.110.295
K75A5.40.310.295
H78A5.430.610.293
F79A5.550.970.271
I123A5.550.50.265
L127A5.550.150.267
L139A5.550.150.267
D142A5.71−0.210.294
Lower tunnel
L65A5.55−0.40.267
K66A5.40.180.295
L71A5.55−3.220.267
Y141A5.55−0.510.286
N144A5.550.030.294
N161A5.550.030.294
Y189A5.55−0.940.286
Lipid interacting residues
I62A5.55−0.080.265
T64A5.550.60.284
K66A5.40.180.295
I118A5.550.50.265
R122A5.40.410.297
R126A5.4−1.710.297
D142A5.71−0.210.294
N144A5.550.030.294
F207A5.55−0.020.271
Publisher’s Note: MDPI stays neutral with regard to jurisdictional claims in published maps and institutional affiliations.

