Abstract
Synbiotics are mixtures of prebiotics and probiotics that enhance the activity of probiotic bacteria when co-administered to provide greater benefits to the host. Traditionally, the synbiotics that have been discovered enhance gut probiotic strains and are nutritionally complex molecules that survive digestive breakdown until they reach the later stages of the intestinal tract. Here, we screened and identified sugars or sugar substitutes as synbiotics for the oral probiotic strains Streptococcus salivarius BLIS K12 and BLIS M18. Using a modified deferred antagonism assay, we found that 0.5% (w/v) galactose and 2.5% (w/v) raffinose were the best candidates for use as synbiotics with BLIS K12 and M18, as they trigger enhanced antimicrobial activity against a range of bacteria representing species from the mouth, gut, and skin. Using reverse transcriptase quantitative PCR, we found that this enhanced antimicrobial activity was caused by the upregulation of the lantibiotic genes salA, salB, and sal9 in either K12 or M18. This led to the conclusion that either 2.5% (w/v) raffinose or 0.5% (w/v) galactose, respectively, are suitable synbiotics for use in conjunction with BLIS K12 and M18 to enhance probiotic performance.
1. Introduction
Bacteria have finely tuned regulatory systems refined over millennia to balance metabolic control with the production of secondary metabolites, granting them a competitive edge in diverse ecological niches. This delicate equilibrium ensures the synthesis of secondary metabolites occurs only when nutritional resources are abundant, thus impeding competitors. However, dysregulation can prompt unnecessary production of secondary metabolites, precipitating a competitive disadvantage. Our comprehension of how metabolic regulatory networks interact with the genetic control of numerous secondary metabolites remains incomplete. Notably, studies have demonstrated auto-regulatory mechanisms akin to quorum sensing in the production of antibacterial secondary metabolites such as nisin and subtilin (lantibiotic bacteriocins), hinting at sophisticated regulatory pathways [1,2]. Furthermore, the regulation of subtilin by the alternative sigma factor SigH suggests a level of global control [2].
Catabolite (or glucose) repression is a regulatory mechanism operational in many bacteria including the streptococci that prioritizes the utilization of preferred carbon sources over less favourable ones. This mechanism allows the bacteria to efficiently allocate resources by suppressing the expression of genes involved in the metabolism of alternative carbon sources when a preferred carbon source is available. The primary regulator of catabolite repression in bacteria is cAMP (cyclic adenosine monophosphate) and its receptor protein, CRP (cAMP receptor protein) [3]. When glucose, a preferred carbon source for many bacteria, is abundant, it leads to high levels of cAMP due to the inhibition of adenylate cyclase, the enzyme responsible for cAMP synthesis. In turn, cAMP binds to CRP, forming the cAMP-CRP complex. This complex then binds to specific DNA sequences called cAMP response elements (CREs) located in the promoters of target genes, thereby modulating gene expression. The cAMP-CRP complex typically activates the expression of genes involved in the utilization of alternative carbon sources when glucose is scarce. Conversely, in the presence of glucose, the cAMP-CRP complex represses the expression of these genes by blocking RNA polymerase binding or promoting DNA looping, effectively shutting down the utilization of alternative carbon sources) [3,4].
Glucose repression of the phosphotransferase system (PTS) can alter the phosphorylation state of certain regulatory proteins, affecting bacteriocin gene expression. For example, glucose has been found to repress the production of the Streptococcus pyogenes-derived lantibiotic, streptin [5], the Streptococcus agalactiae bacteriocin, streptocin B1 [6], the S. salivarius bacteriocin streptococcin sal-P [7] and the Streptococcus zooepidemicus bacteriocin zoocin A [8]. On the other hand, the yields of the S. pyogenes lantibiotic SA-FF22 [9] and the S. salivarius-associated salivaricin A [10] do not appear to be reduced by glucose supplementation of the producer cell growth media.
Probiotics, characterized by their conferring of health benefits to the host, wield a diverse arsenal of mechanisms of action. Key amongst these is the production of secondary metabolites, including bacteriocins. For example, prominent attributes of the commercial oral probiotics S. salivarius K12 (BLIS K12) and S. salivarius M18 (BLIS M18) is their production of the lantibiotics salivaricin A/salivaricin B [11] and salivaricin A/salivaricin 9 [12], respectively, to suppress various competitor bacteria, some of which because of their disease-associations are considered to be undesirable members of the oral microbiota. These lantibiotics exhibit auto-regulatory properties, fostering a positive feedback loop akin to nisin and subtilin, augmenting their production. However, the orchestration of global cellular regulation and metabolism in lantibiotic production by BLIS K12 and BLIS M18 remains incompletely understood. Utilising their secondary metabolites BLIS K12 or BLIS M18 probiotic products have been shown to have efficacy in reducing the incidence of recurrent pharyngitis, otitis media, and viral infections, stimulating beneficial immune responses, reducing halitosis, and improving tooth and periodontal health [13,14,15,16,17,18,19].
In recent years, synbiotics, synergistic combinations of probiotics and adjuncts that enhance their probiotic activity, have garnered attention. Although most synbiotics focus on bolstering probiotic growth, an alternative paradigm posits modulating probiotic gene expression to benefit the host. This study endeavours to explore whether specific sugars can potentiate the production of antimicrobials synthesized by BLIS K12 and BLIS M18. Building upon our prior research, we postulated that certain synbiotic sugars may serve to augment lantibiotic production by BLIS K12 and BLIS M18, potentially amplifying their colonisation efficacy as well as their contribution to the prevention of specific oral diseases and general maintenance of oral health. In this study, employing deferred antagonism assays and reverse transcriptase qPCR, we have scrutinized the impact of synbiotic sugars on antimicrobial molecule production. Subsequently, clinical trials will of course be required to establish if the incorporation of particular sugars in BLIS probiotic formulations does improve their efficacy and result in beneficial health outcomes for the consumer.
2. Materials and Methods
All of the bacterial strains used in this study are listed in Table 1.

Table 1.
Bacterial strains used in this study.
2.1. Initial Carbohydrate Testing
A modified deferred antagonism assay [20] was conducted to investigate the inhibitory effects of S. salivarius BLIS K12 and BLIS M18 against various indicator strains. Control plates (made with CABCa agar (Columbia Agar Base (BD Difco, Franklin Lakes, NJ, USA) supplemented with 0.5% calcium carbonate) and test plates (CABCa agar supplemented with filter sterilised 0.22 µm sugar solutions at 0.5 w/v and 2.5% w/v of D-(+) Raffinose, D(+)-Glucose, Lactose, D(−)Fructose, Xylitol, Isomalt, Lactulose, Sucrose and D-Galactose) were prepared in triplicate. S. salivarius BLIS K12 and BLIS M18 suspensions (approximately 1 × 10⁷ cfu/mL) were prepared from freeze-dried raw ingredient powder (~2 × 10¹¹ cfu/mL, Blis Technologies Limited, Dunedin, New Zealand) diluted in Todd Hewitt Broth (THB, BD Difco, USA). A 100 µL of this suspension was streaked (1.2 cm streak wide) down the middle of the agar plate. After incubation (18 h at 37 °C with 5% CO2) the S. salivarius growth was removed from the agar plates using sterile cotton swabs and the agar plates were surface sterilised with chloroform vapour for 30 min, followed by air drying for 30 min. Indicator strain suspensions were prepared by adding approximately 3–9 colonies (depending on the size) of each strain into separate tubes containing 3 mL THB. These suspensions were then swabbed across the agar plate perpendicular to the initial streak and incubated again for 18 h at 37 °C with 5% CO2. Zones of inhibition in the middle of the test streak were measured in millimetres from the edge where the reduced growth of colonies started and finished.
2.2. Growth Curves
The growth curve experiments investigated the effects of different sugars on S. salivarius BLIS K12 and BLIS M18. The bacteria were initially present at a concentration of approximately 1 × 10⁵ CFU/mL. This was achieved by diluting the freeze-dried raw ingredient powder (containing approximately 2 × 10¹¹ CFU/mL) in M17 broth (BD Difco, Franklin Lakes, NJ, USA). The experiment was performed in triplicate for each condition. The bacteria were grown in two types of media: plain M17 broth (control) and M17 broth supplemented with filter-sterilized sugar solutions (0.22 μm filter). The sugars tested were D-(+) Raffinose, D-Galactose, D-(+) Glucose, and D-(−) Fructose at concentrations of 0.5% (w/v) and 2.5% (w/v).
The cultures were incubated at 37 °C with 5% CO2. Cell counts were measured at 0 and 18 h. This involved preparing serial dilutions (1:10) in Phosphate Buffered Saline (PBS Dulbecco A, Oxoid, Altrincham, UK). At the 0-h timepoint, 5 × 10 μL aliquots of the 10−2 dilution were plated onto CAB K12 agar plates. For the 18-h timepoint, 5 × 10 μL aliquots of the 10−5 dilution were plated onto CAB K12 agar plates. CAB K12 agar is a medium made with Columbia Agar Base supplemented with 0.25% Glucose and 0.5% Yeast extract (Fort Richard, Auckland, New Zealand).
2.3. Dose Response of Raffinose and Galactose at Different Concentrations
Building upon the previously described modified deferred antagonism assays [20], this experiment investigated the impact of varying concentrations (0.5%, 1.25%, 1.7%, and 2.5% w/v) of D-(+) Raffinose and D-Galactose on the inhibitory activity of Streptococcus salivarius BLIS K12 and BLIS M18 against indicator strains. Duplicate control plates used CABCa agar with 0.5% calcium carbonate, while test plates incorporated the same base agar supplemented with filter-sterilized (0.22 μm) sugar solutions. Similar to the previous assay, S. salivarius suspensions (approximately 1 × 10⁷ CFU/mL diluted in THB Broth (BD Difco, USA) were prepared and streaked, followed by incubation (18 h, 37 °C, 5% CO2). After incubation, the S. salivarius growth was removed using a sterile cotton swab. Here, a new step was introduced: measuring the agar’s pH (using pH probe, Mettler Toledo, Switzerland) within the initial growth area. If the pH dropped below 6.5 (indicating acidification), a strip of filter paper (1 cm wide) soaked in sodium carbonate solution (0.05 M, pH 11) was applied to neutralize it (adjust pH to 6.5–8).
The agar plates were then surface sterilised as before with chloroform vapour for 30 min, followed by air drying for 30 min. Indicator strain suspensions were prepared by adding approximately 3–9 colonies (depending on the size) of each strain into separate tubes containing 3 mL THB. These suspensions were then swabbed across the agar plate perpendicular to the initial streak and incubated again for 18 h at 37 °C with 5% CO2, and zones of inhibition were measured as before.
2.4. Expanding the Range of Bacterial Strains
To accommodate anaerobic test strains in this modified deferred antagonism assay [20], freeze-thaw extracts were prepared from Columbia Human Blood Agar with 0.1% Calcium Carbonate plates (hBaCa—Fort Richard, New Zealand). Briefly, hBaCa plates were frozen at −80 °C, defrosted, and the liquid extract was collected for use as a diluent for these strains. The assay investigated the effects of D-(+) Raffinose and D-Galactose (at 0.5% and 2.5% w/v) on the inhibitory activity of Streptococcus salivarius BLIS K12 and BLIS M18 against various indicator strains, including both aerobic and anaerobic bacteria. Control plates (CABCa agar with 0.5% calcium carbonate) were prepared in triplicate, while test plates used the same base agar supplemented with filter-sterilized (0.22 μm) sugar solutions. Similar to a previous assay, S. salivarius suspensions (approximately 1 × 10⁷ CFU/mL) were prepared from raw ingredient powder (~2 × 10¹¹ cfu/mL) diluted in THB and streaked on the plates, followed by incubation (18 h, 37 °C, 5% CO2). After incubation, the S. salivarius growth was removed, the agar pH was measured and adjusted if needed to 6.5–6.8, and the plates were sterilized as described previously.
Indicator strain suspensions were then prepared using THB (3 mL) for aerobic strains and hBaCa extract (1 mL) for anaerobic strains. These suspensions were swabbed perpendicularly across the plates. Aerobic plates were incubated again (18 h, 37 °C, 5% CO2), while anaerobic plates were incubated in a 2.5 L anaerobic jar for 3 days under anaerobic conditions (Anaerogen Sachet, Oxoid, UK). Finally, zones of inhibition were measured as before.
2.5. Gene Expression
First bacterial cultures were prepared from the freeze-dried raw ingredient powder (~2 × 10¹¹ cfu/mL) and adjusted to a concentration of approximately 1.4 × 10⁸ cfu/mL. One hundred microlitres of these suspensions were then spread plated onto CABCa agar plates in triplicate as controls and CABCa agar supplemented with filter sterilised 0.22 µm sugar solutions Raffinose, Galactose, Glucose alone or combined in triplicate as test plates. Plates were incubated at 37 °C with 5% CO2 for 19 h. After incubation, bacterial growth was collected from each plate using a sterile swab and resuspended into separate Sarstedt 2 mL screw-capped tubes containing 1 mL PBS.
Next, the focus shifted to isolating and purifying RNA, the molecule that carries genetic information. Bacterial cells were pelleted by centrifugation at 13,000 rpm for 1 min at 4 °C, the supernatant was removed from the cell pellet which was then resuspended thoroughly in 1 mL TRIzol reagent (Thermo Fisher, Waltham, MA, USA) to extract total RNA [21]. To further enhance RNA yield and purity, bead beating was employed. This technique involves using tiny beads to physically disrupt the cell wall and facilitate RNA extraction. Briefly, the cell suspensions were transferred into fresh 2 mL screw-capped tubes containing 0.1 mm Zirconia/silicon beads and then bead-beated on a vortex for 10 min at 2850 rpm/s.
Following RNA isolation, a process to remove any contaminating DNA was performed [22]. Briefly, the RNA was separated from other bacterial contents by the addition of 0.2 mL chloroform, and mixed thoroughly by inversion and then incubated at room temperature for 2–3 min. Beads were then allowed to settle, and the supernatant was transferred to PhasemakerTM tubes (Thermo Fisher, USA) and mixed by inversion during incubation on ice for 5 min. Phasemaker tubes were centrifuged at 12,000 rpm for 15 min at 4 °C. The upper aqueous phase was then transferred into a fresh Eppendorf tube and, then RNA was extracted using a PureLink RNA mini kit (Thermo Fisher, USA), as per the manufacturer’s instructions. RNA samples were then treated to remove any DNA using a TURBO DNA-free kit (Thermo Fisher, USA) following the manufacturer’s instructions. RNA was then converted to cDNA using superscript IV VILO (Thermo Fisher, USA) following the manufacturer’s instructions. The synthesized cDNA was then used for qPCR analysis using PowerTrack SYBR Green master mix (Thermo Fisher, USA) on a Quantstudio 5 Pro Real-Time PCR system (Thermo Fisher, USA) to determine how the presence of different sugars affects the expression of specific genes in S. salivarius BLIS K12 and BLIS M18.
To quantify specific gene expression changes caused by the different sugars, qPCR was performed following cDNA synthesis. The PCR cycling conditions included a hold stage for 2 min at 50 °C (initial enzyme inactivation), followed by 10 min at 95 °C (high-temperature DNA denaturation), and then a PCR stage of 40 cycles of 15 s at 95 °C (rapid denaturation) and 1 min at 60 °C (primer annealing/extension) to facilitate targeted DNA amplification. Finally melt curve analysis stage of 10 min at 95 °C, 1 min at 60 °C and 15 s at 95 °C confirmed the specificity of the amplified products. Each qPCR reaction contained a pre-mixed master mix with enzymes and fluorescent molecules (PowerTrack SYBR Green master mix, 5 µL), specific forward and reverse primer (0.5 µm), nuclease-free water, and 2 µL of the sample cDNA in a total volume of 10 µL. Gene expression levels were normalized using the housekeeping genes recA and gyrA. These genes were used to account for variations in total cDNA level in the samples. A mathematical formula incorporating the expression ratio of the target gene and the geometric mean of the reference genes was used to calculate the relative gene expression [23].
where, RQGOI represents the relative quantification of the gene of interest, and RQREFS represents the geometric mean of the relative quantification values for the reference genes (recA and gyrA).
The primers used in this study are listed in Table 2 below:

Table 2.
Primers used in this study.
2.6. Statistical Analysis
Statistical analyses were performed using Prism 10.3 (GraphPad Software, LLC San Diego, CA, USA) and are as described in the figure legends.
3. Results
3.1. Raffinose and Galactose Enhance Antimicrobial Production in BLIS K12 and BLIS M18 Greater than Other Sugars
The initial phase of our investigation aimed to assess the impact of various sugars and sugar substitutes on antimicrobial production by BLIS K12 and BLIS M18. A range of sugars, including raffinose, galactose, glucose, lactose, fructose, xylitol, isomalt, lactulose, and sucrose, were selected for testing at both high (2.5% w/v) and low (0.5% w/v) concentrations. Antimicrobial production was evaluated by preparing CABCa solid media containing either 0.5% or 2.5% w/v of each sugar and conducting a modified deferred antagonism assay using a diverse selection of indicator strains representing different ecological niches, including Streptococcus mutans, Streptococcus pyogenes, Streptococcus pneumoniae, Staphylococcus aureus, Staphylococcus sobrinus, Staphylococcus saprophyticus, Staphylococcus sanguinis, Staphylococcus cohnii, and Staphylococcus dysgalactiae.
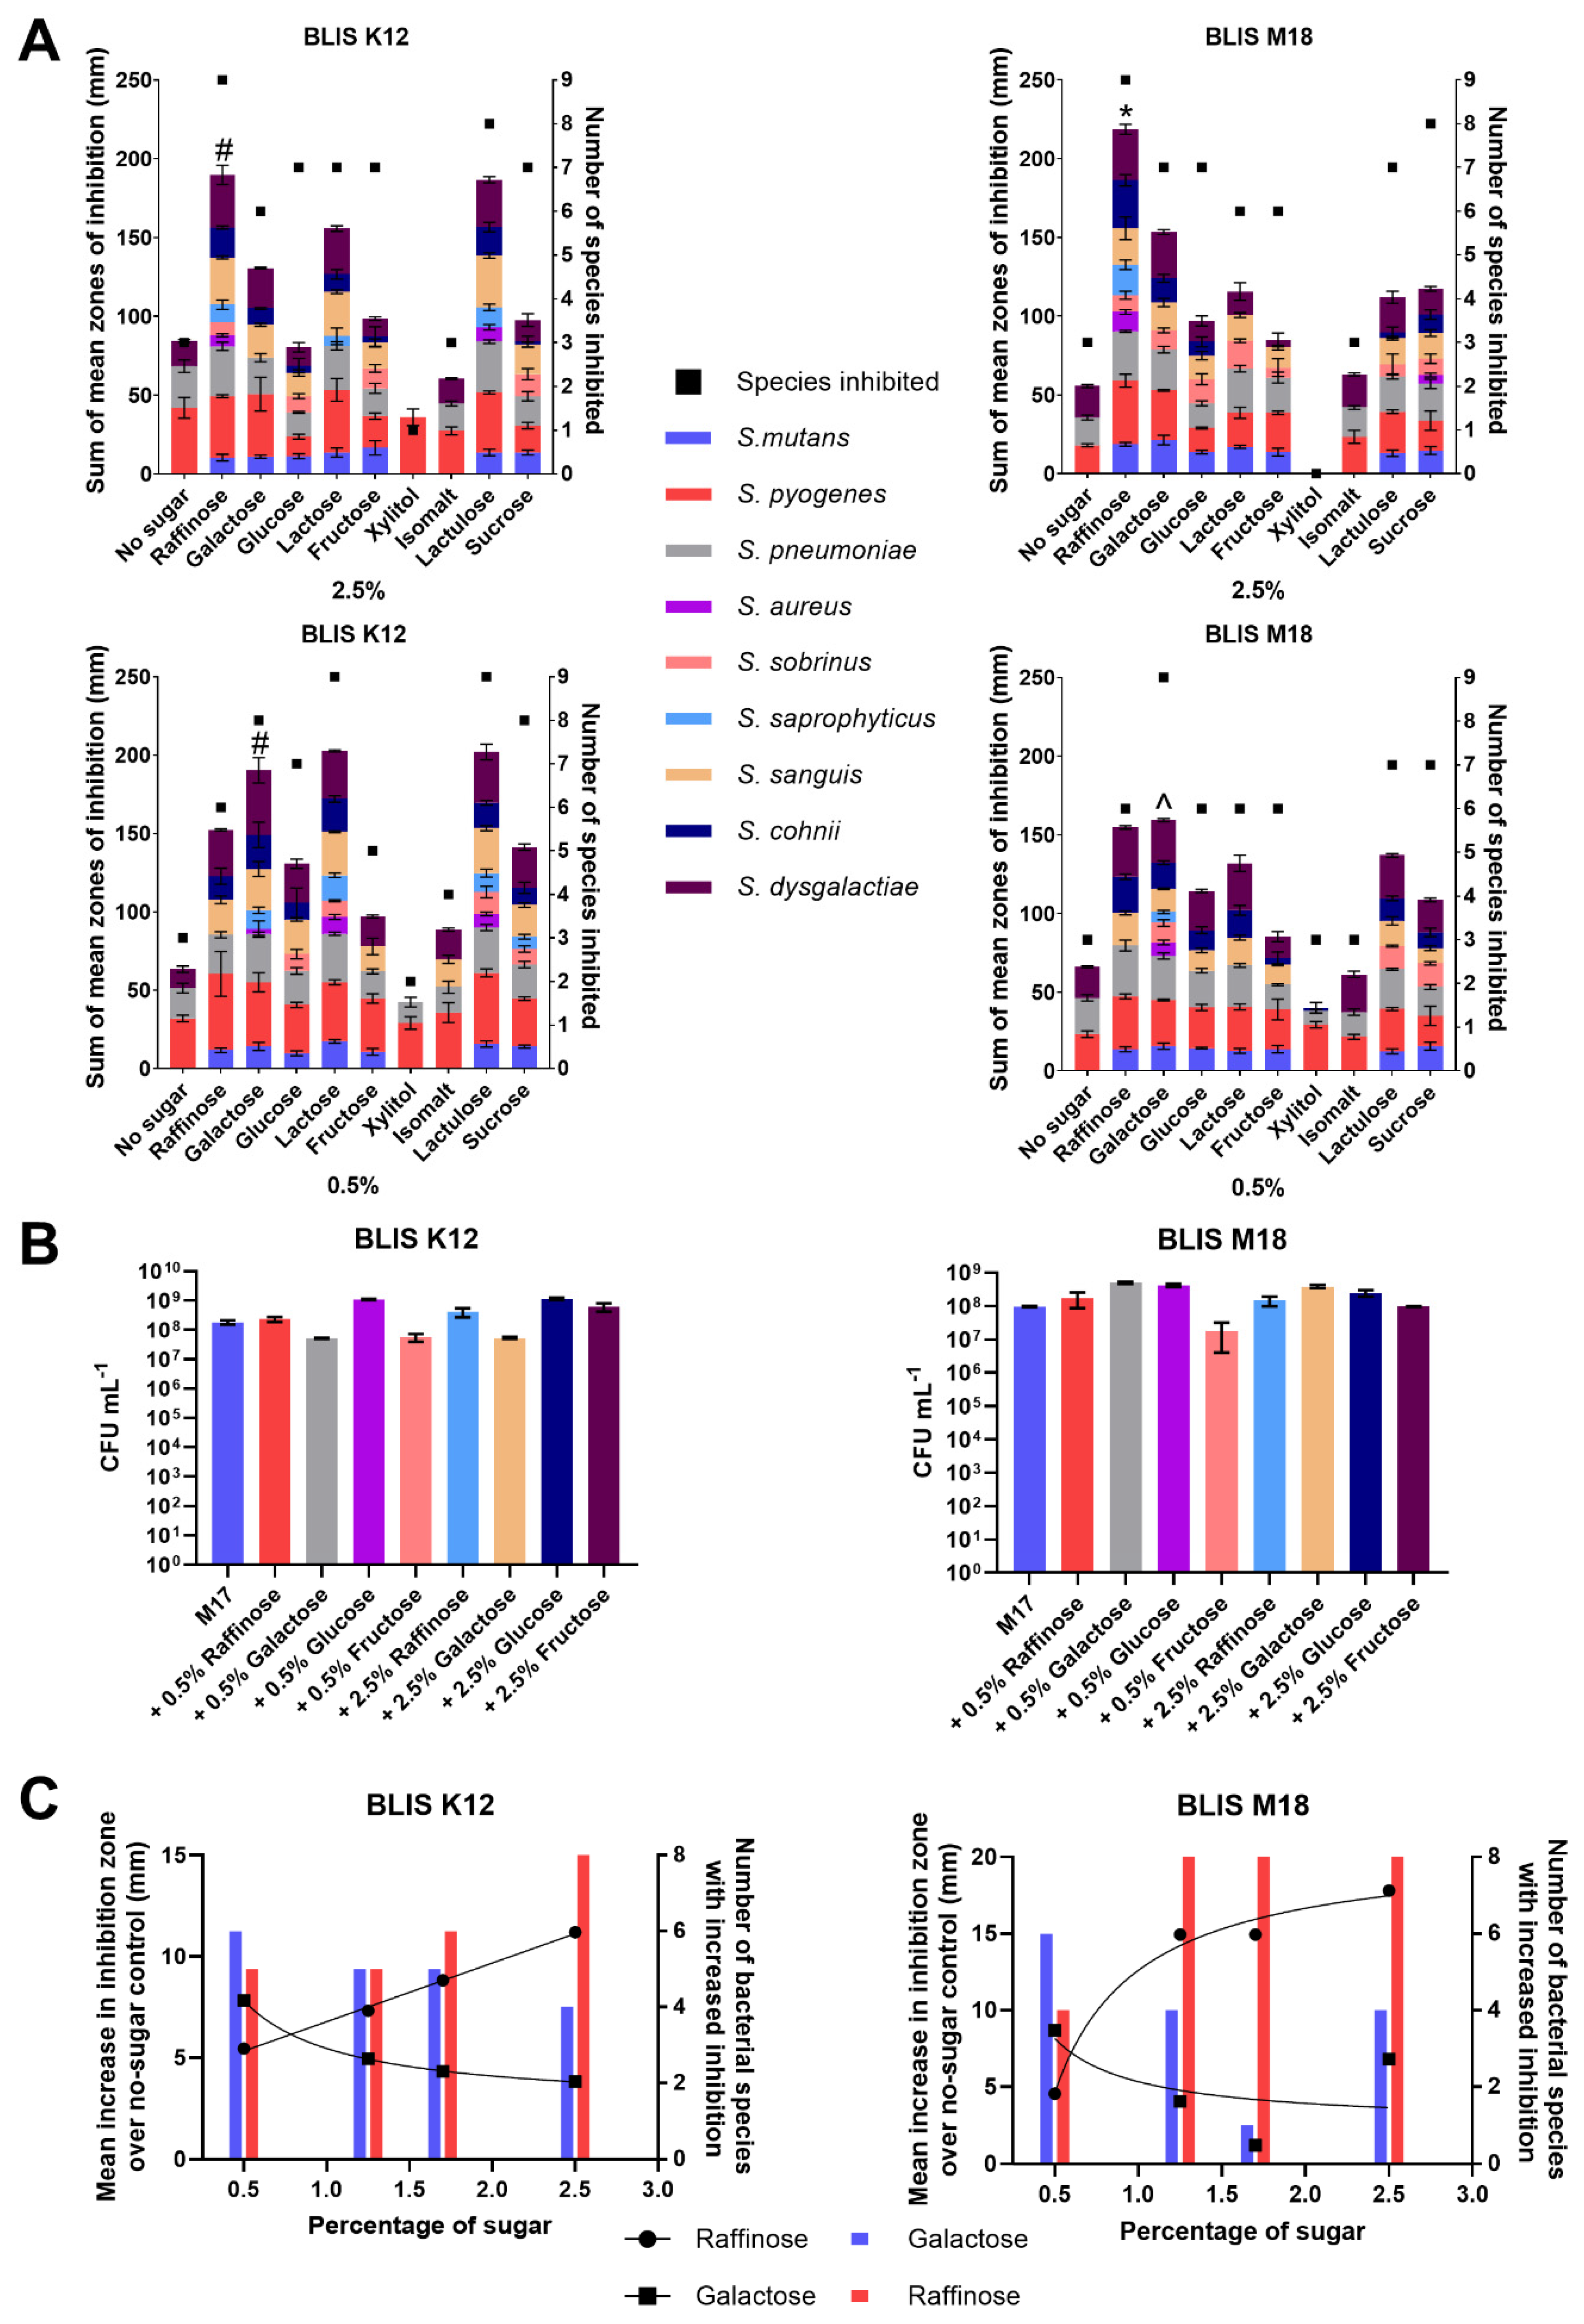
Our analysis revealed that at a concentration of 2.5% w/v, raffinose exhibited the most pronounced enhancement of antimicrobial production, with all nine indicator strains being inhibited by both BLIS K12 and BLIS M18 (Figure 1A). Additionally, raffinose resulted in the highest average increase in zone of inhibition, measuring 190 mm for BLIS K12 and 219 mm for BLIS M18 (Figure 1A). However, there were variations in the efficacy of sugars between strains, with lactulose performing similarly to raffinose for BLIS K12 (187 mm) but less effectively for BLIS M18 (112 mm) (Figure 1A). This suggests potential differential regulatory influences from the sugars on the antimicrobial production in the two strains.
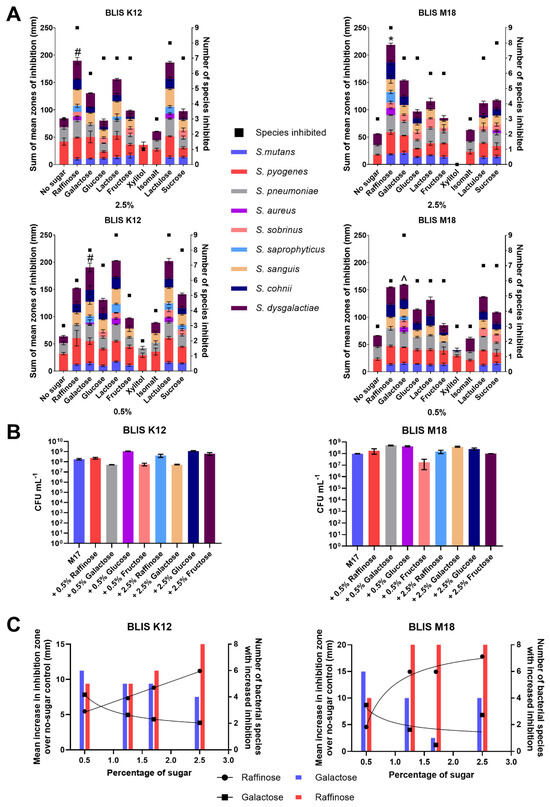
Figure 1.
(A) Sum of the mean zones of inhibition for different sugars (left Y-axes, Bars) and the number of species inhibited (right Y-axes, square points) for BLIS K12 and BLIS M18 at both 2.5% (w/v) and 0.5% (w/v) of different sugars (Data points are mean (n = 3, ±SD). For the sum of the average mean zones of inhibition, a two-way ANOVA with Dunnett’s multiple comparisons tests compared raffinose in the 2.5% samples and galactose in 0.5% to the other sugars was completed. * = p < 0.05 for all sugars, # = p < 0.05 for all sugars except lactulose and lactose and ^ = p < 0.05 for all sugar except raffinose. (B) Mean growth of BLIS K12 and BLIS M18 in M17 media supplemented with different types and concentrations of sugars after 18 h. (n = 3, ±SD). (C) Dose response of raffinose and galactose at different concentrations measuring the mean increase in zones of inhibition and number of species of bacteria inhibited compared to a non-sugar control across S. constellatus T29, S. salivarius K34b, S. pyogenes 71-698, S. mutans OMZ175, S. pneumoniae D39, S. saprophyticus ATCC 13505, S. aureus A222, S. sobrinus OMZ176. Lines with dots represent the mean increase in the size of the inhibition zone with a line of non-linear fit (left Y axes) and bars represent the number of species inhibited (right Y axes).
At a concentration of 0.5% w/v, the optimal sugar to stimulate inhibitory activity varied between BLIS K12 and BLIS M18 (Figure 1A). Lactose stimulated the highest increase in antimicrobial activity with BLIS K12, with all nine indicator strains being inhibited, resulting in an increase in the inhibition zone to 203 mm. Conversely, galactose was most effective with BLIS M18 with all nine indicator strains being inhibited and resulting in an increase to inhibition zone to 160 mm (Figure 1A). Given the relatively minor non-significant decrease (6%) in stimulated inhibitory activity observed between lactose and galactose in BLIS K12 compared to the significant decrease (17%) observed with galactose and lactose in BLIS M18, galactose was selected for further investigation at the lower concentration (Figure 1A). Overall, raffinose and galactose consistently induced greater antimicrobial potency compared to the other sugars, as evidenced by the larger inhibition zones observed on media containing these sugars (Figure 1A).
The observed increase in antimicrobial activity could potentially stem from two primary mechanisms: (1) augmented cell count due to sugars stimulating additional growth, resulting in increased production of antimicrobial compounds; or, (2) heightened gene/protein expression leading to increased production of antimicrobial compounds, To discern between these possibilities, growth assays were conducted on BLIS K12 and BLIS M18 for 18 h in M17 medium supplemented with varying concentrations (0.5% and 2.5% w/v) of galactose, raffinose, glucose, and fructose (Figure 1B), aligning with the duration required for the strains to produce antimicrobials.
Analysis of the growth dynamics (Figure 1B) revealed differences in the stimulatory effects of sugars on bacterial cell proliferation. For BLIS K12, the order of sugars impact on potency, from most to least stimulatory, was as follows: 2.5% and 0.5% glucose, 2.5% fructose, 2.5% and 0.5% raffinose, no additional sugar, 2.5% galactose, 0.5% fructose, and finally 0.5% galactose (all % is w/v) (Figure 1B). Conversely, BLIS M18 exhibited a different pattern, with 0.5% galactose being the most stimulatory, followed by 0.5% glucose, 2.5% galactose, 2.5% glucose, 0.5% and 2.5% raffinose, 2.5% fructose, no additional sugar, and 0.5% fructose (all % is w/v) (Figure 1B).
Interestingly, the observed growth boost did not translate to an increased antimicrobial activity. For example, while glucose stimulated the growth of BLIS K12, it did not lead to a concomitant enhancement in antimicrobial activity. In contrast, galactose, the least growth-stimulatory sugar, significantly increased antimicrobial activity. This difference suggests the increased antimicrobial production is not simply due to an increase in cell mass but more likely due to the sugars altering the regulation of genes responsible for making the antimicrobials.
3.2. Raffinose and Galactose Increase the Inhibitory Potency and Broaden the Range of Organisms Affected by BLIS K12 and BLIS M18
The ability of raffinose and galactose in enhancing inhibition potency prompted us to investigate their affect further. Concentration titrations were performed to determine the optimal concentrations of each sugar to enhance antimicrobial activity against a set of pathogens. Results indicated that 2.5% (w/v) raffinose and 0.5% (w/v) galactose were the most effective concentrations for both BLIS K12 and BLIS M18, as they yielded the highest mean inhibition zone increase and the largest number of species with increased inhibition (Figure 1C).
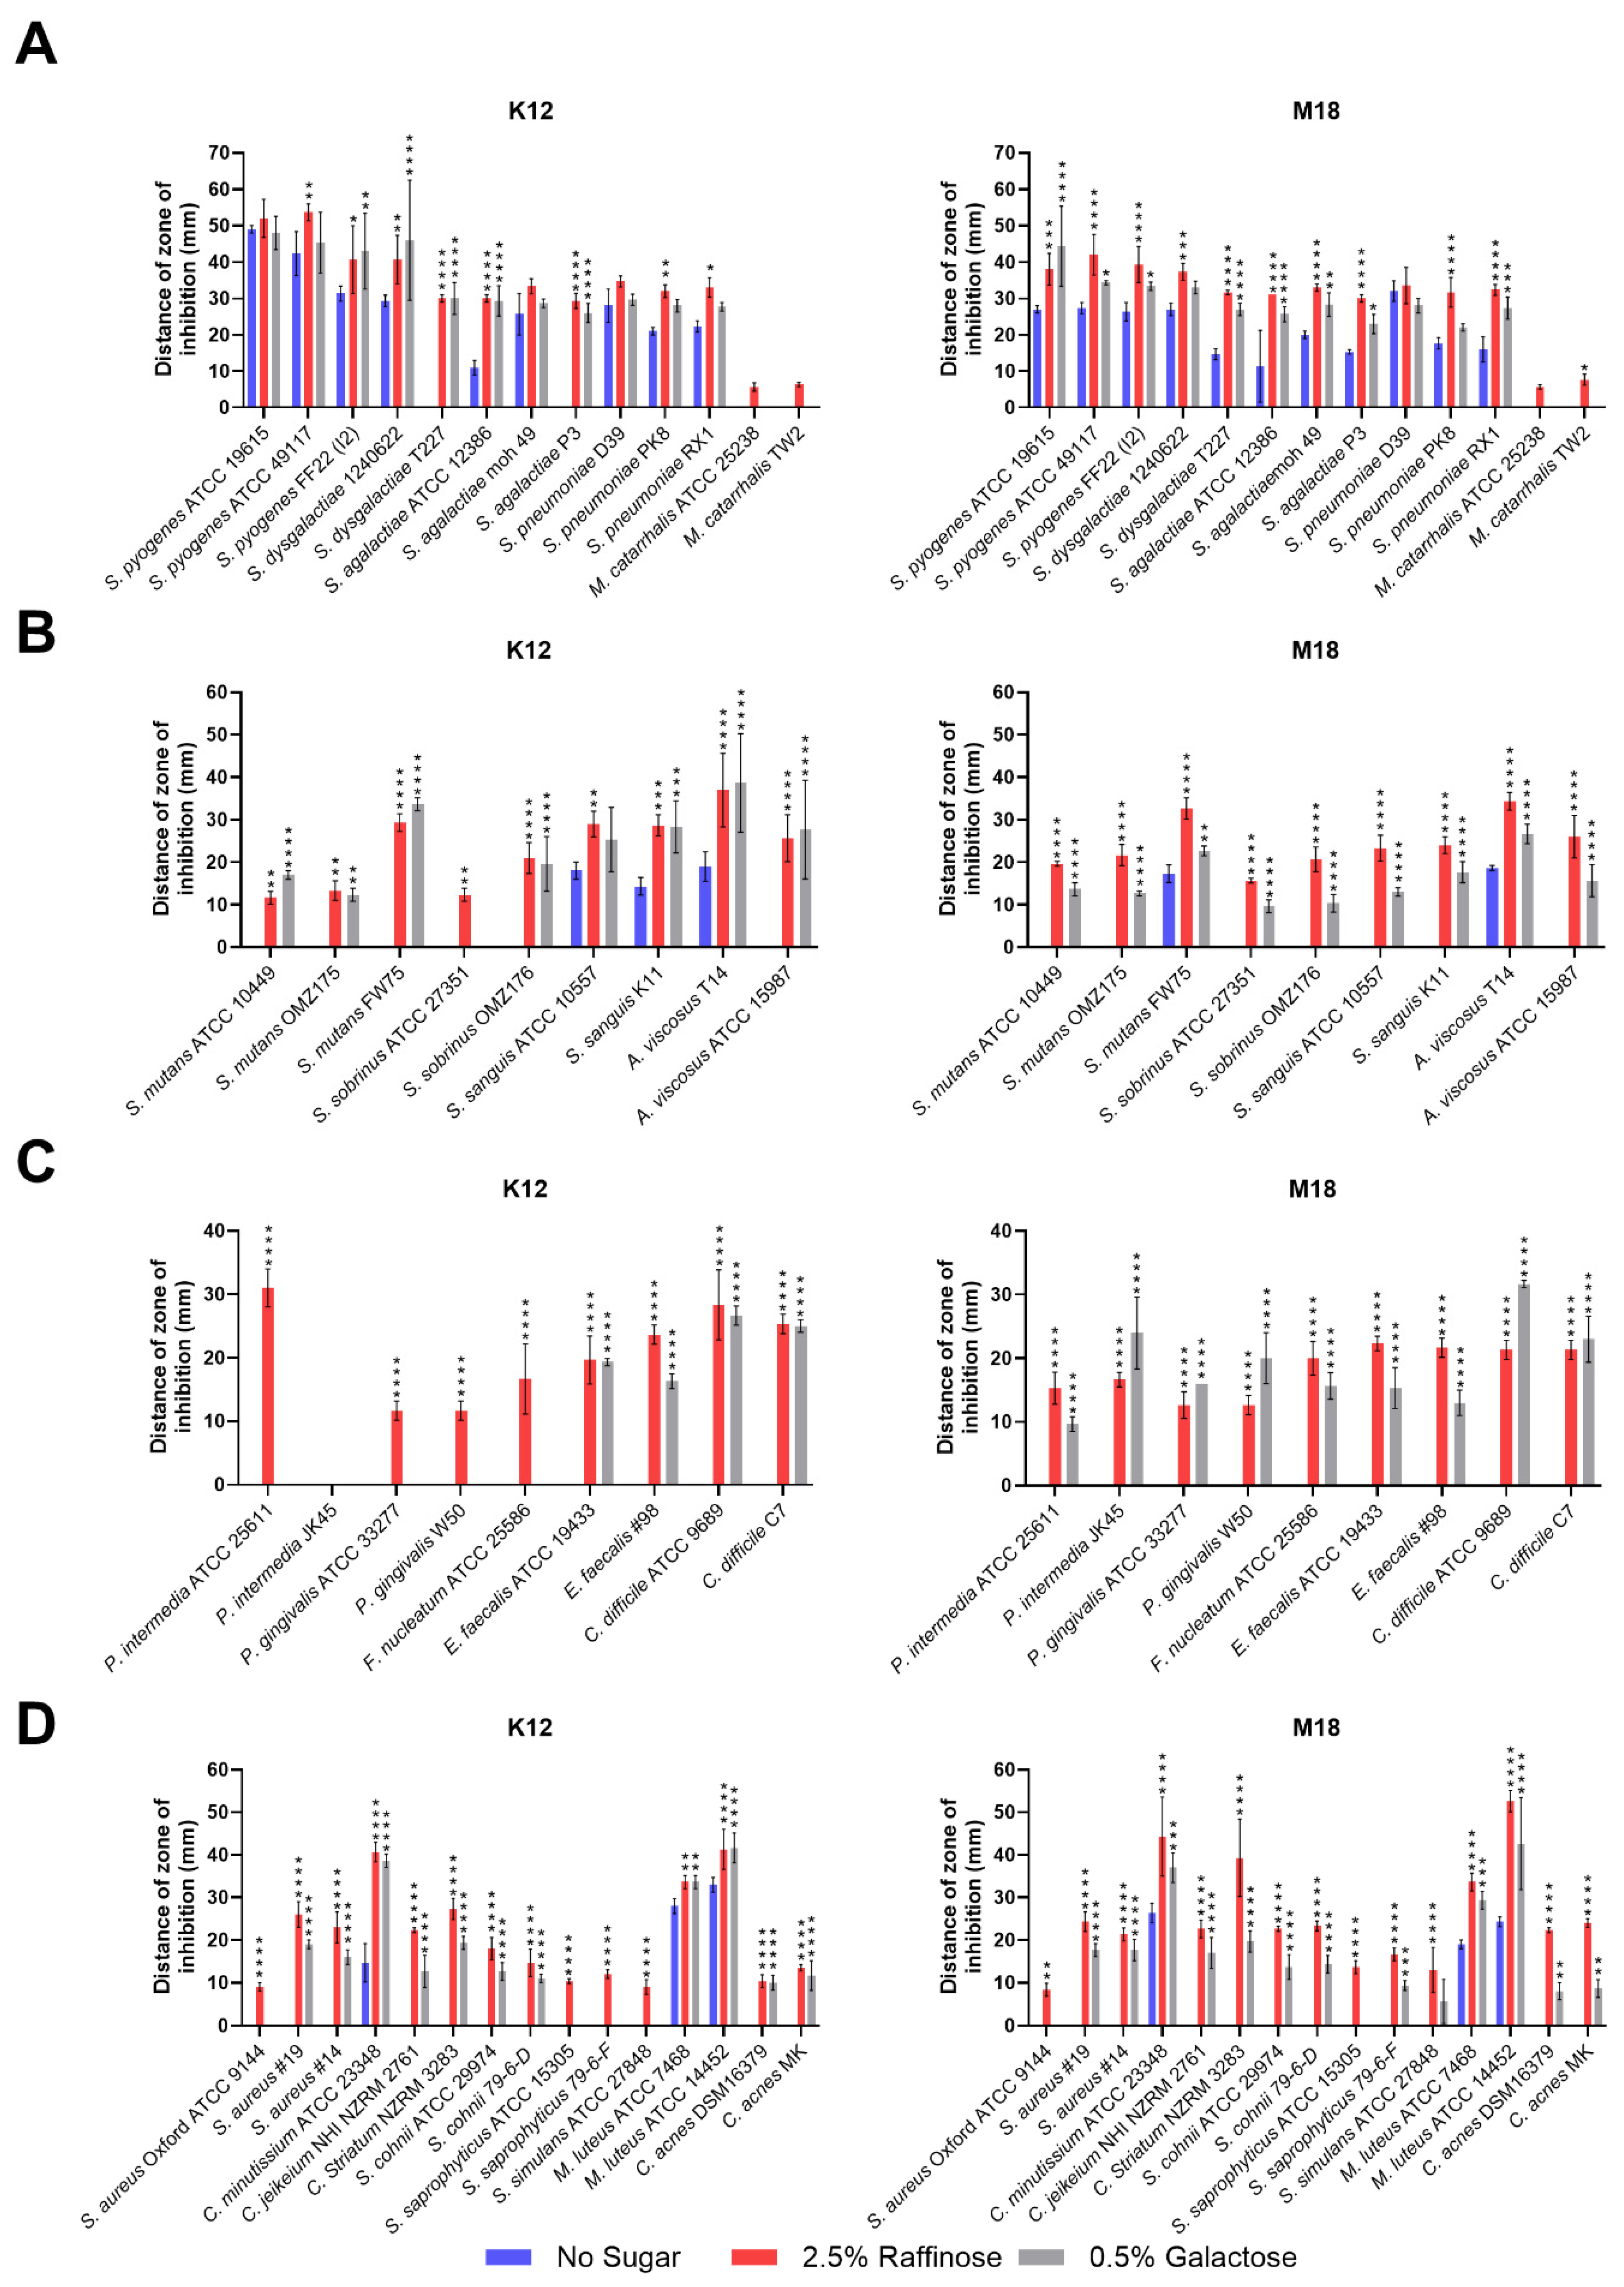
Once established, further tests at these concentrations were completed to evaluate whether BLIS K12 and BLIS M18 exhibited enhanced antimicrobial spectra against a wider more diverse range of bacterial species when supplemented with 2.5% (w/v) and 0.5% (w/v) of raffinose and galactose, respectively. A modified deferred antagonism assay was employed to eliminate the influence of pH changes induced by the different sugars. The result on the first set of bacteria tested demonstrated increased inhibition zone sizes against pharyngitis-causing bacteria, such as Streptococcus pyogenes and Streptococcus dysgalactiae, when supplemented with both raffinose and galactose compared to the no sugar control (Figure 2A). This trend extended pathogens associated with neonatal sepsis (Streptococcus agalactiae) and pneumonia (Streptococcus pneumoniae). However, for Moraxella catarrhalis, a causative agent for otitis media, only raffinose supplementation enhanced inhibition for both BLIS K12 and BLIS M18 (Figure 2A).
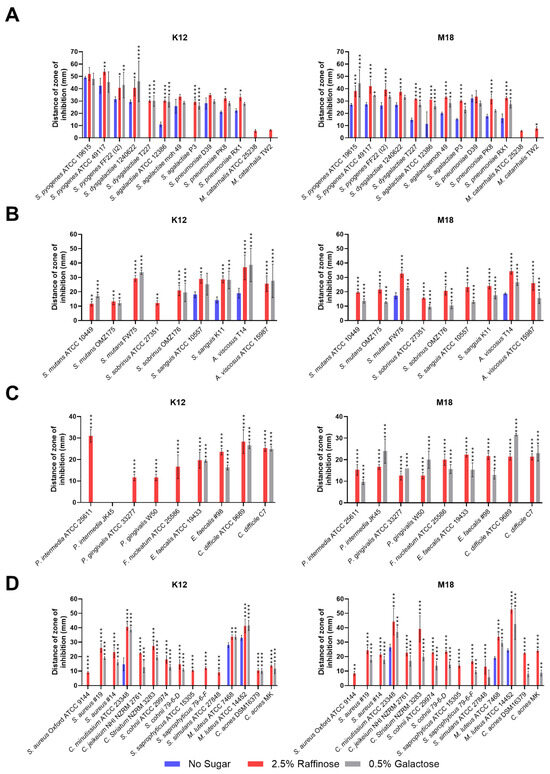
Figure 2.
Size of the inhibition zone for BLIS K12 and BLIS M18 on CABCa agar plates, containing 2.5% (w/v) raffinose or 0.5% (w/v) galactose or no sugar, across a range of bacterial species and strains associated with (A) pharyngitis, otitis media, pneumonia, and neonatal sepsis infections. (B) Teeth (C) periodontitis, halitosis, and gut (D) skin. Bars are means of biological replicates (n = 3, ±SD). (A–D) A two-way ANOVA with Dunnett’s multiple comparisons tests compared raffinose and galactose to the no sugar control. *, p < 0.05, **, p < 0.01, ***, p < 0.001, ****, p < 0.0001.
The second set of bacteria associated with dental caries, showed increased inhibition by both BLIS K12 and BLIS M18 for all Streptococcus mutans and Streptococcus sobrinus strains when grown on media containing both raffinose and galactose compared to the control (Figure 2B). Interestingly, one strain of S. sobrinus (ATCC 27351) displayed inhibition only when BLIS K12 supplemented with Raffinose, not Galactose.
In the third set of bacteria associated with halitosis/periodontitis and gut infections, divergent activity was observed for BLIS K12 and BLIS M18. BLIS K12 displayed increased inhibition against specific bacteria, including Prevotella intermedia, Porphyromonas gingivalis, and Fusobacterium nucleatum, only when grown with raffinose, not galactose. Conversely, BLIS M18 displayed increased inhibition when supplemented with both sugars against these bacteria (Figure 2C). For gut pathogens Enterococcus faecalis and Clostridium difficile, both BLIS K12 and BLIS M18 showed increased inhibition when grown on media supplemented with either raffinose or galactose (Figure 2C).
The final set of test bacteria assessed were associated with skin disorders. Here, both BLIS K12 and BLIS M18 displayed enhanced inhibition zones against all tested bacteria when grown on media containing either raffinose or galactose (Figure 2D). Interestingly, some strains, including, Staph. aureus Oxford and Staph. saprophyticus ATCC 15305, were only inhibited by BLIS K12 and BLIS M18 when grown on raffinose, in contrast, Staphylococcus saprophyticus and Staphylococcus simulans ATCC 27848, were only inhibited by BLIS K12 when supplemented with raffinose, while BLIS M18 inhibited them when only supplemented with galactose.
In conclusion, these findings demonstrate that supplementing with 2.5% (w/v) raffinose and 0.5% (w/v) galactose enhances the antimicrobial potency of BLIS K12 and BLIS M18 against a diverse range of bacteria associated with various body sites and diseases.
3.3. Raffinose and Galactose Cause Increased Expression of Lantibiotic Genes
To determine if this increased observation in inhibition was related to an increase in expression of lantibiotic genes we performed reverse transcriptase quantitative polymerase chain reaction (RT-qPCR) to measure the expression levels of key antimicrobial peptides: specifically, salivaricin A and salivaricin B for BLIS K12, and salivaricin A and salivaricin 9 for BLIS M18. Primers targeting the core peptide were designed for expression level analysis.
BLIS K12 and BLIS M18 were grown on solid media supplemented with various sugars: 2.5% (w/v) raffinose, 0.5% (w/v) galactose, a combination of both, 2.5% (w/v) glucose, and 0.5% (w/v) glucose, and then the transcriptional levels of salivaricins A, B, and 9 were measured using RT-qPCR.
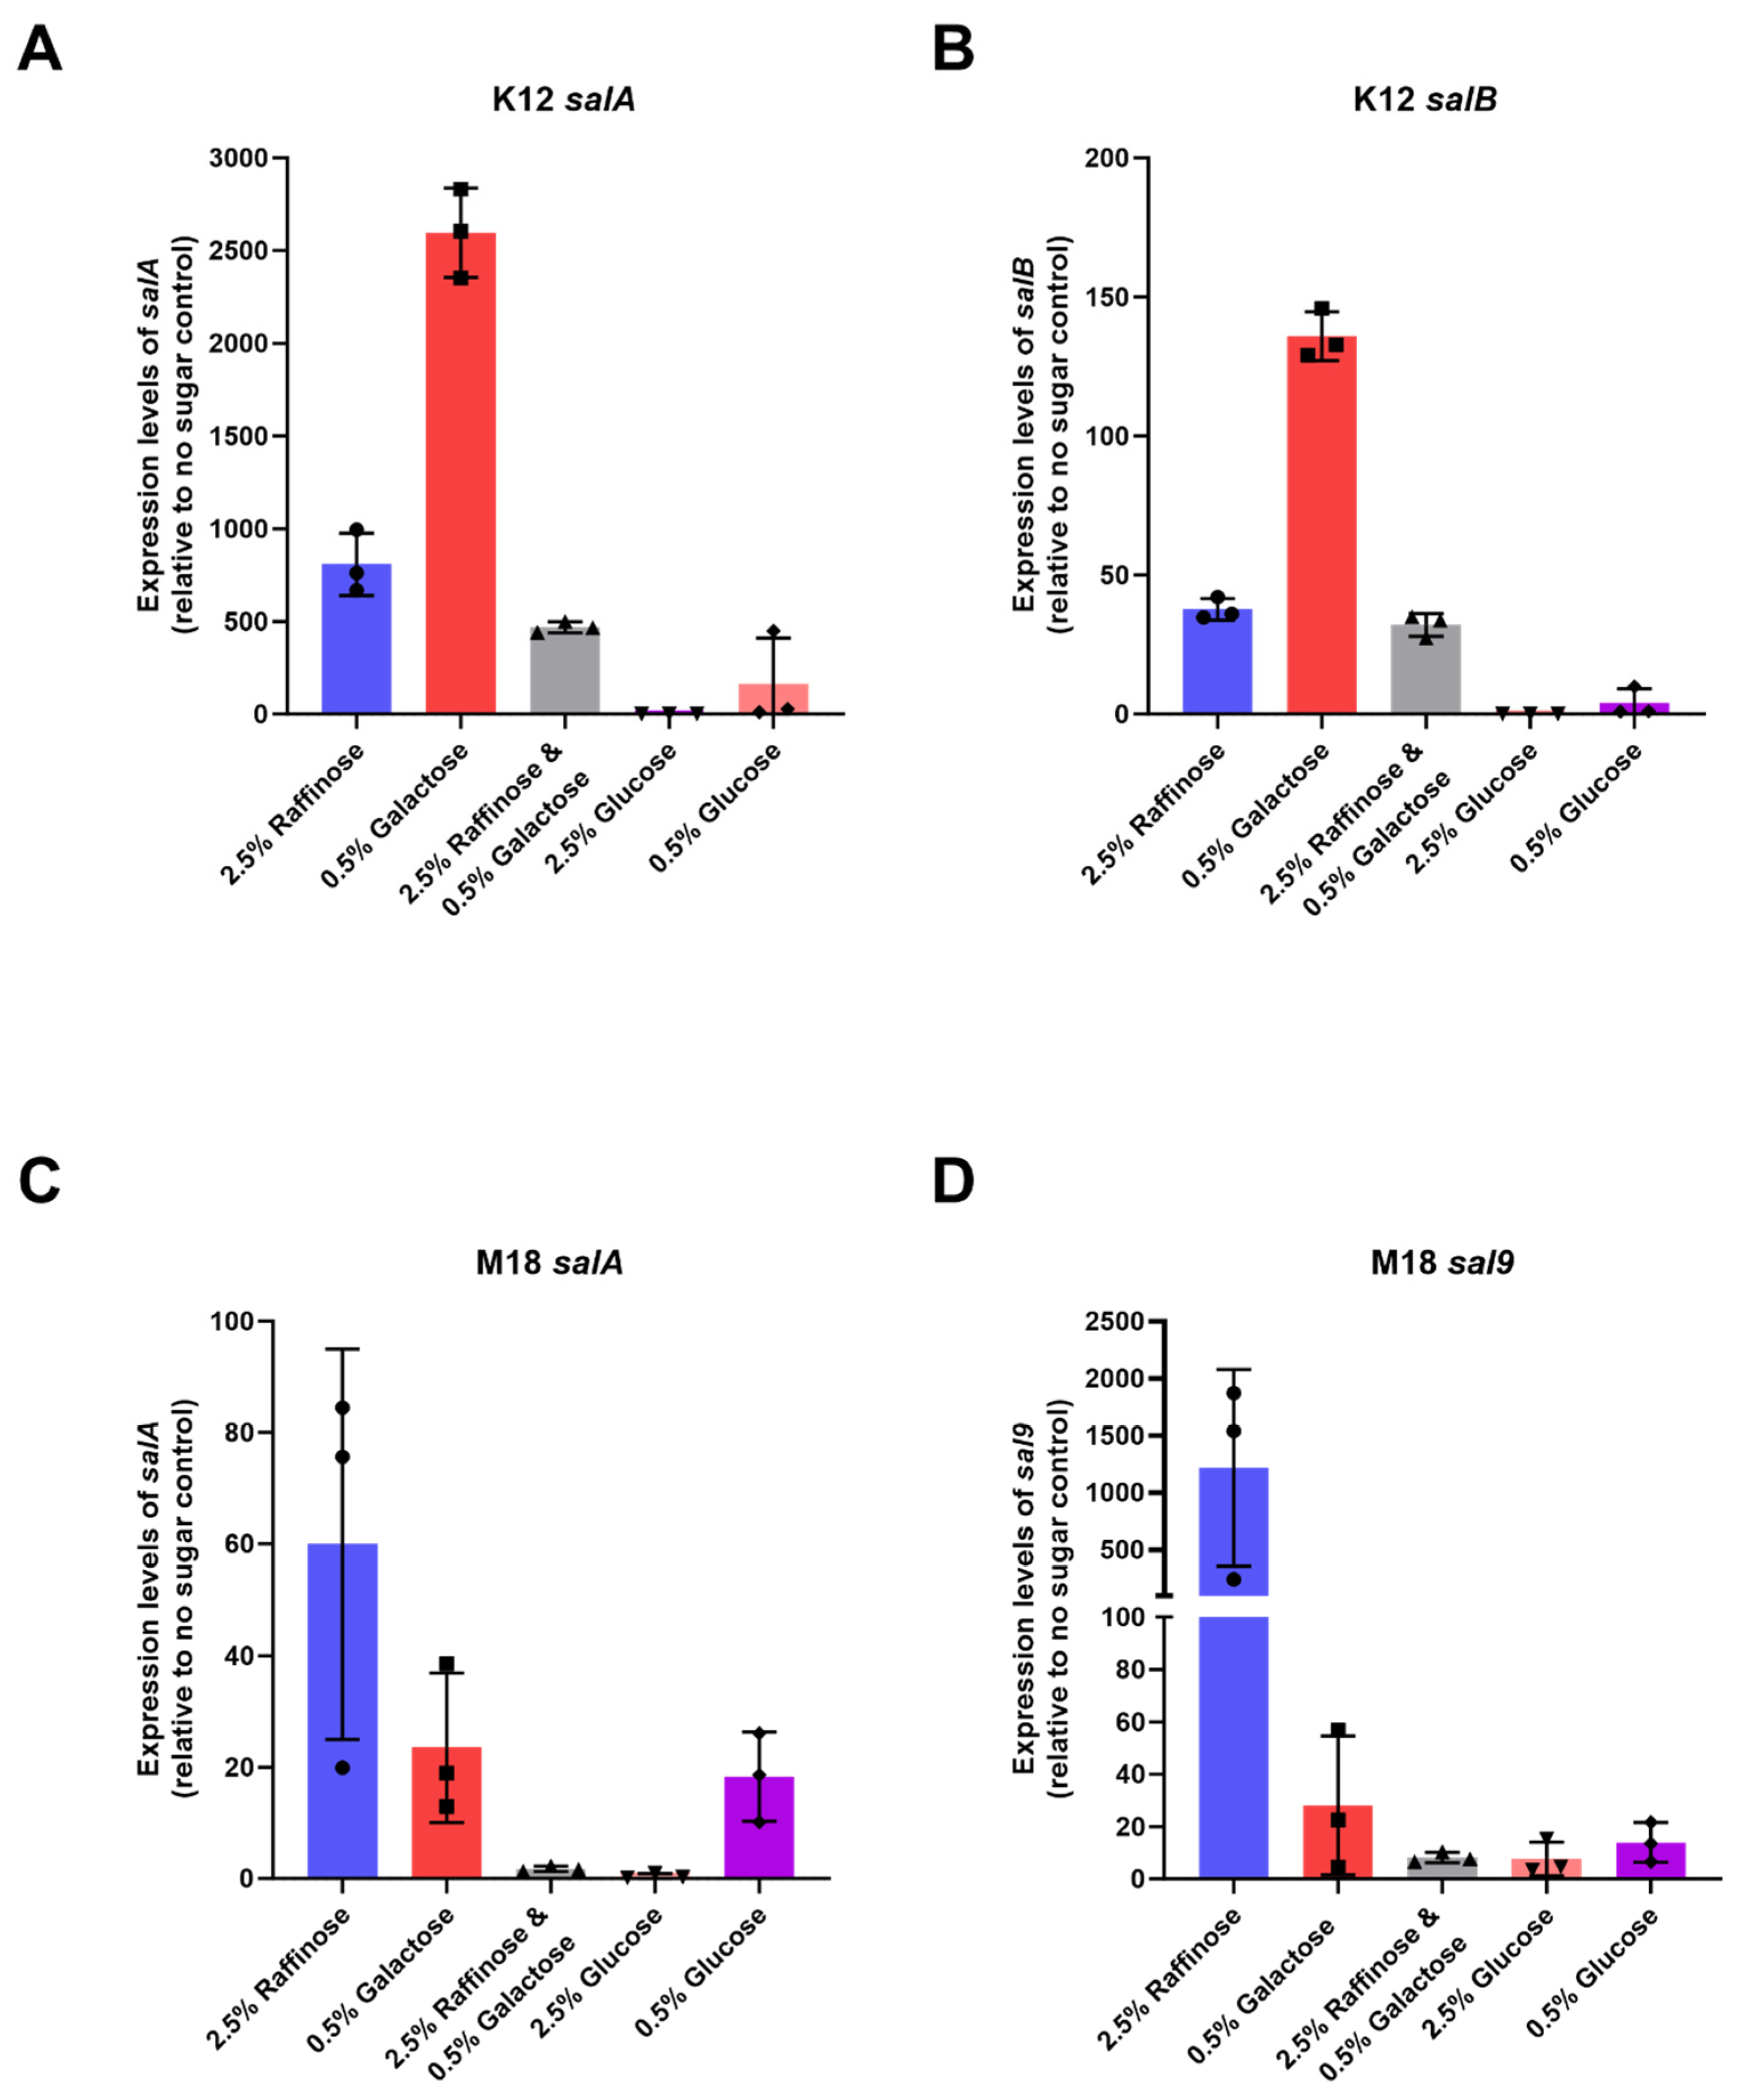
Our results showed a marked increase in BLIS K12’s expression of both salivaricin A and salivaricin B in BLIS K12 when grown with 2.5% (w/v) raffinose and 0.5% (w/v) galactose. Compared to the control, salA expression increased an average of 808-; and 2596-fold while salB expression increased 38- and 136-fold, respectively (Figure 3A,B). We observed a similar trend with BLIS M18, where an increased expression in salA and sal9 with a mean increase of 23- and 60-fold for salA and 28- and 1218-fold for sal9 (Figure 3C,D) was observed.
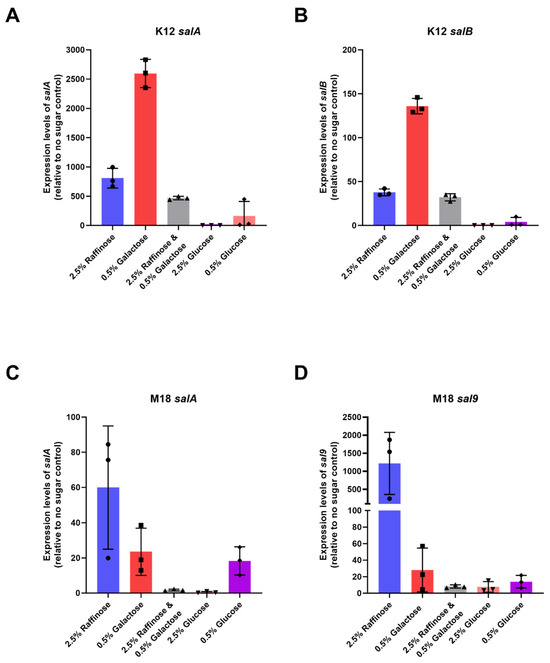
Figure 3.
Mean expression levels of (A) salA (B) salB in BLIS K12 and (C) salA (D) sal9 in BLIS M18, when grown on CABCa agar medium supplemented with different sugars relative to a no sugar control. Bars represent mean values with individual values shown as symbols (n = 3, ±SD).
Interestingly, the combination of galactose and raffinose resulted in a lower increase compared to the individual sugars for both strains. This suggests the sugars might not have an additive effect and could potentially interact causing a repressive effect (Figure 3). The 0.5% (w/v) glucose generated a marginal increase in expression in BLIS K12 and BLIS M18 whereas the 2.5% (w/v) glucose caused repression likely due to catabolite repression (Figure 3). In conclusion, our findings indicate that raffinose and galactose induce distinct expression patterns of these lantibiotic genes in BLIS K12 and BLIS M18. This differential expression likely contributes to the previously observed enhancement in antimicrobial activity in Figure 1 and Figure 2.
4. Discussion
Probiotics are defined to deliver a health benefit to the consumer [24]. How a probiotic delivers its benefits comprises several different potential mechanisms [25] including boosting immunity, colonisation (competitive exclusion), production of beneficial metabolites including antimicrobial molecules. Probiotic S. salivarius BLIS K12 and M18 were some of the original probiotic strains developed for application to the oral cavity. Amongst their key probiotic benefits defined was the ability to produce bacteriocin like inhibitory substance (BLIS)—small gene encoded peptide antimicrobials with a narrow spectrum of inhibition action [26]. Subsequent clinical trials demonstrated that BLIS K12 could reduce episodes of recurrent sore throats, otitis media, improve halitosis while BLIS M18 has shown to improve dental health, including a reduction in plaque building and reduction in gum disease—all diseases influenced by pathogenic members of the oral microbiome. In part the mechanism behind these improved health benefits could be attributed to the antimicrobial molecules naturally produced by the probiotic strains. Our interest in this study was to identify whether formulating certain sugars in with these probiotic stains could enhance the production of benefits with a focus on bacteriocins to help deliver an improved health effects starting with an enhanced antimicrobial effect.
To achieve this, our investigation began at identifying sugars that could enhance the antimicrobial activity of the oral probiotics S. salivarius BLIS K12 and BLIS M18. We observed a consistent trend amongst certain sugars; namely—raffinose, galactose, lactose, and lactulose—interestingly, all of which contained at least one galactose monomer within their structures. This suggests a potential regulatory role of galactose in controlling the production of specific lantibiotics by BLIS K12 and BLIS M18, aligning with findings from Cheigh et al. [27] who found that lactose and galactose induced transcription of the nisZ pre-peptide gene in Lactococcus lactis subsp. lactis A164, indicating a concentration-dependent induction mechanism unique to the nisZ promoter.
The varying performance of these galactose-containing sugars likely stems from two key factors; (1) differences in the molar amounts of galactose within the tri/disaccharide; and (2) the metabolic capabilities of the bacteria and the specific sugar breakdown processes involved. Cheigh et al.’s [27] study further emphasizes this point, showing that cells grown on lactose produced significantly more nisin Z compared to those grown on other carbon sources, suggesting the importance of carbon source selection in optimising antimicrobial peptide production.
In this study, the monosaccharide galactose exhibited optimal performance at lower concentrations, while the trisaccharide raffinose showed superior efficacy at higher concentrations. This trend aligns with Cheigh et al.’s [27] findings on the differential induction by lactose and galactose. Conversely, sugar alcohols such as xylitol and isomalt showed minimum enhancement, likely due to the inability of BLIS K12 and BLIS M18 to metabolize them effectively.
The concentration-dependent response of raffinose and galactose on antimicrobial activity suggests the presence of a tightly controlled, concentration-dependent genetic switch governing these effects, similar to the regulation of nisZ by lactose and galactose in Cheigh et al.’s [27] study. Interestingly the metabolic utilisation of galactose has two potential pathways; the Leloir and Tagatose pathways, each with distinct regulatory control systems [28]. GalR, the key repressor of Leloir pathway, emerges as the potential regulator responsible for the observed transcriptional changes, as it is known to influence gene expression beyond galactose metabolism in other bacterial species [29]. Alternatively, the other potential regulator candidates are LacR and LacT, the repressor and activator, respectively, of key genes within the tagatose pathway [30]. A future investigation should delve into the genetic mechanisms of GalR, LacR and LacT in BLIS K12 and BLIS M18 to precisely identify how this antimicrobial activity is triggered.
Supplementation with raffinose and galactose resulted in improved inhibition profiles of BLIS K12 and BLIS M18, opening new avenues for utilising these strains as probiotics. BLIS K12 and BLIS M18 are currently marketed for oral cavity probiotic applications targeting various conditions such as pharyngitis, halitosis, periodontal disease, tooth caries, and overall oral health. Our findings suggest that incorporating raffinose or galactose into BLIS K12 and BLIS M18 probiotics could enhance their efficacy against these conditions, given the increased susceptibility of relevant etiologically implicated bacteria to inhibition observed. Moreover, our results indicate the potential application of BLIS K12 and BLIS M18 probiotics beyond the oral cavity, particularly for the gut and skin, especially when combined with synbiotic sugars like raffinose or galactose. This is supported by the observed inhibition against key undesirable bacteria in these sites, including Clostridium difficile and Cutibacterium acnes, respectively.
The regulatory mechanisms governing the upregulation of the lantibiotic genes salA, salB, and sal9 warrant further investigation. Although previous studies have implicated galactose in the upregulation of nisin A production in Lactococcus lactis ATCC 11454 [31], the exact regulatory pathways remain elusive. GalR or LacR/T emerges as potential candidate regulators, although the involvement of other regulators cannot be discounted given the diverse metabolic pathways associated with galactose metabolism. Our observations of differential regulation of salA, salB, and sal9 between BLIS K12 and BLIS M18 underscore the complexity of regulatory networks governing lantibiotic production, a complexity echoed in Cheigh et al.’s [27] study regarding the unique induction mechanisms observed for nisin Z biosynthesis.
The lack of perfect correlation between regulatory upregulation and phenotypic results suggests additional layers of regulation beyond RNA expression levels. Furthermore, the influence of various sugars on the lantibiotic susceptibility of undesirable bacteria within the microbiome also warrants additional consideration, as observed in the diverse fermentation capabilities of raffinose and galactose by bacteria either persistently inhabiting or adventitiously interacting with the human microbiome.
Elucidating the precise mechanisms by which raffinose and galactose modulate the expression of salA, salB, and sal9, as well as exploring their interaction with bacteria susceptible to BLIS K12 and BLIS M18 within the microbiome, requires further investigation. Clinical trials demonstrating enhanced in vivo performance against susceptible pathogens would provide strong clinical support for using raffinose and galactose as synbiotics for BLIS K12 and BLIS M18 in oral health applications.
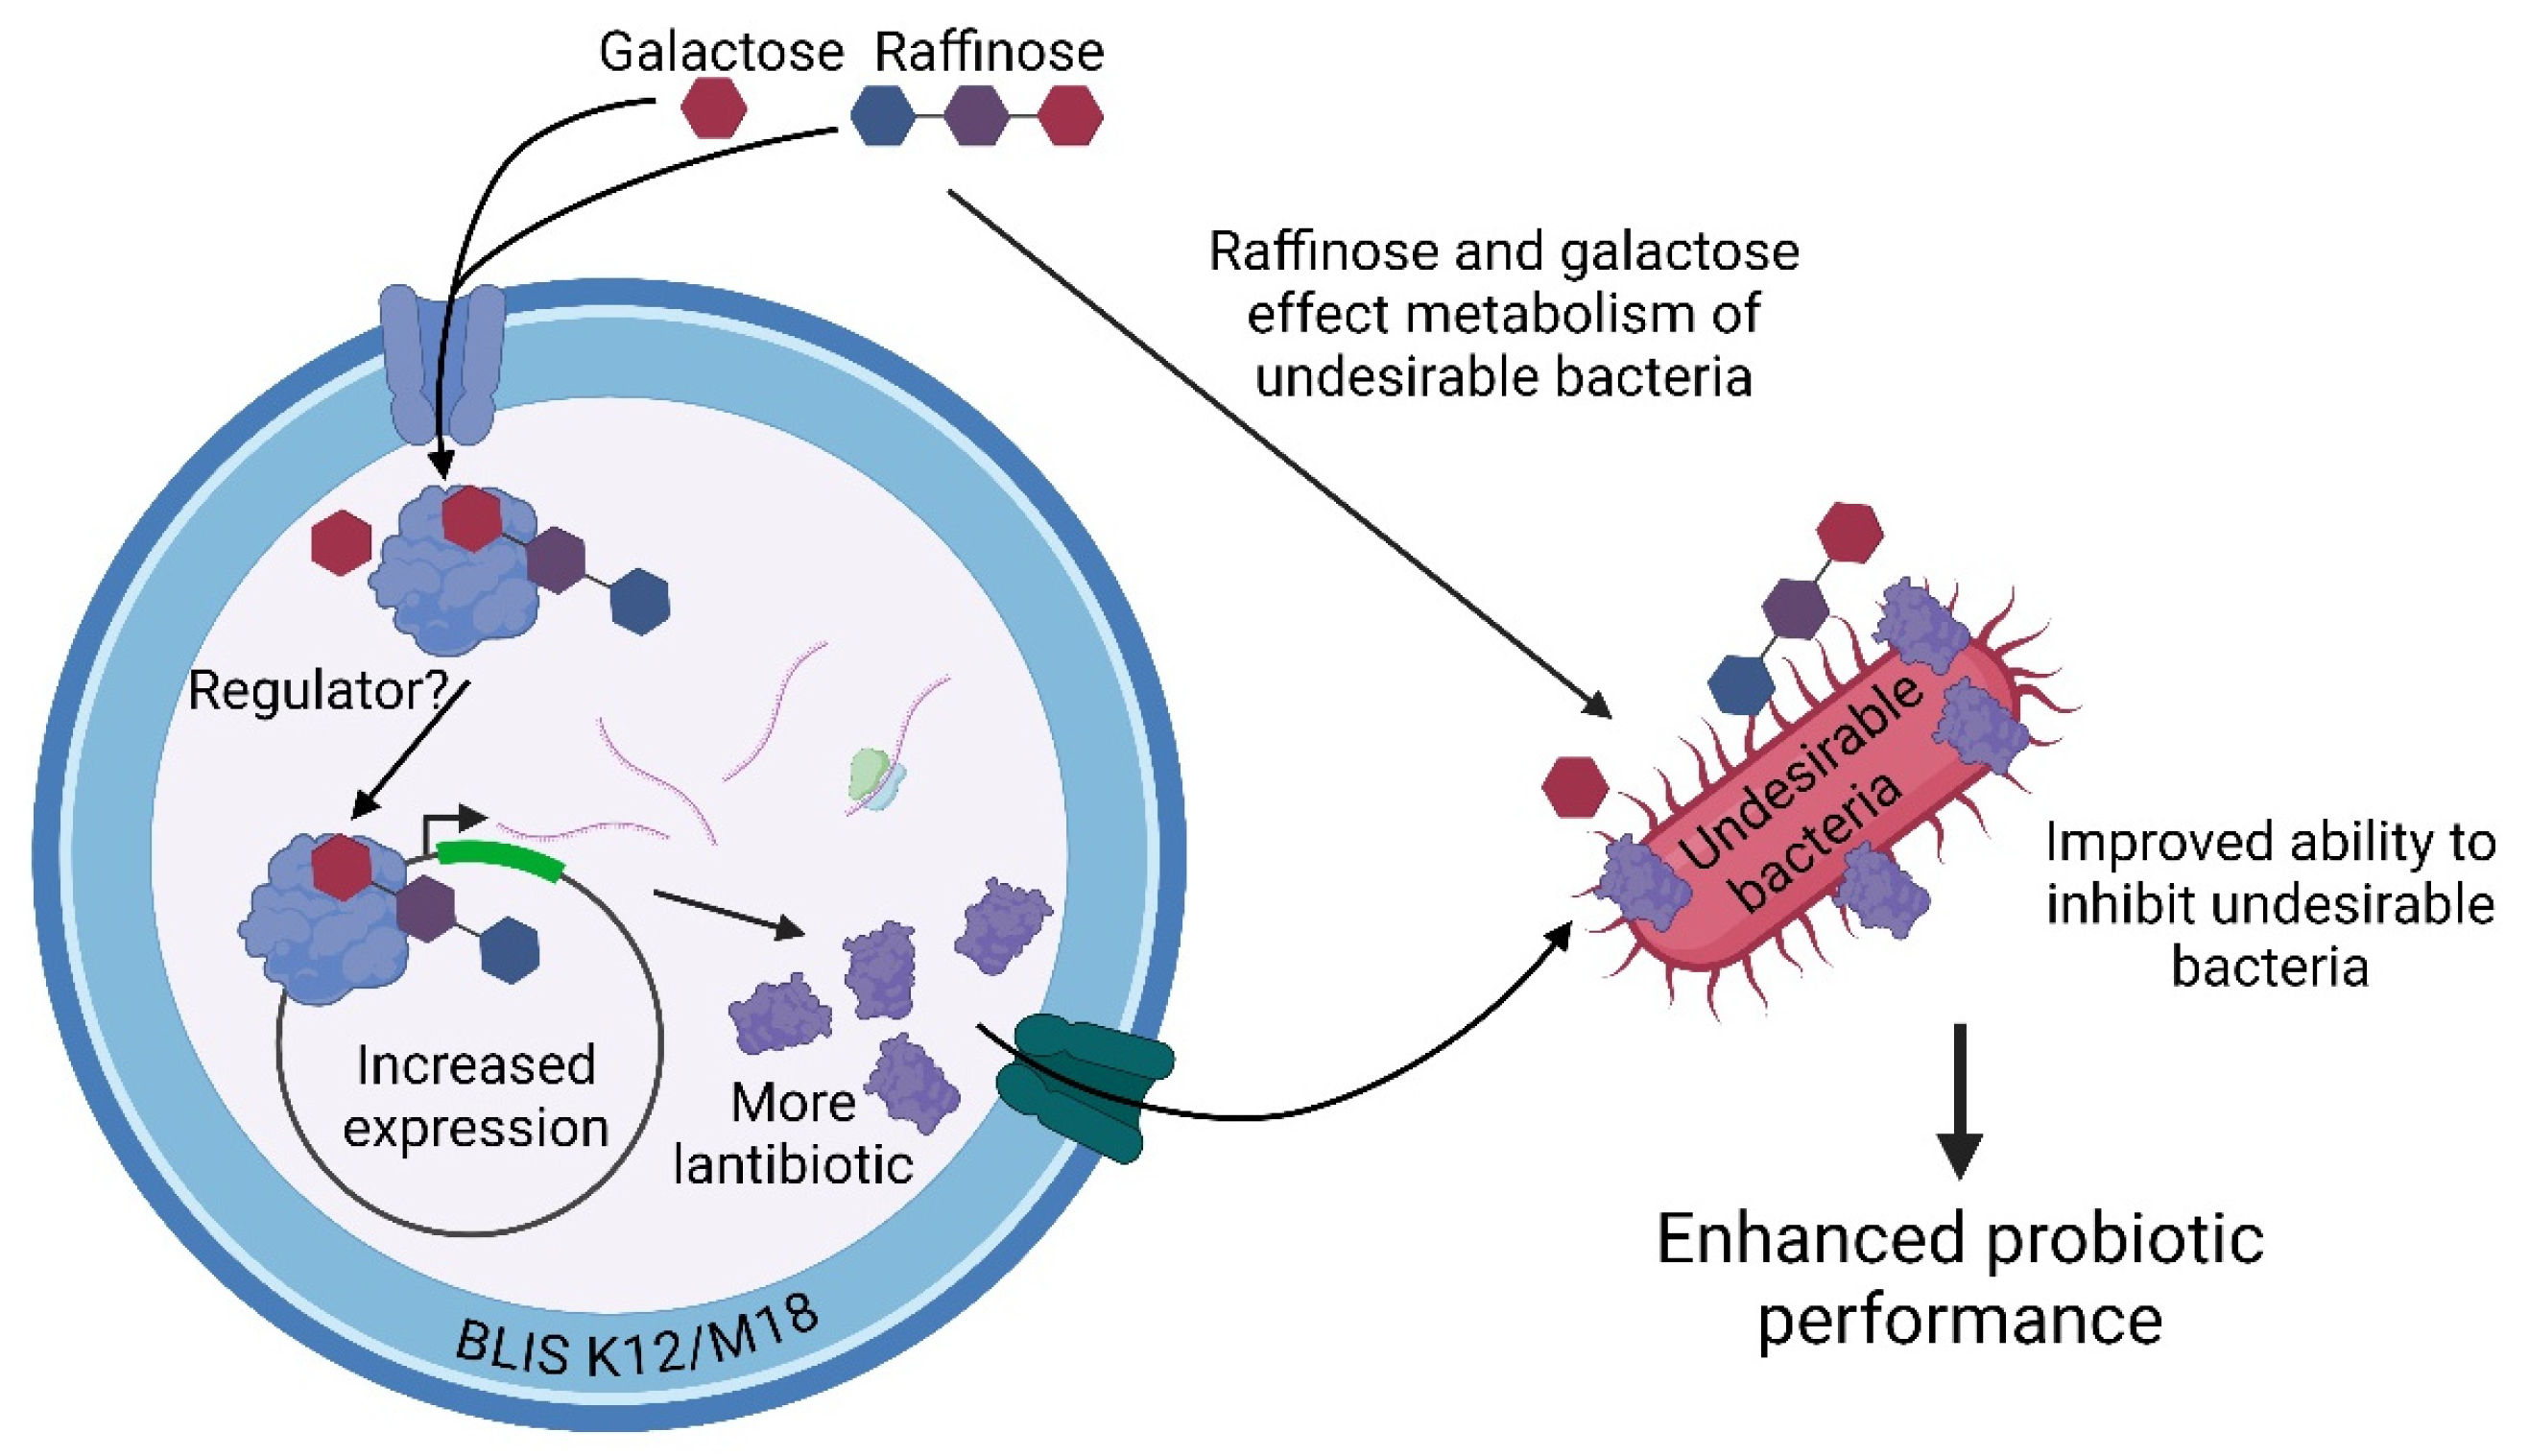
Our work suggests two potential mechanisms by which raffinose and galactose may enhance the potency and inhibitory spectrum of BLIS K12 and BLIS M18 (Figure 4). Pathway 1 proposes that these synbiotic sugars are recognized by BLIS K12 or BLIS M18, leading to increased expression of lantibiotic genes and ultimately enhanced production of lantibiotics against various pathogens. Pathway 2 suggests that raffinose and galactose influence the metabolism of pathogenic bacteria, making them more susceptible to the lantibiotics produced by BLIS K12 and BLIS M18. This translates to increased potency of the probiotic strains against these pathogens. Consequently, the overall activity of the synbiotic is enhanced.
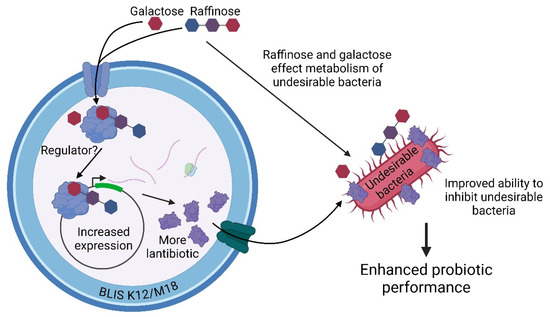
Figure 4.
Illustrates the potential mechanisms by which the synbiotic sugars, raffinose and galactose enhance the probiotic performance of BLIS K12 and BLIS M18. Created with Created in BioRender. Hale, J. (2024) BioRender.com/g80w234 (accessed on 13 September 2024).
5. Conclusions
Our study demonstrates that supplementing BLIS K12 and BLIS M18 with 2.5% (w/v) raffinose or 0.5% (w/v) galactose significantly enhances the antimicrobial activity. This enhanced activity is partially mediated by the upregulation of the lantibiotic peptides genes (salA, salB and sal9) in both strains. Furthermore, raffinose and galactose may also influence the susceptibility of undesirable bacteria to these lantibiotics. Notably, this synergistic effect broadens the spectrum of activity against undesirable bacteria across diverse body sites, including the mouth, skin and gut. These findings strongly suggest that raffinose and galactose act as synbiotics, enhancing the potency and spectrum of inhibitory activity against pathogens of BLIS K12 and M18 probiotics.
6. Patents
This work is work is covered by patent WO/2023/053073.
Author Contributions
Conceptualization: J.R.T. and J.D.F.H.; Data curation: L.K.H., N.C.J. and S.L.B.; Formal analysis: L.K.H., N.C.J., S.L.B. and R.J.; Investigation: L.K.H., N.C.J., S.L.B., A.L.V., R.J., J.R.T. and J.D.F.H.; Methodology: L.K.H., N.C.J., S.L.B., A.L.V., J.R.T. and J.D.F.H.; Project administration: L.K.H. and J.D.F.H.; Supervision: L.K.H., R.J., J.R.T. and J.D.F.H.; Writing—original draft: L.K.H., N.C.J., J.R.T. and J.D.F.H.; Writing—review & editing: L.K.H., N.C.J., S.L.B., A.L.V., R.J., J.R.T. and J.D.F.H. All authors have read and agreed to the published version of the manuscript.
Funding
This research received no external funding.
Data Availability Statement
Dataset available on request from the authors.
Conflicts of Interest
L.K.H., N.C.J., S.L.B., A.L.V., R.J., J.R.T., and J.D.F.H. are employees of Blis Technologies the suppliers of BLIS K12 and M18.
References
- Kuipers, O.P.; Beerthuyzen, M.M.; de Ruyter, P.G.G.; Luesink, E.J.; de Vos, W.M. Autoregulation of Nisin Biosynthesis in Lactococcus lactis by Signal Transduction. J. Biol. Chem. 1995, 270, 27299–27304. [Google Scholar] [CrossRef] [PubMed]
- Stein, T.; Borchert, S.; Kiesau, P.; Heinzmann, S.; Klöss, S.; Klein, C.; Helfrich, M.; Entian, K. Dual control of subtilin biosynthesis and immunity in Bacillus subtilis. Mol. Microbiol. 2002, 44, 403–416. [Google Scholar] [CrossRef] [PubMed]
- Botsford, J.L.; Harman, J.G. Cyclic AMP in prokaryotes. Microbiol. Rev. 1992, 56, 100–122. [Google Scholar] [CrossRef]
- Fic, E.; Bonarek, P.; Górecki, A.; Kedracka-Krok, S.; Mikolajczak, J.; Polit, A.; Tworzydlo, M.; Dziedzicka-Wasylewska, M.; Wasylewski, Z. CAMP receptor protein from escherichia coli as a model of signal transduction in proteins—A review. J. Mol. Microbiol. Biotechnol. 2009, 17, 1–11. [Google Scholar] [CrossRef] [PubMed]
- Hynes, W.L.; Tagg, J.R. Proteinase-related broad-spectrum inhibitory activity among group-A streptococci. J. Med. Microbiol. 1986, 22, 257–264. [Google Scholar] [CrossRef]
- Tagg, J.R.; Dajani, A.S.; Wannamaker, L.W. Bacteriocin of a Group B Streptococcus: Partial Purification and Characterization. Antimicrob. Agents Chemother. 1975, 7, 764–772. [Google Scholar] [CrossRef][Green Version]
- Tagg, J.R.; Russell, C. Bacteriocin production by Streptococcus salivarius strain P. Can. J. Microbiol. 1981, 27, 918–923. [Google Scholar] [CrossRef]
- Simmonds, R.S.; Naidoo, J.; Jones, C.L.; Tagg, J.R. The Streptococcal Bacteriocin-like Inhibitory Substance, Zoocin A, Reduces the Proportion of Streptococcus mutans in an Artificial Plaque. Microb. Ecol. Health Dis. 1995, 8, 281–292. [Google Scholar] [CrossRef][Green Version]
- Tagg, J.R.; Wannamaker, L.W. Streptococcin A-FF22: Nisin-like antibiotic substance produced by a group A streptococcus. Antimicrob. Agents Chemother. 1978, 14, 31–39. [Google Scholar] [CrossRef][Green Version]
- Ross, K.F.; Ronson, C.W.; Tagg, J.R. Isolation and characterization of the lantibiotic salivaricin A and its structural gene salA from Streptococcus salivarius 20P3. Appl. Environ. Microbiol. 1993, 59, 2014–2021. [Google Scholar] [CrossRef]
- Hyink, O.; Wescombe, P.A.; Upton, M.; Ragland, N.; Burton, J.P.; Tagg, J.R. Salivaricin A2 and the novel lantibiotic salivaricin B are encoded at adjacent loci on a 190-kilobase transmissible megaplasmid in the oral probiotic strain Streptococcus salivanus K12. Appl. Environ. Microbiol. 2007, 73, 1107–1113. [Google Scholar] [CrossRef] [PubMed]
- Wescombe, P.A.; Upton, M.; Renault, P.; Wirawan, R.E.; Power, D.; Burton, J.P.; Chilcott, C.N.; Tagg, J.R. Salivaricin 9, a new lantibiotic produced by Streptococcus salivarius. Microbiology 2011, 157, 1290–1299. [Google Scholar] [CrossRef]
- Di Pierro, F.; Di Pasquale, D.; Di Cicco, M. Oral use of Streptococcus salivarius K12 in children with secretory otitis media: Preliminary results of a pilot, uncontrolled study. Int. J. Gen. Med. 2015, 8, 303. [Google Scholar] [CrossRef] [PubMed]
- Di Pierro, F.; Colombo, M. The administration of S. salivarius K12 to children may reduce the rate of SARS-CoV-2 infection. Minerva Med. 2021, 112, 514–516. [Google Scholar] [CrossRef]
- Di Pierro, F.; Adami, T.; Rapacioli, G.; Giardini, N.; Streitberger, C. Clinical evaluation of the oral probiotic Streptococcus salivarius K12 in the prevention of recurrent pharyngitis and/or tonsillitis caused by Streptococcus pyogenes in adults. Expert. Opin. Biol. Ther. 2013, 13, 339–343. [Google Scholar] [CrossRef] [PubMed]
- Laws, G.L.; Hale, J.D.F.; Kemp, R.A. Human Systemic Immune Response to Ingestion of the Oral Probiotic Streptococcus salivarius BLIS K12. Probiotics Antimicrob Proteins 2021, 13, 1521–1529. [Google Scholar] [CrossRef]
- Laws, G.A.; Harold, L.K.; Tagg, J.R.; Hale, J.D.F. Interferon Gamma Response in Human Saliva Following Exposure to the Oral Probiotic Streptococcus salivarius BLIS K12. Probiotics Antimicrob Proteins 2022, 16, 93–98. [Google Scholar] [CrossRef]
- Burton, J.; Chilcott, C.; Moore, C.; Speiser, G.; Tagg, J. A preliminary study of the effect of probiotic Streptococcus salivarius K12 on oral malodour parameters. J. Appl. Microbiol. 2006, 100, 754–764. [Google Scholar] [CrossRef]
- Babina, K.; Salikhova, D.; Doroshina, V.; Makeeva, I.; Zaytsev, A.; Uvarichev, M.; Polyakova, M.; Novozhilova, N. Antigingivitis and Antiplaque Effects of Oral Probiotic Containing the Streptococcus salivarius M18 Strain: A Randomized Clinical Trial. Nutrients 2023, 15, 3882. [Google Scholar] [CrossRef]
- Tagg, J.R.; Bannister, L.V. “Fingerprinting” β-haemolytic streptococci by their production of and sensitivity to bacteriocine-like inhibitors. J. Med. Microbiol. 1979, 12, 397–411. [Google Scholar] [CrossRef]
- Chomczynski, P. A reagent for the single-step simultaneous isolation of RNA, DNA and proteins from cell and tissue samples. Biotechniques 1993, 15, 532–534, 536. [Google Scholar]
- Pfaffl, M.W. Quantification strategies in real-time PCR. A-Z Quant. PCR 2004, 1, 87–112. [Google Scholar]
- Vandesompele, J.; De Preter, K.; Pattyn, F.; Poppe, B.; Van Roy, N.; De Paepe, A.; Speleman, F. Accurate normalization of real-time quantitative RT-PCR data by geometric averaging of multiple internal control genes. Genome Biol. 2002, 3, research0034.1. [Google Scholar] [CrossRef] [PubMed]
- FAO/WHO. Guidelines for the Evaluation of Probiotics in Food (Working Group on Drafting Guidelines for the Evaluation of Probiotics in Food); Food and Agriculture Organization of the United Nations World Health Organization: Rome, Italy, 2002; Volume 21. [Google Scholar]
- Tagg, J.R.; Harold, L.K.; Jain, R.; Hale, J.D.F. Beneficial modulation of human health in the oral cavity and beyond using bacteriocin-like inhibitory substance-producing streptococcal probiotics. Front. Microbiol. 2023, 14, 1161155. [Google Scholar] [CrossRef]
- Tagg, J.R. Bacteriocins of Gram-Positive Bacteria: An Opinion Regarding their Nature, Nomenclature and Numbers. In Bacteriocins, Microcins and Lantibiotics; Springer: Berlin/Heidelberg, Germany, 1992; pp. 33–35. [Google Scholar] [CrossRef]
- Cheigh, C.-I.; Sang, J.L.; Yu-Ryang, P.; An, D.-J.; Hwang, Y.-S.; Chung, Y.; Park, H. The Effect of Carbon Sources on Nisin Z Biosynthesis in Lactococcus Lactis subsp. Lactis A164. J. Microbiol. Biotechnol. 2005, 15, 1152–1157. [Google Scholar]
- Iskandar, C.F.; Cailliez-Grimal, C.; Borges, F.; Revol-Junelles, A.M. Review of lactose and galactose metabolism in Lactic Acid Bacteria dedicated to expert genomic annotation. Trends Food Sci. Technol. 2019, 88, 121–132. [Google Scholar] [CrossRef]
- Qian, Z.; Trostel, A.; Lewis, D.E.A.; Lee, S.J.; He, X.; Stringer, A.M.; Wade, J.T.; Schneider, T.D.; Durfee, T.; Adhya, S. Genome-wide transcriptional regulation and Chromosome structural arrangement by GalR in E. coli. Front. Mol. Biosci. 2016, 3, 74. [Google Scholar] [CrossRef]
- Afzal, M.; Shafeeq, S.; Kuipers, O.P. LacR is a repressor of lacABCD and LacT is an activator of lacTFEG, constituting the lac gene cluster in Streptococcus pneumoniae. Appl. Environ. Microbiol. 2014, 80, 5349–5358. [Google Scholar] [CrossRef]
- Chandrapati, S.; O’Sullivan, D.J. Characterization of the promoter regions involved in galactose- and nisin-mediated induction of the nisA gene in Lactococcus lactis ATCC 11454. Mol. Microbiol. 2002, 46, 467–477. [Google Scholar] [CrossRef]
Disclaimer/Publisher’s Note: The statements, opinions and data contained in all publications are solely those of the individual author(s) and contributor(s) and not of MDPI and/or the editor(s). MDPI and/or the editor(s) disclaim responsibility for any injury to people or property resulting from any ideas, methods, instructions or products referred to in the content. |
© 2024 by the authors. Licensee MDPI, Basel, Switzerland. This article is an open access article distributed under the terms and conditions of the Creative Commons Attribution (CC BY) license (https://creativecommons.org/licenses/by/4.0/).

