Article

Microbiome Dynamics in Samia cynthia ricini: Impact of Growth Stage and Dietary Variations

1
Centre for the Environment, Indian Institute of Technology Guwahati, Guwahati 781039, India
2
Department of Biosciences and Bioengineering, Indian Institute of Technology Guwahati, Guwahati 781039, India
*
Author to whom correspondence should be addressed.
Appl. Microbiol. 2025, 5(2), 40; https://doi.org/10.3390/applmicrobiol5020040
Submission received: 1 April 2025 / Revised: 22 April 2025 / Accepted: 22 April 2025 / Published: 24 April 2025

Abstract

:
This study investigates the gut microbiome of Samia cynthia ricini, a domesticated silkworm species in Assam and Northeast India that is known for its Eri-silk production. Samples were collected at various growth stages and under different dietary conditions, generating 6341 features. The 5th instar larvae of the Eri-fed group exhibited the highest feature count, while moths from the same group had the lowest. The microbiome was characterized by 11 dominant taxa, mainly Proteobacteria, Firmicutes, Actinobacteria, and Bacteroidetes. Notable differences were observed between larval and moth samples, with adult moths—particularly Eri-fed females—having a higher abundance of Bacteroidetes. Specific taxa such as Oscillospira, Sutterella, Succinivibrionaceae, and Prevotella were more abundant in adult moths. Eri-fed samples exhibited greater microbiome diversity, while Kesseru-fed samples were rich in Bifidobacterium. Interaction networks revealed unique species correlations in moths, including Clostridiales, Firmicutes, Gallibacterium, and Lachnospiraceae. Functional analysis highlighted diet-related differences, whereby Kesseru-fed samples showed more carbohydrate metabolism pathways, while larval microbiomes had distinct pathways for aromatic compound degradation and detoxification. Moth samples exhibited increased biosynthesis pathways, protein absorption, RNA transport, and immunogenic functions. This research enhances the understanding of microbiome dynamics in silkworms, offering insights for improved growth conditions and pest management strategies for this economically and ecologically significant species.

1. Introduction

Meta-organisms are complex eukaryotic creatures that have co-evolved with microbiota, shaping their state of being. Meta-organisms consist of a network of organisms and their metabolites that work together to survive and thrive in their environment while modifying it [1]. The microbiome of these creatures has co-speciated with them throughout their evolutionary history, co-existing in a mutually beneficial relationship [2,3,4].
Holometabolous insects, such as lepidopterans, have a significant impact on the ecosystem, occupying multiple niches and forming different phenotypes in their larval and adult stages [5,6]. With over 18,000 described species worldwide, lepidopterans are the second most diverse insect group [7]. However, less than 0.1% of them have reported microbial assistance, and the composition and significance of their gut microbiomes vary greatly, with no universal pattern [8]. The phenotype and physiology of insects are dependent on their microbial composition; the composition and abundance of the organism-associated microbiota, especially the gut, are dependent on various factors [9,10,11,12]. Environmental conditions have been shown to cause variations in the lepidopteran gut microbiome, with most studies reporting a complete remodelling of the gut microbiota according to developmental changes [8,13]. Several theories have been proposed regarding the gut microbiome composition, transmission, and co-evolution of these organisms. The most dominant microbes present in most larval stages of lepidopteran insects are digestion-aiding microbes [14]. Gut microbes such as Enterobacter, Burkholderia, Pseudomonas, and Carnobacterium have been reported in various insect guts to degrade and detoxify plant compounds and toxins such as hydrogen cyanide (HCN), latex, resin acids, plant phenolics, and other organic acids [12,14,15]. Gut microbiomes also play a significant role in the mating and socializing behaviour of these organisms [8,13,15]. Functional analyses of the gut microbiome of lepidopterans have reported a high percentage of active species. Early larval stages reported a higher presence of functions involved in carbohydrate metabolism and cell motility, while late instar microbes assisted with functions involved in amino acid, cofactors, and vitamin metabolism. In moths, functions such as energy metabolism and replication pathways were more abundant [13,16,17].
Studying gut microbiota has many advantages, including gaining insights into the biology, evolution, and dynamics of the host gut microbiome. Insect gut microbiota analyses could be used in developing effective methods of better growth and health [18,19]. They could serve as biomarkers for various traits of the organism and could be used to determine and eliminate various unwanted traits like diseases, pests, weak immunity, and reduced growth [20,21,22,23,24]. Novel microbes and their products from insect guts have also been developed for the biodegradation of complex waste and for blocking the transmission of insect-borne diseases [25,26,27,28,29]. Efficient experimental designs, such as pooling samples from similar treatments or time points, can enhance microbial diversity analysis while reducing technical variation and costs [30].
Samia cynthia ricini (Lepidoptera: Saturniidae) is a domesticated silkworm that produces unique warm Eri-silk and is widely cultivated by the rural population of Assam and Northeast India, largely contributing to the ecological and economic aspects of these regions [30,31,32]. However, little is known about the respective organisms, resulting in poor and obsolete rearing practices and cultivation techniques, as well as a low productivity of silk. The health conditions of these organisms are weakening, leading to a decrease in their population, which also has negative effects on the environment due to their role in the ecosystem [33,34].
In this study, the microbiome of different growth stages of the polyphagous domesticated lepidopteran insect has been analyzed with respect to two different types of leaf diet. The organism was reared in a controlled environment comprising a room temperature of 25 °C and an 80% relative humidity. They were grouped into two different diet groups—Ricinus communis Linn. (Eri) and Heteropanax fragrans (Kesseru)—which are the most commonly fed foods in sericulture farms. Eri leaves are usually fed during the early larval stages for excess growth, cocoon quality, and egg production, while Kesseru leaves are fed during the later stages with the aim of commercial crop production [35,36]. The larval and adult growth stages of both groups were analyzed to explore various traits, including the core microbiome, temporal changes in the microbial composition with growth stages, and differences with respect to their diets.

2. Materials and Method

2.1. Sample Collection, Rearing, and Growth Characteristics Observation

Eri silkworm (Samia cynthia ricini) disease-free layings (dfls) were acquired from the Central Muga & Eri Research Institute, Jorhat, Assam, India (Lat: 26°47′49.1″ N, Lon: 94°19′35.0″ E). They were reared in a domesticated semi-controlled environment with a room temperature of 25 °C and 80% relative humidity. Two types of leaf feeds were selected viz. Ricinus communis Linn. (Eri) and Heteropanax fragrans (Kesseru). Phenotypic differences including the average length of each larval instar stage and egg viability were recorded for a comparative analysis of the growth rates of the two different diets. A total of 14 samples were collected based on each larval and adult growth from the two different diets. The rearing trial was performed during the month of May, and sample collection for both larval- and adult-stage samples was carried out at around 11:00 AM to minimize diurnal variation. Table 1 details the sample name and description.

2.2. DNA Extraction and Sequencing

Pooled samples based on equal weight were collected and stored from each instar of the larval stages and adult male and female moths and were fed on each diet type for gut DNA extraction. Collected larval and moth samples were washed with 70% alcohol to minimize external microbial contamination [37,38]. DNA extraction was carried out using phenol/chloroform (PHEC) extraction methodology [39]. Cells were homogenized in sterile phosphate-buffered solution (PBS) followed by SDS-based cell membrane degradation. The extracts were then saturated with phenol, followed by the separation of nucleic acids and proteins using chloroform: isoamyl-alcohol (24:1). The overnight precipitation of nucleic acids using isopropanol and 3 M sodium chloride for maximum DNA recovery was carried out. DNA samples were analyzed for their concentration and purity using 1% agarose gel electrophoresis and the Nanodrop spectrophotometer [40,41]. Extracted DNA samples (A260/A280 ~1.8) were sent for 16s rRNA amplicon sequencing using Illumina NGS MiSeq (AgriGenome Technologies Pvt. Ltd., Kochi, India).

2.3. Sequence Retrieval, Quality Control, and Processing

Paired-end raw sequencing data (250 bp) in FASTQ format were analyzed for quality and adapters using FastQC (v_0.11.9) [42]. Following the removal of non-biological contaminants, the quality-controlled reads were imported to QIIME2-2022.2 with a metadata mapping file, including sample names, adapter barcodes, and the mapping categories of life stage (Larvae, Moth), growth stage (Instar1-5, Moth_male, Moth_female), and diet (Eri_Leaves, Kesseru_Leaves) [43]. Sample metadata were modified and filtered accordingly based on different group analyses.
Reads were de-noised for quality control and feature table construction using the DADA2 plugin, thus mapping the feature identifiers (amplicon sequence variants or ASVs) to the sequence reads they represent [44]. For quality filtering based on the FASTQC analyses, reads were truncated at around 120 bp. Obtained feature tables were subjected to a de novo chimera check and removal, followed by v-search open-reference OTU clustering using 99% identity reference sequences from the Greengenes database to reduce false discovery rates (FDRs) [45,46]. The obtained clustered sequences were then filtered for mitochondrial and chloroplast sequences to further improve the dataset.
Taxonomy classification and identification were carried out by training the 99% identity reference sequences from the Greengenes database using the Naive Bayes classifier [47]. The core microbiome was analyzed at 100% identity. Shared OTU numbers of different sample groups were visualized using Venn [48].

2.4. Compositional Analyses

The obtained data were subjected to various exploratory and significance analyses with respect to various groups of metadata viz. growth stages (each larval instar stage and adult moths), life stages (compiled larval stages vs. adults) and diet types (Eri vs. Kesseru leaves).
Taxonomic compositions were visualized using QIIME2 and the R (v-4.2.0) phyloseq package [49,50]. The OTU outputs were aligned with a multiple sequence alignment tool—mafft—and a phylogeny with fasttree2 based on maximum likelihood was constructed with q-phylogeny [51,52]. Taxonomy-based and phylogeny-based α (observed otus, Shannon, and Faith PD) and β-diversity analyses (Jaccard, weighed, and un-weighed UniFrac distances) were performed using the diversity-plugin of QIIME2 and were visualized through boxplots and PCoA NMDS plots, respectively [53,54,55,56]. Kruskal–Wallis group significances were calculated for observed OTUs, as well as the Shannon and faith-PD phylogenetic-distance α diversity indices, based on the diet and various groups of growth stages. Permanova significances based on Pseudo-F analyses were calculated using un-weighed UniFrac phylogenetic distance [57,58].
The filtered feature table and taxonomy abundance table were exported to biom-formatted files for further analyses. Differential abundance (DA) against variable diet types and life stages were calculated using DeSeq2. The data were transformed following the addition of pseudocount to avoid errors, followed by Wald’s test with alpha = 0.05 for significance [50,59]. Multiple variable (diet and life stage)-based DA was analyzed using ANCOM-BC. The samples were normalized using additive log ratio (alr) transformation along with the incorporation of sampling fraction into the model, estimated by the ratio of the library size to the microbial load, reducing bias in the analyses. The Holm method was used to adjust p-values for multiple comparisons [60]. In total, 20 samples with minimum p-values from the DA analyses outputs were selected for mapping using ComplexHeatmap (R 4.2.0) [61]. The phylogenetic tree representing the evolutionary relationship of the microbiome present was visualized using MEGAN Community Edition (6.23.2) [62].
Differential microbial networks for the larval and moth stages were generated using the NetComi package (R 4.2.0). The methodology was used applying Pearson’s correlations for estimating associations between OTUs and Fisher’s z-test differentially correlated OTUs [63]. The data were centred and log ration (clr) transformed and were managed for low FDRs.

2.5. Functional Prediction

The qiime2-filtered ASV feature table and the representative sequences were exported to biom formats for functional prediction using PICRUSt2 with EPA-ng maximum likelihood-based phylogenetic placement [64].
NMDS plotting was carried out based on the unconstrained RDA analysis of centred and log ration (clr)-transformed data using phyloseq to analyze the functional diversity between the groups of samples [50]. ALDEx2 was used to calculate the functional DA between sample groups of diet types and life stages; this method was preferred over ANCOM, as was used in other studies, for functional prediction data [65]. Welch’s t-test was carried out for significance and the DA was plotted through Bland–Altman log-ratio abundance (MA) plots and effect (MW) plots [66,67].
Kegg-Orthology (KO)-predicted outputs were used to find the related functions using the KEGG-brite hierarchal map-file. Significant KO-derived functions and Metacyc pathways were calculated with corrected BHE = 0.1 (p = 0.05), before being sorted and plotted using ggplot for the above sample groups [68,69,70].

3. Results

3.1. Silkworm Rearing and Growth Observations

The reared silkworms were observed for their larval growth rate using length measurements. Differences in phenotypes including growth curves and egg viability were observed based on the two different diets. Larvae reared on Eri leaves were observed to have a higher growth curve and egg viability rate compared to larvae feeding on Kesseru leaves.

3.2. Sequence Processing, Quality Control, and Bioinformatic Analyses

Paired-end 250 bp 113,215–477,230 reads were generated from the samples. A summary of the filtered output following the de-multiplexing and de-noising of the samples is provided in Table 2.
The DADA2 feature table output was collapsed to significant OTUs using 99% of the Greengenes database, which provided a more comprehensive output with respect to the diverse and rare bacterial taxonomies of the samples. Comparatively, a reduced number of features of archaeal diversity was, however, observed. A comparative output of the collapsed and filtered feature (mitochondria and chloroplasts) is shown (Table 3). The filtered feature table provides a summary; SCLE5 had the highest feature count, while SCLEM had the lowest.

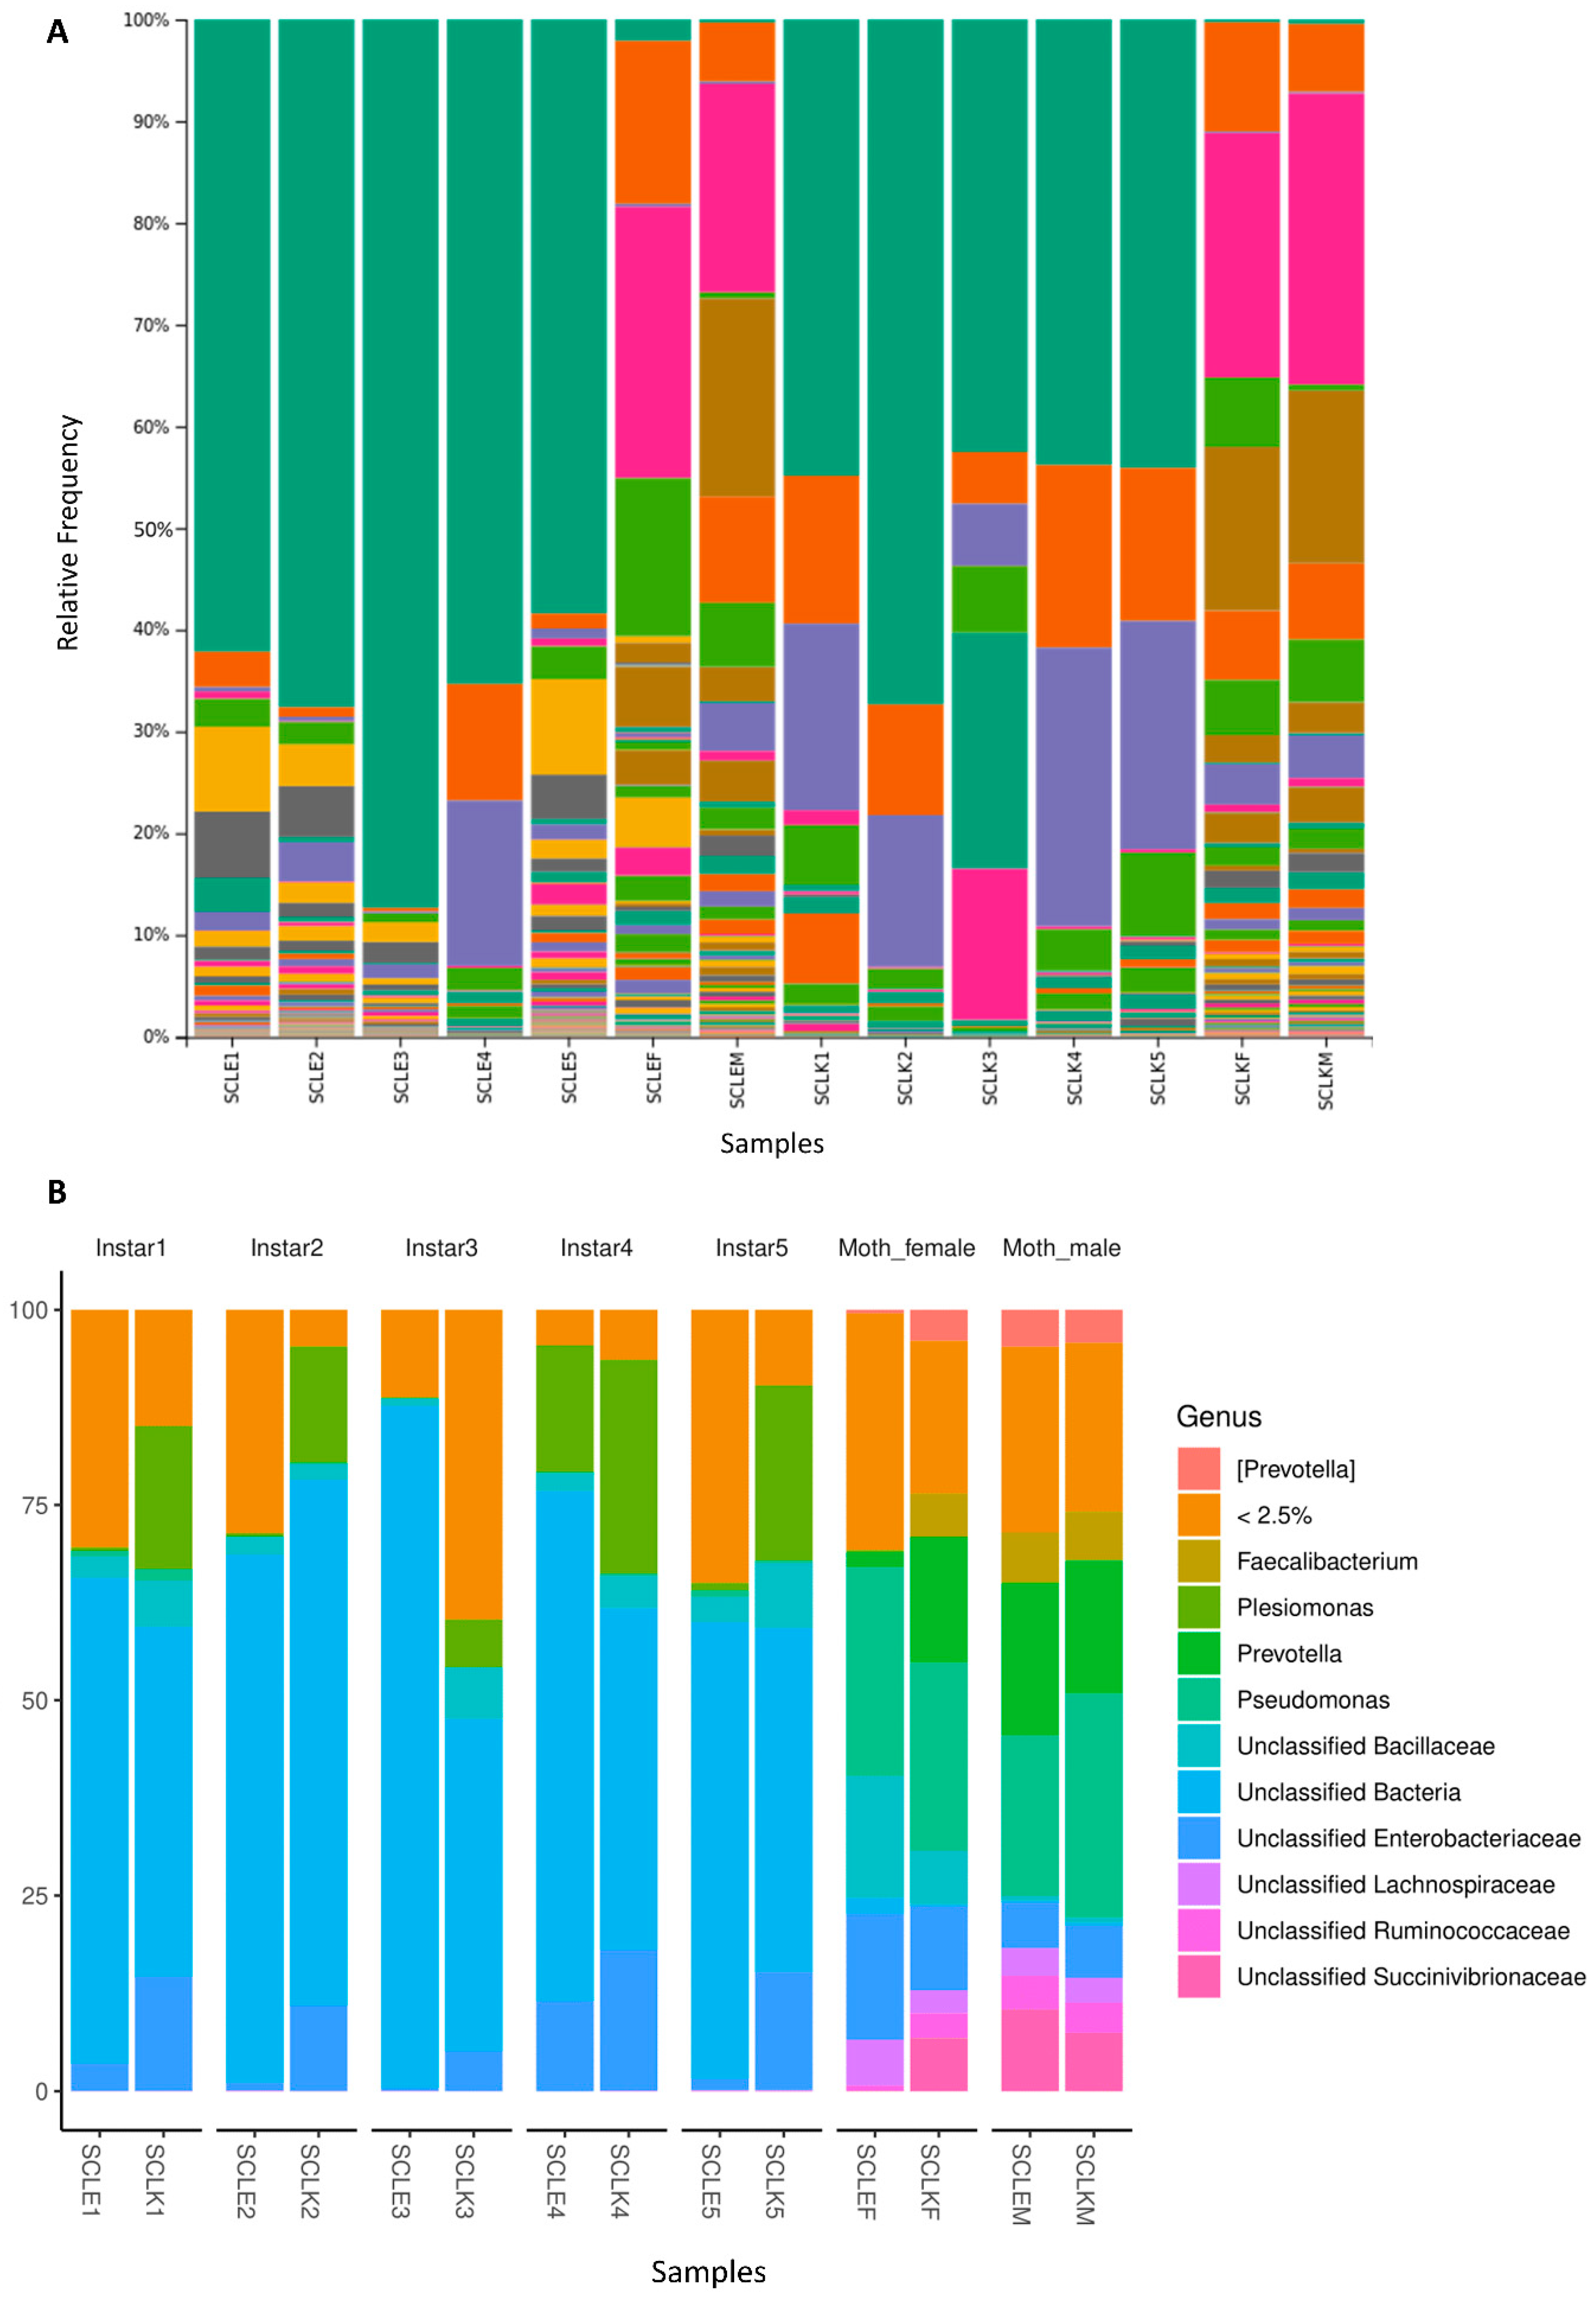
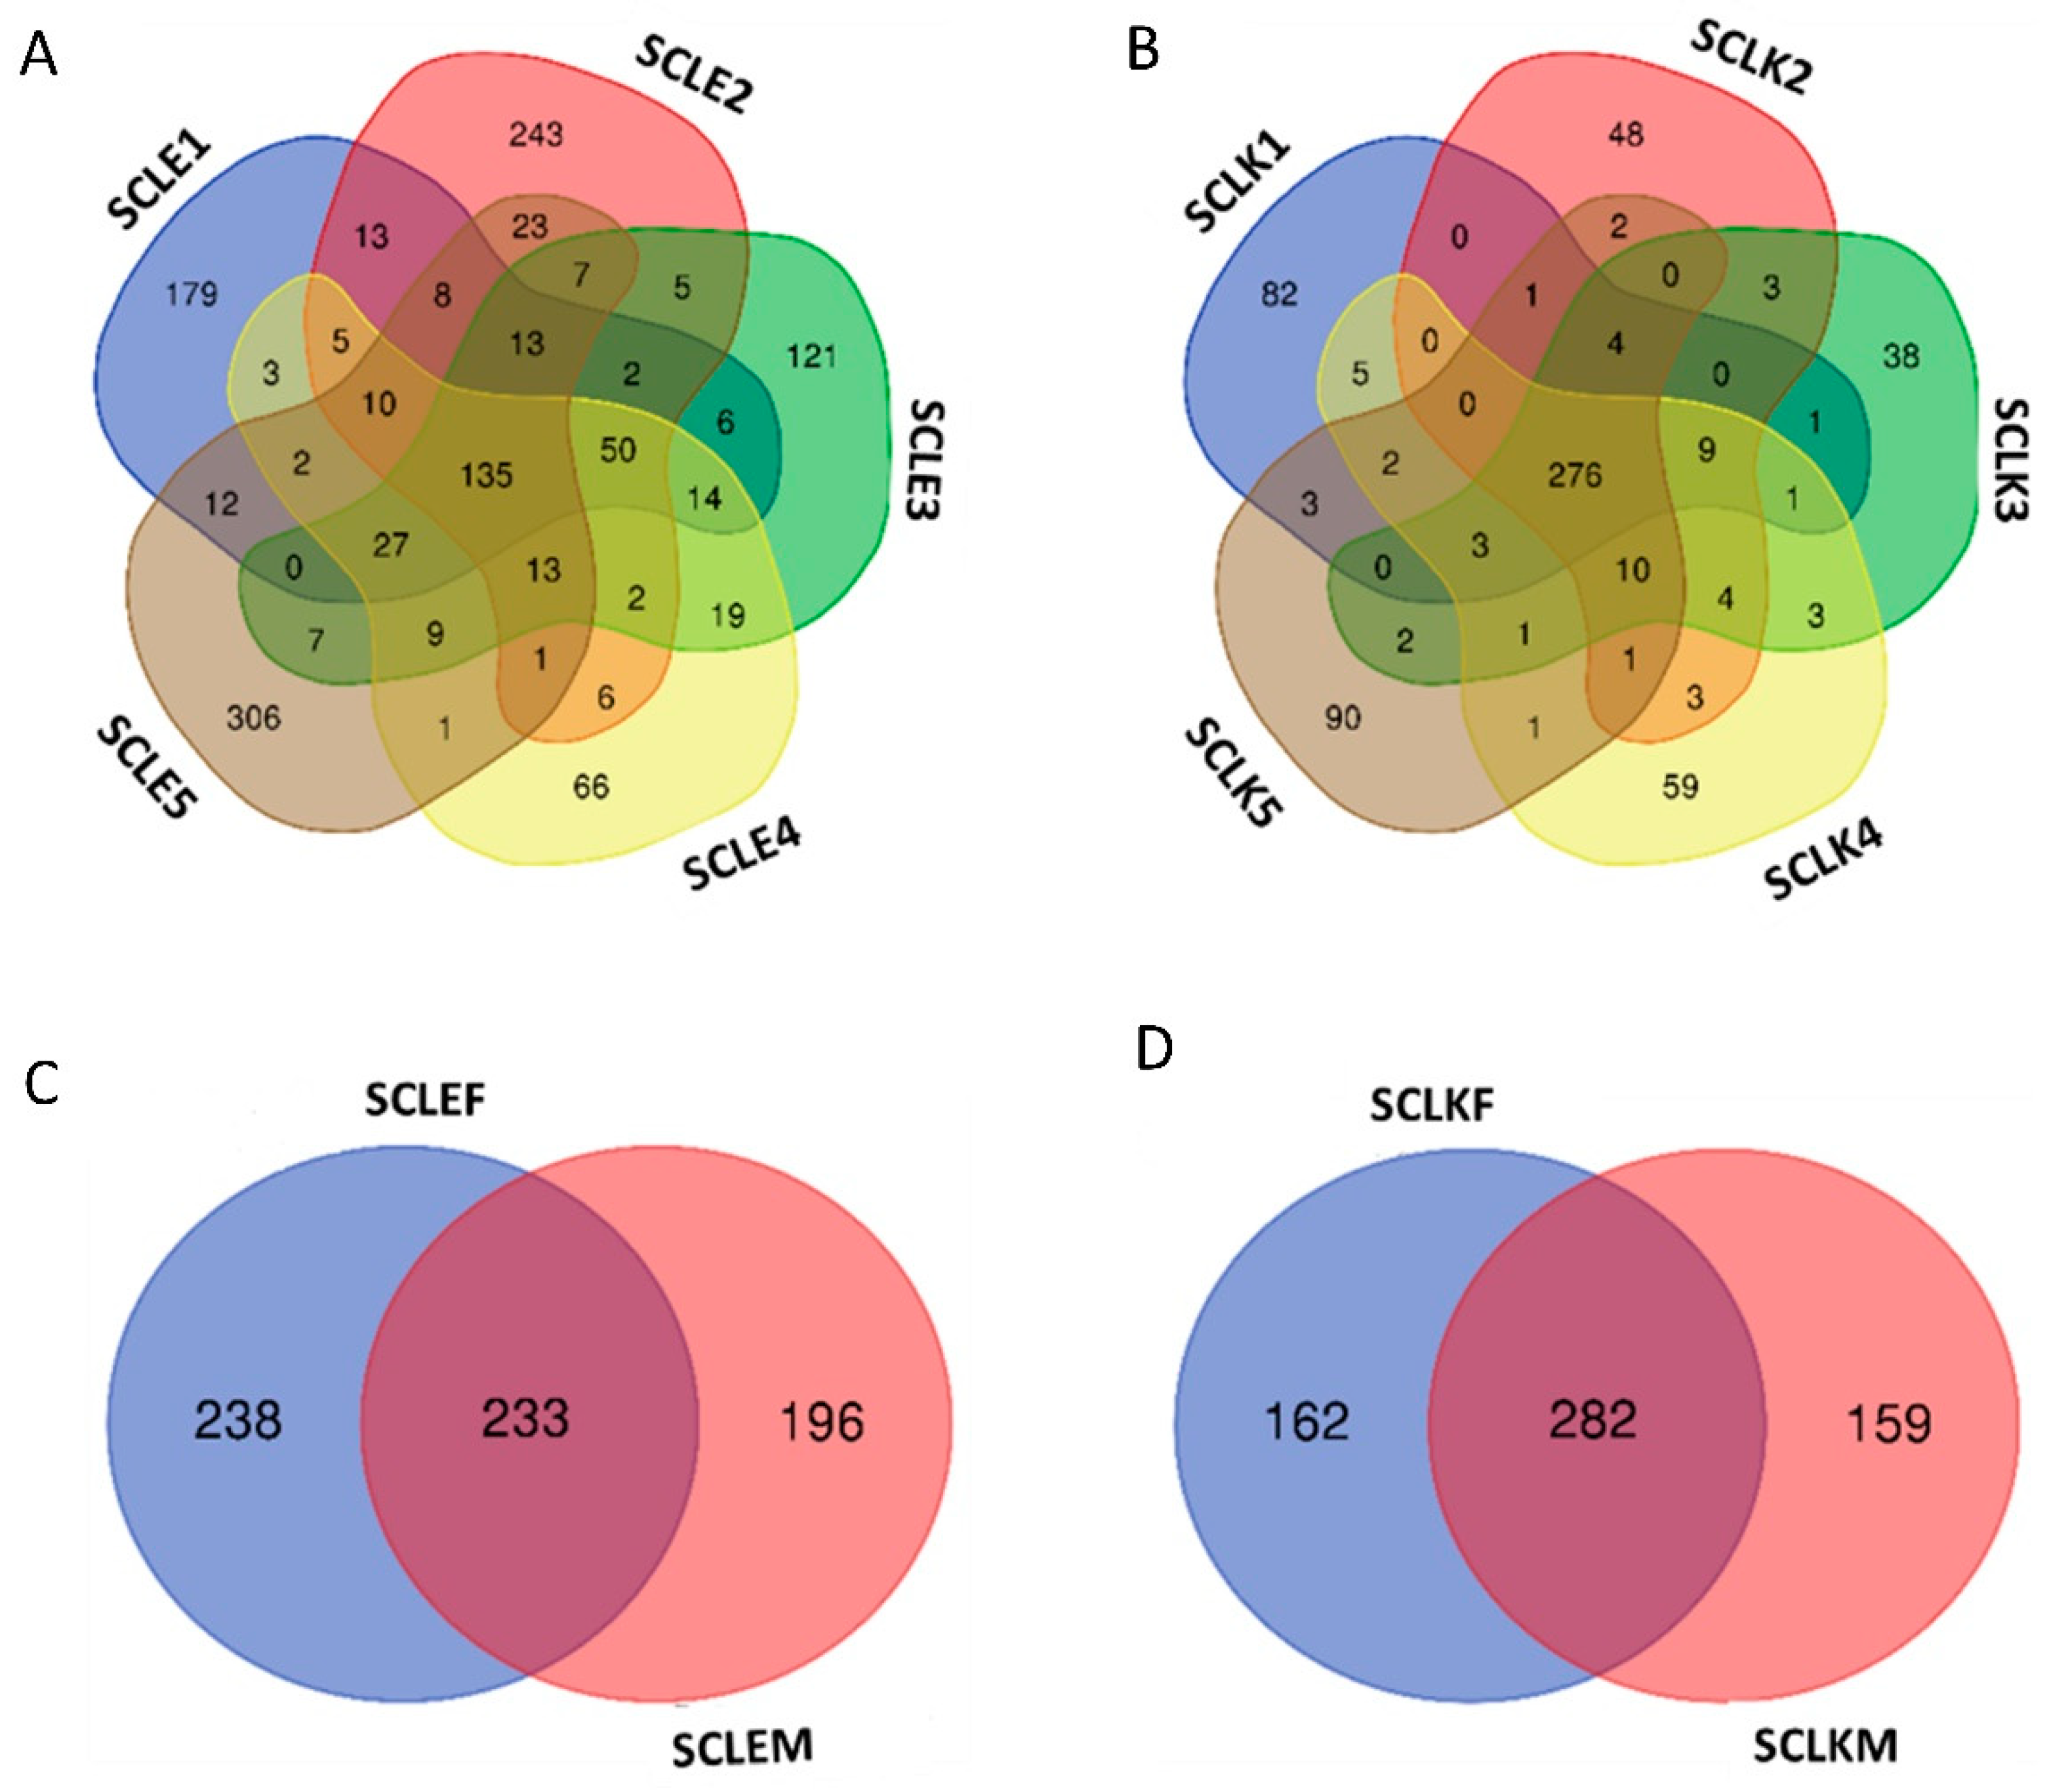
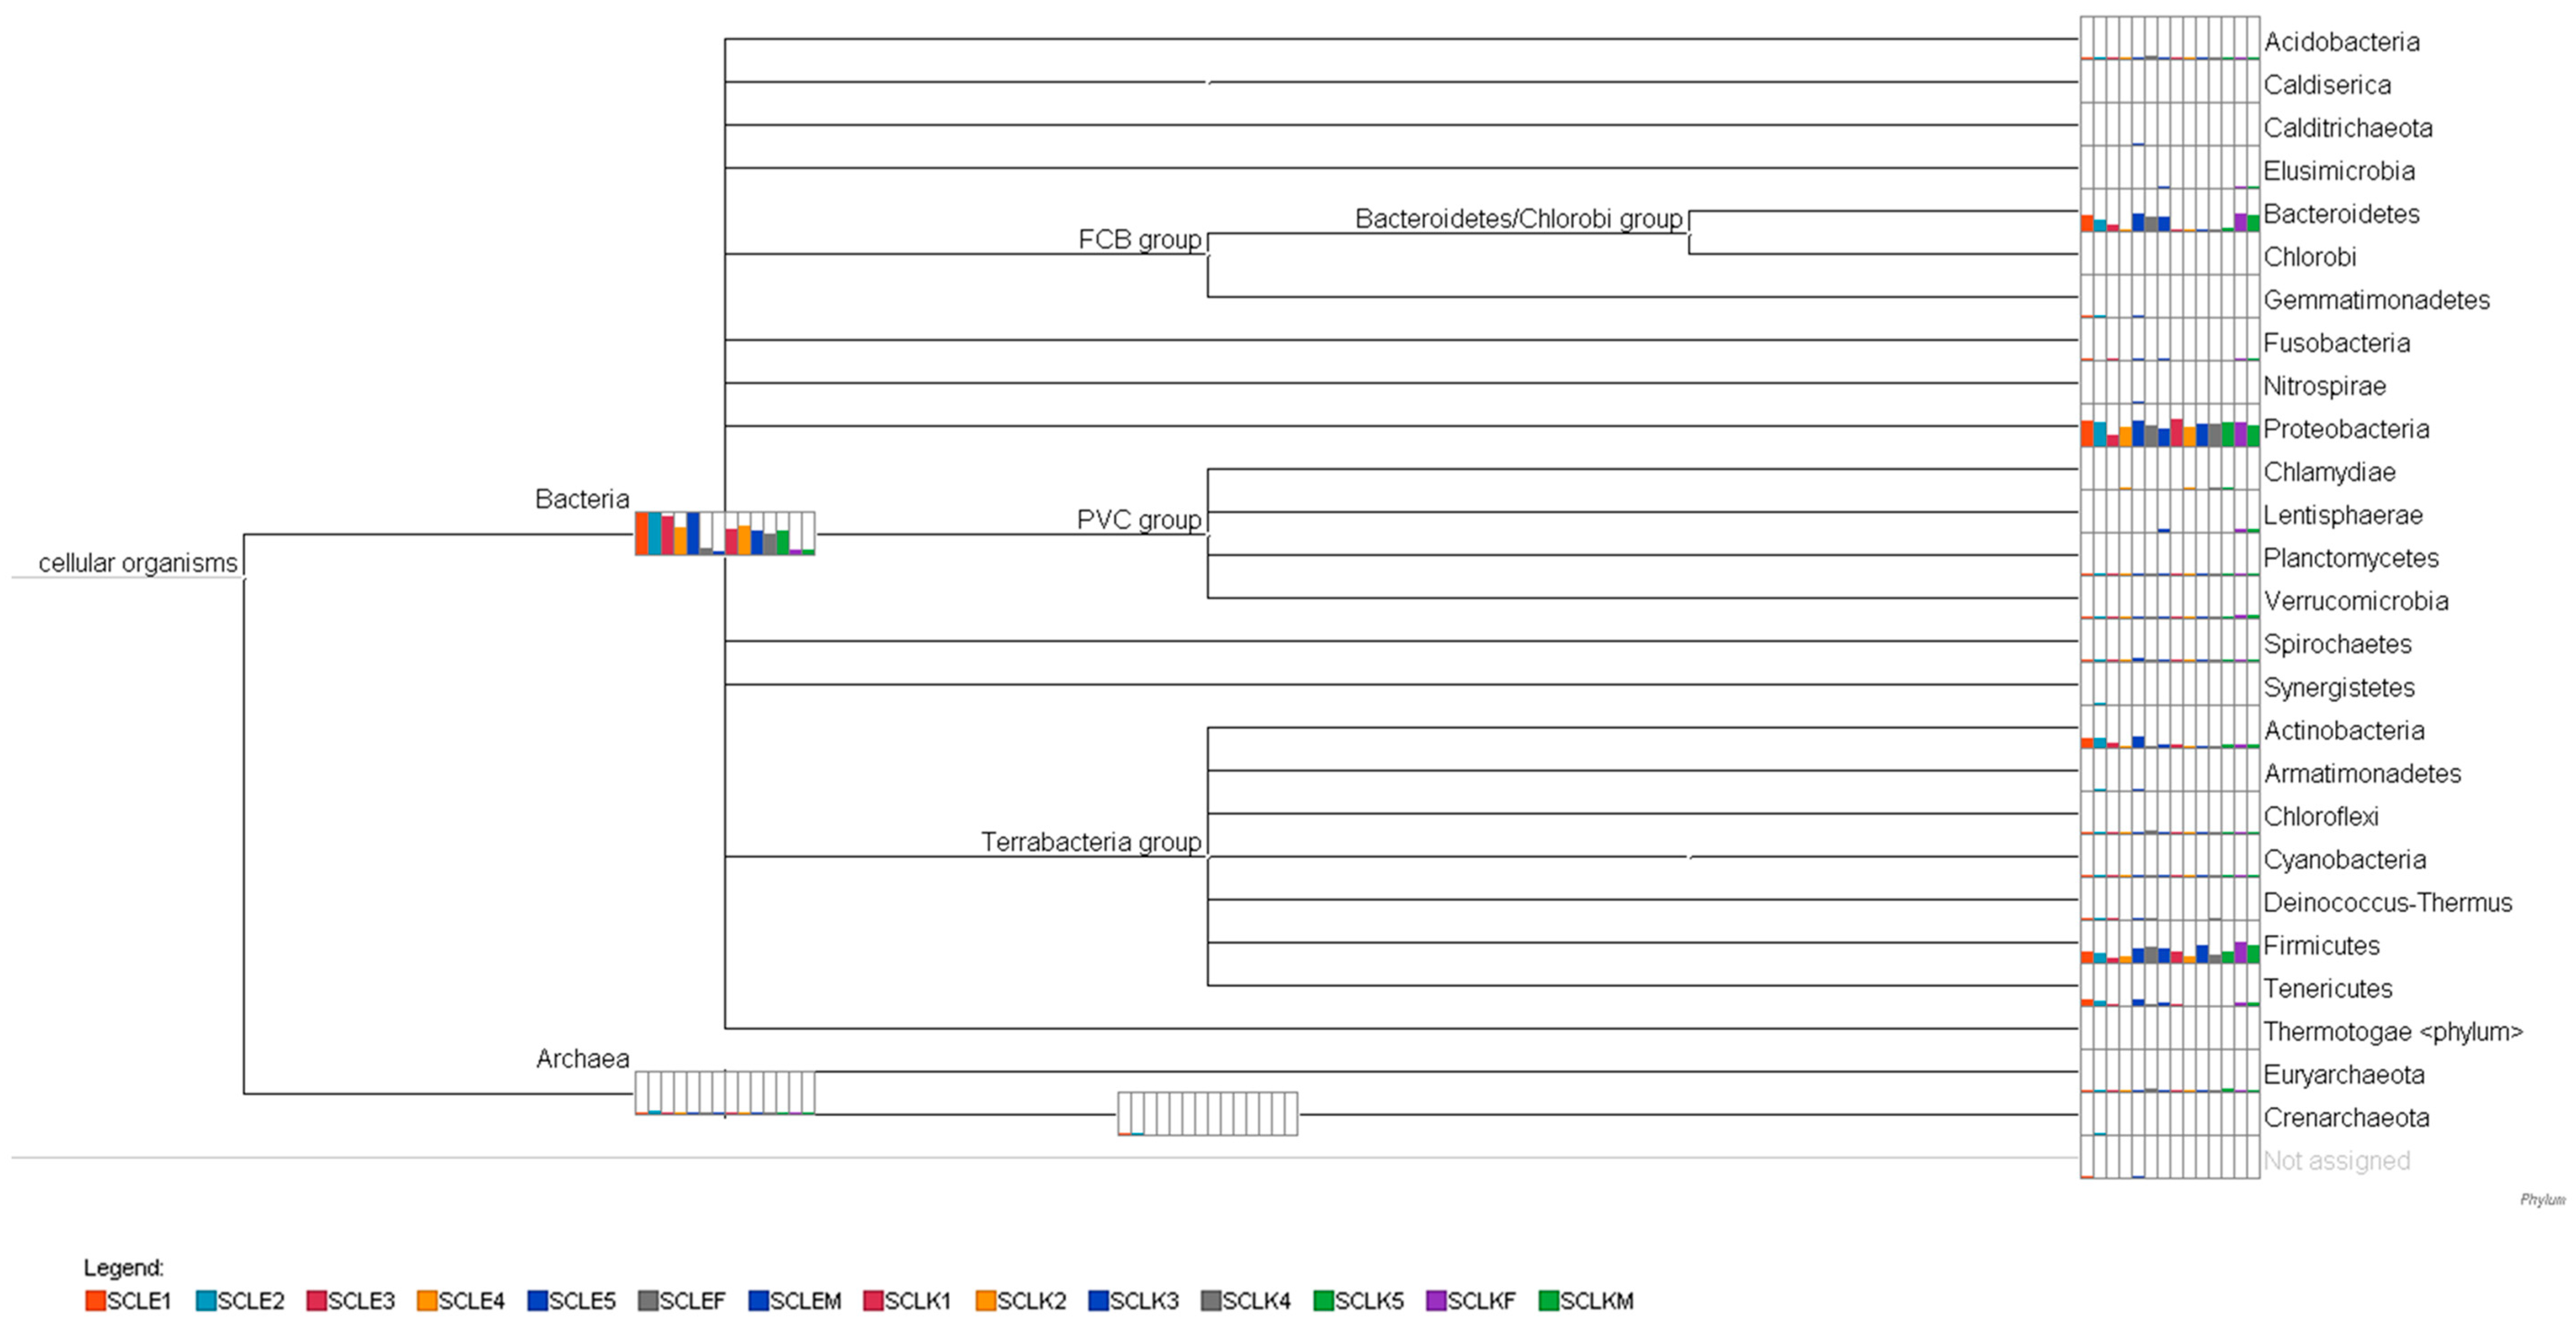
3.3. Microbiome Composition

Taxa bar plots for taxonomic abundances show significant differences (Figure 1A; legend provided in Supplementary Materials). A large number of unclassified bacteria have been observed in the larval stages. Furthermore, distinct patterns of taxonomy have been observed in samples from different environmental conditions, including larval instar stages, larva to adult moths, and different diets. The core microbiome at 100% was seen to comprise 11 OTUs, mostly comprising phylum Proteobacteria and Firmicutus, while other dominant microbes belonged to phylum Bacteroidetes and Actinobacteria (Table 4). The presence of Plesiomonas shigelloides has been observed in large amounts of Kesseru-fed larvae and adults (Figure 1B).
Variations in the number of shared OTUs were observed, with the lowest being observed in Eri-fed larval stages. Similar numbers were observed for the other groups viz. Kesseru-fed larval stages and adult moths from both diet types (Figure 2A–D).

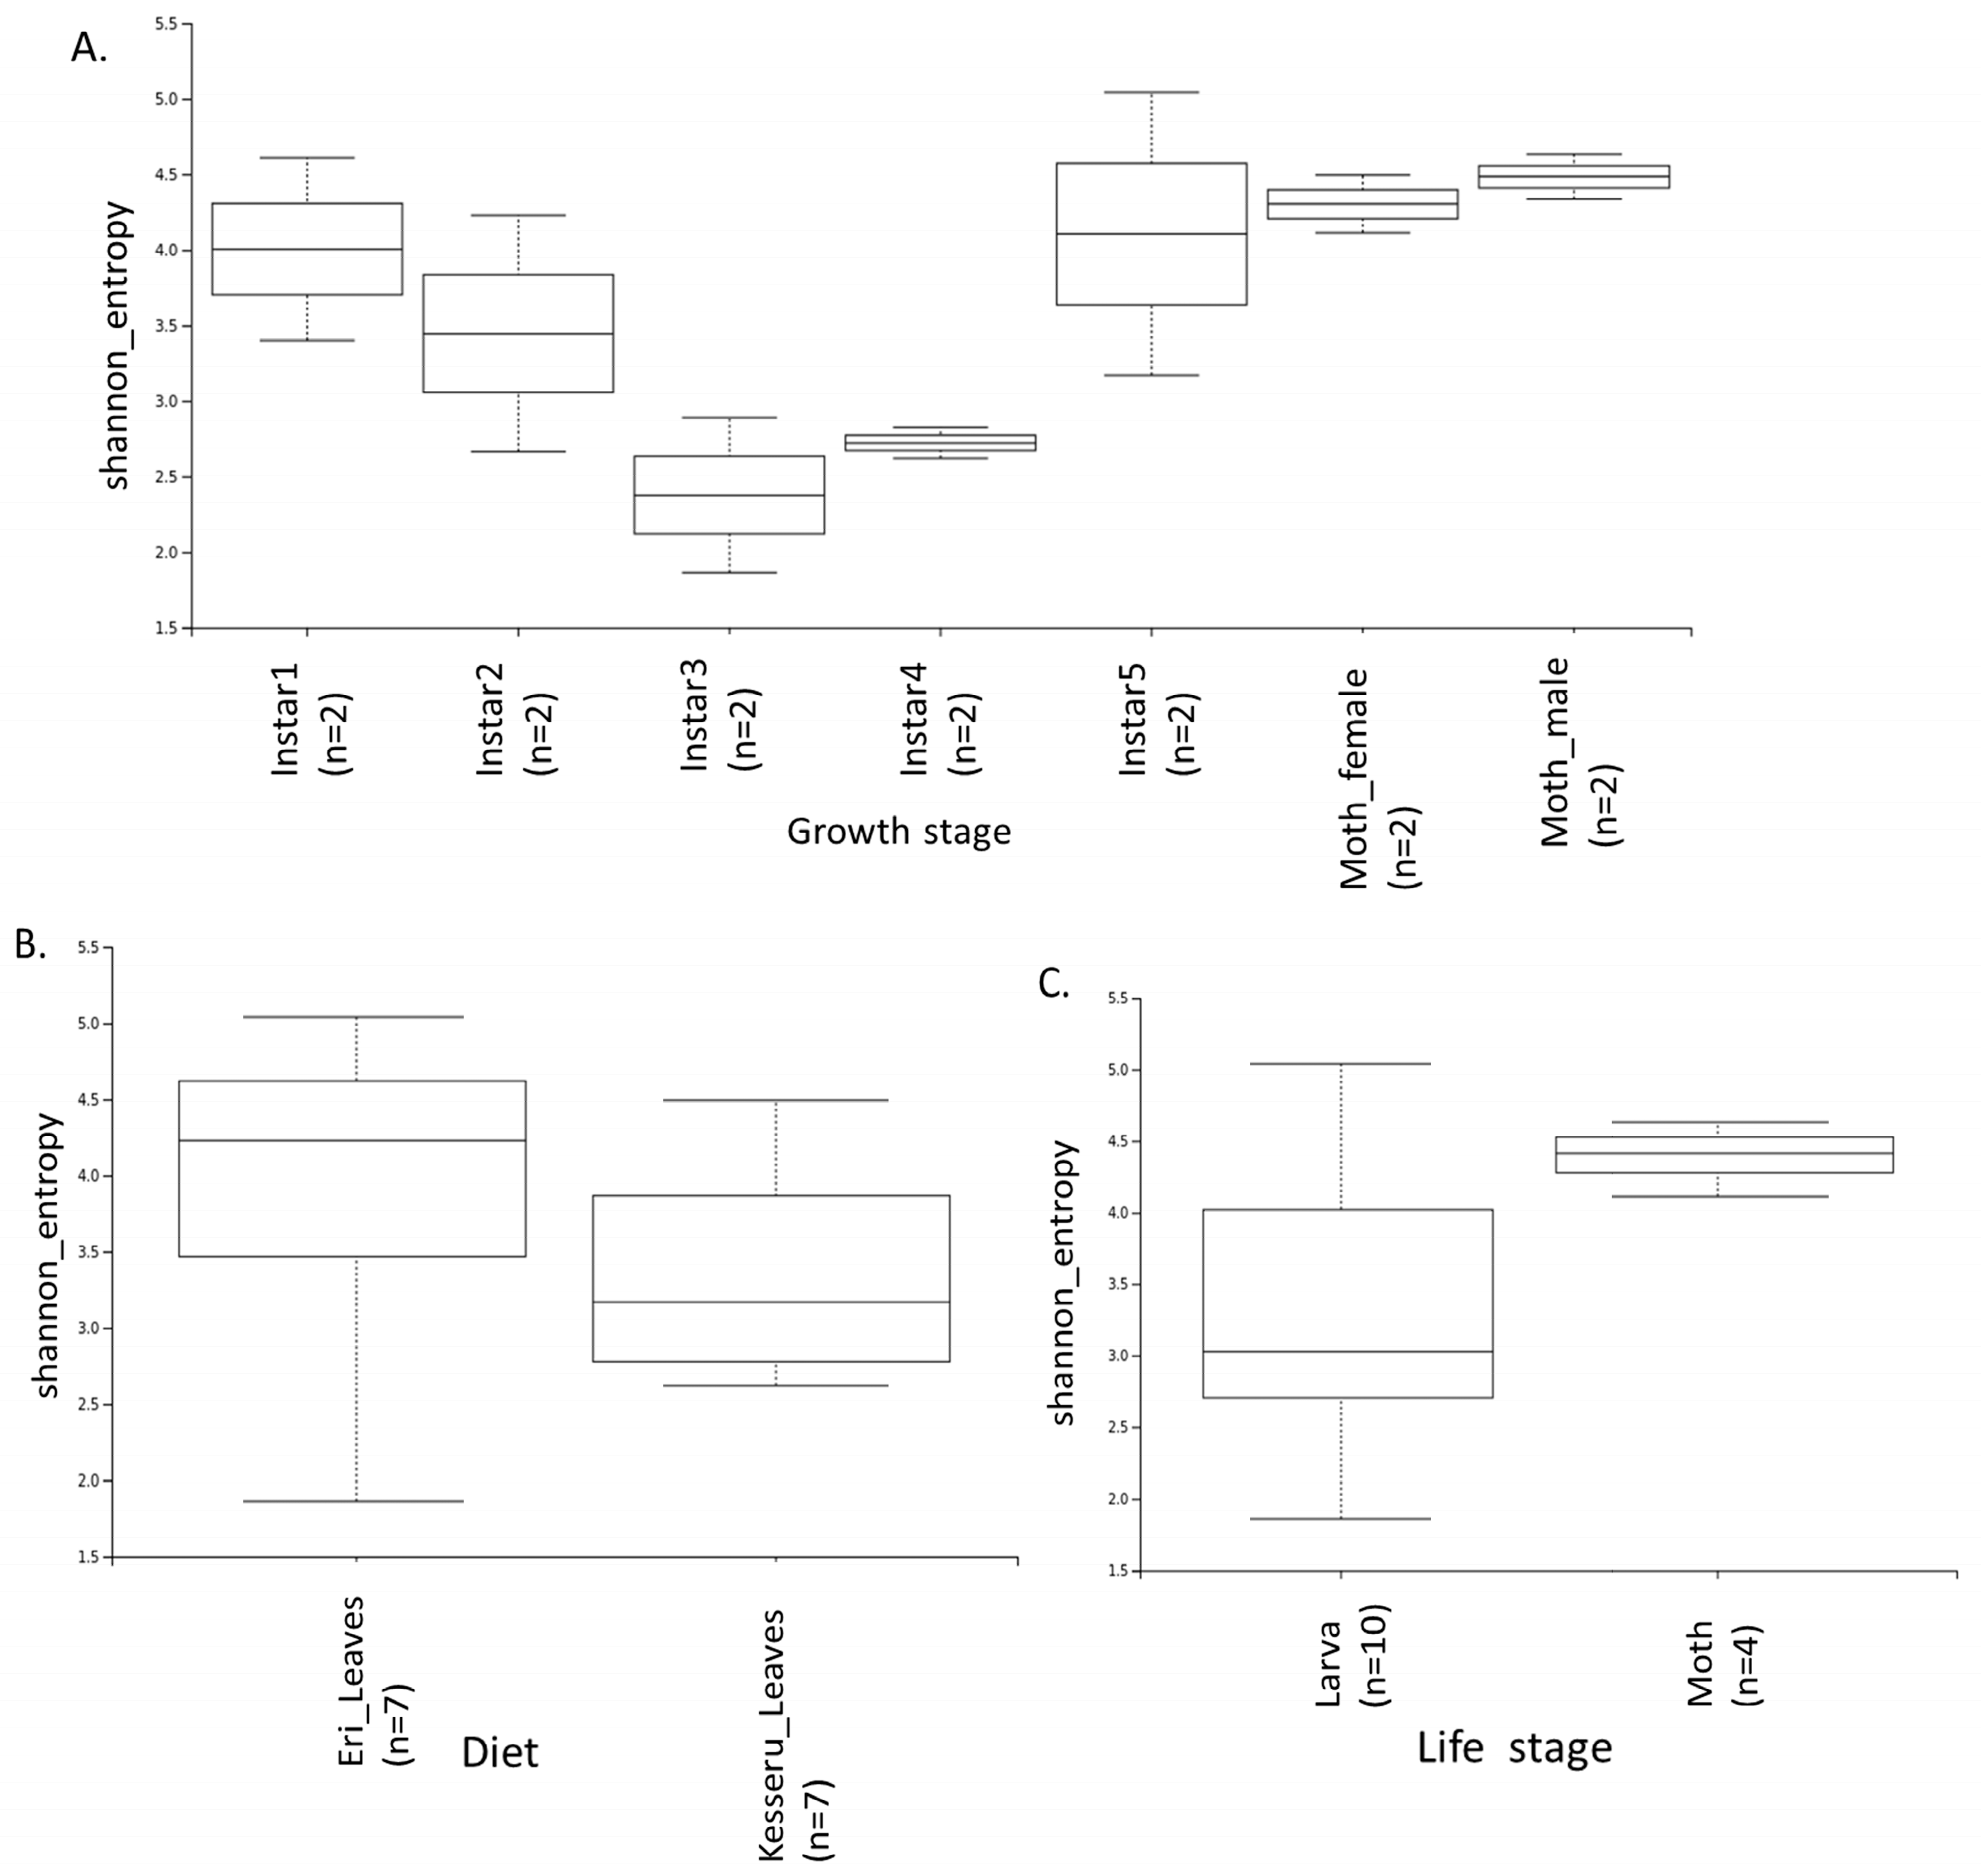
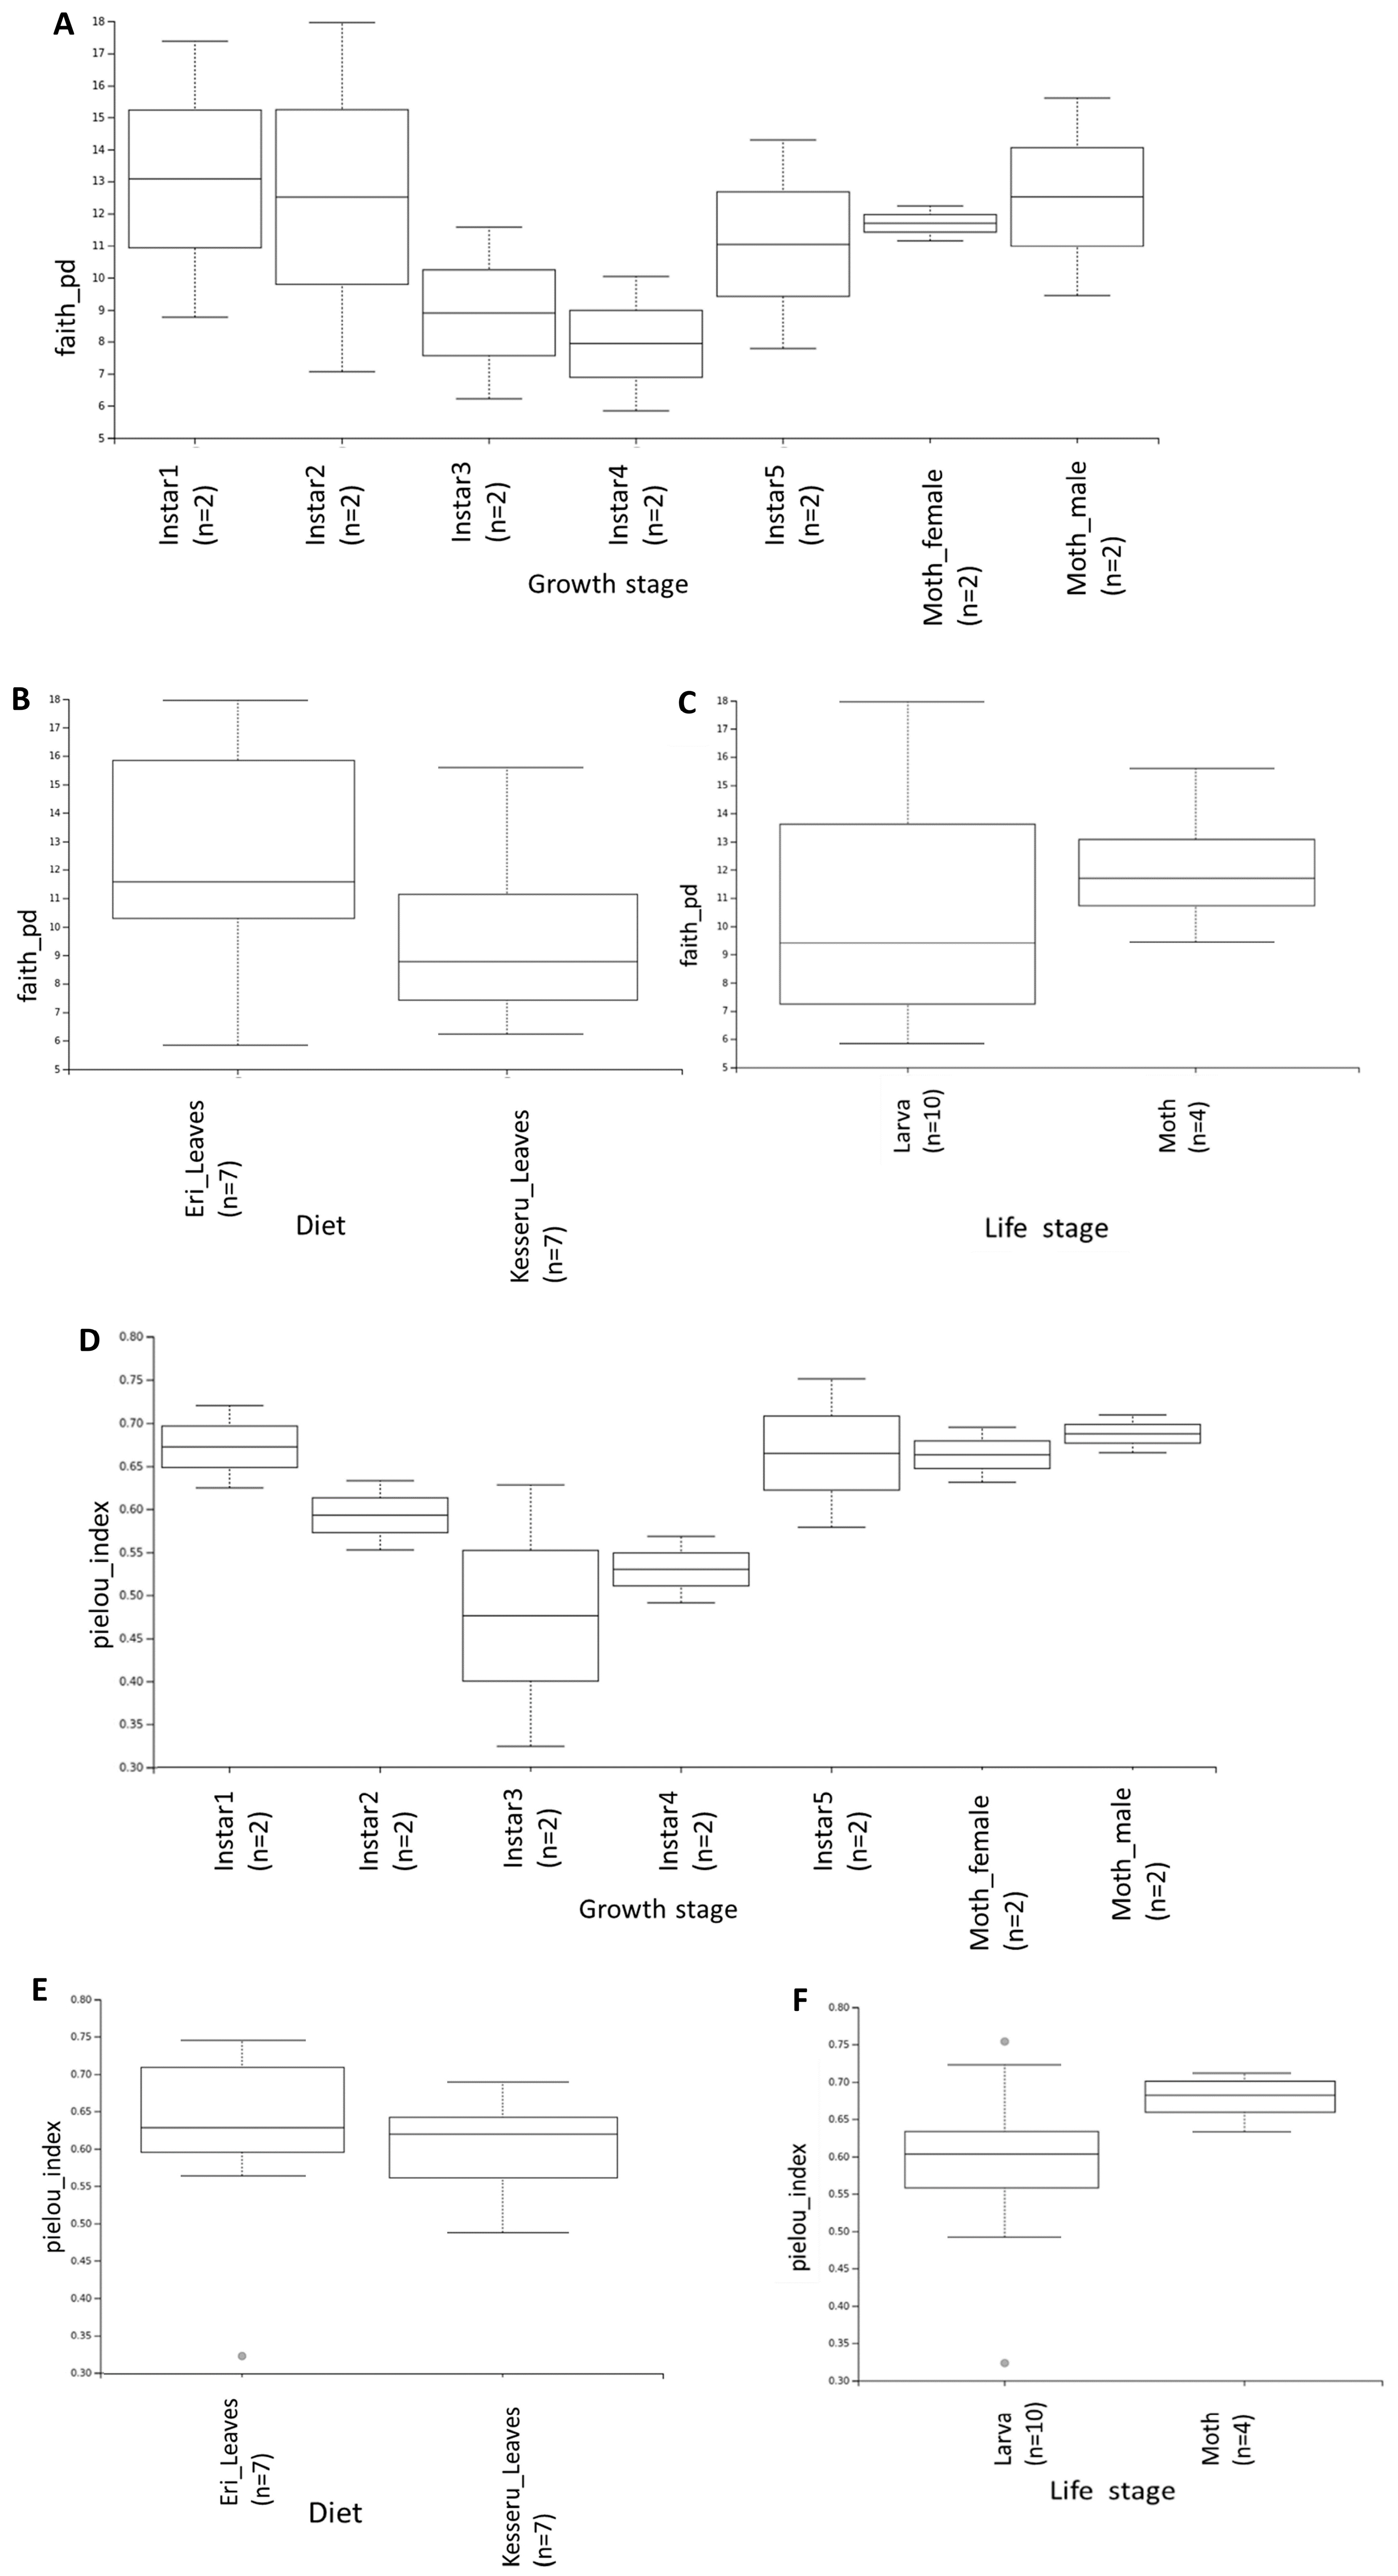
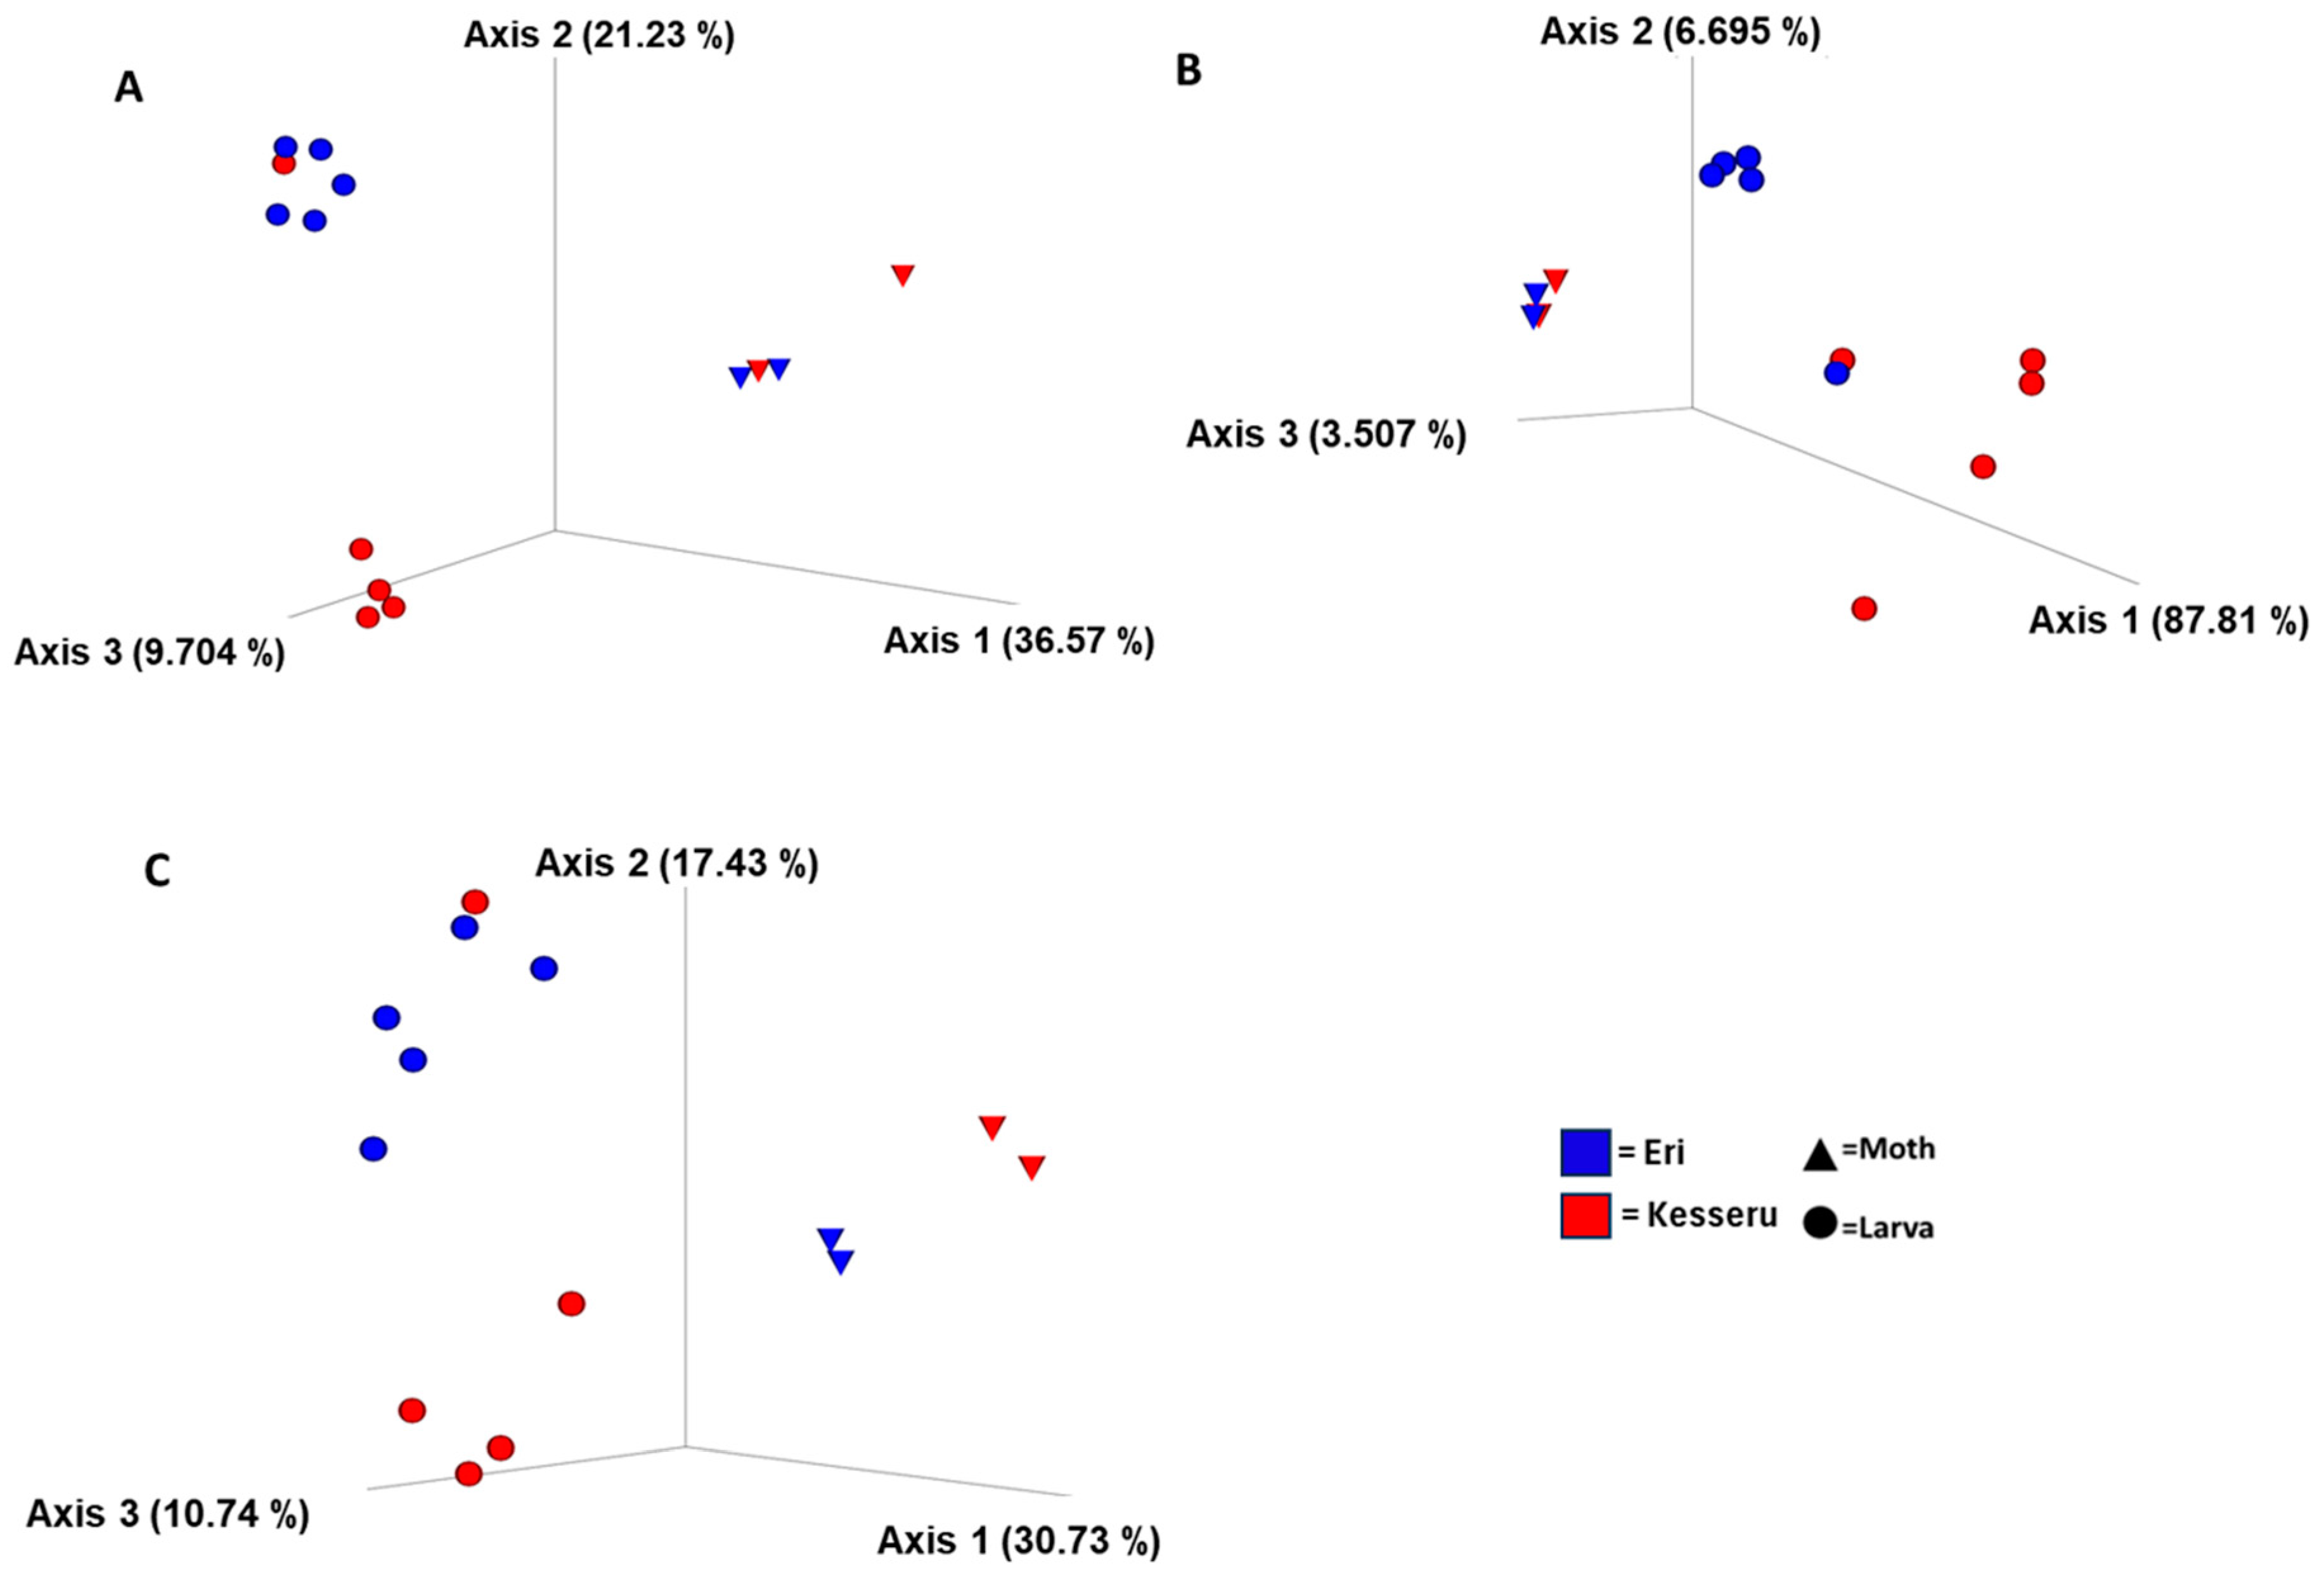
3.4. Diversity Analyses

Rarefaction at a sampling depth of 1000 was performed based on the observed features and rarefaction curve for generating diversity outputs at an even depth.
Species richness in each sample and groups of interest were analyzed through α-diversity indices. Shannon’s index-based richness was lowest in the 3rd instar, while the 4th instar was the lowest based on phylogenetic distance-based Faith PD analysis (Figure 3A and Figure 4A). Observed OTU features, as well as Shannon’s and Faith-PD indices-based richness plots, revealed the adult stages to be higher in species richness compared to the larval samples (p = 0.08) (Figure 3C and Figure 4C). Lower values were observed in the middle larval stages (Instar3 and Instar4). However, the differences through the larval stages were not significant.
The species richness difference based on observed OTUs in samples fed on Kesseru leaves was significantly lower than those fed on Eri (p = 0.05). However, Shannon’s entropy difference exhibited no significance (p = 0.2) (Figure 3B). Evenness, which was calculated using Pielou’s index which considers both richness and diversity values, found most groups to be moderately even, sharing most features through one or more samples (Figure 4A–C). The lowest but insignificant amount of evenness was observed between the adult and larval stages (p = 0.12).
Diversity analyses through the community using phylogeny- (weighted- and un-weighted-Unifrac distance) and non-phylogeny-based (Jaccard’s index) methods revealed the highest diversity to be between larvae and moth sample groups observed using NMDS PCoA (Figure 5A–C). Species diversity between larval and moth sample groups was highly significant, as calculated using PERMANOVA significance based on weighted-Unifrac (p = 0.01). Other groups including diet (p = 0.13) and each instar growth stage (p = 0.16) were moderately significant. High diversities between larval and moth stages were reported in other studies of lepidoptera microbiome analyses.
β-diversity significance tests between various group samples were carried out using PERMANOVA. The pseudo-F test statistic was used with 999 permutations (Table 5).
Phylogenetic trees showing sample group diversity and taxonomic abundances were visualized (Figure 6).

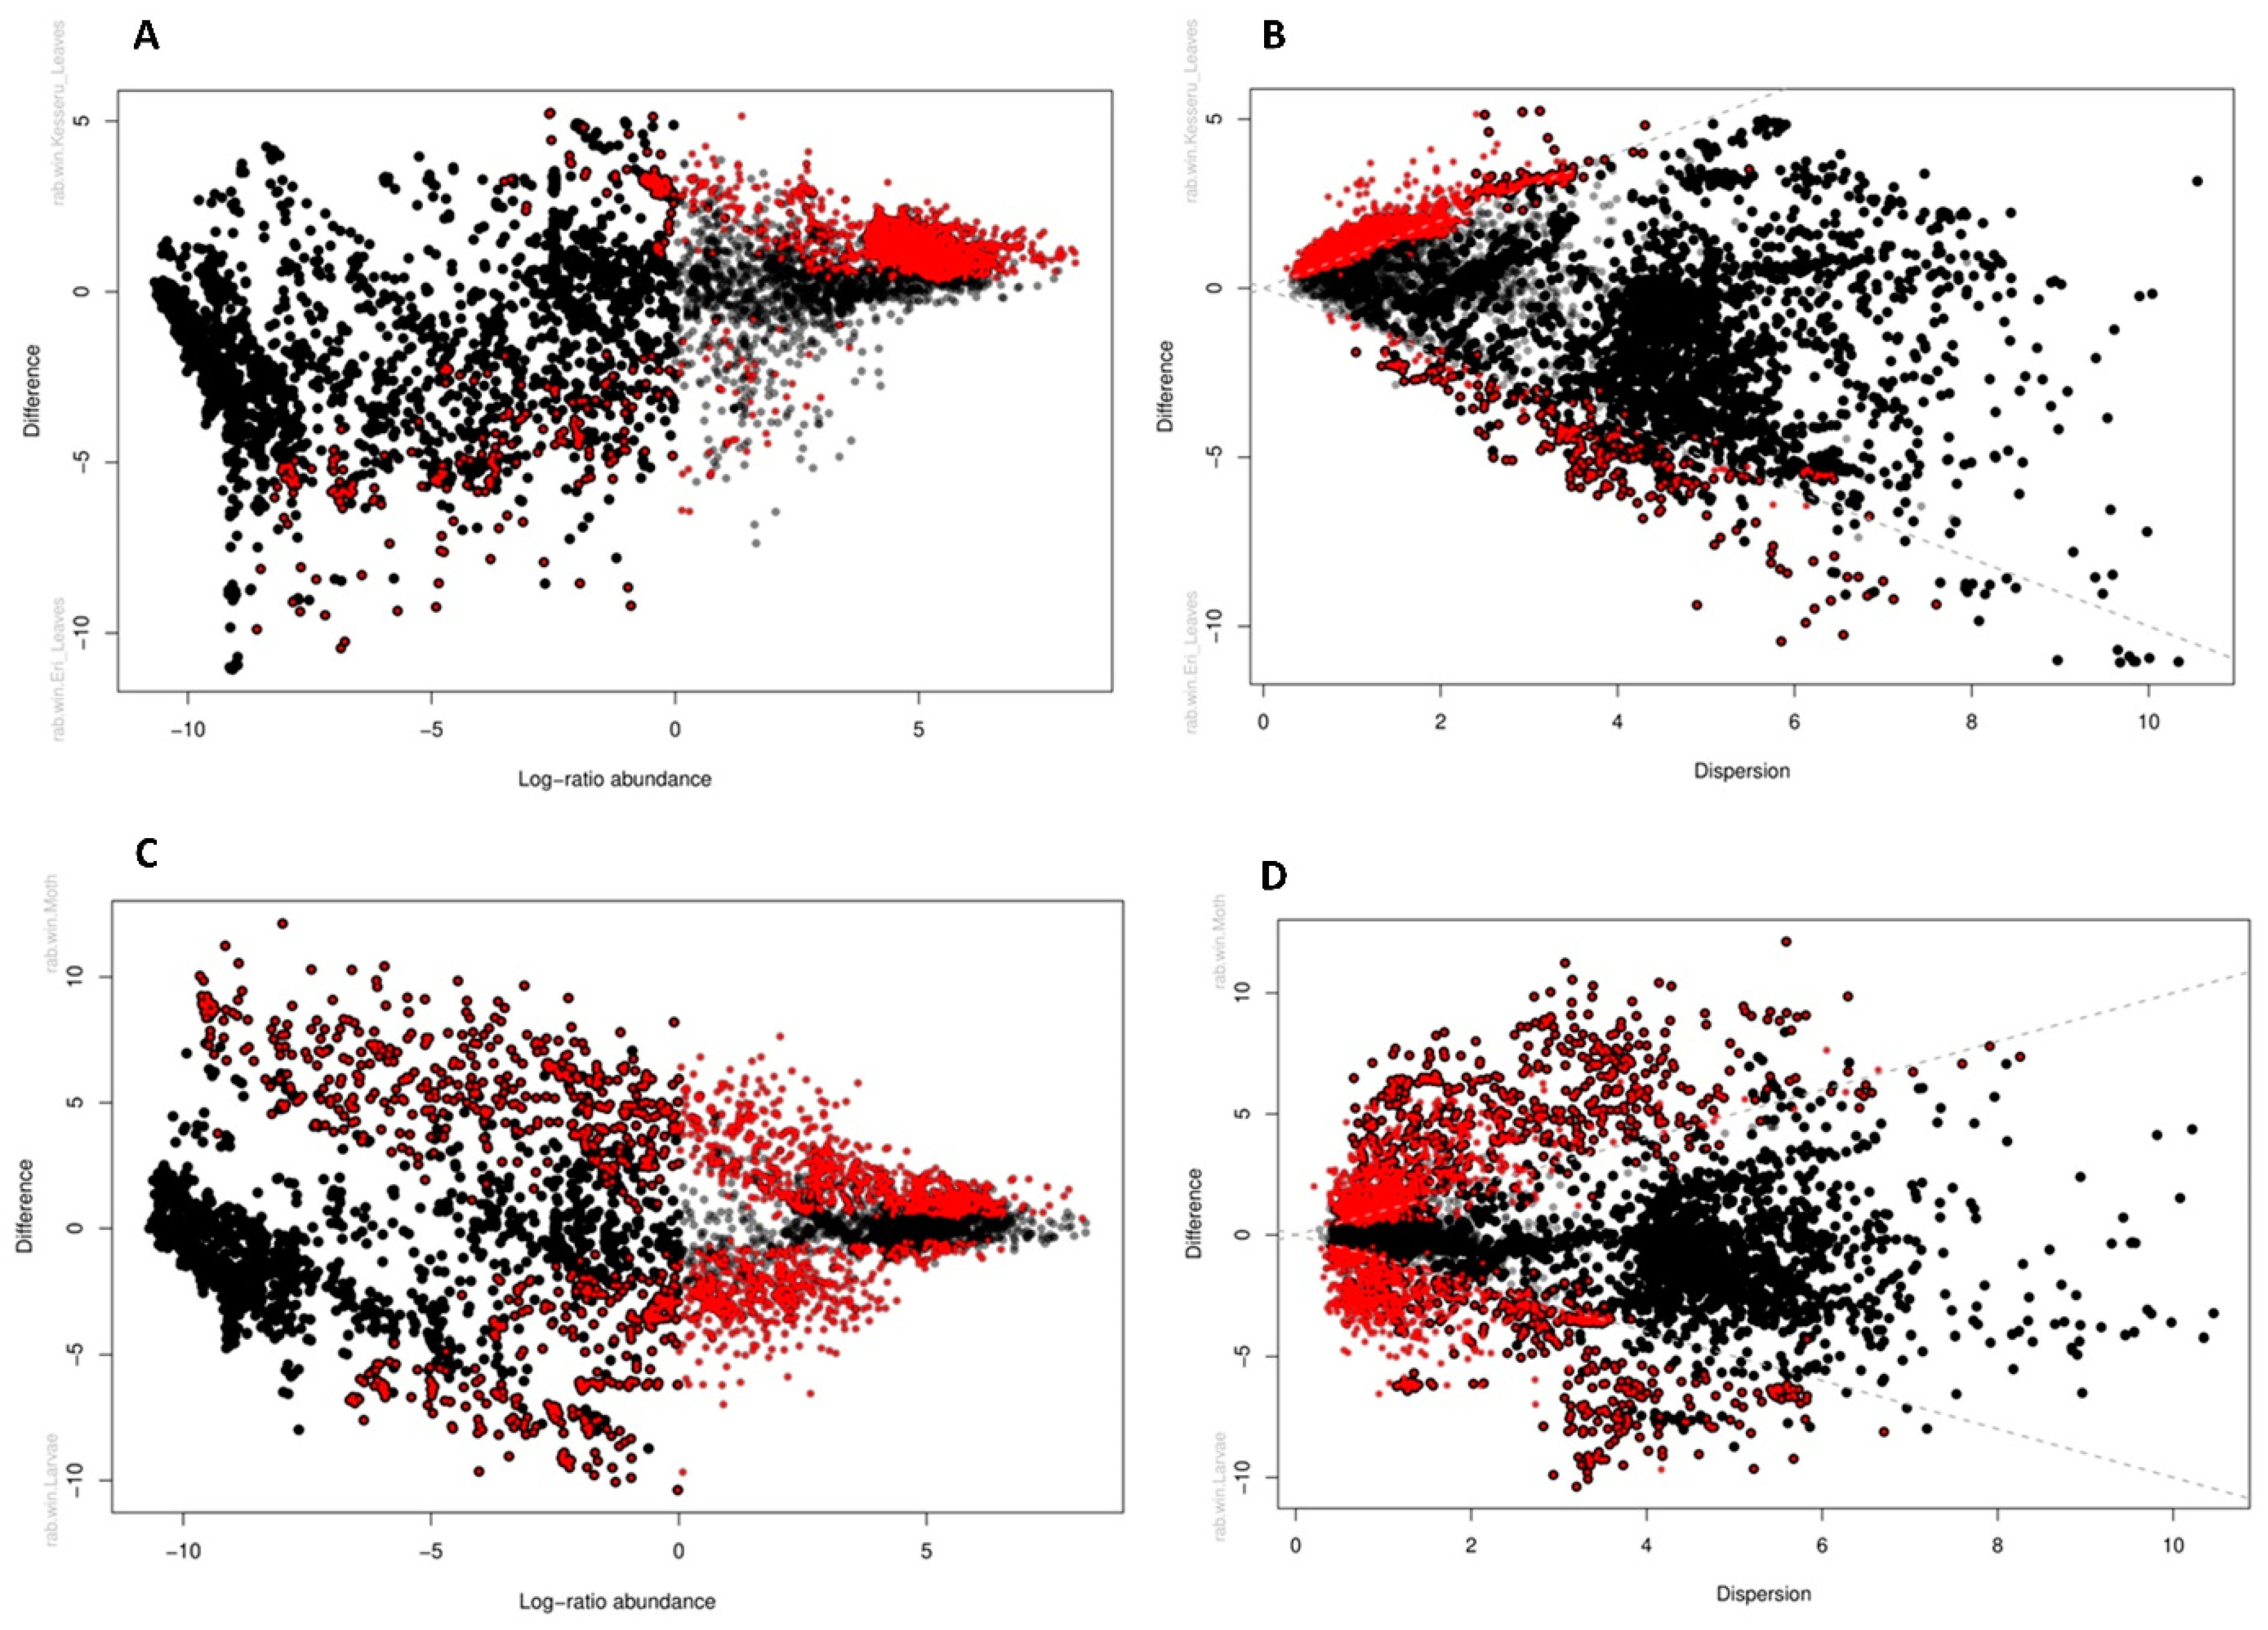
3.5. Differential Abundances

Differential abundance analyses were carried out considering single variables (diet and life stage) using DeSeq2. ANCOM-BC was used to perform an analysis based on both the variables considered together (Figure 7).
Phylum such as [Thermi], Actinobacteria, Bacteroidetes, Firmicutes, Proteobacteria, Tenericutes, and WPS-2 were the most differentially abundant with respect to diet. Eri-fed leaves were seen to have a higher abundance of most species such as Kaistobacter, Mollicutes, Dienococcus, Alteromonas, Aeromonadaceae, Alphaproteobacteria, Betaproteobacteria, Gammaproteobacteria, etc. Eri-fed leaves were also observed to have a more diverse presence of microbiome abundance.
A highly distinct pattern for life stage-based differential abundance was observed. Larval stages showed a higher abundance of unclassified bacteria, especially the Eri-fed larval samples. Bacteroidetes were seen to be more abundant in the adult stages, with Eri-fed female moths, in particular, having a very high abundance. Other species such as Oscillospira, Sutterala, Succinivibrionaceae, Faecebacterium prausnitzii, several species of unclassified Prevotella, Lachnospira, etc., were highly abundant in adult moths with respect to larvae.
Differential analysis taking both variables, i.e., diet types and life stages, into account was carried out using ANCOM-BC. The most significant phyla that were differentially abundant with respect to life stages were Actinobacteria, Chloroflexi, Crenarchaeota, Euryarchaeota, Plancomycetes, which consisted of species including Coriobacteriaceae, Bifidobacterium, Nocardioiceae, Pirellulaceae, Chloroflexi, Methanosaeta, Actinomyces, Mycobacterium, etc. The adult moths fed with both diets had comparatively similar microbiome patterns, irrespective of the diet. However, the female moth fed with Eri leaves resulted in higher abundances of Pirellulaceae, Rubrobacter, Planctomyces, Patulibacteriaceae, Methanoregulaceae, and unclassified C11. Bacterial samples belonging to Coriobacterium and Nocardioiceae were slightly differentially expressed in the adult moths with respect to diet.
A comparative network based on previous observations was constructed, where two nodes are connected if they are differentially associated between the two groups (Figure 7).
A significant differential network was observed among the species. In larval stages, positive correlations between species such as Gallibacterium, Bacillaceae, and Streptococcus were observed. Higher correlations among species such as Clostridiales, Firmicutes, Gallibacterium, Lachnospiraceae, Dialister, and Streptococcus were observed in moths. Some interactions such as between Bacillaceae and Enterobacteriaceae that were observed in adult moths were absent in larval samples, where interactions between species such as Rhizobiaceae and Enterobacteriaceae were present.

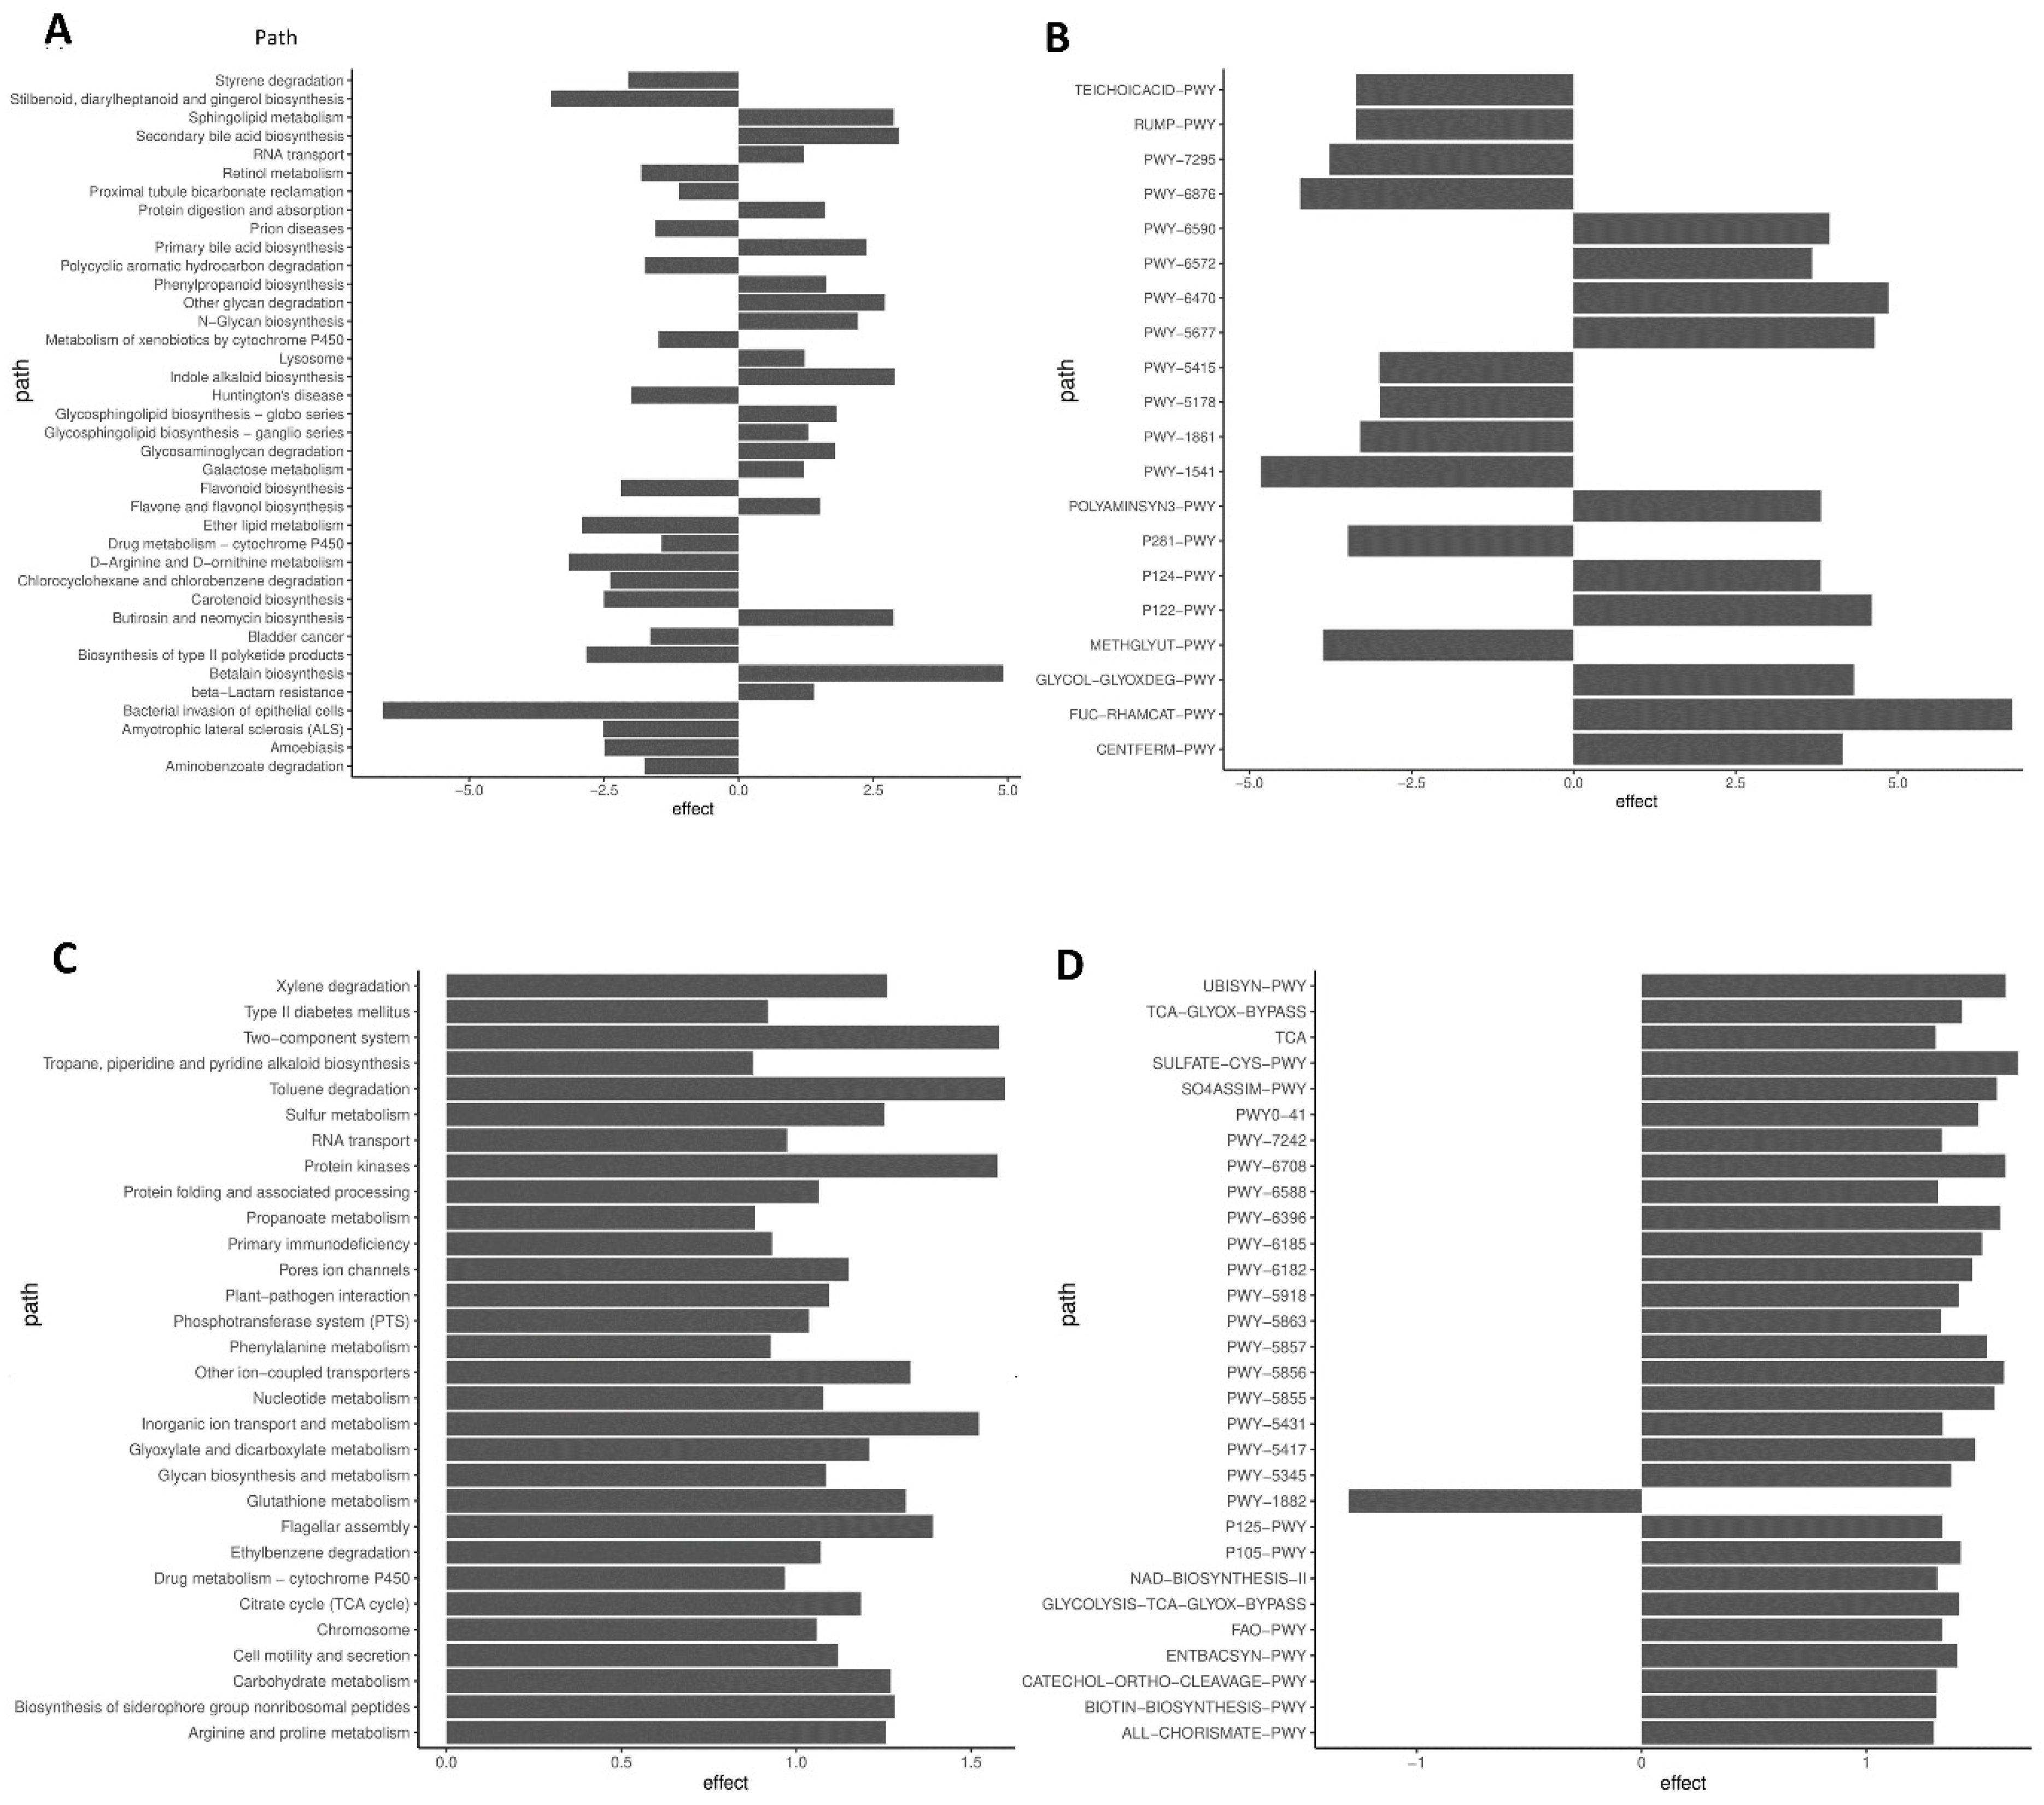
3.6. Predictive Functional Analyses

NMDS PCA diversity plots generated from KO-derived function and Metacyc pathway dissimilarities along the categories of diet and life stages are summarized through figures (Figure 8B,C).
Bland–Altman log-ratio abundance plots and dispersion plots representing differential abundance and the dispersion of functions based on diet and life stages are depicted in Figure 9A–D.
Bar plots showing significant functions (Kegg-derived) and pathways (Metacyc-derived) varying with respect to larval and adult life stages based on ALDEx2 outputs are represented (Figure 10A–D) (p < 0.05).
Significant differences in functions enriched in Eri-fed leaves were not observed compared to samples fed with Kesseru leaves. Metacyc pathway PWY-1882 (a super-pathway of C1 compounds’ oxidation to CO2) was enriched in Eri-fed samples. Functions including xylene degradation, toluene degradation, plant–pathogen interaction, carbohydrate metabolism, etc., although found in Eri-fed samples, were comparatively found to be enriched in Kesseru-fed samples (Figure 10A,B).
KO functions such as styrene degradation, hydrocarbon degradation, metabolism of xenobiotics, chlorohexane–chlorobenzene degradation, bacterial invasion of epithelial cells, and aminobenzoate degradation were observed to be enriched in larval stages. Metacyc database-derived pathways that included the teichoic acid pathway, formaldehyde oxidation/detoxification (PWY), arabinose degradation, catechol degradation, toluene degradation, formaldehyde assimilation, taurine degradation, 3 phenylpropanoate degradation, and methylglyoxal degradation were observed to be enriched in the larval stages. On the other hand, moth samples showed an increase in functions such as sphingolipid biosynthesis, RNA transport, bile biosynthesis, protein absorption, phenylpropanoid biosynthesis, lysosome, glycosphingolipid biosynthesis, galactose metabolism, flavone and flavanol biosynthesis, antibacterial and antifungal compound (butirosin, neomycin, and polyketide products) biosynthesis, β-lactam resistance, betalain biosynthesis, etc. Metacyc pathways showed the enrichment of pathways such as sulphate degradation, acidogenesis, several fermentation pathways, bifidobacterium shunt, polyamine biosynthesis, etc.
KO-derived functions that were significantly different in relation to the diet types were mostly the ones enriched in organisms fed with Kesseru leaves. In Eri-fed samples, the diversity of the microbiome present and predicted functional pathways through the growth stages were larger. No significant pathways or functions except PWY-1882 were found to be enriched in Eri-fed samples, which could be due to the high diversity of microbes in Eri-fed samples. Functions including xylene degradation, toluene degradation, and carbohydrate metabolism were comparatively found to be higher in Kesseru-fed samples (Figure 10C,D).

4. Discussion

Silkworm larvae reared on two different types of diets, i.e., Eri and Kesseru leaves, were observed to have a difference in their larval growth rate and egg viability rates. Similar observations have been reported by several other previous studies [35,71,72].
Although a shared microbiome among all the samples was observed, it was low. Compared to other groups of samples, larval samples fed on Eri leaves showed a higher diversity and shared a drastically smaller number of microbes. The number of OTUs including unclassified bacteria was also higher than that of other sample groups, implying its greater potential and that there is more information to be explored. This aligns with findings in Bombyx mori, where variation in natural host plant diets influenced gut microbial diversity, with certain plants supporting more diverse or distinct microbial communities [73].
The bacteria associated with adult moths consisted of those more involved in immunological functions (Erysipelotrichaceae, Lachnospira, and Ruminiococcaceae), homeostasis (Ruminiococcaceae), chemo-organotrophy (Succinivibrionaceae, members of Lachnospira), etc., [74,75,76]. Some species found in the adult gut were similar to those found in mammal vaginal environments (Megasphaera and Prevotella) and were associated with immunological functions [77,78,79]. Species such as members of the Burkholderia family were also reported in high numbers in other adult lepidoptera guts [13].
Rothio spp. were significantly present in Eri-fed samples and were reported to contribute to degrading and detoxifying gluten [80]. Nocardioidaceae decomposed carbohydrates and utilized excessive C and N sources [81]. Mollicutes were also reported to have unique N-associated metabolic capabilities and Kaistobacter with disease suppression [82,83].
Strains of Bifidobacterium and Lactobacilli have been associated with nutrition and have been categorized as probiobiotics [84]. They have also been artificially incorporated in artificial silkworm feed, successfully observing healthier growth [85,86,87]. In our study, apart from a minimal presence in the 5th instar of Eri-fed larval samples, Bifidobacterium has not been found in any other larval samples. Moth samples, however, had a significant presence of the species, mostly from Kesseru-fed samples. The presence of the microbe has also been known to be associated with immunity, higher resilience to social stress, and the secretion of GABA [88]. It has been reported to play a role in socializing in several animal studies [88,89]. Another microbe associated with similar functions was Oscillospira, which has also been found in moth samples, irrespective of diet differences [90]. Oscillospira sp. have been commonly found in the gut of many animals but have never been able to be cultured in vitro [91]. The beneficial effects of Lactobacillus and Bifidobacterium on silkworm health and development have been documented, supporting their role as probiotics in sericulture [74].
A large number of species were categorized under “unclassified bacteria”. A very common and economically important strain found in most lepidopterans, Serratia, was not identified in our study. This could be because it is absent altogether in the species in our study or because it is included in the unidentified strains. The absence of Serratia, contrasting with findings in other Lepidopterans, where it is often a dominant gut bacterium, could indicate possible species-specific microbiota compositions.
Most lepidoptera studies reported changes in gut microbiota through larval development. In our study, the highest diversity was observed between the larval and moth stages following metamorphosis. However, the microbiome abundance and change pattern of the instar stages were similar for both diet types. Early larval stages have a larger feature count, which decreases through increasing instars, being the lowest at the 4th instar and then drastically increasing to its highest during the 5th instar in both diet types. Species richness was also less in the 3rd and 4th instar stages. Adult moths had lower feature counts than those of larval stages but had higher species richnesses. When compared based on diet types, the Eri-fed larva had a much higher number of features compared to the Kesseru-fed larva; however, moths derived from Kesseru-fed larva had a higher number of features. To the best of our knowledge, these patterns have not been observed in previous Lepidoptera microbiome studies. Community difference was based on diet differences, whereby a broader ordination was observed for organisms fed on Eri leaves compared to those fed on Kesseru. These developmental shifts in microbiota composition have been observed in Bombyx mori and Spodoptera littoralis, where gut microbial communities change significantly across different life stages [13].
The compositional difference has been significant in some aspects, such as species richness, but moderately significant in community diversity, which could indicate that other genetic and environmental factors are responsible.
Functional prediction between larval and moth stages has given distinct and significant differences in various functions and pathways. Several KO-derived functions contributing to lipid biosynthesis and metabolism were enriched in adult moth stages. Several biosynthesis pathways were observed in the moth samples. These observations indicated their role in energy storage-based and immunological functions during the non-feeding moth stage. On the contrary, several enzymes contributing to degradation pathways including plant lignin, aromatic compounds, and toxins were found in the larval stages, indicating their role in the digestion of plant compounds. Pathways contributing to maintaining the pH gradient and electron transport were also found to be comparatively abundant in the larval stages.
Understanding an important species representing a large group of insects is of great significance. A comprehensive insight into the microbial composition of Samia cynthia ricini has been reported. Detailed patterns based on the various factors influencing it have been studied.
These microbiome community and predictive functional diversity observations suggested that the microbiome and the functions involved were highly distinct between the larvae and the moth samples. A complete microbiome restructure was observed between the samples, along with metamorphosis. Eri-fed larvae were phenotypically larger with a higher growth rate compared to Kesseru-fed samples. A higher diversity of microbiome presence in the Eri-fed samples implies an aid in the above phenotype.
Understanding the microbiome and its functional differences, along with diet differences and the differences in life stages, helps us to have a more controlled growth environment. Based on the above observations, the microbiome of the silkworm species can be manipulated accordingly for better growth and development, as required.
These findings could be used to various advantages for commercially important and other related organisms. Novel microbes with potential could be further explored. Further, these studies would contribute to the research gaps in insect biology, ecological adaptations, and evolution. The patterns and established hypotheses of the microbiome composition of the organism and their changes for different environmental conditions can also help with deeper analyses, combined with shotgun sequencing, to understand the microbial genome composition and important details including metagenome-assembled genomes (MAGs), horizontal gene transfers (HGTs), and antibiotic resistance genes (ARGs). Future studies could explore further insights consisting of multi-omics approaches.

5. Conclusions

This study presents a comprehensive analysis of the gut microbiome dynamics in Samia cynthia ricini, highlighting the impact of developmental stage and dietary variation on microbial composition and predicted metabolic functions. Our results reveal a marked restructuring of the microbiome during metamorphosis, with larval stages exhibiting distinct profiles compared to adult moths. Notably, larvae fed on Eri leaves not only showed enhanced growth rates and larger phenotypes but also harboured a more diverse microbial community than those fed on Kesseru leaves. Functional predictions further indicate that larval microbiomes are enriched in pathways related to the degradation of plant compounds and detoxification, whereas adult moths display increased biosynthetic, immunogenic, and energy storage functions. These findings underscore the potential for manipulating the gut microbiome to optimize growth conditions and silk production, and they pave the way for future multi-omics studies to unravel deeper insights into host–microbiome interactions and their evolutionary implications in lepidopteran species.
The current study comprises a few limitations. The use of 16S rRNA sequencing limited taxonomic resolution, leaving many microbes unclassified. Functional predictions were based on inference rather than validation through metatranscriptomics or proteomics. Environmental and vertical microbial transmission were not assessed. Hence, based on these limitations, future work should also use shotgun metagenomics, functional omics, and longitudinal sampling, along with experimental models, to better resolve microbial identities and functions and clarify host–microbiota interactions.

Supplementary Materials

The following supporting information can be downloaded at: https://www.mdpi.com/article/10.3390/applmicrobiol5020040/s1.

Author Contributions

B.B.: experimentation, investigation, bioinformatic analysis, methodology, writing —original draft, writing—review and editing, and validation. P.B.: bioinformatics analysis, validation, visualization, and writing—review and editing. U.B.: conceptualization, supervision, validation, and writing—review and editing. All authors have read and agreed to the published version of the manuscript.

Funding

This research received no external funding.

Data Availability Statement

The raw sequence data are available in the NCBI Short Read Archive (SRA) under the BioProjects—PRJNA1126020.

Acknowledgments

The authors wish to express their gratitude to the Centre for the Environment, Department of Biosciences and Bioengineering, and Central Instrumentation facility of the Indian Institute of Technology Guwahati for providing the facilities necessary to carry out the research.

Conflicts of Interest

The authors declare that they have no competing interests.

Abbreviations

HCNHydrogen cyanide
DflsDisease-free layings
PHECPhenol/chloroform
PBSPhosphate-buffered solution
SDSSodium dodecyl sulphate
DNADeoxyribonucleic acid
QIIME2Quantitative insights into microbial ecology 2
DADADivisive amplicon de-noising algorithm
ASVAmplicon sequence variants
OTUOperational taxonomic unit
PCoAPrincipal coordinates analysis
NMDSNon-metric multidimensional scaling
DADifferential abundance
ANCOM-BCAnalysis of compositions of microbiomes with bias correction
MEGANMEtaGenome analyser
CLRCentred-log ration
FDRsFalse discovery rates
PICRUSt2Phylogenetic investigation of communities by reconstruction of unobserved states
KOKegg-Orthology
KEGGKyoto encyclopedia of genes and genomes
Faith-PDFaith’s phylogenetic diversity
PERMANOVAPermutational multivariate analysis of variance
PWYFormaldehyde oxidation/detoxification
RNARibonucleic acid
GABAGamma-aminobutyric acid
MAGsMetagenome-assembled genomes
HGTsHorizontal gene transfers
ARGsAntibiotic resistance genes

References

  1. Gilbert, S.F.; Sapp, J.; Tauber, A.I. A symbiotic view of life: We have never been individuals. Q. Rev. Biol. 2012, 87, 325–341. [Google Scholar] [CrossRef] [PubMed]
  2. Groussin, M.; Mazel, F.; Alm, E.J. Co-evolution and Co-speciation of Host-Gut Bacteria Systems. Cell Host Microbe 2020, 28, 12–22. [Google Scholar] [CrossRef] [PubMed]
  3. Gupta, A.; Nair, S. Dynamics of Insect–Microbiome Interaction Influence Host and Microbial Symbiont. Front. Microbiol. 2020, 11, 1357. [Google Scholar] [CrossRef] [PubMed]
  4. Kikuchi, Y.; Hosokawa, T.; Nikoh, N.; Meng, X.-Y.; Kamagata, Y.; Fukatsu, T. Host-symbiont co-speciation and reductive genome evolution in gut symbiotic bacteria of acanthosomatid stinkbugs. BMC Biol. 2009, 7, 2. [Google Scholar] [CrossRef]
  5. Rolff, J.; Johnston, P.R.; Reynolds, S. Complete metamorphosis of insects. Philos. Trans. R. Soc. B Biol. Sci. 2019, 374, 20190063. [Google Scholar] [CrossRef]
  6. Wilbur, H.M. Complex life cycles. Annu. Rev. Ecol. Syst. 1980, 11, 67–93. [Google Scholar] [CrossRef]
  7. Zhang, X.; Zhang, F.; Lu, X. Diversity and Functional Roles of the Gut Microbiota in Lepidopteran Insects. Microorganisms 2022, 10, 1234. [Google Scholar] [CrossRef]
  8. Voirol, L.R.P.; Frago, E.; Kaltenpoth, M.; Hilker, M.; Fatouros, N.E. Bacterial symbionts in lepidoptera: Their diversity, transmission, and impact on the host. Front. Microbiol. 2018, 9, 556. [Google Scholar]
  9. Engel, P.; Moran, N.A. The gut microbiota of insects—Diversity in structure and function. FEMS Microbiol. Rev. 2013, 37, 699–735. [Google Scholar] [CrossRef]
  10. Hasan, N.; Yang, H. Factors affecting the composition of the gut microbiota, and its modulation. PeerJ 2019, 7, e7502. [Google Scholar] [CrossRef]
  11. Douglas, A.E. Multiorganismal Insects: Diversity and Function of Resident Microorganisms. Annu. Rev. Entomol. 2015, 60, 17. [Google Scholar] [CrossRef] [PubMed]
  12. Mason, C.J.; Clair, A.S.; Peiffer, M.; Gomez, E.; Jones, A.G.; Felton, G.W.; Hoover, K. Diet influences proliferation and stability of gut bacterial populations in herbivorous lepidopteran larvae. PLoS ONE 2020, 15, e0229848. [Google Scholar] [CrossRef]
  13. Chen, B.; Teh, B.-S.; Sun, C.; Hu, S.; Lu, X.; Boland, W.; Shao, Y. Biodiversity and Activity of the Gut Microbiota across the Life History of the Insect Herbivore Spodoptera littoralis. Sci. Rep. 2016, 6, 29505. [Google Scholar] [CrossRef] [PubMed]
  14. Jing, T.Z.; Qi, F.H.; Wang, Z.Y. Most dominant roles of insect gut bacteria: Digestion, detoxification, or essential nutrient provision? Microbiome 2020, 8, 38. [Google Scholar] [CrossRef]
  15. Ma, Q.; Cui, Y.; Chu, X.; Li, G.; Yang, M.; Wang, R.; Liang, G.; Wu, S.; Tigabu, M.; Zhang, F.; et al. Gut Bacterial Communities of Lymantria xylina and Their Associations with Host Development and Diet. Microorganisms 2021, 9, 1860. [Google Scholar] [CrossRef]
  16. Pandiarajan, J.; Krishnan, M. Comparative bacterial survey in the gut of lepidopteran insects with different bionetwork. Microbiology 2018, 87, 103–115. [Google Scholar] [CrossRef]
  17. Brinkmann, N.; Martens, R.; Tebbe, C.C. Origin and diversity of metabolically active gut bacteria from laboratory-bred larvae of Manduca sexta (Sphingidae, Lepidoptera, Insecta). Appl. Environ. Microbiol. 2008, 74, 7189–7196. [Google Scholar] [CrossRef]
  18. Henry, L.P.; Bruijning, M.; Forsberg, S.K.G.; Ayroles, J.F. The microbiome extends host evolutionary potential. Nat. Commun. 2021, 12, 5141. [Google Scholar] [CrossRef]
  19. Engel, P.; Moran, N.A. Functional and evolutionary insights into the simple yet specific gut microbiota of the honey bee from metagenomic analysis. Gut Microbes 2013, 4, 60. [Google Scholar] [CrossRef]
  20. Rowland, I.; Gibson, G.; Heinken, A.; Scott, K.; Swann, J.; Thiele, I.; Tuohy, K. Gut microbiota functions: Metabolism of nutrients and other food components. Eur. J. Nutr. 2018, 57, 1. [Google Scholar] [CrossRef]
  21. Lei, W.T.; Huang, K.Y.; Jhong, J.H.; Chen, C.H.; Weng, S.L. Metagenomic analysis of the gut microbiome composition associated with vitamin D supplementation in Taiwanese infants. Sci. Rep. 2021, 11, 2856. [Google Scholar] [CrossRef] [PubMed]
  22. Ren, Z.; Li, A.; Jiang, J.; Zhou, L.; Yu, Z.; Lu, H.; Xie, H.; Chen, X.; Shao, L.; Zhang, R.; et al. Gut microbiome analysis as a tool towards targeted non-invasive biomarkers for early hepatocellular carcinoma. Gut 2019, 68, 1014–1023. [Google Scholar] [CrossRef] [PubMed]
  23. Veziant, J.; Villéger, R.; Barnich, N.; Bonnet, M. Gut Microbiota as Potential Biomarker and/or Therapeutic Target to Improve the Management of Cancer: Focus on Colibactin-Producing Escherichia coli in Colorectal Cancer. Cancers 2021, 13, 2215. [Google Scholar] [CrossRef]
  24. Allaband, C.; McDonald, D.; Vázquez-Baeza, Y.; Minich, J.J.; Tripathi, A.; Brenner, D.A.; Loomba, R.; Smarr, L.; Sandborn, W.J.; Schnabl, B.; et al. Microbiome 101: Studying, Analyzing, and Interpreting Gut Microbiome Data for Clinicians. Clin. Gastroenterol. Hepatol. 2019, 17, 218. [Google Scholar] [CrossRef]
  25. Hammer, T.J.; Bowers, M.D. Gut microbes may facilitate insect herbivory of chemically defended plants. Oecologia 2015, 179, 1–14. [Google Scholar] [CrossRef] [PubMed]
  26. Show, B.K.; Banerjee, S.; Banerjee, A.; Ghosh Thakur, R.; Hazra, A.K.; Mandal, N.C.; Ross, A.B.; Balachandran, S.; Chaudhury, S. Insect gut bacteria: A promising tool for enhanced biogas production. Rev. Environ. Sci. Biotechnol. 2022, 21, 1–25. [Google Scholar] [CrossRef]
  27. Francoeur, C.B.; Khadempour, L.; Moreira-Soto, R.D.; Gotting, K.; Book, A.J.; Pinto-Tomás, A.A.; Keefover-Ring, K.; Currie, C.R. Bacteria contribute to plant secondary compound degradation in a generalist herbivore system. mBio 2020, 11, e02146-20. [Google Scholar] [CrossRef]
  28. Kohl, K.D.; Denise Dearing, M. The woodrat gut microbiota as an experimental system for understanding microbial metabolism of dietary toxins. Front. Microbiol. 2016, 7, 1165. [Google Scholar] [CrossRef]
  29. Krishnan, M.; Bharathiraja, C.; Pandiarajan, J.; Prasanna, V.A.; Rajendhran, J.; Gunasekaran, P. Insect gut microbiome—An unexploited reserve for biotechnological application. Asian Pac. J. Trop. Biomed. 2014, 4, S16. [Google Scholar] [CrossRef]
  30. Kedir Shifa, K.S.; Emana Getu, E.G.; Waktole Sori, W.S. Rearing Performance of Eri-Silkworm (Samia cynthia ricini Boisduval) (Lepidoptera: Saturniidae) Fed with Different Castor (Ricinus communis L.) Genotypes. J. Entomol. 2013, 11, 25–33. [Google Scholar] [CrossRef]
  31. Renuka, G.; Shamitha, G. Studies On The Economic Traits Of Eri Silkworm, Samia Cynthia Ricini, In Relation To Seasonal Variations. Int. J. Adv. Res. 2014, 2, 315–322. [Google Scholar]
  32. Sharma, P.; Chandra Kalita, J. A comparative study on six strains of eri silk worm (samia ricini; donovan) based on morphological traits. Glob. J. Bio-Sci. Biotechnol. 2013, 2, 506–511. [Google Scholar]
  33. Ahmed, S.A.; Singh, N.I.; Sarkar, C.R. Role of forest biodiversity in conservation of non-mulberry (vanya) silk in India. Munis Entomol. Zool. 2015, 10, 342–357. [Google Scholar]
  34. Velayudhan, K.; Balachandran, N.; RadhaKrishnan, S.; Singh, B.K.; Jayaprakash, P. Biodiversity in Eri Silkworm Samia Ricini (Donovan) Genetic Resources and its Conservation. J. Aquat. Biol. Fish. 2014, 2, 817–824. [Google Scholar]
  35. Government of Assam, India. Handloom Textiles & Sericulture. Host Plants of Eri Silkworm. Available online: https://hts.assam.gov.in/portlet-innerpage/host-plants-of-eri-silkworm (accessed on 15 July 2020).
  36. Churchandpur, Manipur. Improved Varieties of Silkworm Food Plants. Available online: https://silks.csb.gov.in/churchandpur/improved-varieties-of-silkworm-food-plants/ (accessed on 10 August 2020).
  37. Zhang, N.; He, J.; Shen, X.; Sun, C.; Muhammad, A.; Shao, Y. Contribution of sample processing to gut microbiome analysis in the model Lepidoptera, silkworm Bombyx mori. Comput. Struct. Biotechnol. J. 2021, 19, 4658–4668. [Google Scholar] [CrossRef]
  38. Keen, J.N.; Austin, M.K.; Huang, L.S.; Messing, S.; Wyatt, J.D. Efficacy of Soaking in 70% Isopropyl Alcohol on Aerobic Bacterial Decontamination of Surgical Instruments and Gloves for Serial Mouse Laparotomies. J. Am. Assoc. Lab. Anim. Sci. 2010, 49, 832. [Google Scholar]
  39. Gerasimidis, K.; Bertz, M.; Quince, C.; Brunner, K.; Bruce, A.; Combet, E.; Calus, S.; Loman, N.; Ijaz, U.Z. The effect of DNA extraction methodology on gut microbiota research applications. BMC Res. Notes 2016, 9, 365. [Google Scholar] [CrossRef]
  40. García-Alegría, A.M.; Anduro-Corona, I.; Pérez-Martínez, C.J.; Corella-Madueño, M.A.G.; Rascón-Durán, M.L.; Astiazaran-Garcia, H. Quantification of DNA through the nanodrop spectrophotometer: Methodological validation using standard reference material and sprague dawley rat and human DNA. Int. J. Anal. Chem. 2020, 2020, 8896738. [Google Scholar] [CrossRef]
  41. Olson, N.D.; Morrow, J.B. DNA extract characterization process for microbial detection methods development and validation. BMC Res. Notes 2012, 5, 668. [Google Scholar] [CrossRef]
  42. Babraham Bioinformatics—FastQC A Quality Control Tool for High Throughput Sequence Data. Available online: https://www.bioinformatics.babraham.ac.uk/projects/fastqc/ (accessed on 20 October 2021).
  43. Bolyen, E.; Rideout, J.R.; Dillon, M.R.; Bokulich, N.A.; Abnet, C.C.; Al-Ghalith, G.A.; Alexander, H.; Alm, E.J.; Arumugam, M.; Asnicar, F.; et al. Reproducible, interactive, scalable and extensible microbiome data science using QIIME 2. Nat. Biotechnol. 2019, 37, 852–857. [Google Scholar] [CrossRef]
  44. Callahan, B.J.; Mcmurdie, P.J.; Rosen, M.J.; Han, A.W.; Johnson, A.J.A.; Holmes, S.P. DADA2: High-resolution sample inference from Illumina amplicon data. Nat. Methods 2016, 13, 581–583. [Google Scholar] [CrossRef] [PubMed]
  45. Rognes, T.; Flouri, T.; Nichols, B.; Quince, C.; Mahé, F. VSEARCH: A versatile open source tool for metagenomics. PeerJ 2016, 4, e2584. [Google Scholar] [CrossRef] [PubMed]
  46. McDonald, D.; Price, M.N.; Goodrich, J.; Nawrocki, E.P.; DeSantis, T.Z.; Probst, A.; Andersen, G.L.; Knight, R.; Hugenholtz, P. An improved Greengenes taxonomy with explicit ranks for ecological and evolutionary analyses of bacteria and archaea. ISME J. 2012, 6, 610–618. [Google Scholar] [CrossRef] [PubMed]
  47. Bokulich, N.A.; Kaehler, B.D.; Rideout, J.R.; Dillon, M.; Bolyen, E.; Knight, R.; Huttley, G.A.; Gregory Caporaso, J. Optimizing taxonomic classification of marker-gene amplicon sequences with QIIME 2’s q2-feature-classifier plugin. Microbiome 2018, 6, 90. [Google Scholar] [CrossRef]
  48. Draw Venn Diagram. Available online: https://bioinformatics.psb.ugent.be/webtools/Venn/ (accessed on 12 February 2022).
  49. RStudio. Open Source & Professional Software for Data Science Teams—RStudio. Available online: https://www.rstudio.com/ (accessed on 15 November 2022).
  50. McMurdie, P.J.; Holmes, S. phyloseq: An R Package for Reproducible Interactive Analysis and Graphics of Microbiome Census Data. PLoS ONE 2013, 8, e61217. [Google Scholar] [CrossRef]
  51. Price, M.N.; Dehal, P.S.; Arkin, A.P. FastTree 2—Approximately Maximum-Likelihood Trees for Large Alignments. PLoS ONE 2010, 5, e9490. [Google Scholar] [CrossRef]
  52. Katoh, K.; Misawa, K.; Kuma, K.I.; Miyata, T. MAFFT: A novel method for rapid multiple sequence alignment based on fast Fourier transform. Nucleic Acids Res. 2002, 30, 3059–3066. [Google Scholar] [CrossRef]
  53. Faith, D.P. Conservation evaluation and phylogenetic diversity. Biol. Conserv. 1992, 61, 1–10. [Google Scholar] [CrossRef]
  54. Lozupone, C.A.; Hamady, M.; Kelley, S.T.; Knight, R. Quantitative and qualitative beta diversity measures lead to different insights into factors that structure microbial communities. Appl. Environ. Microbiol. 2007, 73, 1576–1585. [Google Scholar] [CrossRef]
  55. Konopiński, M.K. Shannon diversity index: A call to replace the original Shannon’s formula with unbiased estimator in the population genetics studies. PeerJ 2020, 8, e9391. [Google Scholar] [CrossRef]
  56. Lozupone, C.; Knight, R. UniFrac: A New Phylogenetic Method for Comparing Microbial Communities. Appl. Environ. Microbiol. 2005, 71, 8228. [Google Scholar] [CrossRef]
  57. Davenport, J.M. New approxzmations to theexact distribution of the kruskal-wallis test statistic. Commun. Stat. Theory Methods 1976, 5, 1335–1348. [Google Scholar]
  58. Kelly, B.J.; Gross, R.; Bittinger, K.; Sherrill-Mix, S.; Lewis, J.D.; Collman, R.G.; Bushman, F.D.; Li, H. Power and sample-size estimation for microbiome studies using pairwise distances and PERMANOVA. Bioinformatics 2015, 31, 2461–2468. [Google Scholar] [CrossRef] [PubMed]
  59. Love, M.I.; Huber, W.; Anders, S. Moderated estimation of fold change and dispersion for RNA-seq data with DESeq2. Genome Biol. 2014, 15, 550. [Google Scholar] [CrossRef]
  60. Lin, H.; das Peddada, S. Analysis of compositions of microbiomes with bias correction. Nat. Commun. 2020, 11, 3514. [Google Scholar] [CrossRef]
  61. Gu, Z.; Eils, R.; Schlesner, M. Complex heatmaps reveal patterns and correlations in multidimensional genomic data. Bioinformatics 2016, 32, 2847–2849. [Google Scholar] [CrossRef] [PubMed]
  62. Huson, D.H.; Beier, S.; Flade, I.; Górska, A.; El-Hadidi, M.; Mitra, S.; Ruscheweyh, H.-J.; Tappu, R. MEGAN Community Edition—Interactive Exploration and Analysis of Large-Scale Microbiome Sequencing Data. PLoS Comput. Biol. 2016, 12, e1004957. [Google Scholar] [CrossRef]
  63. Peschel, S.; Müller, C.L.; von Mutius, E.; Boulesteix, A.L.; Depner, M. NetCoMi: Network construction and comparison for microbiome data in R. Brief. Bioinform. 2021, 22, bbaa290. [Google Scholar] [CrossRef]
  64. Douglas, G.M.; Maffei, V.J.; Zaneveld, J.R.; Yurgel, S.N.; Brown, J.R.; Taylor, C.M.; Huttenhower, C.; Langille, M.G.I. PICRUSt2 for prediction of metagenome functions. Nat. Biotechnol. 2020, 38, 685–688. [Google Scholar] [CrossRef]
  65. Fernandes, A.D.; Macklaim, J.M.; Linn, T.G.; Reid, G.; Gloor, G.B. ANOVA-Like Differential Expression (ALDEx) Analysis for Mixed Population RNA-Seq. PLoS ONE 2013, 8, e67019. [Google Scholar] [CrossRef]
  66. Welch, B.L. The Significance of the Difference Between Two Means When the Population Variances Are Unequal. Biometrika 1938, 29, 350–362. [Google Scholar] [CrossRef]
  67. Altman, D.G.; Bland, J.M. Measurement in Medicine: The Analysis of Method Comparison Studies. Statistician 1983, 32, 307. [Google Scholar] [CrossRef]
  68. Kanehisa, M.; Furumichi, M.; Sato, Y.; Ishiguro-Watanabe, M.; Tanabe, M. KEGG: Integrating viruses and cellular organisms. Nucleic Acids Res. 2021, 49, D545–D551. [Google Scholar] [CrossRef] [PubMed]
  69. Caspi, R.; Billington, R.; Keseler, I.M.; Kothari, A.; Krummenacker, M.; Midford, P.E.; Ong, W.K.; Paley, S.; Subhraveti, P.; Karp, P.D. The MetaCyc database of metabolic pathways and enzymes—A 2019 update. Nucleic Acids Res. 2020, 48, D445–D453. [Google Scholar] [CrossRef]
  70. Benjamini, Y.; Hochberg, Y. Controlling the False Discovery Rate: A Practical and Powerful Approach to Multiple Testing. J. R. Stat. Soc. Ser. B (Methodol.) 1995, 57, 289–300. [Google Scholar] [CrossRef]
  71. Effect of Differential Feeding on Eri Silk Worm (Samia Ricini Donovan) and Its Pupal Protein Concentration. Available online: https://www.researchgate.net/publication/319178276_Effect_of_Differential_Feeding_on_Eri_Silk_Worm_Samia_Ricini_Donovan_and_its_Pupal_Protein_Concentration (accessed on 16 December 2021).
  72. Baruah, M.; Bari, P. Studies on Larval Weight and Shell Ratio of Eri Silkworm (Philosamia ricini) on Castor, Kesseru and Treated Kesseru by Foliar Spray. Int. J. Comput. Appl. Eng. Sci. 2012, 2, 133–137. [Google Scholar]
  73. Canani, R.B.; De Filippis, F.; Nocerino, R.; Laiola, M.; Paparo, L.; Calignano, A.; De Caro, C.; Coretti, L.; Chiariotti, L.; Gilbert, J.A.; et al. Specific signatures of the gut microbiota and increased levels of butyrate in children treated with fermented cow’s milk containing heat-killed Lactobacillus paracasei CBA L74. Appl. Environ. Microbiol. 2017, 83, e01206-17. [Google Scholar]
  74. Kaakoush, N.O. Insights into the role of Erysipelotrichaceae in the human host. Front. Cell. Infect. Microbiol. 2015, 5, 84. [Google Scholar] [CrossRef]
  75. Jiang, W.; Wu, N.; Wang, X.; Chi, Y.; Zhang, Y.; Qiu, X.; Hu, Y.; Li, J.; Liu, Y. Dysbiosis gut microbiota associated with inflammation and impaired mucosal immune function in intestine of humans with non-alcoholic fatty liver disease. Sci. Rep. 2015, 5, 8096. [Google Scholar] [CrossRef]
  76. Ng, S.H.; Stat, M.; Bunce, M.; Simmons, L.W. The influence of diet and environment on the gut microbial community of field crickets. Ecol. Evol. 2018, 8, 4704. [Google Scholar] [CrossRef]
  77. van Teijlingen, N.H.; Helgers, L.C.; Zijlstra-Willems, E.M.; van Hamme, J.L.; Ribeiro, C.M.; Strijbis, K.; Geijtenbeek, T.B. Vaginal dysbiosis associated-bacteria Megasphaera elsdenii and Prevotella timonensis induce immune activation via dendritic cells. J. Reprod. Immunol. 2020, 138, 103085. [Google Scholar] [CrossRef]
  78. Iljazovic, A.; Roy, U.; Gálvez, E.J.C.; Lesker, T.R.; Zhao, B.; Gronow, A.; Amend, L.; Will, S.E.; Hofmann, J.D.; Pils, M.C.; et al. Perturbation of the gut microbiome by Prevotella spp. enhances host susceptibility to mucosal inflammation. Mucosal Immunol. 2020, 14, 113–124. [Google Scholar] [CrossRef] [PubMed]
  79. Tainchum, K.; Dupont, C.; Chareonviriyaphap, T.; Jumas-Bilak, E.; Bangs, M.J.; Manguin, S. Bacterial Microbiome in Wild-Caught Anopheles Mosquitoes in Western Thailand. Front. Microbiol. 2020, 11, 965. [Google Scholar] [CrossRef] [PubMed]
  80. Zamakhchari, M.; Wei, G.; Dewhirst, F.; Lee, J.; Schuppan, D.; Oppenheim, F.G.; Helmerhorst, E.J. Identification of Rothia Bacteria as Gluten-Degrading Natural Colonizers of the Upper Gastro-Intestinal Tract. PLoS ONE 2011, 6, e24455. [Google Scholar] [CrossRef] [PubMed]
  81. Zhang, M.; Jin, B.-J.; Bi, Q.-F.; Li, K.-J.; Sun, C.-L.; Lin, X.-Y.; Zhu, Y.-G. Variations of earthworm gut bacterial community composition and metabolic functions in coastal upland soil along a 700-year reclamation chronosequence. Sci. Total Environ. 2022, 804, 149994. [Google Scholar] [CrossRef]
  82. Sapountzis, P.; Zhukova, M.; Shik, J.Z.; Schiott, M.; Boomsma, J.J. Reconstructing the functions of endosymbiotic mollicutes in fungus-growing ants. Elife 2018, 7, e39209. [Google Scholar] [CrossRef]
  83. Liu, X.; Zhang, S.; Jiang, Q.; Bai, Y.; Shen, G.; Li, S.; Ding, W. Using community analysis to explore bacterial indicators for disease suppression of tobacco bacterial wilt. Sci. Rep. 2016, 6, 36773. [Google Scholar] [CrossRef]
  84. Fijan, S. Microorganisms with Claimed Probiotic Properties: An Overview of Recent Literature. Int. J. Environ. Res. Public Health 2014, 11, 4745. [Google Scholar] [CrossRef]
  85. Zuko, Y.; Maeda, K. The effect of intestinal Bifidobacterium on the output of Bombyx mori. Peer J. Prepr. 2018. [Google Scholar] [CrossRef]
  86. Soliman, S. Micro-Organisms Supplementation to Mulberry Silkworm, Bombyx mori L. Egypt. Acad. J. Biol. Sci. Entomol. 2017, 10, 57–64. [Google Scholar]
  87. Nishida, S.; Ono, Y.; Sekimizu, K. Lactic acid bacteria activating innate immunity improve survival in bacterial infection model of silkworm. Drug Discov. Ther. 2016, 10, 49–56. [Google Scholar] [CrossRef] [PubMed]
  88. Yang, C.; Fujita, Y.; Ren, Q.; Ma, M.; Dong, C.; Hashimoto, K. Bifidobacterium in the gut microbiota confer resilience to chronic social defeat stress in mice. Sci. Rep. 2017, 7, 45942. [Google Scholar] [CrossRef] [PubMed]
  89. Socała, K.; Doboszewska, U.; Szopa, A.; Serefko, A.; Włodarczyk, M.; Zielińska, A.; Poleszak, E.; Fichna, J.; Wlaź, P. The role of microbiota-gut-brain axis in neuropsychiatric and neurological disorders. Pharmacol. Res. 2021, 172, 105840. [Google Scholar] [CrossRef] [PubMed]
  90. Maltz, R.M.; Keirsey, J.; Kim, S.C.; Mackos, A.R.; Gharaibeh, R.Z.; Moore, C.C.; Xu, J.; Somogyi, A.; Bailey, M.T. Social stress affects colonic inflammation, the gut microbiome, and short chain fatty acid levels and receptors. J. Pediatr. Gastroenterol. Nutr. 2019, 68, 533. [Google Scholar] [CrossRef]
  91. Dance, A. The search for microbial dark matter. Nature 2020, 582, 301–303. [Google Scholar] [CrossRef]
Figure 1. (A) Taxa bar plot representing microbial communities and the overall microbial diversity at the genus level (legend provided in Supplementary Materials). (B) Taxonomic abundance at the phylum level representing microbial community diversity among the samples. <2.5% indicates the rare taxa in each group, with a median relative abundance < 2.5%.
Applmicrobiol 05 00040 g001
Figure 2. Shared OTUs. (A) Eri-fed larval stages (SCLE1, SCLE2, SCLE3, SCLE4, and SCLE5); (B) Kesseru-fed larval stages (SCLK1, SCLK2, SCLK3, SCLK4, and SCLK5); (C) adult moths (female and male) from Eri-fed samples (SCLEF and SCLEM); (D) adult moths (female and male) from Kesseru-fed samples (SCLKF and SCLKM).
Applmicrobiol 05 00040 g002
Figure 3. Shannon’s entropy depicting species richness among sample groups. (A) Growth stages (Instar1, Instar2, Instar3, Instar4, Instar5, Moth female, and Moth male) (p = 0.2). (B) Diet (Eri-fed samples and Kesseru-fed samples) (p = 0.2). (C) Life stages (Larvae and Moth) (p = 0.08). [OTU-based].
Applmicrobiol 05 00040 g003
Figure 4. Box plots depicting species richness based on Faith’s phylogenetic diversity (PD) among sample groups (A) Growth stages (Instar1, Instar2, Instar3, Instar4, Instar5, Moth female, and Moth male) (p = 0.8). (B) Diet (Eri-fed samples and Kesseru-fed samples) (p = 0.2). (C) Life stages (Larvae and Moth) (p = 0.39). [Phylogenetic distance-based]. Box plots depicting species evenness based on Pielou’s index among sample groups: (D) growth stages (Instar1, Instar2, Instar3, Instar4, Instar5, Moth female, and Moth male) (p = 0.3). (E) Diet (Eri-fed samples and Kesseru-fed samples) (p = 0.27). (F) Life stages (Larvae and Moth) (p = 0.11).
Applmicrobiol 05 00040 g004
Figure 5. PCoA plots depicting β-diversity among samples. (A) Jaccard’s index; (B) weighted-UniFrac distance (phylogenetic distance-based quantitative measure of branch length); (C) unweighted-UniFrac distance (phylogenetic distance-based qualitative measure).
Applmicrobiol 05 00040 g005
Figure 6. Cladogram representing the evolutionary relationship between the taxa present in the samples.
Applmicrobiol 05 00040 g006
Figure 7. Microbiome differential abundances based on diet as a variable (Eri leaves and Kesseru leaves) and life stages. The 20 most significant species are mapped (p < 0.05).
Applmicrobiol 05 00040 g007
Figure 8. A Differential association networks between sample groups of larva and adult moths. Green indicated positive associations, while red indicated negative associations. Significant OTUs differentially associated: 302,431 (Clostridiales); 518,033 (Firmicutes); 708,925 (Gallibacterium); 440,676 (Bacillaceae); 297,872 (Lachnospiraceae); 215,040 (Dialister); 439,932 (Streptococcus); 686,593 (Rhizobiaceae); 545,371 (Lactobacillus); 749,805 (Betaproteobacteria); 153,647 (Methanosphaera); 555,844 (Bacillaceae); 656,881 (Enterobacteriaceae); 242,326 (Bacteroidetes); 151,841 (Bacteroidales). (B,C) NMDS plot of functional prediction representing (A) KO-derived L3 functions and (B) Metacyc pathways.
Applmicrobiol 05 00040 g008
Figure 9. Bland–Altman log-ratio abundance (MA) plots depicting Kegg-Orthology differential abundance between sample groups. (A) Diet types (Eri-fed vs. Kesseru-fed). (B) Life stages (Larva vs. Adult). Effect (MW) plots depicting the dispersion of differential abundance between sample groups. (C) Diet types (Eri-fed vs. Kesseru-fed). (D) Life stages (Larva vs. Adult).
Applmicrobiol 05 00040 g009
Figure 10. Most significant (A) functions (Kegg-derived) and (B) pathways (Metacyc-derived) based on their differential abundance between different diet types [Effect scores > 0: enriched in Eri_Leaves; <0: enriched in Kesseru_Leaves]. Most significant (C) functions (Kegg-derived) and (D) pathways (Metacyc-derived) based on their differential abundance between different life stages. [Effect scores > 0: enriched in larvae; <0: enriched in moth].
Applmicrobiol 05 00040 g010
Table 1. Sample metadata summarizing sample names and variable categories.
Sample NameDietGrowth Stage
SCLE1Eri LeavesInstar 1
SCLE2Eri LeavesInstar 2
SCLE3Eri LeavesInstar 3
SCLE4Eri LeavesInstar 4
SCLE5Eri LeavesInstar 5
SCLEFEri LeavesMoth Female
SCLEMEri LeavesMoth Male
SCLK1Kesseru LeavesInstar 1
SCLK2Kesseru LeavesInstar 2
SCLK3Kesseru LeavesInstar 3
SCLK4Kesseru LeavesInstar 4
SCLK5Kesseru LeavesInstar 5
SCLKFKesseru LeavesMoth Female
SCLKMKesseru LeavesMoth Male
Table 2. Summary of de-noised filtered outputs.
Sample IDInputFilteredPercentage of Input Passed FilterDe-noisedMergedPercentage of Input MergedNon-ChimericPercentage of Input Non-Chimeric
SCLE1274,989245,92589.43234,527212,44577.26176,24164.09
SCLE2280,585228,50981.44221,840213,17775.98193,69069.03
SCLE3229,700170,83874.37165,618160,69969.96143,54262.49
SCLE4149,293103,10269.06101,42597,56665.3578,31752.46
SCLE5246,061207,26684.23203,619193,79478.76184,84575.12
SCLEF113,21585,62375.6381,18366,81159.0142,27637.34
SCLEM330,290126,52738.31119,89689,41827.0732,7039.9
SCLK1167,516120,39871.87117,746108,25564.6268,18540.7
SCLK2152,280111,11372.97109,436104,63668.7180,64752.96
SCLK3159,959111,20369.52109,329101,58463.5160,49137.82
SCLK4168,90496,37757.0693,81086,83451.4144,06126.09
SCLK5162,808102,29462.8399,24191,31056.0853,87933.09
SCLKF477,230200,53342.02192,900152,74832.0160,63412.71
SCLKM361,644154,51242.72147,553114,55531.6846,11712.75
Table 3. Summary of final feature table filtered output following OTU collapse and removal of mitochondria and chloroplasts.
MetricUnfiltered_TableFiltered_Table
Number of Samples1414
Number of features63411139
Total Frequency1,265,628980,296
Table 4. Core microbiome at 100% identity.
Feature IDTaxonomy
656881k__Bacteria; p__Proteobacteria; c__Gammaproteobacteria; o__Enterobacteriales; f__Enterobacteriaceae; g__; s__
289174k__Bacteria; p__Proteobacteria; c__Gammaproteobacteria; o__Enterobacteriales; f__Enterobacteriaceae; g__Plesiomonas; s__shigelloides
4438565k__Bacteria; p__Proteobacteria; c__Gammaproteobacteria; o__Pseudomonadales; f__Pseudomonadaceae; g__Pseudomonas; s__
4406763k__Bacteria; p__Firmicutes; c__Bacilli; o__Bacillales; f__Bacillaceae; g__; s__
749805k__Bacteria; p__Proteobacteria; c__Betaproteobacteria
686593k__Bacteria; p__Proteobacteria; c__Alphaproteobacteria; o__Rhizobiales; f__Rhizobiaceae; g__; s__
945326k__Bacteria; p__Firmicutes; c__Bacilli; o__Bacillales; f__Bacillaceae; g__; s__
73760k__Bacteria; p__Proteobacteria; c__Betaproteobacteria; o__MKC10; f__; g__; s__
126133k__Bacteria; p__Proteobacteria; c__Gammaproteobacteria; o__Pseudomonadales; f__Moraxellaceae; g__Acinetobacter; s__
516809k__Bacteria; p__Proteobacteria; c__Gammaproteobacteria; o__Xanthomonadales; f__Xanthomonadaceae; g__Stenotrophomonas; s__
212688k__Bacteria; p__Proteobacteria; c__Alphaproteobacteria; o__Caulobacterales; f__Caulobacteraceae; g__; s__
Table 5. Summary of β-diversity significance according to PERMANOVA between different sample groups. Sample size = 14. Number of groups for growth stages = 7; diet = 2; life stages = 2.
Groupp-ValueTest Statistic
Growth stages0.1671.271346
Diet0.131.44053
Life stages (Larva vs. Moth)0.0014.94633
Disclaimer/Publisher’s Note: The statements, opinions and data contained in all publications are solely those of the individual author(s) and contributor(s) and not of MDPI and/or the editor(s). MDPI and/or the editor(s) disclaim responsibility for any injury to people or property resulting from any ideas, methods, instructions or products referred to in the content.

