Article

Interactions of Laser-Induced Thermal Plume with Liquid–Air Interfaces in Straight-Chain Alcohols

1
Department of Chemistry, Concordia College, Moorhead, MN 56562, USA
2
Department of Physics, Concordia College, Moorhead, MN 56562, USA
*
Author to whom correspondence should be addressed.
Liquids 2024, 4(4), 732-743; https://doi.org/10.3390/liquids4040041
Submission received: 18 October 2024 / Revised: 12 November 2024 / Accepted: 19 November 2024 / Published: 22 November 2024
(This article belongs to the Special Issue Energy Transfer in Liquids)

Abstract

:
This study investigates the dynamics of thermal plumes interacting with the liquid–air interface in straight-chain alcohols and their mixtures using a photothermal imaging technique based on thermal lensing. This method enables the indirect measurement of temperature gradients via changes in refractive index caused by localized laser heating. Employing a collimated laser beam, the results show the formation and evolution of cylindrical heated zones and their interactions with the liquid–air interface. The study reveals that, while some alcohols exhibit stable surface behaviors, others demonstrate complex dynamical behaviors, including strong stable steady-state oscillations. The findings contribute to understanding fluid dynamics in molecular liquids near their liquid–air interfaces.

1. Introduction

Photothermal techniques, particularly thermal lensing, form the experimental basis of the current study on the family of straight-chain alcohols and their mixtures. These techniques allow for the indirect measurement of temperature gradients via refractive index changes induced via localized laser heating. The interaction between the excitation beam and the molecular liquid creates a thermal lens effect, detectable (due to associated refractive index gradients) via a probe beam and camera.
Laser-induced thermal lensing in molecular liquids has been a subject of research since the 1960s [1]. Recent advancements by Goswami et al. [2,3,4,5,6], Khabibullin et al. [7], and Wang et al. [8], among others, have focused on distinguishing convective from conductive heat transport mechanisms during the process. Building upon these studies, the current authors have developed an imaging technique to visualize the dynamics of convective heat flow from the thermal lens [9,10].
In the mid-1970s, Long and colleagues initiated studies on absorption mechanisms in thermal lensing through a vibrational local mode model [11], which was expanded in the early 1980s by Swafford et al. They explored how molecular liquids absorb energy from the excitation beam, primarily into vibrational overtone bands or combination bands involving overtone and other local or normal modes [12,13,14]. Those studies elucidated that local mode behavior governs light absorption and subsequent heating, with the current study noting significant absorption by the third harmonic of O–H and by combination bands involving the second harmonic of C–H stretches and bends [13,14].
In the specific technique employed in the current work, a collimated laser beam generates a cylindrical heated zone in the liquid, creating a thermal (also called convective) plume. This plume is characterized by a sharp temperature gradient and, thus, a sharp refractive index gradient that is observed by an expanded probe beam. This setup allows for the detailed tracking of the plume as it rises and interacts with the liquid–air interface, providing a unique perspective on the fluid dynamics at this boundary. For brevity, the liquid–air interface will simply be referred to as the surface in the remainder of this report.
Thermal plumes in this context are defined following the central monograph by Turner [15]. A thermal plume initiates with a thermal starting plume, rising due to buoyant forces and subsequently evolving into a steady-state form. The behavior of these plumes is crucial for understanding the fluid mechanics involved, especially as they interact with the surface.
In general, some liquids exhibit stable, non-oscillatory surface behaviors; others demonstrate anharmonic oscillations indicating complex dynamical behaviors possibly associated with stable oscillations in the system [16,17,18,19,20,21]. The physical phenomena explored in this study have historical precedence with early observations dating back to Jakeman et al. in 1973 [16], who cautioned that fluid-dynamic oscillatory modes could interfere with laser-scattering experiments. Systematic investigations began about a decade later, with the work of Gouesbet et al. [17,18,19,20].
The surface oscillations are a result of a rather complicated fluid-dynamical system influenced by a combination of thermal plume dynamics, stagnation-point flow, surface tension, and the thermal Marangoni effect. Stagnation-point flow occurs when the rising thermal plume impinges directly upon a surface, creating a region where the fluid velocity reduces to zero at the point of impact. This stagnation point influences a surrounding area where fluid behavior changes significantly due to the interaction with the surface [22,23]. In the two-dimensional case of flow impinging on a solid flat surface, the Navier–Stokes equations can be solved analytically, even for tangentially oscillating flows, as first demonstrated by Rott in the mid-1950s [23].
There are similarities between the case of a liquid–solid interface and the situation in the current experiment. Specifically, when the rising thermal plume reaches the liquid–air interface, it encounters a stagnation point where the vertical velocity component must transition to horizontal flow, analogous to flow encountering a solid boundary. However, the liquid–air interface is deformable, with a restoring force determined by surface tension.
Surface-tension dynamics play a crucial role in the observed results, particularly due to the thermal Marangoni effect. This effect involves a mass transfer along the surface resulting from gradients in surface tension caused by temperature differences [24]. The tangential flow induced via these surface tension gradients is known as the Marangoni flow, which is highly sensitive to such differences. Note that the Marangoni flow is much more rapid than the stagnation-point flow. In the context of the current study, the rising thermal plume breaches the surface, creating the necessary tangential temperature gradient that drives the Marangoni flow (in addition to stagnation-point flow). This phenomenon contributes to the nonharmonic surface oscillation dynamics observed in our experiments and those conducted by Gouesbet et al. [17,18,19,20].
The current study focuses on the behavior of the surface under the influence of the thermal plume in straight-chain alcohols and their mixtures. Straight-chain alcohols that are liquids at room temperature include methanol through 1-undecanol. Conveniently, this family of compounds consists of some liquids that do not exhibits stable steady-state oscillation, some that strongly do, and some that weakly do. By mixing these compounds, one can control the dynamic response of the surface. For example, as will be reported below, neither methanol nor 1-undecanol exhibit stable steady-state oscillation under the conditions of the experiment. Nonetheless, various mixtures of these two alcohols do. On a second note, the family of straight-chain alcohols complements the recent work of Goswami et al. in their study of convection from laser-induced thermal lensing in alcohols [2].
Subsequent to this Introduction section, the experimental details are described. This is followed by a reporting of the results and an accompanying discussion. Finally, concluding remarks are made.

2. Materials and Methods

This section details the configuration of the experimental setup, procedures for sample preparation, and the methodology adopted for gathering and analyzing data used in the current study.

2.1. Experimental Setup

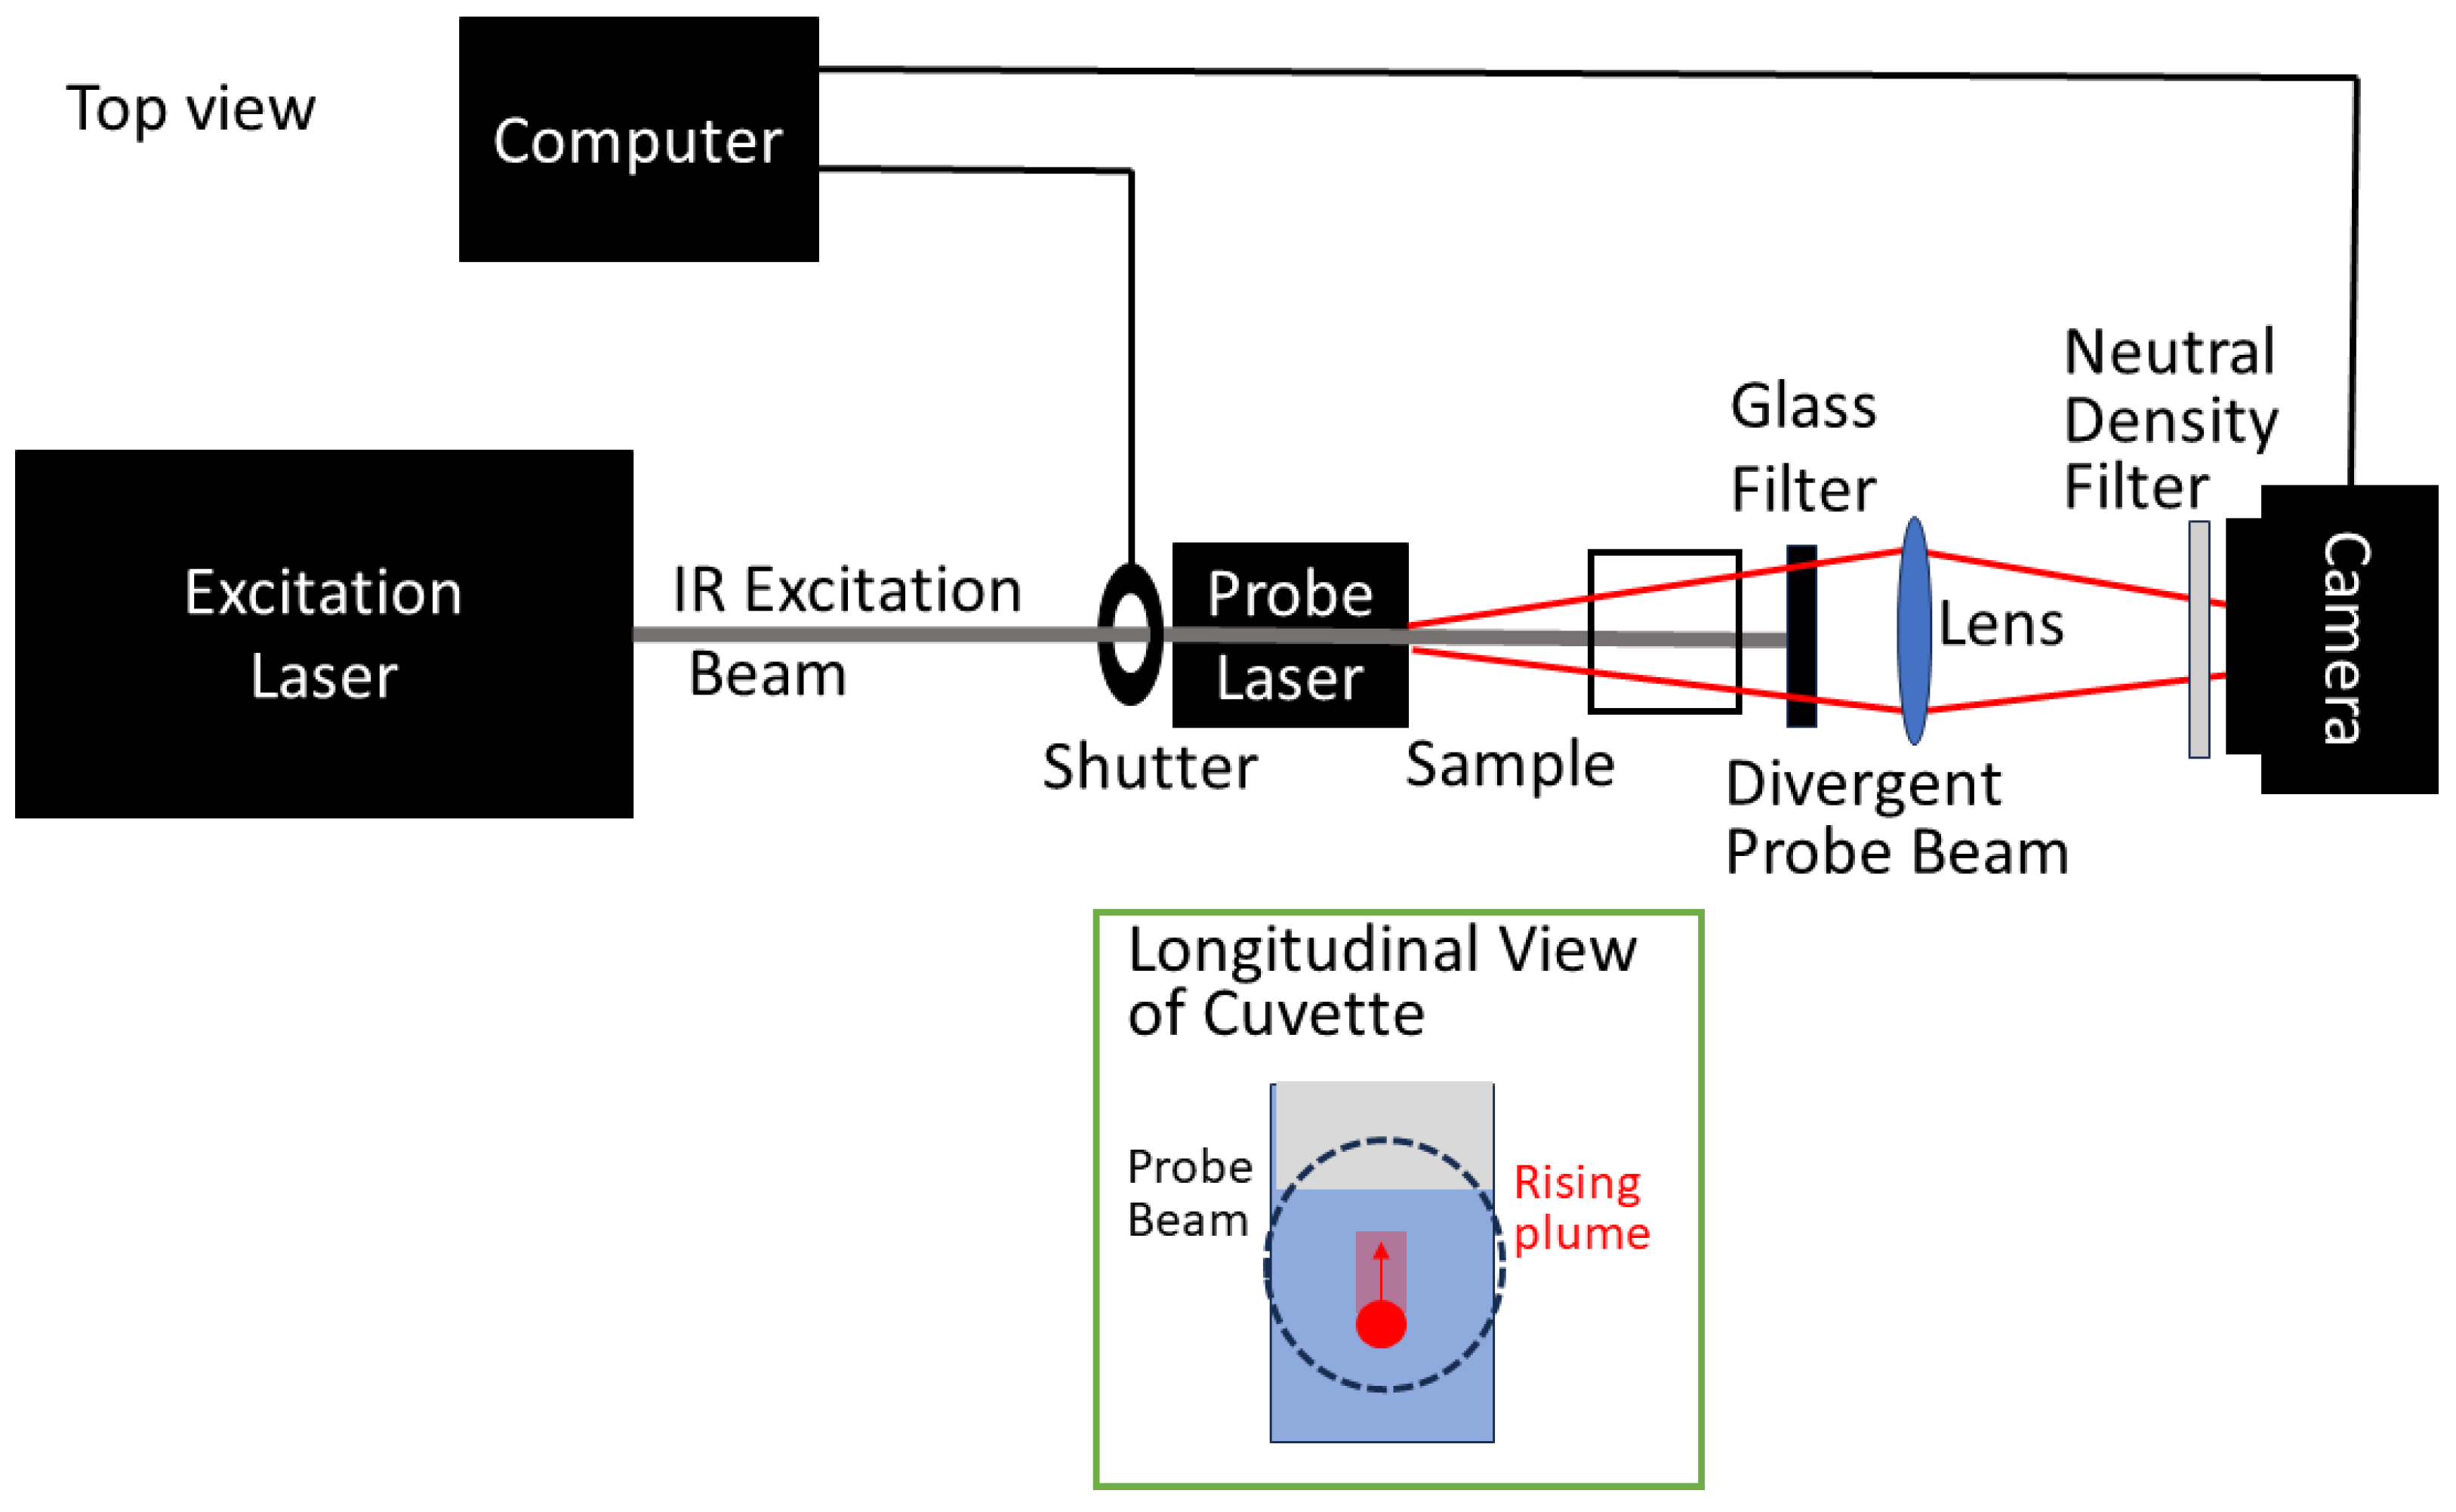
Figure 1 depicts the laboratory setup. The source of the excitation beam is a Thorlabs (Newton, NJ, USA) QSL103A Q-Switched Picosecond Microchip Laser System, emitting at 1030 nm. This laser produces 500 ps pulses at a 9 kHz repetition rate, and it features a primarily Gaussian beam profile. Although the laser operates in a pulsed mode, the photothermal effects relevant to the current study are effectively continuous, influenced by the average power output [9].
The intensity of the laser light reaching the cuvette was measured with a Thorlabs (Newton, NJ, USA) PM100D Digital Optical Power and Energy Meter fitted with a Thorlabs (Newton, NJ, USA) S140C powerhead (measurement accuracy of 7%). Data regarding laser power were adjusted to account for the actual energy reaching the sample. For all the samples shown in this work, the laser power was 0.575 W. A solenoid-actuated shutter controlled via a Raspberry Pi 4 microcomputer (Pencoed, Wales) was used to manage the different phases of the experiment: background, activation, and recovery.
The probe beam was generated via a 650 nm-diode laser from HiLetgo (Shenzhen, China), situated in a passive heat sink and linked to a potentiometer that allowed fine-tuning of the light intensity. Data capture was facilitated by an Arducam Camera (Kowloon, Hong Kong), which has a 5-megapixel Omnivision (Santa Clara, CA, USA) OV5647 sensor. As with the shutter, this was controlled via the same Raspberry Pi 4 microcomputer. Although capable of recording at 1080p, the camera was set to a resolution of 720 × 720 pixelsto maximize the frame rate, which is essential for capturing dynamic processes with sufficient temporal resolution. Time calibration was achieved by averaging the frame count over multiple ten-second video sequences, establishing a frame-to-frame interval of approximately 10.3 ms.

2.2. Sample Preparation

The alcohols in the experiments were used as received. As samples, they were housed in standard 10 mm × 10 mm fluorimeter cuvettes. Room-temperature conditions were maintained at approximately 19.8 °C, consistent with previous experiments that confirmed there were no appreciable heating effects over time [9].

2.3. Data Collection and Analysis

Data collection was structured into four distinct phases: an initial background phase of 2 s with the shutter closed, an active laser phase of typically 120 s in which the shutter was open and the excitation laser was irradiating the sample, a recovery phase of 30 s for observing the system’s return to equilibrium, and a rest period of 240 s before the sequence was repeated.
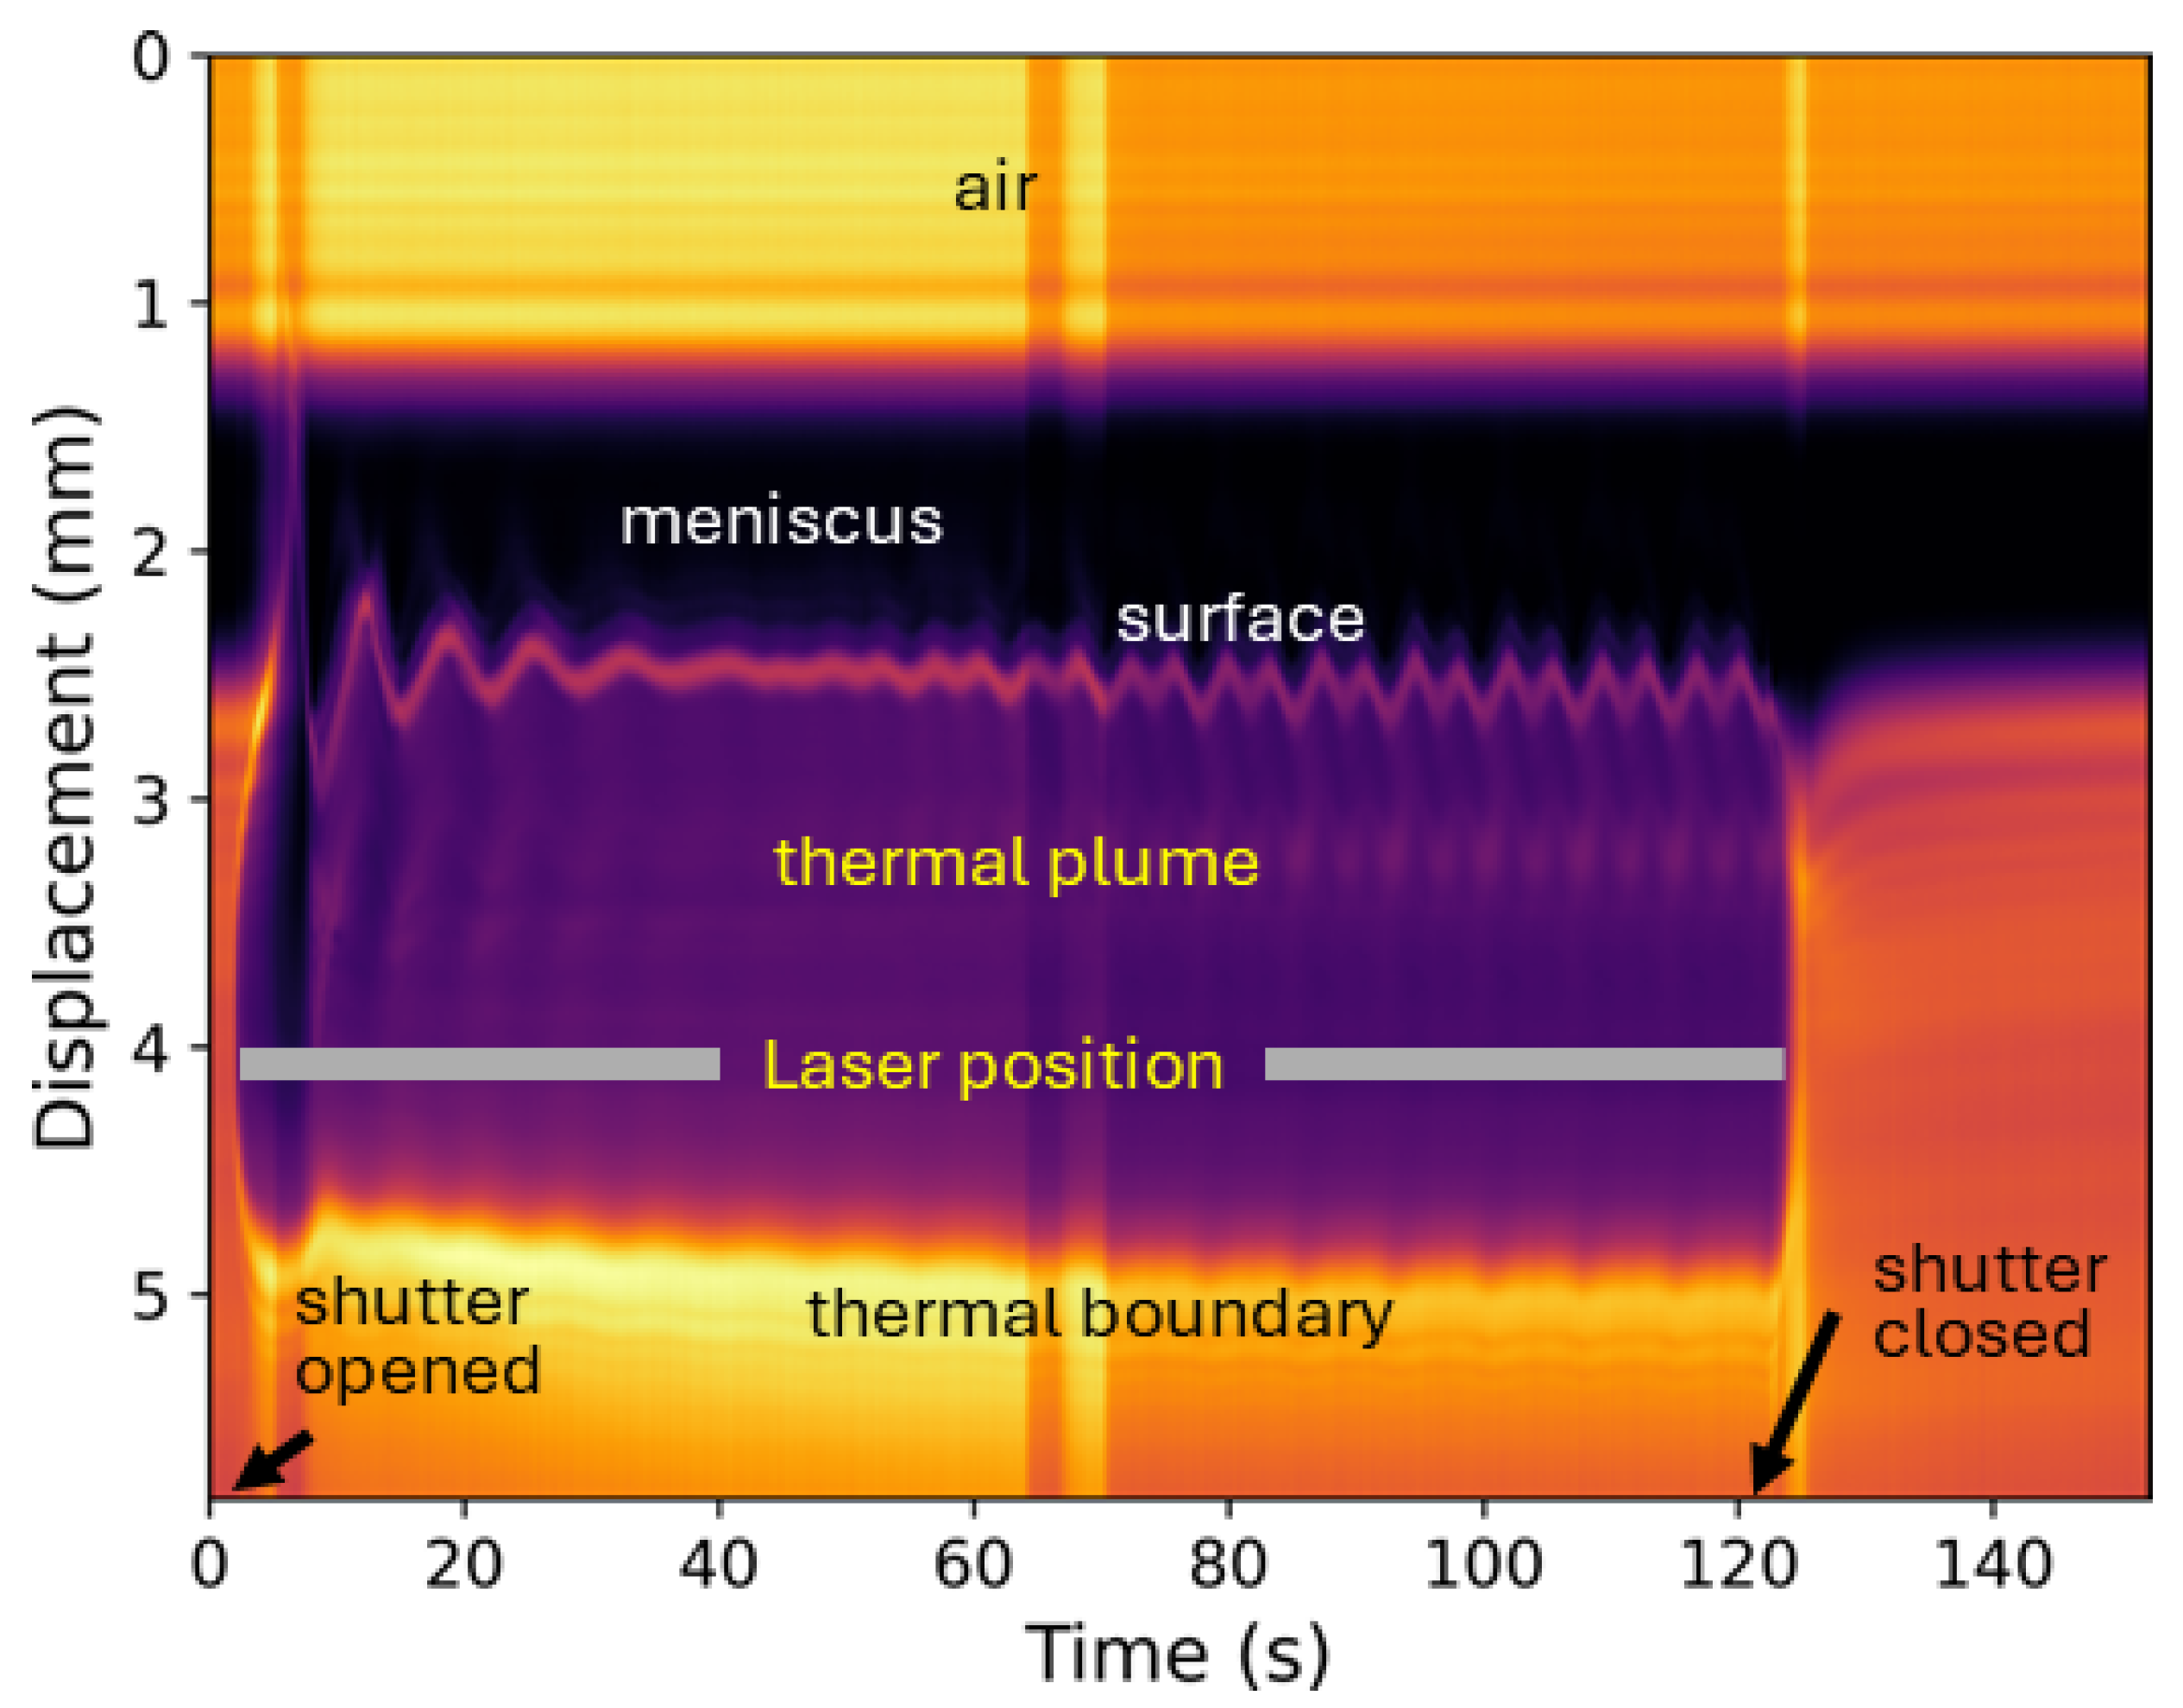
Homewritten software (available at https://github.com/ulnessd (accessed on 1 May 2024)) was used to convert each .h264 video file into a single still image, referred to here as the heatmap representation of the data. The heatmap was produced by averaging the columns (or selected range of columns) of each frame of the video. The resulting average columns for all the frames were then assembled in time order to produce the two-dimensional heatmap. Figure 2 shows a typical heatmap with the key features pointed out.
Further analysis, again using homewritten code, involved obtaining the position of the surface as a function time. This was achieved by searching each column of the heatmap to find a user defined threshold value. This produced a pixel position for each frame of the .h264 file. The use of the spatial and temporal calibration values produced the time dynamics data for the surface displacement. This was subsequently Fourier-transformed to produce the frequency spectrum associated with the time data.

2.4. Comparison with the Experiments of Gouesbet et al. [17,18,19,20]

The experiments conducted by Gouesbet et al. [17,18,19,20] are similar to those reported in the present study. In their thermal lens experiments, a spherical (rather than cylindrical) thermal lens was generated using a focused excitation beam, and fluctuations within the same beam were monitored [18]. The oscillations observed in their signals were referred to as “heartbeats”, with the transition to chaotic regimes described as a “heart attack” [18]. In a separate set of experiments, they utilized a heated cylindrical wire to create a thermal plume [20]. An obvious distinction between these two setups is that in the thermal lens experiments, the heated volume of the lens contributes to the fluid dynamical system, whereas in the hot wire experiments, the wire itself is excluded from the fluid dynamics [18].

2.5. Artificial Intelligence

The development of data acquisition and analysis software was supported by the use of OpenAI’s ChatGPT 4.0, which also aided in paraphrasing previous documentation and formatting references. AI was also used to organize and summarize relevant literature for this study [25].

3. Results and Discussion

Collected here are the results of this study in the form of heatmap representations. Fourier-transformed spectra are also used to further interpret the dynamic response of the surface. The data shown in the paper are representative in the sense they are the first of five runs of for each sample. There is little run-to-run variability within the set of five runs. The raw .h264 files can be found at Supplementary Materials.

3.1. Neat Straight-Chain Alcohols

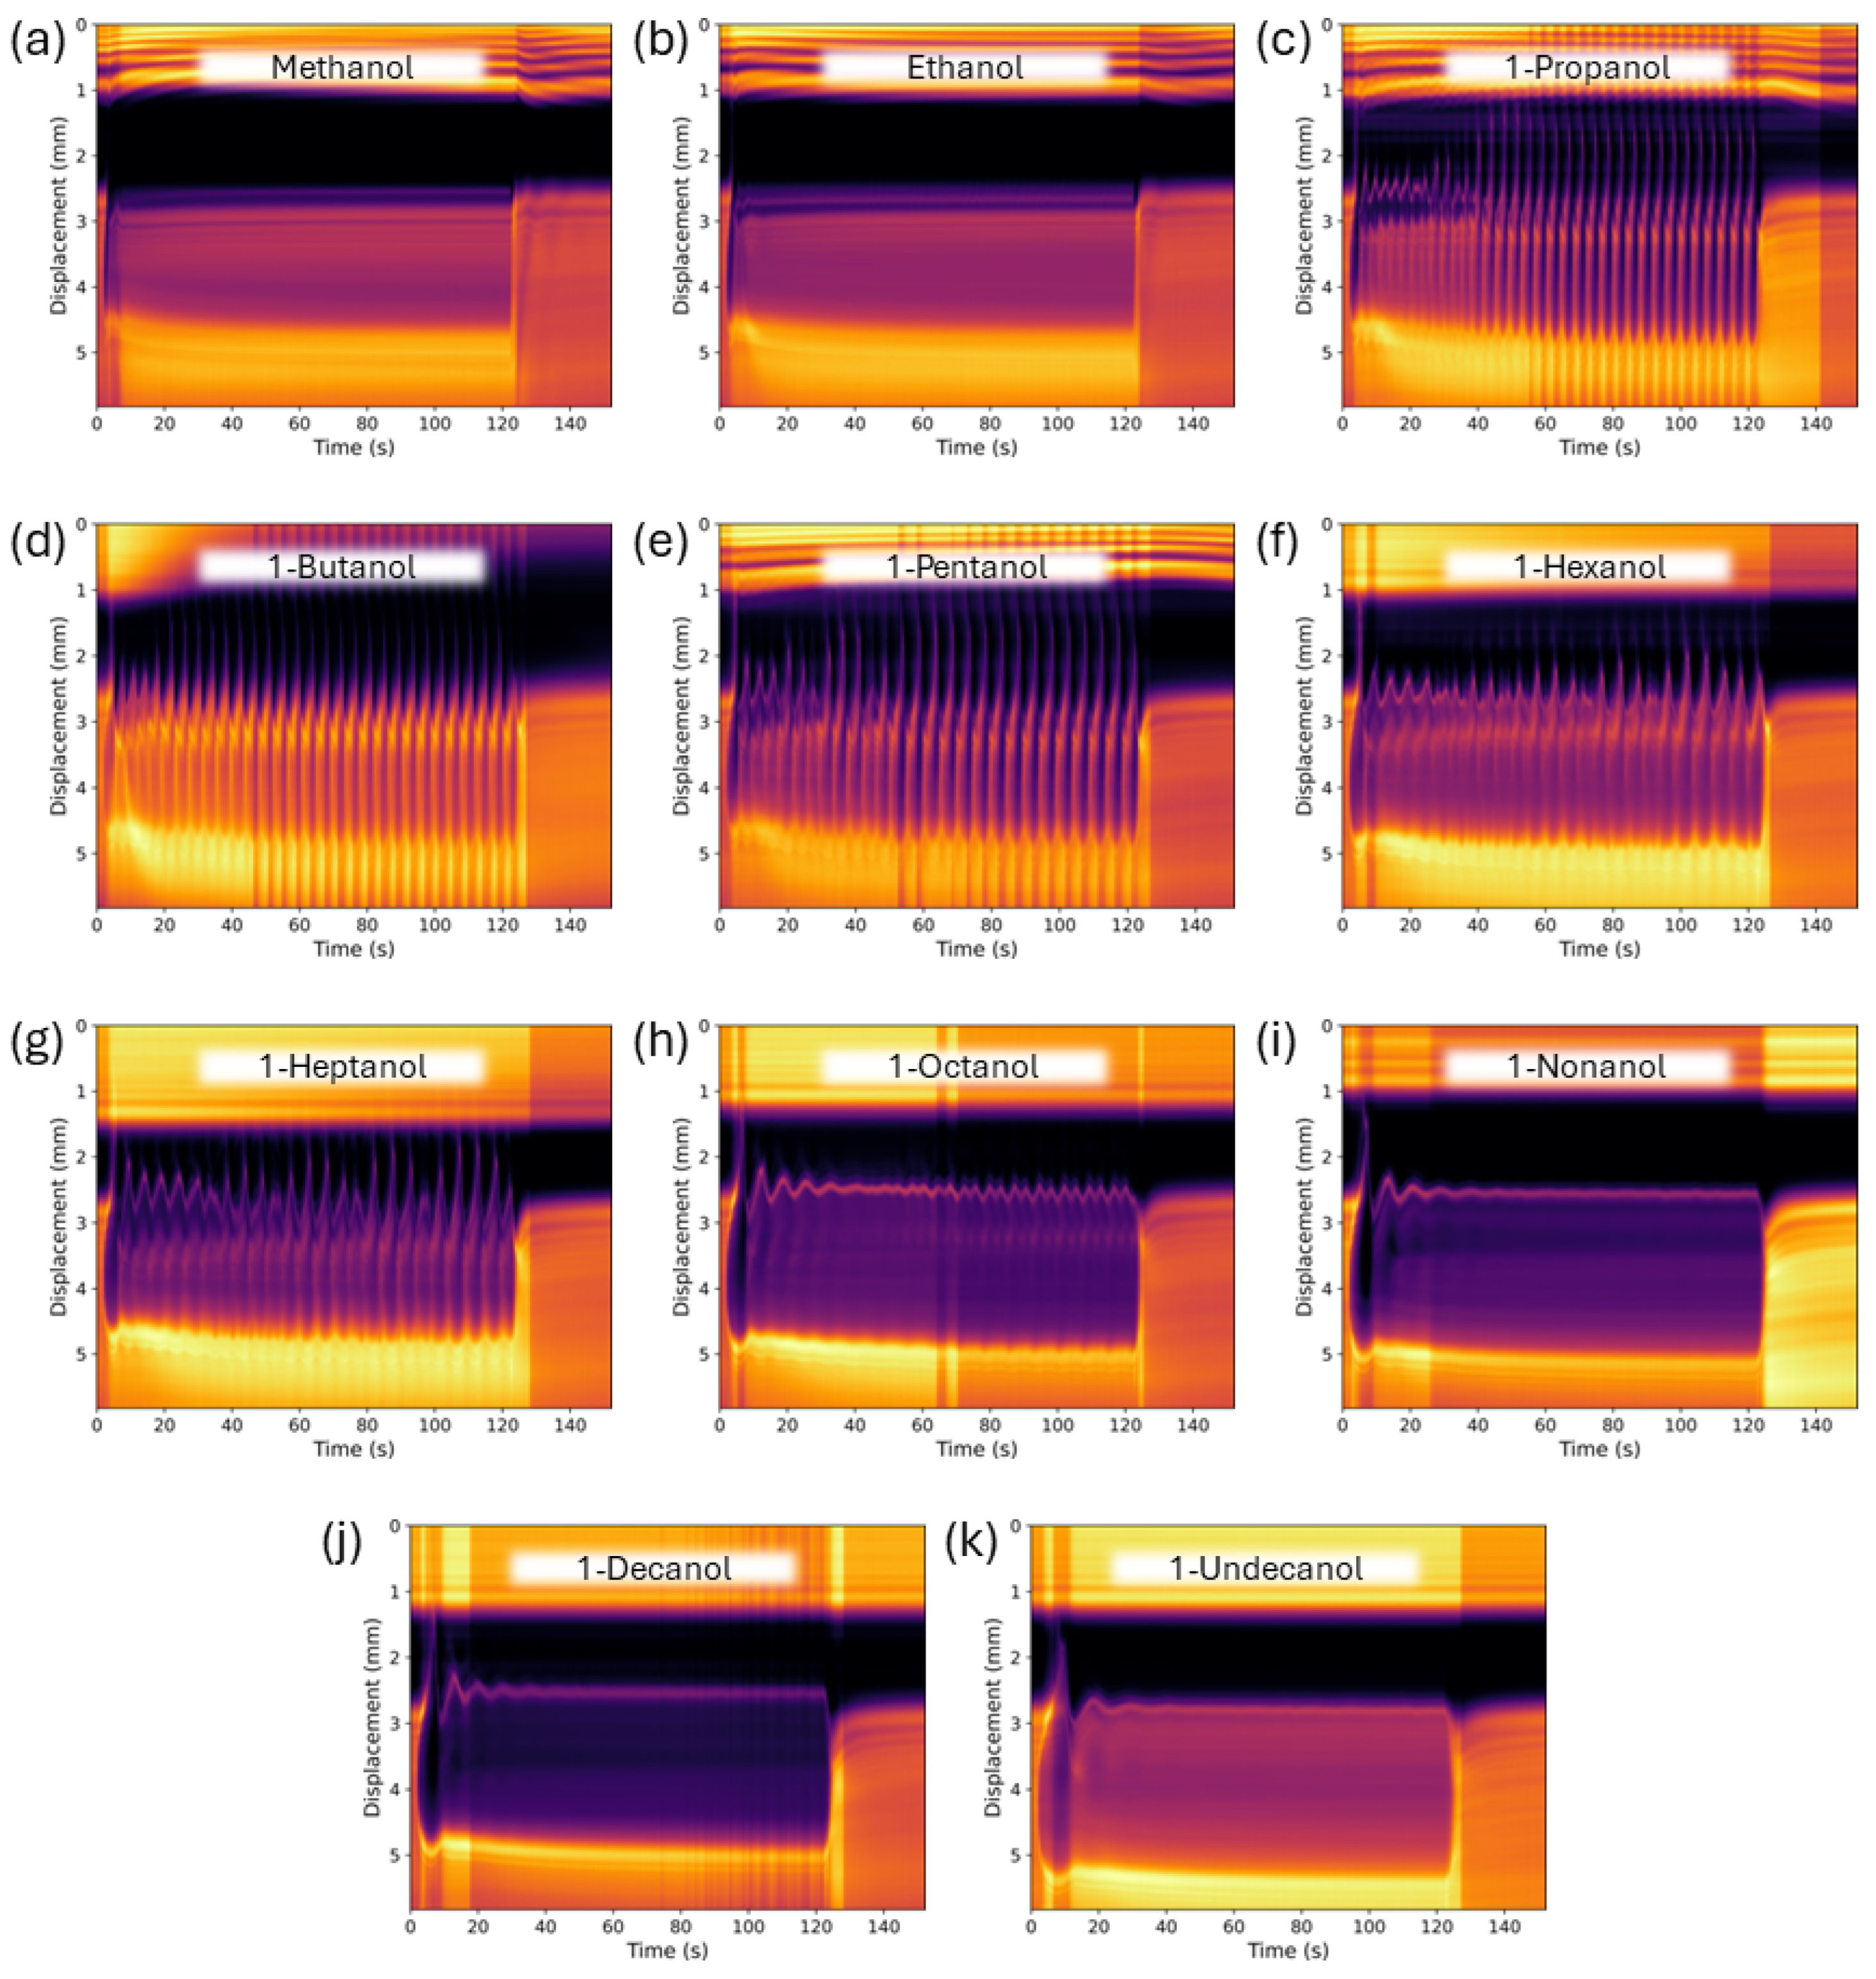
The heatmap representations of the thermal plume dynamics in the straight-chain alcohols are collected in Figure 3. The difference in behavior among the alcohols is especially striking. Most notably, one sees the emergence of oscillatory behavior of the surface under constant interaction with the rising plume in the intermediate-length alcohols, namely, 1-propanol through 1-nonanol. Within that subset, one also sees a variation in amplitudes with which the surface oscillates. For example, 1-butanol through 1-heptanol have quite pronounced surface disturbances. The oscillations are subdued in 1-octanol and barely visible in 1-nonanol. Viscosity is the key physical property that changes most significantly among the 1-alcohol family, with methanol having a viscosity of 0.597 cP and 1-undecanol having a viscosity of 17.2 cP.
More subtle features include an increase in the frequency of the oscillations as one progresses through the subset of alcohols 1-propanol through 1-nonanol. Moreover, there are regions of irregular oscillation and regions of stable steady-state oscillation. This is particularly evident for 1-butanol and 1-pentanol. This is consistent with such behavior seen in other liquids, and it is much more thoroughly discussed in reference [21]. A subtle feature evident for 1-octanol is the appearance of frequency doubling (relative to that of the transient oscillation), starting at around 70 s into the run.
The presence of frequency doubling in 1-octanol can be reliably reproduced, although the precise timing of its onset varies from run to run. This behavior suggests a sensitivity to changing fluid dynamical conditions as the experiment progresses. Two plausible explanations for the frequency doubling are proposed. First, it may take some time to establish a stable downdraft cycle due to the outward flow and subsequent downward movement along the sides of the cuvette. Second, the gradual overall heating of the sample could lead to the formation of steady-state vertical and horizontal thermal gradients, which influence the fluid dynamics and result in the observed frequency doubling.
The convection patterns observed in methanol, ethanol, 1-decanol, and 1-undecanol are generally consistent with expectations, where the laser-induced thermal plume acts as a heat source, creating a rising thermal plume that, upon reaching the surface, spreads horizontally due to the impediment to further vertical movement. However, for 1-propanol through 1-nonanol the interactions of these plumes with the surface exhibit unique fluid-mechanical behavior, notably the development of steady-state oscillations. The dynamics were regular for the conditions of this work but Gouesbet et al. have observed a transition to chaos [18,19,20].
All the alcohols in this study exhibit some transient response upon initial irradiance via the laser. This also occurs when the laser is first blocked by the shutter. As a note to the reader, consider that those features are difficult to see on the printed page, but they are more noticeable in the high-resolution image viewed on a computer. When the shutter opens, the laser initiates a thermal plume. The plume impacts the surface, causing an upward displacement of the surface, which then rebounds. For the cases of methanol and ethanol, this is relatively rapid and highly damped. In contrast, these underdamped but nearly critically damped transients are readily visable in 1-nonanol through 1-undecanol.
Despite heavy damping, the shorter-chain alcohols still exhibit underdamped oscillation in the laser-blocked case. For the longer-chain alcohols, this becomes an overdamped response.
A qualitative conceptual model can be applied that is grounded in the theory of free convective flow near a stagnation point [22] and thermal Marongoni flow [24]. The system is modeled as a two-dimensional system, integrating over the longitudinal dimension. For a liquid–solid surface, the Navier–Stokes equations can be solved exactly [23]. The current scenario differs critically due to the deformable liquid–air interface. As the rising thermal plume reaches this interface, it encounters a stagnation point where the vertical velocity component must ultimately turn horizontally, but not until the surface deforms. The surface tension-induced restoring force of the deformable interface, crucial for the experimentally observed behavior, likely precludes an analytic solution to the Navier–Stokes equations for this system. Consequently, the current authors offer this qualitative model as a framework for interpretation [21].
The observation of stable oscillations presents a more complex scenario than a simple mass transfer recycling behavior. This qualitative model suggests that, under certain conditions, the interplay of system parameters, such as laser power, viscosity, cuvette geometry, etc., occasionally disrupts the usual convective mass transfer recycling process, leading to mass accumulation at the surface. When the mass is sufficiently built up, the system undergoes a rapid displacement adjustment in both the surface itself via the Marangoni effect, and the thermal boundary layer, initiating a downdraft that serves to convectively clear the accumulated mass from the surface region and resets the cycle. This cyclical process can become highly regular under certain conditions, leading to the observed stable oscillations.
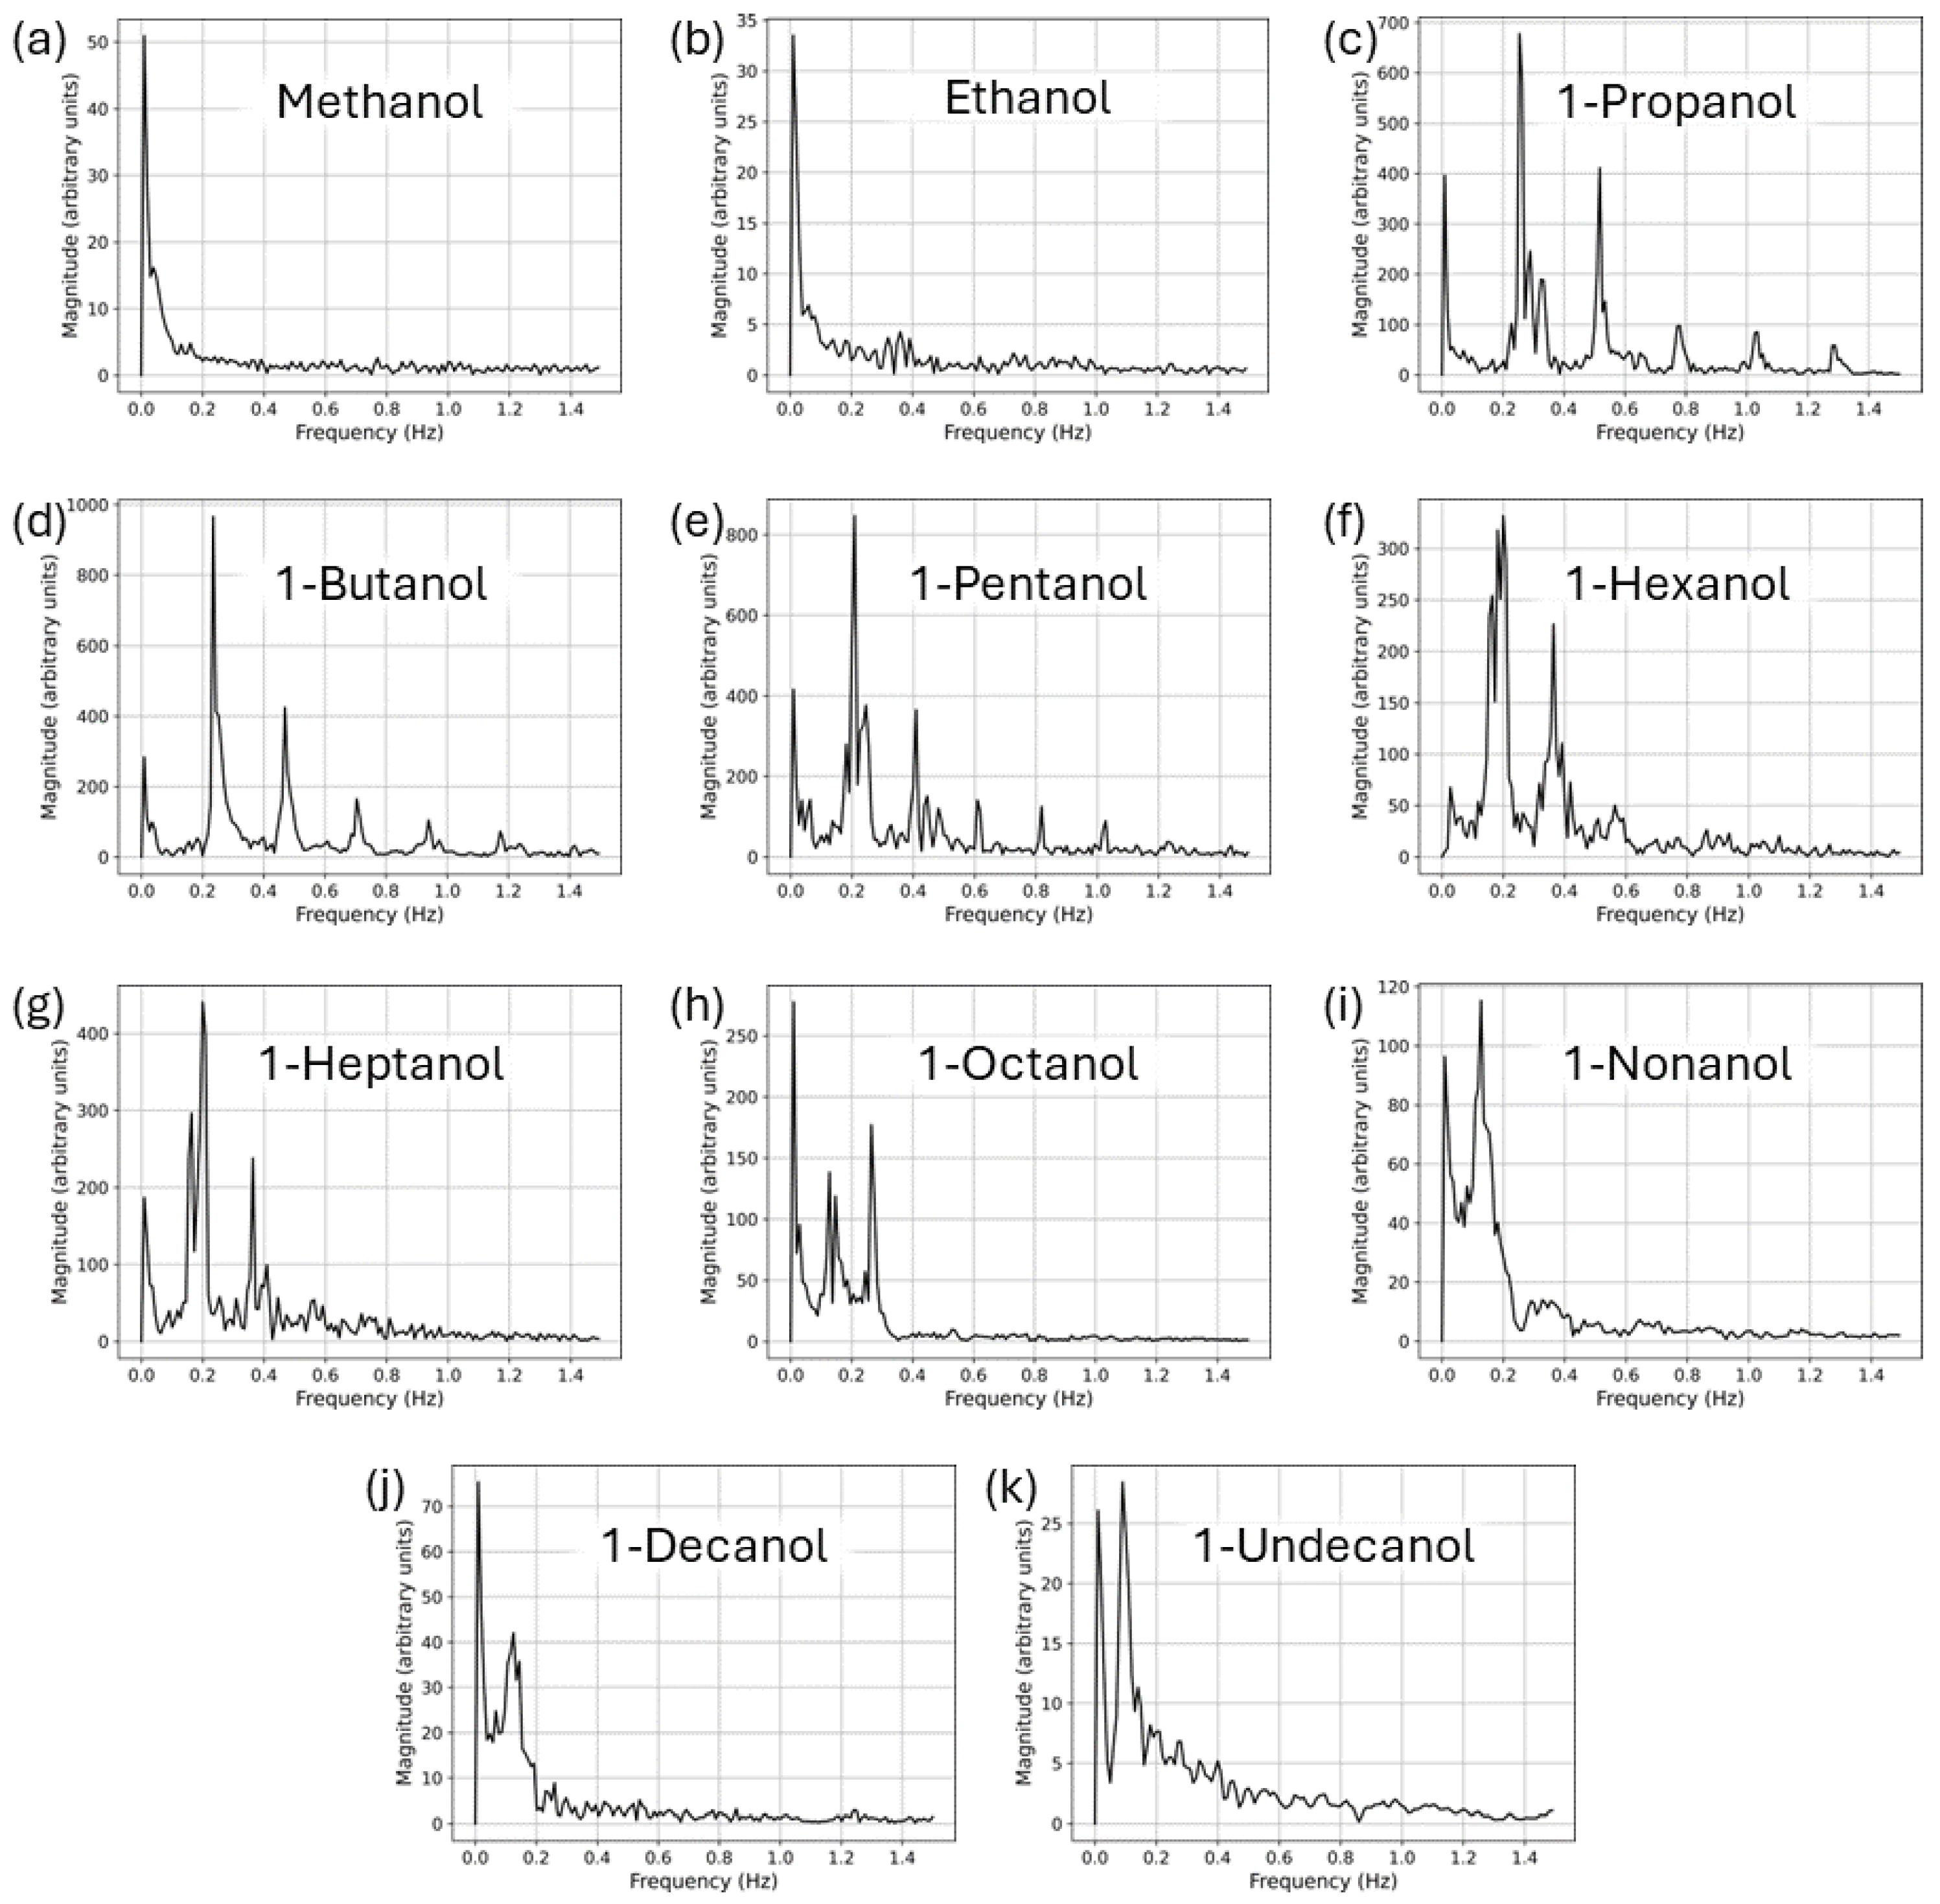
To better characterize the oscillatory behavior of the surface, Fourier transforms of these data were obtained and are shown in Figure 4. For methanol and ethanol, one sees no significant spectral peaks other than a residual DC-term. Starting with 1-propanol, one sees a pronounced fundamental peak along with harmonics of that frequency. This is especially true when the surface is undergoing stable steady-state oscillation. See the cases of 1-propanol and 1-butanol for example. In these cases, the spectra are quite free of any significant noise. (As shown in reference [21], they can, in fact, become nearly free of noise in certain situations.) Further, from a spectral perspective, different types of stable steady-state oscillations are distinguished by the various amplitudes of the harmonic frequencies.
It was noted above that the heatmap for 1-octanol shows frequency doubling relative to the frequency of the transient. An inspection of the Fourier transform for 1-octanol does indeed show the first overtone peak as the dominant one (aside from a residual DC spike).
Looking more closely at the case of 1-propanol reveals that its spectrum is decomposed in Figure 5. The full spectrum is shown in the left panel, and it is identical to that shown in Figure 4c. The Fourier transform of the transient response is shown in the middle panel, and the Fourier transform of the stable steady-state domain is shown in the right panel. Most noticeable in this decomposition is how the spectrum of the stable steady-state oscillation is nearly noise-free. Also, energy is distributed in several of the precise overtones. This is consistent with the more extensive study of this phenomenon in reference [21].
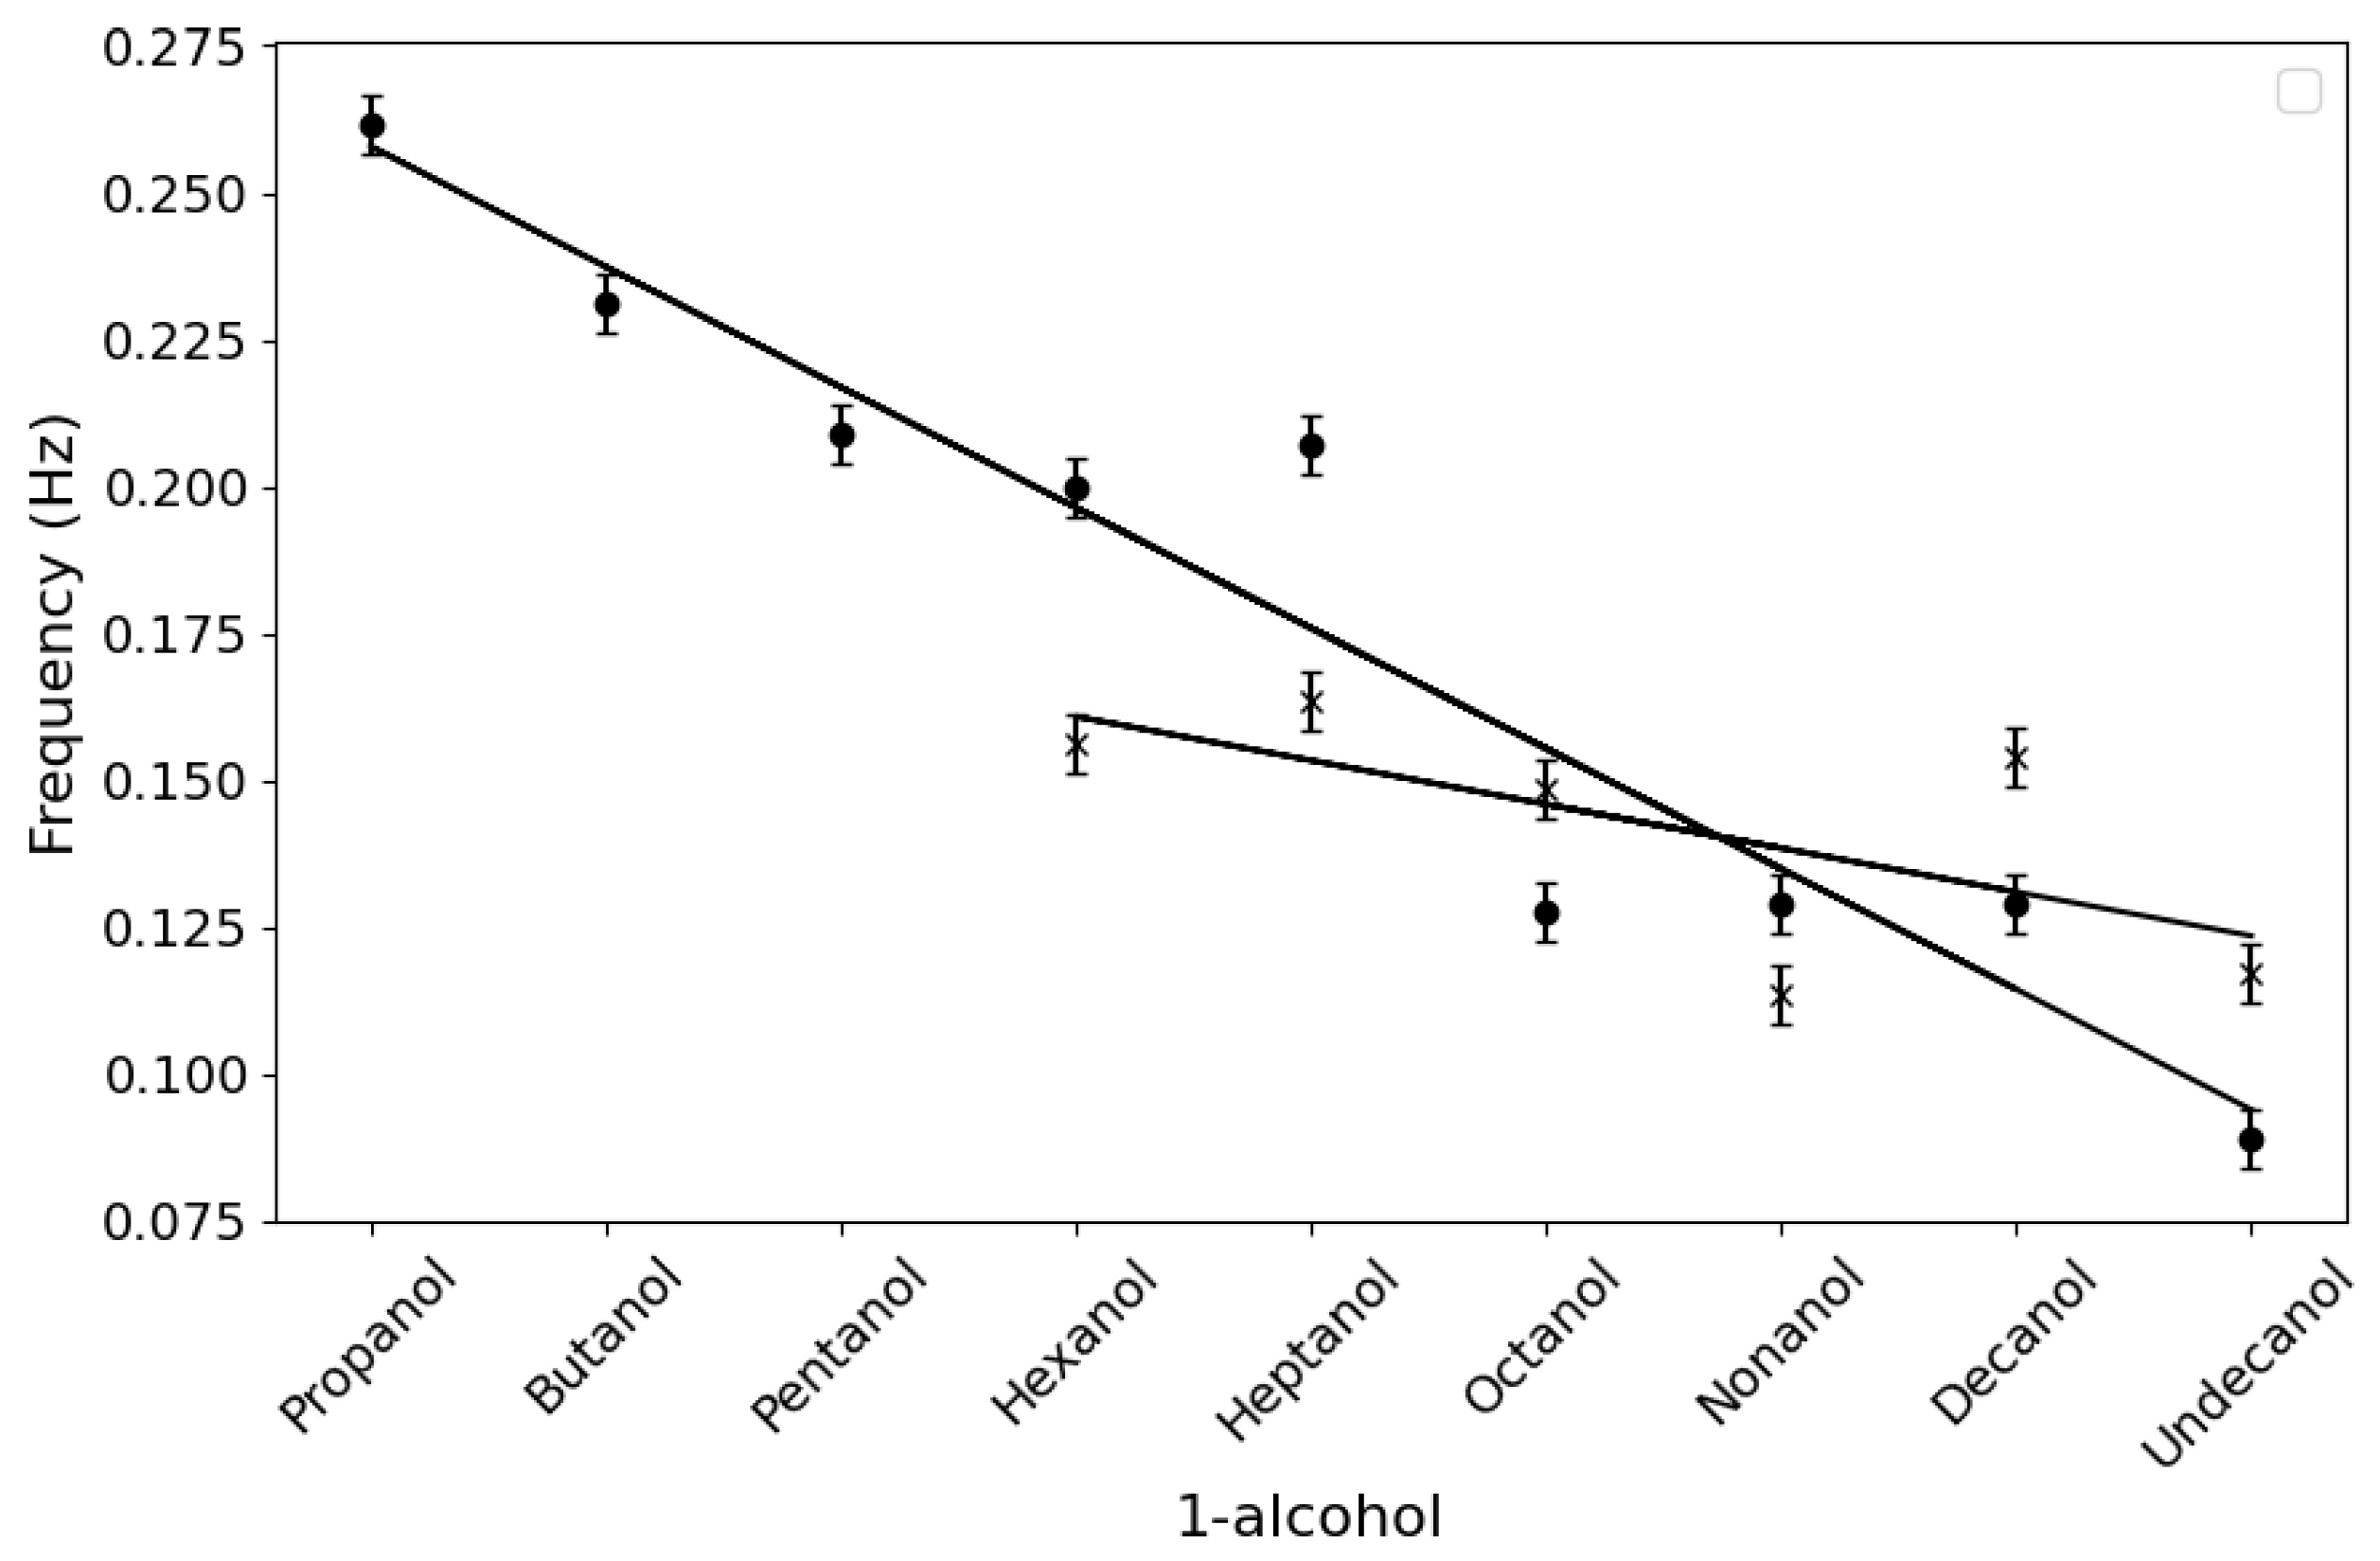
The values of the fundamental frequencies are shown in Figure 6. Overall, the natural frequency of the surface displacement oscillation decreases with the chain length of the alcohol. The total shift in frequency is linear and significant, ranging from greater than 0.25 Hz for methanol to less than 0.10 Hz for 1-undecanol. Interestingly, for 1-hexanol and larger alcohols, the fundamental peak splits into two nearby frequencies. The frequency positions of the two peaks are plotted separately for each of the heavier alcohols in Figure 6.

3.2. Undecanol–Methanol Mixtures

An experiment involving binary mixtures of 1-undecanol and methanol was performed; see Figure 7. The result of this experiment further shows that viscosity plays a critical role in the dynamical behavior of the surface. According to the above results, neither methanol nor 1-undecanol exhibits stable steady-state oscillation. However, mixtures of these compounds yield solutions with viscosities in the range of those neat alcohols that do oscillate. From a different point of view, mole fraction offers a parameter to move the system from stable equilibrium to steady-state oscillation and back again.
Figure 7 shows the heatmap representation of the results for mole fractions of 1-undecanol having values of X un = 0.75 , X un = 0.50 , and X un = 0.25 . Heatmaps for X un = 1 , and X un = 0 are shown in Figure 3. It is clear that the binary mixtures do indeed show stable steady-state oscillations. At high mole fractions of 1-undecanol, the heatmaps look similar to the neat case (see Figure 3k), with a prominent transient response but then settling to a non-oscillatory state. Further dilution brings the system to various stable steady-state oscillation. Interestingly, X un = 0.50 shows frequency doubling. At low mole fractions of 1-undecanol, pronounced oscillation can occur. Finally, neat methanol no longer exhibits stable steady-state oscillation.
In addition to this work’s central focus on convective behaviors and surface interactions, the 1-undecanol/methanol system exhibits the Soret effect. The Soret effect (also called thermodiffusion) is a thermodynamic coupling phenomenon where concentration gradients are driven by temperature gradients within the mixture [26]. It is well known that the thermal gradients arising in thermal lensing can produce a Soret response [27,28,29].
It was observed that the thermal lens in 1-undecanol–methanol was compounded by a Soret lens, manifesting as a local change in the refractive index due to concentration variations. In essence, the thermal lens drove partial de-mixing, and these regions were visible via the current experimental setup. Most notably, the remixing process occurs on a much slower timescale than the thermal conduction. Hence, when the laser was blocked by the shutter, undulating visible regions persisted in the video data for many seconds. Because the Soret effect is outside the scope of this paper, and because the authors yet need to quantify the observed effect, this observation will not be discussed further. A reader interested in the raw video data can find them in the Supplementary Material.

3.3. Butanol–Methanol Mixtures

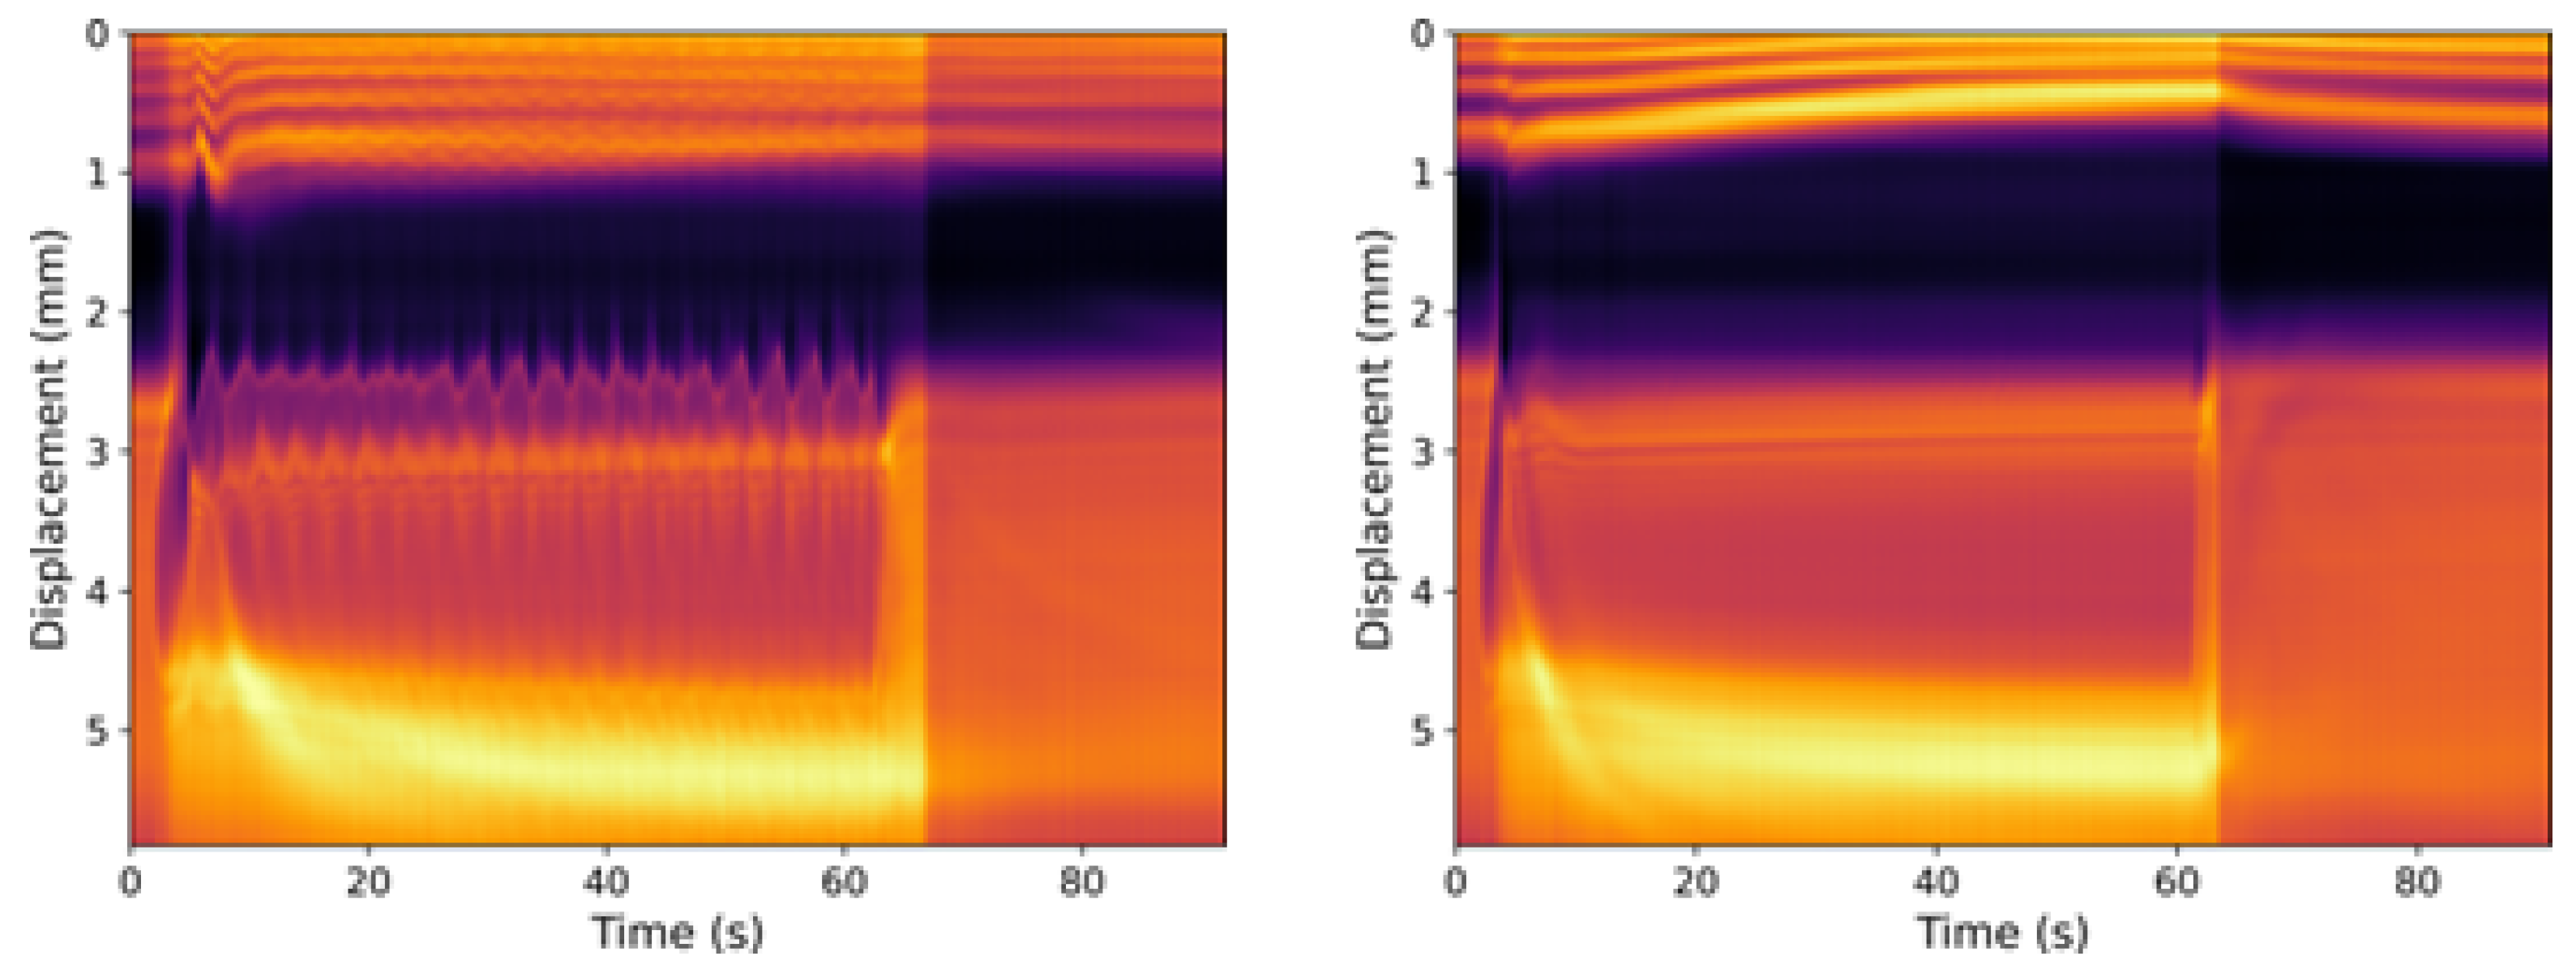
For the sake of completeness, an experiment similar to the one discussed in Section 3.2 was performed with a set of 1-butanol/methanol mixtures. Figure 8 shows the cases of X but = 0.60 , and X but = 0.40 , and the neat cases are shown in Figure 3. Perhaps unsurprisingly, based on the the results of the 1-undecanol–methanol case, the oscillatory behavior of the surface depends on mole fraction. Again, the control of viscosity with mole fraction is the key reason for this effect.

4. Conclusions

This study has elucidated the complex interactions between thermal plumes and the liquid–air interfaces in straight-chain alcohols and their mixtures through thermal lensing techniques. The observations made in this study highlight the distinct fluid-mechanical behaviors exhibited by straight-chain alcohols, ranging from stable non-oscillatory behaviors to pronounced anharmonic oscillations, which depend critically on molecular structure and experimental conditions.
The findings reveal that methanol, ethanol, and 1-undecanol do not exhibit steady-state oscillations under the experimental conditions used in this work. Conversely, the intermediate-length alcohols exhibit this oscillatory behavior. Which molecular liquids exhibit oscillatory behavior is largely governed by viscosity, although the oscillatory behavior itself is affected by other experimental conditions such as laser power, curvette geometry, etc. Mixtures can display a wide range of dynamic behaviors, including stable steady-state oscillations, even if the individual components do not. Moreover, the observation of the Soret effect in 1-undecanol–methanol mixtures, although not the primary focus of this study, elucidates an interesting additional phenomenon that occurs in these systems.
Moving forward, expanding this study to include a broader range of molecular liquids and their mixtures and exploring the quantitative aspects of the Soret effect could further enhance understanding of these systems. There is evidence that the methodology used in this work can also capture the much faster process of photoacoustic effects in these systems, but more remains to be done in order to obtain quantitative information about these effects in these systems.

Supplementary Materials

The following supporting information can be downloaded at: https://www.darinulness.com/research/data/alcohols (accessed on 10 October 2024).

Author Contributions

Conceptualization, D.J.U.; methodology, D.J.U.; software, D.J.U.; validation, D.J.U., R.W.A., A.I.A. and M.W.G.; formal analysis, D.J.U., R.W.A., A.I.A. and M.W.G.; investigation, R.W.A., D.J.U. and A.I.A.; resources, D.J.U.; data curation, D.J.U., R.W.A., A.I.A. and M.W.G.; writing—original draft preparation, D.J.U.; writing—review and editing, D.J.U., M.W.G. and R.W.A.; visualization, D.J.U., R.W.A., A.I.A. and M.W.G.; supervision, D.J.U.; project administration, D.J.U.; funding acquisition, D.J.U. All authors have read and agreed to the published version of the manuscript.

Funding

This research received no external funding.

Data Availability Statement

Raw and processed data sets are available at www.darinulness.com/research/data/alcohols (accessed on 10 October 2024). The code for the data acquisition program and data analysis programs can be found at https://github.com/ulnessd/ThermalLensing/ (accessed on 1 May 2024).

Acknowledgments

Internal funding for this work was provided by the Office of Undergraduate Research, Scholarship, and Creative Activity at Concordia College and the Chemistry Department Endowed Research Fund. The authors acknowledge Cynthia Anderson and Devren Anderson for their careful proofreading of an earlier draft of the manuscript.

Conflicts of Interest

The authors declare no conflicts of interest. The funders played no role in the design of the study, in the collection, analyses, or interpretation of data, in the writing of the manuscript, or in the decision to publish the results.

References

  1. Gordon, J.P.; Leite, R.C.C.; Moore, R.S.; Porto, S.P.S.; Whinnery, J.R. Long-Transient Effects in Lasers with Inserted Liquid Samples. J. Appl. Phys. 1965, 36, 3–8. [Google Scholar] [CrossRef]
  2. Singhal, S.; Goswami, D. Thermal Lens Study of NIR Femtosecond Laser-Induced Convection in Alcohols. ACS Omega 2019, 4, 1889–1896. [Google Scholar] [CrossRef] [PubMed]
  3. Kumar Rawat, A.; Chakraborty, S.; Kumar Mishra, A.; Goswami, D. Achieving Molecular Distinction in Alcohols with Femtosecond Thermal Lens Spectroscopy. Chem. Phys. 2022, 561, 111596. [Google Scholar] [CrossRef]
  4. Goswami, D. Intense Femtosecond Optical Pulse Shaping Approaches to Spatiotemporal Control. Front. Chem. 2023, 10, 1006637. [Google Scholar] [CrossRef]
  5. Rawat, A.K.; Chakraborty, S.; Mishra, A.K.; Goswami, D. Unraveling Molecular Interactions in Binary Liquid Mixtures with Time-Resolved Thermal-Lens-Spectroscopy. J. Mol. Liq. 2021, 336, 116322. [Google Scholar] [CrossRef]
  6. Singhal, S.; Goswami, D. Unraveling the Molecular Dependence of Femtosecond Laser-Induced Thermal Lens Spectroscopy in Fluids. Analyst 2020, 145, 929–938. [Google Scholar] [CrossRef]
  7. Khabibullin, V.R.; Usoltseva, L.O.; Galkina, P.A.; Galimova, V.R.; Volkov, D.S.; Mikheev, I.V.; Proskurnin, M.A. Measurement Precision and Thermal and Absorption Properties of Nanostructures in Aqueous Solutions by Transient and Steady-State Thermal-Lens Spectrometry. Physchem 2023, 3, 156–197. [Google Scholar] [CrossRef]
  8. Wang, Z.; Li, S.; Chen, R.; Zhu, X.; Liao, Q. Simulation on the Dynamic Flow and Heat and Mass Transfer of a Liquid Column Induced by the IR Laser Photothermal Effect Actuated Evaporation in a Microchannel. Int. J. Heat Mass Transf. 2017, 113, 975–983. [Google Scholar] [CrossRef]
  9. Dominguez Lopez, J.; Gealy, M.W.; Ulness, D.J. Photothermal Imaging of Transient and Steady State Convection Dynamics in Primary Alkanes. Liquids 2023, 3, 371–384. [Google Scholar] [CrossRef]
  10. Biebighauser, J.; Dominguez Lopez, J.; Strand, K.; Gealy, M.W.; Ulness, D.J. Frustrated-Laser-Induced Thermal Starting Plumes in Fresh and Salt Water. Liquids 2024, 4, 332–351. [Google Scholar] [CrossRef]
  11. Long, M.E.; Swofford, R.L.; Albrecht, A.C. Thermal Lens Technique: A New Method of Absorption Spectroscopy. Science 1976, 191, 183–185. [Google Scholar] [CrossRef] [PubMed]
  12. Fang, H.L.; Swofford, R.L. The Thermal Lens in Absorption Spectroscopy. In Ultrasensitive Laser Spectroscopy; Kliger, D.S., Ed.; Academic Press: New York, NY, USA, 1983. [Google Scholar]
  13. Fang, H.L.; Swofford, R.L. Highly Excited Vibrational States of Molecules by Thermal Lensing Spectroscopy and the Local Mode Model. II. Normal, Branched, and Cycloalkanes. J. Phys. Chem. 1980, 73, 2607–2617. [Google Scholar] [CrossRef]
  14. Fang, H.L.; Meister, D.M.; Swofford, R.L. Overtone Spectroscopy of Nonequivalent Methyl C-H Oscillators. Influence of Conformation on Vibrational Overtone Energies. J. Phys. Chem. 1984, 88, 410–416. [Google Scholar] [CrossRef]
  15. Turner, J.S. Buoyancy Effects in Fluids; Cambridge University Press: Cambridge, UK, 1973. [Google Scholar]
  16. Jakeman, E.; Pike, E.R.; Vaughan, J.M. Observation of an Oscillating Hydrodynamic Mode in a Laser Scattering Experiment. RRE Newsl. Res. Rev. 1973. [Google Scholar]
  17. Anthore, R.; Flament, P.; Gouesbet, G.; Rhazi, M.; Weill, M.E. Interaction Between a Laser Beam and Some Liquid Media. Appl. Opt. 1982, 21, 2–4. [Google Scholar] [CrossRef]
  18. Meunier-Guttin-Cluzel, S.; Maheu, B.; Gouesbet, G. Combined Approaches and Characterizations of Experimental Chaotic Attractors in Thermal Lensing. Physica D 1992, 58, 423–440. [Google Scholar] [CrossRef]
  19. Gouesbet, G.; Lefort, E. Dynamical States and Bifurcations of a Thermal Lens Using Spectral Analysis. Phys. Rev. A 1988, 37, 4903–4915. [Google Scholar] [CrossRef]
  20. Weill, M.E.; Rhazi, M.; Gouesbet, G. Experimental Investigation of Oscillatory Phenomena Produced by a Hot Wire Located Near and Below a Free Surface. J. Phys. 1985, 46, 1501–1506. [Google Scholar] [CrossRef]
  21. Oakes, S.; Anderson, R.W.; Rapelji, A.; Gealy, M.W.; Ulness, D.J. Stable oscillations in laser-induced thermal plume—Surface interaction in several molecular liquids. Physica D, 2024; submitted. [Google Scholar]
  22. Schlichting, H. Boundary Layer Theory, 7th ed.; McGraw-Hill: New York, NY, USA, 1979. [Google Scholar]
  23. Rott, N. Unsteady Viscous Flow in the Vicinity of a Stagnation Point. Q. Appl. Math. 1956, 13, 444–451. [Google Scholar] [CrossRef]
  24. Butt, H.-J.; Graf, K.; Kappl, M. Physics and Chemistry of Interfaces, 2nd ed.; Wiley-VCH: Weinheim, Germany, 2006. [Google Scholar]
  25. ChatGPT 4.0. Available online: https://chatgpt.com/ (accessed on 1 May 2024).
  26. De Groot, S.R.; Mazur, P. Non-Equilibrium Thermodynamics; Dover Publications: New York, NY, USA, 1984. [Google Scholar]
  27. Giglio, M.; Vendramini, A. Thermal Lens Effect in a Binary Liquid Mixture: A New Effect. Appl. Phys. Lett. 1974, 25, 555–557. [Google Scholar] [CrossRef]
  28. Cabrera, H.; Sira, E.; Rahn, K.; García-Sucre, M. A Thermal Lens Model Including the Soret Effect. Appl. Phys. Lett. 2009, 94, 051103. [Google Scholar] [CrossRef]
  29. Polyakov, P.; Wiegand, S. Investigation of the Soret effect in aqueous and non-aqueous mixtures by the thermal lens technique. Phys. Chem. Chem. Phys. 2009, 11, 864–871. [Google Scholar] [CrossRef] [PubMed]
Figure 1. Schematic of the experimental configuration, highlighting the laser system and imaging components. The excitation beam is well collimated and is directed through a shutter, over the probe beam housing, and into the sample until finally it is blocked by a colored-glass filter. The probe laser is set to diverge, such that its beam size is approximately 1 cm in diameter when it reaches the sample. It largely passes through the colored-glass filter. A focusing lens reduces the size of the beam, such that it fits across the camera’s sensor chip. The green outline box shows a longitudinal view of the sample cuvette. The black dashed circle represents the viewing field of the probe beam. The blue represents the bulk liquid, and the gray represents the air above it. The surface is shown here as flat, but in real samples, there are menisci. The red/pink represents the thermal plume, which is warmer than the surrounding fluid.
Liquids 04 00041 g001
Figure 2. Various features of a heatmap colored such that dark indicates low signal intensity and light (yellow) represents high signal intensity. The meniscus appears rather large because of the lensing effect of its geometry in the cuvette. The thermal boundary layer is taken to be the boundary of the thermal lens. This appears as a bright (yellow) area in heatmap.
Liquids 04 00041 g002
Figure 3. Heatmap representations of the video data for the straight-chain alcohols (ordered from methanol through 1-undecanol as (ak) and colored such that dark indicates low signal intensity and light (yellow) represents high signal intensity). Methanol and ethanol exhibit rapid transient responses before the surface reaches a new equilibrium position. The same is true for 1-decanol and 1-undecanol, although their transient responses are slower. The remaining alcohols exhibit steady-state oscillation. For the cases of 1-propanol through 1-pentanol, there is a period of irregular oscillation and a period of stable steady-state oscillation [21]. 1-hexanol and 1-hepanol show only irregular oscillation. 1-octanol undergoes a transient response that transitions into a frequency-doubled steady-state oscillation. The steady-state oscillation in 1-nonanol is nearly unnoticeable. In addition to surface oscillation, there is an oscillation of the thermal boundary layer, suggesting a resistance to mechanical thermal mixing.
Liquids 04 00041 g003
Figure 4. Fourier transforms of the surface displacement versus time for the heatmaps shown in Figure 3 (ordered from methanol through 1-undecanol as (ak)). Methanol and ethanol do not show peaks (aside from a residual DC peak). 1-decanol and 1-undecanol show broad peaks arising from their transient responses. Those alcohols that exhibit steady-state oscillation show more peaks, which appear as overtones of a fundamental peak. This is particularly true for 1-propanol through 1 pentanol, which exhibit stable steady-state oscillation. The spectra for 1-hexanol and 1-hepatanol show weaker overtone peaks, although there remains significant energy in the first overtone. Finally, a sharp first overtone peak appears for 1-octanol. It is the strongest peak aside from a residual DC peak.
Liquids 04 00041 g004
Figure 5. Decomposition of the Fourier transform for 1-propanol. The left graph shows the complete Fourier transform (the same as shown in Figure 4c). The middle panel shows the Fourier transform of the transient and irregular oscillation domains. This spectrum is rather noisy compared to the case graphed on the right, which shows the Fourier transform of the stable steady-state domain. For these domains, the spectra show cleanly pronounced peaks at the harmonics [21].
Liquids 04 00041 g005
Figure 6. Frequency values of the two peaks with similar frequency for the alcohols exhibiting fundamental peaks in their Fourier transforms shown in Figure 4. For methanol through 1-pentanol, the frequency position of the fundamental peaks is shown as a solid black circle. Then, the second peak arises from 1-hexanol onward; the peak that follows the linear trend is also plotted as a solid black circle. The second peak shifts to a lower frequency more softly, and each datum is marked as a black X. Error bars represent the resolution of the Fourier transform.
Liquids 04 00041 g006
Figure 7. Heatmaps for binary mixtures of 1-undecanol and methanol (the heatmaps for the neat compounds are found in Figure 3). The mole fractions are X un = 0.75 (left panel), X un = 0.50 (middle panel), and X un = 0.25 (right panel). The introduction of methanol into 1-undecanol shifts the viscosity to values near those of the neat alcohols that oscillate.
Liquids 04 00041 g007
Figure 8. Heatmaps for binary mixtures of 1-butanol and methanol. The mole fractions are X but = 0.60 (left panel), X but = 0.40 (right panel). The heatmaps for the neat compounds are found in Figure 3.
Liquids 04 00041 g008
Disclaimer/Publisher’s Note: The statements, opinions and data contained in all publications are solely those of the individual author(s) and contributor(s) and not of MDPI and/or the editor(s). MDPI and/or the editor(s) disclaim responsibility for any injury to people or property resulting from any ideas, methods, instructions or products referred to in the content.